 Julia E. Kelso
 Michelle A. Baker
- 1Oak Ridge Institute of Science and Education, Washington, DC, United States
- 2Department of Biology and the Ecology Center, Utah State University, Logan, UT, United States
Terrestrially derived organic matter (OM) is known to dominate the OM pool in reference watersheds. Urban watersheds are known to receive large OM loads compared to reference watersheds, but the proportion of terrestrial, autochthonous, and anthropogenic (e.g., wastewater effluent) sources of OM in urban watersheds remains unknown. Organic matter was identified as a pollutant of concern in the Jordan River, an urban river in the Salt Lake Basin, U.S.A. Our objective was to identify autochthonous, terrestrial, and anthropogenic sources of three size-classes of OM to the Jordan River to inform OM reduction strategies within the watershed. Samples of coarse particulate OM (CPOM), fine particulate OM (FPOM), and dissolved OM (DOM) were analyzed for stable isotopes of carbon, nitrogen, and hydrogen. Stable isotope values of OM were used for Bayesian and graphical gradient-based mixing models to identify autochthonous, terrestrial, and anthropogenic sources. Fluorescent properties of DOM were also used to characterize the sources and composition of DOM. CPOM was primarily terrestrially derived with increased autochthonous inputs from macrophytes in warm months. FPOM was a mixture of terrestrial, autochthonous, and wastewater effluent throughout the year. DOM was primarily from wastewater effluent as well as DOM with isotope signatures unique to DOM from Utah Lake. Characterization of OM in urban rivers will help inform conceptual models of OM dynamics and load management in urban ecosystems.
Introduction
Rivers and streams are hotspots of organic matter (OM) transport and transformation (McClain et al., 2003; Battin et al., 2008). By storing, transporting, and transforming OM, rivers provide important ecosystem services, such as nutrient retention and removal, which maintain water quality, and ecological integrity of downstream aquatic ecosystems. For example, river networks can efficiently transform terrestrial inputs into biomass that is used as energy for higher trophic levels (Wallace et al., 1977; Kominoski and Rosemond, 2012), and store or mineralize terrestrial inputs which can mitigate excessive nutrients (Alexander et al., 2009; Kaushal et al., 2014) and sediment loads (Larsen and Harvey, 2017) to downstream waterbodies. However, the rate and mechanisms by which terrestrial OM transformation occurs in rivers is highly variable (Mineau et al., 2016), as is the contribution of instream primary production to OM in rivers (Kendall et al., 2007). Further, transformation dynamics between particulate OM (POM) and DOM remains unknown (Lambert et al., 2017). Therefore, it is extremely difficult to identify sources of OM to rivers, especially in urban watersheds.
Urbanization has altered river geomorphology, flow regimes, and biological community structure, potentially reducing river capacity to retain and transform OM (Meyer et al., 2005; Kominoski and Rosemond, 2012; Smith and Kaushal, 2015). Hydrologic connectivity among streets, storm drains, pipe networks, and ditches results in very high drainage densities (i.e., stream length per unit watershed area) in urban watersheds compared to natural watersheds (Baruch et al., 2018). As a result, OM loads to urban rivers are larger than forested watersheds (Kaushal and Belt, 2012). Increased nutrients and light in urban rivers may also increase autochthonous OM production (Bernot et al., 2010; Smith and Kaushal, 2015) which is more bioavailable than terrestrial sources of OM (Kaplan and Bott, 1989; del Giorgio and Pace, 2008; Parr et al., 2015), and consequently stimulates microbial activity (Zimmerman and Canuel, 2000) which exacerbates eutrophication. Urban OM loads may also include less studied anthropogenically derived OM sources from impervious surface and lawn runoff (Edmonds and Grimm, 2011; Hosen et al., 2014) that include petrochemicals and surfactants in unknown quantities (Griffith et al., 2009; McElmurry et al., 2013).
One well-known source of anthropogenically derived OM in urban rivers is effluent from wastewater treatment plants (WWTPs). Effluent has been studied for decades (Gücker et al., 2006), but the relative magnitude of effluent as a source of OM, and the ecological and biogeochemical consequences of wastewater derived OM to downstream waters historically were ignored (Wassenaar et al., 2010). It is difficult to trace and quantify the downstream biological impact of a single WWTP for two reasons. First, OM from WWTPs is likely labile compared to terrestrial OM (Westerhoff and Anning, 2000; Figueroa-Nieves et al., 2014) and effluent is associated with high inorganic nutrient concentrations (Pennino et al., 2016). Therefore, labile OM from WWTPs may be rapidly transformed. Further, inorganic nutrients from effluent may spur primary production and microbial activity, which could increase the proportion of autochthonously derived OM in reaches downstream of WWTPs. Variability in the type, age, and maintenance of sanitary infrastructure in urban watersheds, for example septic tanks vs. sanitary sewers, and the diversity of stormwater infrastructure that is combined with sanitary infrastructure, can complicate understanding of downstream impacts of wastewater effluent in urban rivers (Wassenaar et al., 2010; Smith and Kaushal, 2015; Smith et al., 2017).
More research is needed to characterize anthropogenically derived OM (Hansen et al., 2016) and to quantify the proportion of autochthonous, terrestrial, and anthropogenic POM in rivers. A few studies have characterized the distinct nature of POM in human altered watersheds as more microbial or algal derived compared to reference watersheds which have more plant and soil derived POM (Newcomer et al., 2012; Lambert et al., 2017; Le Meur et al., 2017), but only one study directly sampled wastewater effluent POM (Duan et al., 2014) and the sources of more microbial POM in human altered watersheds remains unclear. Of studies that investigated sources of POM in urban watersheds, three have estimated the proportion of terrestrial and autochthonous, or anthropogenic, sources to riverine POM (Kendall et al., 2001; Gücker et al., 2011; Imberger et al., 2014). Autochthonous sources of POM were found to increase with greater watershed area, and represent at least half of POM in large rivers of the United States (drainage area >10,000 km2; Kendall et al., 2001). In small urban streams, POM was derived from both agricultural (15%) and WWTP (85%) sources (Gücker et al., 2011). Another urban study reported contributions of autochthonous sources ranged from 20 to 50% and the remainder was terrestrial (Imberger et al., 2014). While informative, these studies were based on carbon and nitrogen isotope mixing models with endmember δ13C values that often overlapped, decreasing the precision of mixing models that partition sources of OM (Fry, 2006).
DOM sources to rivers, or its proxy DOC, have been studied extensively, but the proportions of autochthonous, terrestrial, and anthropogenic sources of DOM in urban rivers remain unknown. There is evidence that DOC in reference watersheds is dominated by terrestrial sources (Palmer et al., 2001; Hood et al., 2005; Cartwright, 2010; Wilkinson et al., 2013) while urban watersheds have an unknown proportion of labile (Hosen et al., 2014; Imberger et al., 2014), recently derived (Williams et al., 2016), and autochthonous DOM sources (Parr et al., 2015). Several studies have reported proportions of terrestrial vs. autochthonous DOM in lakes, with autochthonous sources ranging from 0 to 20% (Kritzberg et al., 2004; Bade et al., 2007; Ostapenia et al., 2009; Wilkinson et al., 2013), but we know of no studies that have reported proportional estimates of autochthonous, terrestrial and anthropogenic sources in rivers.
We hypothesized autochthonous, terrestrial, and anthropogenic sources of OM could be differentiated through the natural abundance of three stable isotope tracers: carbon, nitrogen, and hydrogen. Several studies have used carbon and nitrogen stable isotopes to characterize OM as primarily autochthonously or terrestrially derived for POM (Kendall et al., 2007; Newcomer et al., 2012; Duan et al., 2014; Imberger et al., 2014) and DOM (Duan et al., 2014), but we know of no other studies to use all three isotopes for three size classes. Additionally, carbon isotope values of terrestrial and autochthonous endmembers typically were not significantly different (Kendall et al., 2007; Newcomer et al., 2012; Imberger et al., 2014) which weakens the robustness of proportional estimates derived from endmember mixing models (Cloern et al., 2002; Doucett et al., 2007; Wilkinson et al., 2013). Large differences in δ2H values of autochthonous and terrestrial OM were historically recognized (Doucett et al., 2007), but contamination of δ2H OM values by ambient water vapor δ2H values during combustion prevented confident interpretation of δ2H values for OM samples. Fortunately, a bench top equilibration method was developed to standardize and correct for exchangeable δ2H values (i.e., water vapor contamination) during elemental analysis of bulk OM (i.e., exchangeable H + non-exchangeable H; Wassenaar and Hobson, 2000). Since the advent of the bench top equilibrium method a few studies have used δ2H values to characterize autochthonous and terrestrial sources of OM (Wilkinson et al., 2013; Gudasz et al., 2017) in lakes surrounded by natural land uses, but no studies have used δ2H of OM in rivers, or in heavily disturbed ecosystems.
Our objective was to identify seasonal sources of OM to an urban river and estimate the proportional contributions of each source unique to coarse POM (CPOM, >1 mm), fine POM (FPOM, 1 mm−0.7 μm), and DOM (<0.7 μm). CPOM, FPOM, and DOM were collected throughout the year in the Jordan River, an urban river in the Great Salt Lake Basin, Utah, U.S.A. (Figure 1). Stable isotope values of the three size classes of OM and all potential sources were used in a Bayesian inference endmember mixing model to estimate the proportional contributions of each source. We expected the natural abundance of three stable isotopes of POM sources, or the combined use of stable isotopes and optical properties of DOM could differentiate wastewater effluent from autochthonous and terrestrial OM sources.
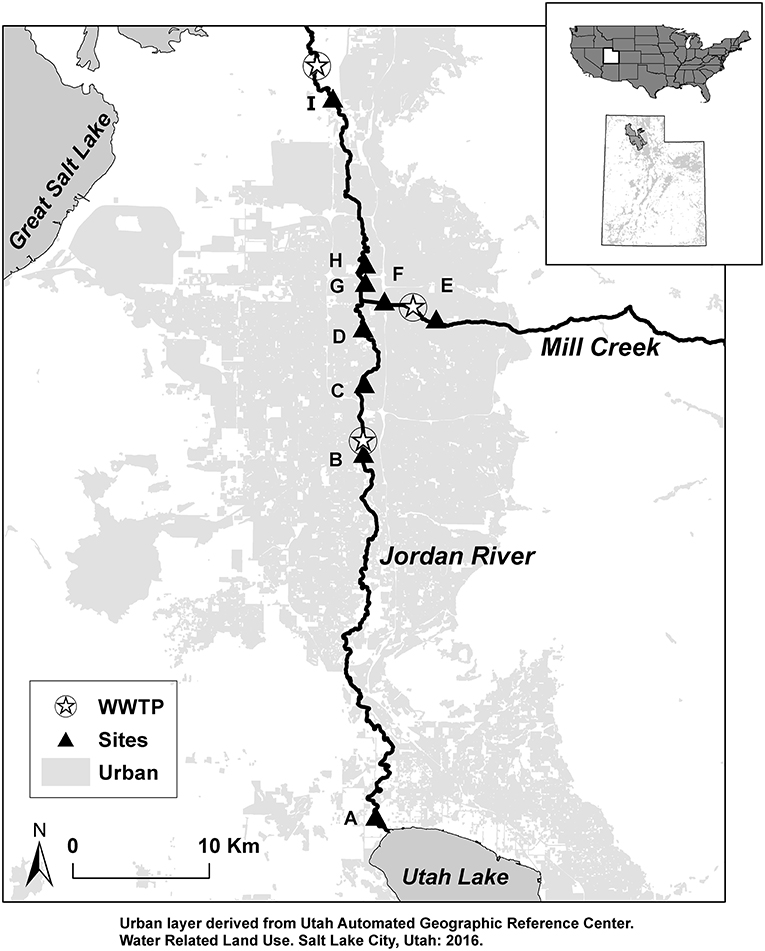
Figure 1. Study sites (A–I) and wastewater treatment plants (WWTP) located along the Jordan River from Utah Lake to terminus the Great Salt Lake. Light gray represents urban land-cover.
Materials and Methods
Study Sites
The Jordan River begins at Utah Lake, a shallow, eutrophic lake in the southern portion of the Great Salt Lake Basin. The river flows north 82 km where it terminates in wetlands that connect to the Great Salt Lake. Utah Lake receives water from the Provo River, Spanish Fork River, and American Fork River as well as wastewater effluent from six WWTPs in these drainages (PSOMAS Consulting, 2009). Three WWTPs discharge effluent into the Jordan River and are located 22, 37, and 50 km downstream from Utah Lake (Figure 1). Discharge from Utah Lake to the Jordan River is regulated for irrigation and flood control in the Salt Lake metropolitan area; average daily discharge has ranged from 0.05 to 8.9 m3 s−1 since 1985 (Hooten, 2011; Cirrus Ecological Solutions, 2012). Depth ranges from 0.57 to 1 m, width ranges from 16 to 39 m, and the dominant substrate is gravel in the upper reaches and fine sediments in lower reaches (Epstein et al., 2016).
Sampling Regime
Three size-classes of OM were collected at nine sites. Sites locations were chosen to capture the influence of Utah Lake (Site A, Figure 1), wastewater treatment plants (B, C, E, F), a major tributary, Mill Creek (D, G), and a surplus canal which diverts over half of river discharge just above site H (Epstein et al., 2016). The most downstream site (I) was chosen based on a compliance point location identified by the state of Utah and is the beginning of a transition zone from river geomorphology to wetland complexes associated with the Great Salt Lake. See Epstein et al. (2016) for more detailed site descriptions. CPOM, FPOM, and DOM were collected in April, July, September, and November of 2014, and December of 2015 for δ13C, δ15N, and δ2H stable isotope analysis. We collected OM in April and July to characterize OM before and after snowmelt-runoff which typically occurs in mid-June. OM was collected in September, November, and December to characterize OM before and after leaf senescence in October. We also collected river water for deuterium (δ2H-water) and carbon isotopes of DIC (δ13C-DIC) at the same time as OM (but DIC was not collected in December 2015).
CPOM Sampling
CPOM was sampled at each site using bedload samplers based on the Helley-Smith bedload sampler design (Helley and Smith, 1971). One-mm mesh nets were attached to the bottom and top of a steel pole. The nets were held perpendicular to flow for 6 min to collect CPOM in transit along the bottom and surface of the Jordan River. CPOM was rinsed from the nets into plastic trays, then macroinvertebrates, fish, and garbage were removed, and the samples were stored on ice in plastic bags until returned to the laboratory where they were stored frozen until further processing. CPOM samples were then dried, ground and analyzed for δ13C, δ15N, and δ2H. CPOM samples were collected in nine different months of 2013 and were combined with previously collected samples collected in 2014 and 2015 from the same month (Epstein et al., 2016). Fall included samples collected in November and September, winter included February and December, spring included April and May, and summer included June, July, and August.
FPOM Sampling
Two, 1-l polyethylene bottles at each site were collected for both FPOM and DOM analysis. Grab samples were transported on ice back to the laboratory for filtering. FPOM for δ13C and δ15N isotope analysis was collected on 25 mm diameter glass fiber filters of 0.7 μm pore size (Whatman GF/F, Maidstone, UK). Filters were dried at 50°C, rewet with deionized water, and acidified by fumigation in a desiccator with 25% HCl for 6 h (Brodie et al., 2011). FPOM for δ2H isotope analysis was collected on 0.45 μm nylon filters (Whatman polyamide membrane filters, Maidstone, UK) then backwashed into deionized water, and dehydrated at 50°C in a drying oven (Wilkinson et al., 2013). The remaining solid was scraped from glass dishes and sent for δ2H isotope analyses.
DOM Sampling
The filtrate that resulted from FPOM collection on 0.7 μm glass fiber filters (Whatman GF/F, Maidstone, UK) was used for DOM isotope analysis. One liter was acidified to pH 2.5–3 with concentrated HCl to remove inorganic carbon. Acidified DOM was then evaporated in 8-inch diameter glass dishes at 50°C, residue was scraped from plates (Wilkinson et al., 2013), and stored in scintillation vials for analysis of δ13C and δ15N isotopes. DOM from November 2014 and December 2015 was freeze dried because several acidified DOM samples congealed after dehydration and were not suitable for isotope analysis. The other liter of non-acidified DOM was dehydrated as described above, and residue was sent for δ2H isotope analysis.
OM Source Sampling
Five endmember categories were evaluated as possible sources for each size class of OM: terrestrial, autochthonous, benthic organic matter (BOM), wastewater effluent, and OM from Utah Lake. For terrestrial and autochthonous sources, 1–2 samples of each source were collected from each site and dried at 50°C for stable isotope analysis. Terrestrial sources included riparian vegetation as leaf-litter (senesced), tree leaves (not senesced), and Phragmites. Autochthonous sources included macrophytes, biofilm, and algae. Macrophytes were cut from large submerged aquatic vegetation anchored to the benthic sediment. Biofilm was scraped from benthic rocks, and algae were collected from green mats floating on the water surface. Autochthonous sources were transported back to the laboratory, rinsed with DI water, and large macroinvertebrates (>1 mm) were removed. BOM was collected by sinking a stove-pipe 5–10 cm into the benthic sediment, agitating with a meter stick, then a 100 mL sample of the suspended BOM was collected and stored in coolers for transport to the laboratory for filtering. Endmembers for OM derived from WWTP effluent were collected from effluent discharged into Mill Creek ca. 2 km upstream from its confluence with the Jordan River (Figure 1). WWTP endmember samples (hereafter WWTP-CPOM, WWTP-FPOM, WWTP-DOM) were collected concurrently with seasonal samples of FPOM and DOM. We expected OM from Utah Lake (Lake-CPOM, Lake-FPOM, Lake-DOM) to have a distinct isotope signature compared to other sources due to a combination of factors including a longer water residence time and high primary production compared to the river, as well as the influence of six WWTP in streams that terminate in Utah Lake (Cirrus Ecological Solutions, 2012). Lake OM was collected in a large depositional area directly below the Utah Lake pumping station, at the head of the Jordan River.
Stable Isotope Analysis
All dried CPOM samples were ground in a coffee bean grinder prior to weighing and encapsulation for isotope analysis. Samples on filters and DOM were weighed and directly encapsulated without grinding. Acidified OM samples were packed in silver and non-acidified samples were packed in tin capsules. Samples for δ13C and δ15N analysis were sent to the Stable Isotope Facility (SIF) at University of California, Davis on a PDZ Europa ANCA-GSL elemental analyzer interfaced to a PDZ Europa 20–20 isotope ratio mass spectrometer (Sercon Ltd., Cheshire, UK) with a long term standard deviation of 0.2%0 for 13C and 0.3%0 15N. Deuterium analysis was conducted at the Colorado Plateau Stable Isotope Laboratory at Northern Arizona University. Samples were pyrolyzed to H2 gas following the procedures of Doucett et al. (2007) and analyzed on a Thermo-Finnigan TC/EA and DeltaPLUS-XL (Thermo Electron Corporation, Bremen, Germany; precision 2%0). The δ13C of DIC was obtained by filling helium-flushed, 12 mL exetainer vials with 1 mL of 85% phosphoric acid and 4 mL of filtered river water (Taipale and Sonninen, 2009). DIC samples were analyzed at SIF using a GasBench II system interfaced to a Delta V Plus IRMS (Thermo Scientific, Bremen, Germany) with a long term standard deviation of 0.1%0. River water was analyzed for δ2H (precision 2%0) and δ18O (precision 1%0) isotopes at the Utah State University Stable Isotope Lab. Water samples were run using a GasBench II with GC PAL auto-sampler interfaced to a Delta V Plus IRMS (Thermo Scientific, Bremen, Germany; precision 2%0 2H and 1%0 18O).
Isotope Mixing Models
Two different isotope mixing models were used, a Bayesian mixing model, and a graphical gradient-based mixing model. The Stable Isotope Mixing Model in R package (SIMMR) provided a Bayesian inference mixing model designed to estimate the proportional contribution of sources to a mixture (Parnell, 2016). SIMMR can incorporate variability of end-members into the model and estimate source contributions to a mixture regardless of the number of isotope tracers (Parnell et al., 2013). CPOM samples were grouped by season for analysis; FPOM and DOM were grouped by month for analysis.
SIMMR was first run for each OM size-class, CPOM, FPOM, and DOM, using all potential sources (13 total). The high density intervals (HDI) of estimated source contribution were compared to identify significant sources to OM. Estimated values within the HDI have higher probability density than values outside the HDI and the total probability of values within the 95% HDI is 95% (Kruschke, 2018). Within the 95% HDI, a 75% HDI was delimited to convey skewness of the 95% HDI, and further constrain the most credible contribution estimates. Similar to the 95% HDI, values within the 75% HDI are more probable than outside the 75% HDI.
Sources were excluded from subsequent mixing models for two reasons. First, if the 75% HDI of feasible solutions was <10%, the source was considered too small a contributor and was excluded from subsequent models. Second, if the 75% HDI of feasible solutions estimated a contribution <60% of OM, isotope values were considered too variable, and the source was excluded. Sequential models were run and sources were excluded until a model with four or less sources was resolved. We used three isotope tracers (δ13C, δ15N, δ2H) to estimate source contributions to CPOM and FPOM, but only δ13C and δ2H isotopes were used in the DOM mixing model since δ15N values of DOM included nitrate. While SIMMR can estimate any number of sources, we constrained our CPOM and FPOM models to four sources since we had three isotope tracers and models for DOM were constrained to three sources since we had only two isotope tracers.
In addition to the Bayesian mixing model, a graphical, gradient-based mixing model was used to partition FPOM and DOM sources as either terrestrial or autochthonous (Mohamed and Taylor, 2009; Rasmussen, 2010; Wilkinson et al., 2013). If OM was primarily derived from terrestrial inputs, δ13C-OM or δ2H-OM would not vary systematically with δ13C-DIC or δ2H-water, and yield a flat line with a y-intercept at the average δ13C or δ2H terrestrial isotope values. If OM was primarily derived from autochthonous production, the δ13C and δ2H values would vary linearly with aqueous δ13C-DIC or δ2H-water values (Wilkinson et al., 2013). A gradient-based mixing model was not used to identify sources of CPOM because δ13C-DIC and δ2H-water were not collected simultaneously with all CPOM samples.
Water Quality Metrics
DOC, total dissolved nitrogen (TDN), and Chlorophyll a (Chla) were collected in April, July, September, November, and December along with OM samples. DOC and TDN samples were filtered through 0.7 μm glass fiber filters into 40 mL amber vials and acidified with HCl to a pH of 2.5 for storage until carbon analysis. Acidified DOC and TDN samples were run on a Shimadzu TOC-L analyzer via catalytic oxidation combustion at 720°C (DOC MDL 0.2 mg L−1, TDN MDL 0.1 mg L−1; Shimadzu Corp., Kyoto, Japan). Chla was collected on glass fiber filters, in-stream, with a drill-pump (Kelso and Baker, 2015), wrapped in foil, frozen, and subsequently analyzed on a Turner handheld fluorometer (Turner Designs, Sunnyvale, CA; MDL 0.1 mg L−1) following Steinman et al. (2007).
DOM Spectroscopic Indices
Six fluorescence indices were calculated from excitation emission matrices (EEMs) which were produced on a Horiba Aqualog spectrofluorometer (Horiba Scientific, Edison, New Jersey) from DOC samples that were not acidified. EEMs were collected over excitation (ex) wavelengths 248–830 nm at 6 nm increments and over emissions (em) 249.4–827.7 nm at 4.7 nm (8 pixel) increments. All samples were collected in ratio mode (S/R) and run at an integration time resulting in a maximum emission intensity of 5,000–50,000 counts per second, typically 0.25–1 s. Samples that exceeded 0.3 absorbance units at ex 254 nm were diluted with deionized water. All samples were corrected for inner filter effects, Rayleigh scatter, and blank subtracted in MATLAB™ (version 6.9; MathWorks, Natick, Massachusetts) as described in Murphy et al. (2013).
The fluorescence index (FI), Yeomin fluorescence index (YFI), freshness index (BIX), humification index (HIX), peak T to peak C ratio (TC), and SUVA254 were calculated from corrected EEMs in MATLAB™. The FI was calculated at ex 370 nm as the ratio of em intensities at 470 and 520 nm (Cory and McKnight, 2005). The YFI was calculated as the average intensity over em 350–400 nm divided by the average intensity over em 400–500 nm at ex 280 nm (Heo et al., 2016). YFI was calculated in addition to the FI because the YFI can better differentiate fluorophore precursor materials than the FI, and it is less sensitive to concentration-dependent effects (Heo et al., 2016). For example, the YFI has a wide index range for fulvic, humic, aminosugar-like, and protein-like fluorophores (0.30–6.41), the last two of which are prevalent in WWTP effluent. In contrast, the FI has a narrower index range (0.82–2.14), and cannot distinguish between protein-like and aminosugar-like standards (Heo et al., 2016). The β:α index (BIX), also called the freshness index, was calculated as the intensity at ex 380 nm divided by the max intensity between em 420 and 435 nm, where higher values represent more recently derived DOM (Parlanti et al., 2000). The HIX was calculated at ex 254 nm as the area under em 435–480 divided by the area under em 300–450 + 435–480 nm; higher HIX values represent more humic-like material (Zsolnay et al., 1999). The TC index is the ratio of maximum fluorescence in the peak T region (protein-like) vs. peak C region (humic-like) with higher values representing more protein-like DOM, which are also associated with WWTP effluent (Baker, 2001). TC was calculated as the ratio of maximum fluorescence at ex 275/em 350 nm to max intensity within ex 320–340 nm/em 410–430 nm (Gabor et al., 2014). SUVA254, an indicator of aromaticity, was calculated from DOM absorbance at 254 nm normalized by DOC concentration (Weishaar et al., 2003). Nitrate and iron interferences with fluorescence and absorbance indices were ruled out following Weishaar et al. (2003) given iron concentrations were <1 mg L−1 and nitrate concentrations were <40 mg L−1 (maximum 20.4 mg L−1 TDN this study, maximum + NO3-N 8 mg L−1).
Spectroscopic indices were correlated to water quality metrics with all months combined. Correlations were conducted with the GGally package in R (Schloerke et al., 2014). Correlations were considered significant when correlation coefficients were >0.35 (Rholf and Sokal, 1995).
Results
Source Isotope Values
Autochthonous, Terrestrial, and Anthropogenic
Deuterium was the only isotope that sufficiently separated autochthonous and terrestrial sources (Figure 2). Biofilm, algae, and macrophytes had the most negative δ2H values (mean −222.6%0, SD 35.9; Table 1). WWTP-FPOM, WWTP-DOM, and Lake-DOM had the most positive δ2H values (Figure 2). All other sources had average δ2H values between −150 and −200%0. Average δ15N for all sources were between 5 and 10%0 (Table 1, Supplementary Material) except for WWTP-DOM which had more positive values (29.4 δ15N%0) because it included enriched WWTP-derived nitrate (Kendall et al., 2007; Piñón-Gimate et al., 2009; Duan et al., 2014). Average δ13C values from autochthonous sources overlapped the range of terrestrial δ13C values, again highlighting that only δ2H isotopes may be able to differentiate between autochthonous and terrestrial sources (Table 1, Supplementary Material).
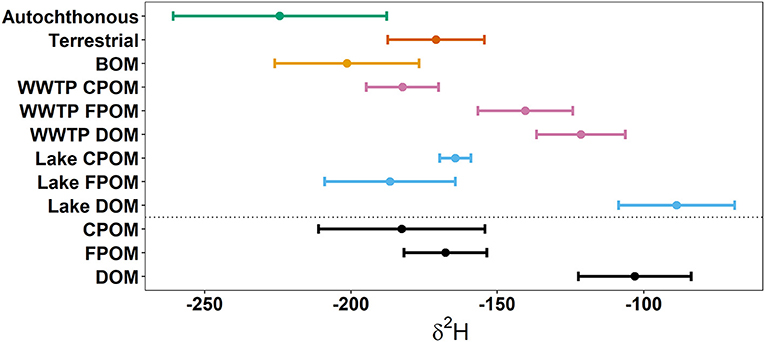
Figure 2. Above the dotted line are average δ2H values of potential sources. Below the dotted are average δ2H values of three size-classes of organic matter. Dots represent the means and whiskers are 1 standard deviation. Autochthonous sources were the average of macrophytes, biofilms, and algae. Terrestrial sources were the average of senesced leaf-litter, living tree-leaves, and Phragmites (Table 1).
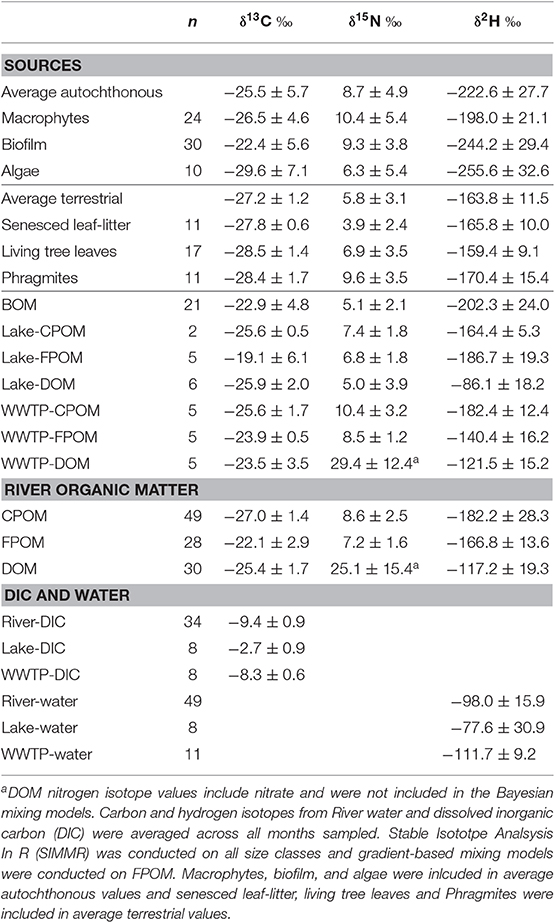
Table 1. Carbon, nitrogen, and hydrogen isotope mean and standard deviation for potential sources of Jordan River organic matter (OM) including, autochhtonous and terrestrial sources, OM sources from Utah Lake and WWTP effluent, and average isotope values for each size-class of Jordan River OM.
Leaf-Litter vs. Tree Leaves
Carbon and hydrogen isotope values were similar between leaf-litter and tree leaf sources (Table 1). Therefore, if SIMMR did not distinguish sources depending on the δ15N isotope value of an OM size class, as was the case with FPOM and DOM, these leaf sources were averaged together and modeled as one terrestrial source (Litter + TreeLeaves). However, because leaf-litter had lower δ15N values (mean 3.9, SD 2.4%0) compared to living tree leaves (mean 6.9, SD 3.5%0), SIMMR could distinguish leaf-litter as a source depending on season for CPOM, but not FPOM and DOM (see below). For example, average FPOM δ15N values were similar in November (mean 5.2, SD 0.3%0) compared to FPOM δ15N values July (7.3, SD 0.6%0). Whereas, CPOM δ15N values were lower in September (6.0, SD 0.3%0) and November (5.1, SD 0.7%0) compared to CPOM δ15N values in June (18.8, SD 0.1%0), July (8.8, SD 1.6%0), and August (9.8, SD 1.6%0).
CPOM Sources
Bayesian Model
Out of thirteen possible OM sources, six were considered too small a proportion to accurately estimate the proportional contribution to CPOM (algae, BOM, Lake-FPOM, Lake-DOM, WWTP-FPOM, WWTP-DOM) and four were considered too variable (living tree leaves, Phragmites, Lake-CPOM, WWTP CPOM; Table 2). Therefore, three possible sources of CPOM were identified: biofilms, macrophytes, and leaf-litter. Leaf-litter always represented the greatest feasible proportion of CPOM, except in summer when leaf-litter and macrophyte contributions were roughly equal (Figure 3). Macrophytes were the second most likely source of CPOM; contributions ranged from 4 to 38% in fall, then proportions increased in winter and spring, and the greatest proportions were in summer (15–64%). Biofilm was the least likely source of CPOM with greater contributions estimated in spring (3–34%) and summer (5–26%) compared to fall (2–12%) and winter (2–21%).
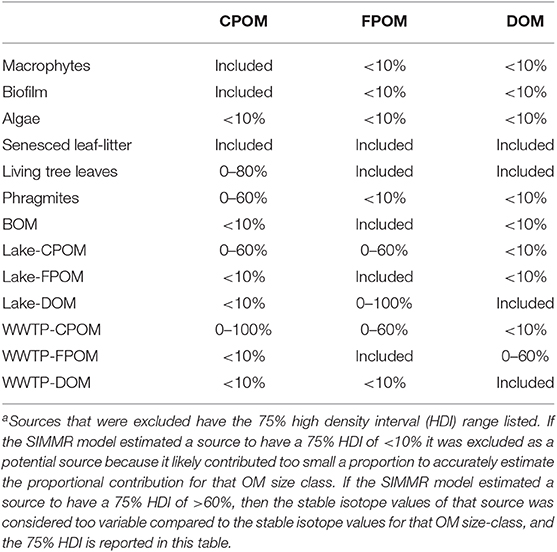
Table 2. Sources that were included and excluded for each OM size-class SIMMR model.
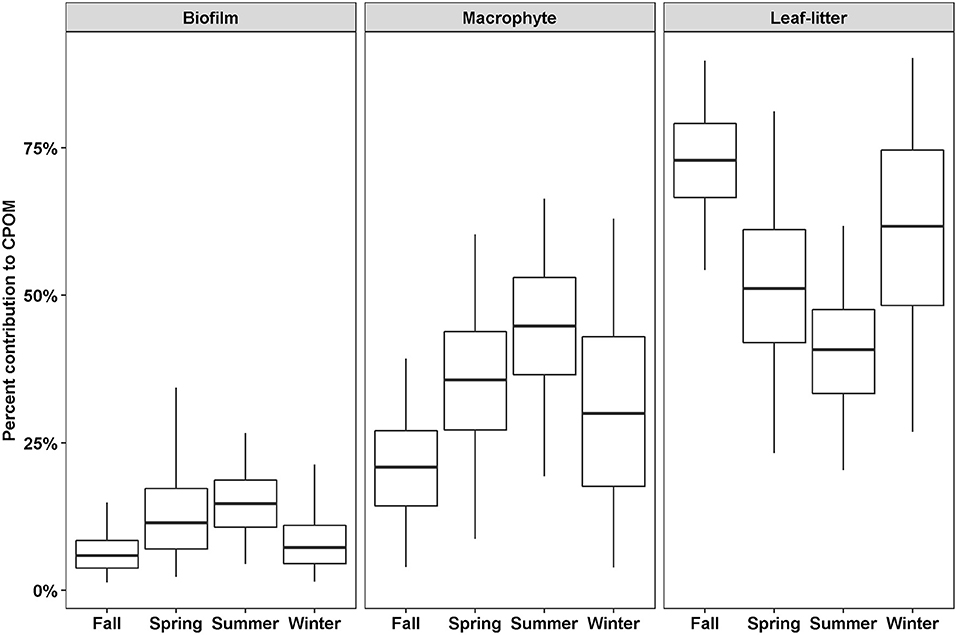
Figure 3. The percent feasible contributions to CPOM for three sources depending on season. Contributions were estimated using SIMMR with three isotope tracers, δ13C, δ15N, and δ2H. Boxes represent the median and interquartile range; whiskers represent 2.5 and 97.5 percentiles.
FPOM Sources
Bayesian Model
Out of 13 possible OM sources, five were considered too small a proportion to accurately estimate the proportional contribution to FPOM (macrophytes, biofilm, algae, Phragmites, WWTP-DOM) and three were considered too variable (Lake-CPOM, Lake-DOM, WWTP CPOM; Table 2). Therefore, four potential sources of FPOM were identified by SIMMR, including BOM, Lake-FPOM, Litter + TreeLeaves and WWTP-FPOM. BOM and Lake-FPOM had greater feasible proportions in July and September, than November and December, ranging from 9 to 82% in July and 8 to 58% in September (Figure 4). Litter + TreeLeaves increased from July to December with median percent contributions of 12% in July and 53% in December. WWTP-FPOM was greatest in September and November, and ranged from 16 to 69% over both months. In summary, terrestrial sources of FPOM increased in autumn, with possible autochthonous contributions from Lake-FPOM in July and September, and increased sources from WWTP-FPOM in September and November.
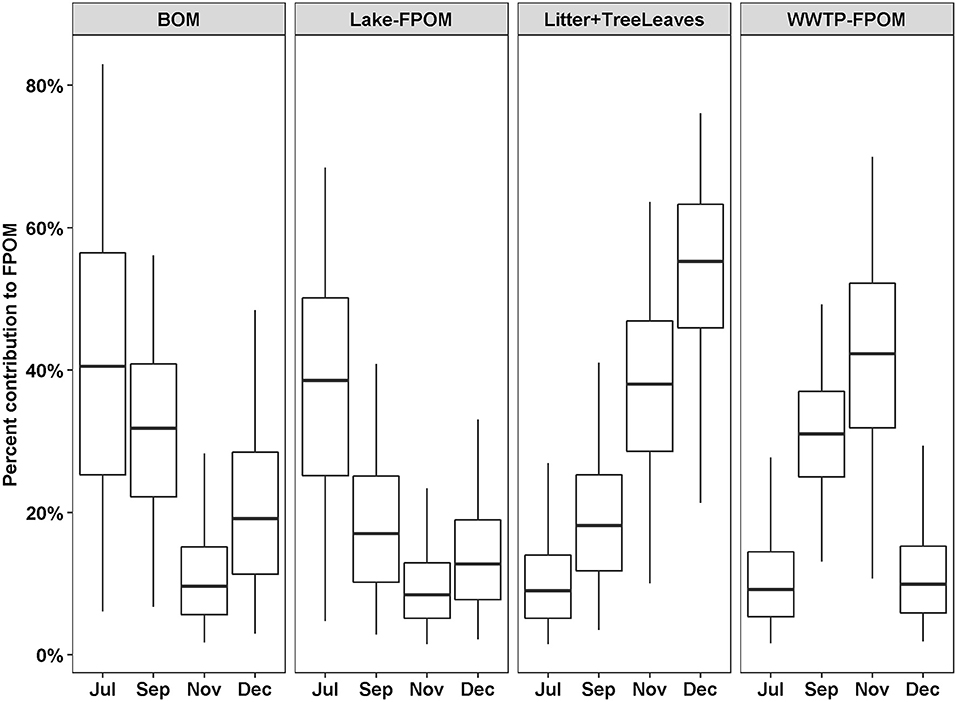
Figure 4. Percent feasible contributions to FPOM from four sources depending on the month. Contributions were estimated using SIMMR with three isotope tracers, δ13C, δ15N, and δ2H. Boxes represent the median and interquartile range; whiskers represent 2.5 and 97.5 percentiles.
Gradient Model
If FPOM was derived from 100% autochthonous sources, we expected δ2H-FPOM and δ13C-FPOM values to have a positive relationship with δ2H-water and δ13C-DIC. Lake samples were excluded from δ13C gradient models because Lake DIC-δ13C values were extremely positive compared to all other OM (Figure 5). There were no significant linear relationships between δ2H-FPOM and δ2H-water within months, or among all months combined (Figure 5A, Table 3). FPOM δ2H values averaged −166.3 %0 (SD 13.6) which was similar to average terrestrial sources (−163.8%0, SD 11.5). WWTP-FPOM had δ2H-FPOM values (mean −140%0, SD 16.2) that were more positive than terrestrial δ2H values (Figure 5A). Several FPOM samples from July had lower δ2H values than terrestrial sources, suggesting autochthonous contributions to FPOM in July. November δ13C-FPOM and δ13C-DIC values had a positive relationship, and all other months were not significantly correlated (Figure 5B, Table 3). The results of both models indicated FPOM was primarily terrestrial in November and December with possible autochthonous contributions from Lake-FPOM and BOM in July, and increased contributions from WWTP-FPOM in September and November.
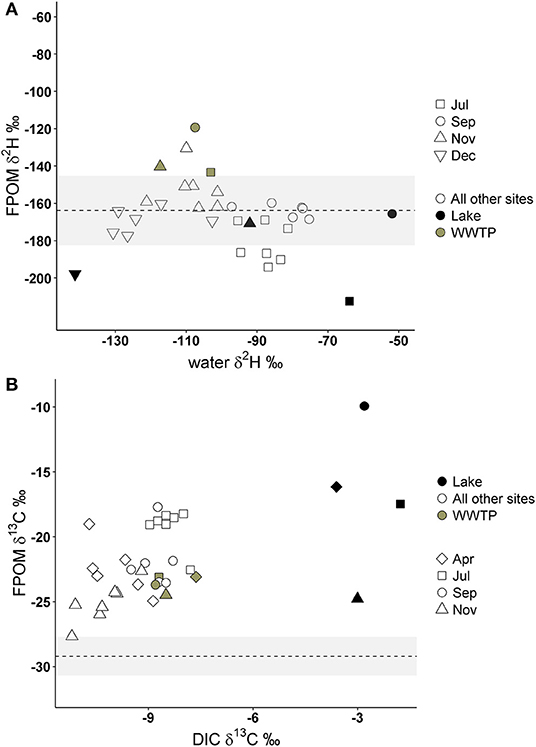
Figure 5. Deuterium values of FPOM compared to deuterium of Jordan River water (A) and FPOM δ13C values compared to δ13C of Jordan River dissolved inorganic carbon (DIC; B). The dashed lines and gray areas represent the average deuterium and carbon isotope values of terrestrial sources collected in this study (see Table 1). Gray circles represent FPOM collected from WWTP effluent, black circles from Utah Lake, and open circles are FPOM collected from all other sites.
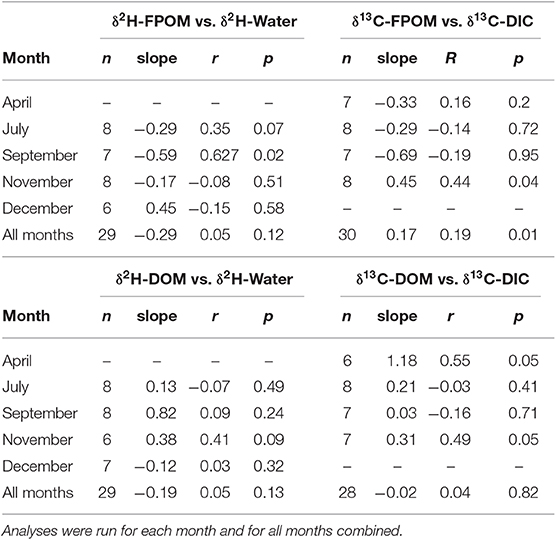
Table 3. Regressions results for graphical analysis of gradient based mixing models of FPOM (top) and DOM (bottom).
DOM Sources
Bayesian Model
Out of 13 possible OM sources, eight were considered too small a proportion to accurately estimate the proportional contribution to DOM (macrophytes, biofilm, algae, Phragmites, BOM, Lake-CPOM, Lake-FPOM, WWTP-CPOM) and WWTP-FPOM estimates were considered too variable to consider as a source (Table 2). Lake-DOM was the primary source of river DOM, with median contributions that ranged from 48 to 70% throughout the year (Figure 6). WWTP-DOM was the second most likely source of DOM, with median values ranging from 20 to 33% in all months. Litter + Tree leaves contributions were similar among July, November, and December (mean 11%, SD 7), but were greater in September (mean 29%, SD 10). Generally, SIMMR predicted average terrestrial contributions of 16%, anthropogenic contributions from WWTP-DOM were a minimum of ~20% throughout the year, and Lake-DOM was always the most likely DOM source.
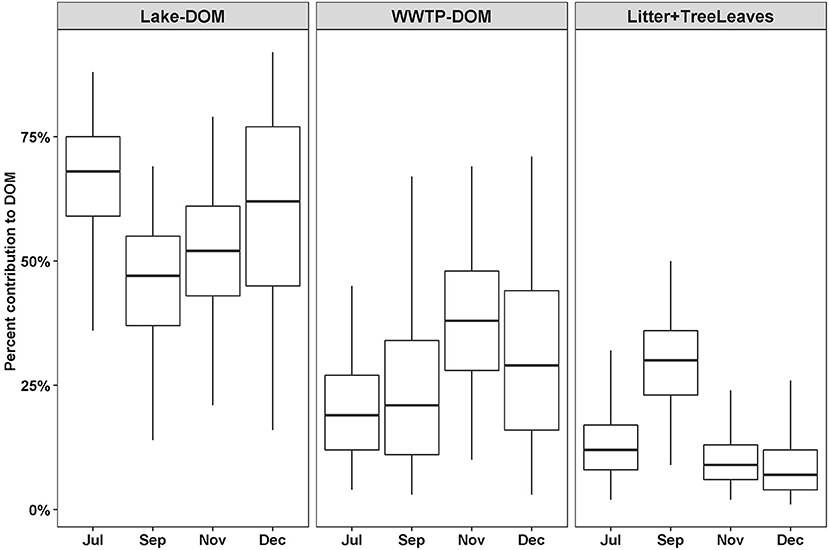
Figure 6. Percent feasible contributions to DOM from three sources depending on the month. Contributions were estimated using SIMMR with two isotope tracers, δ13C and δ2H. Boxes represent the median and interquartile range; whiskers represent 2.5 and 97.5 percentiles.
Gradient Model
If DOM was derived from 100% terrestrial sources, we expected no relationship between δ2H-DOM and δ13C-DOM vs. δ2H-water and δ13C-DIC, and a flat line near terrestrial values. All δ2H-DOM values were more positive (mean −103.6%0, SD 19.3) than average δ2H values of terrestrial sources (Figure 7), and there were no significant linear relationships between δ2H-DOM and δ2H-water (Table 3). There were positive relationships between δ13C-DOM and δ13C-DIC in April and November (Figure 7), but these relationships were dependent on WWTP-DOM values, which had more positive δ13C-DOM values than other sites in each month. Both models indicated Lake-DOM was a major source of DOM in the Jordan River, and DOM was neither autochthonous nor terrestrial but had major contributions from WWTPs throughout the year.
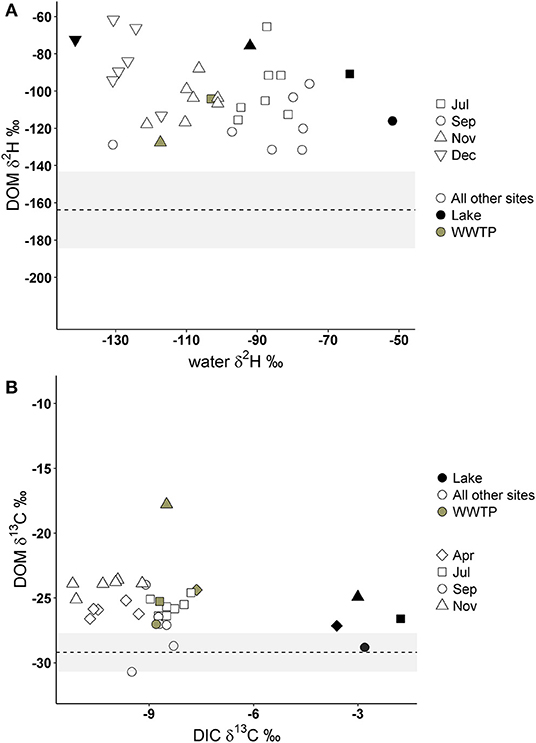
Figure 7. Deuterium values of DOM compared to δ2H-water (A) and δ13C-DOM compared to δ13C of dissolved inorganic carbon (DIC; B). The dashed lines and gray area represent the average δ2H and δ13C values of terrestrial sources collected in this study (see Table 1). Gray circles represent FPOM collected from WWTP effluent, black circles from Utah Lake, and open circles are FPOM collected from all other sites.
Fluorescence Indices and Water Quality
Correlations of spectroscopic indices and water quality metrics indicated DOM was microbially derived but not necessarily from autochthonous sources. Chla was negatively correlated with FI (r = −0.43) and YFI (r = −0.48) values (Figure 8). This negative relationship was driven by greater Chla concentrations and low FI/YFI values in July, compared to higher FI/YFI values and low Chla in November and December (Figure 8). DOC was positively correlated with FI (r = 0.51) and YFI (r = 0.45) values and negatively correlated with HIX (r = −0.28) and SUVA (r = −0.42). Therefore, samples with high DOC concentrations were more microbially derived, and less aromatic, than samples with low DOC concentrations. SUVA values were also significantly higher in September than all other months, indicating increased aromatic content of DOM (Figure 8). TC values were too variable to interpret as biologically significant, likely due to highly correlated Peak T and Peak C fluorescence intensities.
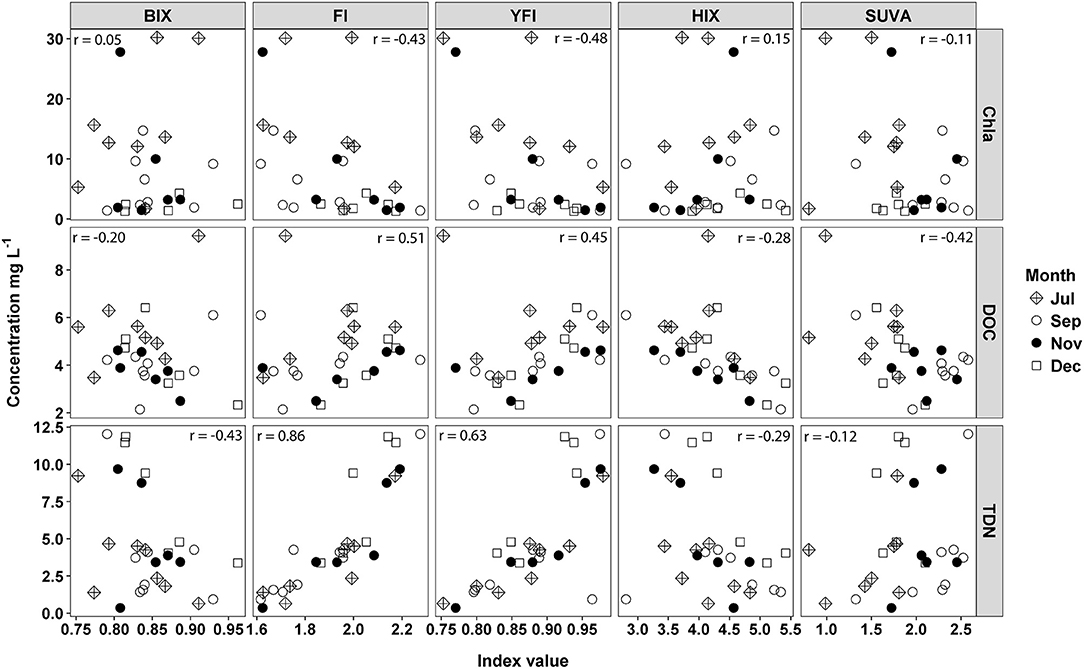
Figure 8. Water quality metrics, chlorphyll a (Chla), dissolved organic carbon (DOC), and total dissolved nitrogen (TDN), regressed against five fluorescence indices, freshness index (BIX), flourescence index (FI), Yoeman index (YFI), humification index (HIX), and SUVA254. Pearson correlations were run between indices and water quality metrics for all months combined.
Discussion
Sources of CPOM and FPOM Were Different and Varied Over Time
POM sources were consistent with previous OM studies in urban watersheds, which found POM was a mixture of sources, e.g., periphyton, leaves, and grass (Newcomer et al., 2012), had major contributions from WWTP effluent (Gücker et al., 2011; Duan et al., 2014), or had significant autochthonous contributions from algae and macrophytes (Imberger et al., 2014). Unlike previous studies we were able to identify microbially derived sources of POM distinct from autochthonous sources of POM and to our knowledge this is the first study to quantify the proportional contributions of wastewater effluent, autochthonous, and terrestrial sources of POM in an urban river. CPOM was primarily terrestrial with a greater proportion of macrophyte and biofilm sources in warm months and no sources linked to wastewater effluent. FPOM was composed of a mixture of terrestrial sources (leaf-litter and tree leaves), BOM, WWTP-FPOM, and autochthonous sources from Lake-FPOM. We acknowledge the possibility that fine clay and other minerals may have been included in stable isotope samples of BOM. However, mineral interference with BOM isotope values was likely minimal because of our sampling methodology, which collected BOM suspended in the water column after agitation of the benthic surface.
Lake-FPOM contributions were greatest in July, due to greater releases of lake water to the Jordan River in summer (Cirrus Ecological Solutions, 2012; Follstad Shah et al., 2019). Likewise, WWTP-FPOM contributions were greatest in fall due to less dilution from Lake-FPOM after summer irrigation season (Follstad Shah et al., 2019). Lake-FPOM was assumed to be mostly autochthonous in July for two reasons. First, δ2H-FPOM values were lower than average terrestrial δ2H values in July indicative of autochthonous sources which have lower δ2H values than terrestrial sources (Doucett et al., 2007). Second, Chla concentrations were highest at all sites in July, and reached up to 30 μg L−1 in Utah Lake. Our results indicate that autochthonous and effluent sources can dominant POM composition, depending on seasonal changes in water source (e.g., lake water vs. WWTP effluent) and autotrophic production.
DOM Was Primarily Microbially Derived
Fluorescence indices and δ2H isotope values indicated the majority of DOM was microbially derived, but not from autochthonous sources. High FI/YFI values (>2) indicated microbially derived DOM (Heo et al., 2016; Ateia et al., 2017), and high FI/YFI were associated with sites directly below WWTP inputs, and were negatively correlated to Chla, indicating a microbial, labile source of DOM uncoupled from autotrophic sources. Interpretation of the FI is based on humic acid standards that distinguish between autochthonous and terrestrial endmembers from a eutrophic lake in Antarctica (Pony Lake) and a black water river in Georgia (the Suwannee). These two standards have FI values that range from 1.2 to 1.5 for the terrestrial and autochthonous endmembers (Cory and McKnight, 2005; Cory et al., 2010). The FI has since been broadly applied to bulk DOM samples across ecosystem types with typical values ranging between 1.1 and 1.8 (Jaffé et al., 2008). FI values above 2 have been attributed to wastewater derived DOM (Dong and Rosario-Ortiz, 2012; Hansen et al., 2016; Ateia et al., 2017), suggesting WWTP effluent is likely more microbially derived than, for example, algal derived DOM. However, at high DOC concentrations the relationship between fluorescence intensity and DOC concentration is not linear (Korak et al., 2014). Therefore, when comparing FI values over a wide range of DOC concentrations the magnitude of change in FI values likely does not represent the magnitude of change in DOM source material or microbially derived DOM (Korak et al., 2014). Thus, the sensitivity of FI values as an index of differences in DOM composition for samples across a wide range of DOC concentrations is limited (Korak et al., 2014).
In addition to high FI/YFI, all δ2H-DOM values were more positive than average terrestrial isotope values in this study, as well as more positive than terrestrial values in a similar study of Midwestern lakes (Wilkinson et al., 2013). Terrestrial sources in previous freshwater studies ranged from −124 to −161 δ2H %0 (Doucett et al., 2007; Collins et al., 2016) which is much more negative than Jordan River δ2H-DOM values, serving as a second line of evidence that the majority of DOM is not from terrestrial sources and is microbially derived. This is significant because while many studies have concluded WWTP effluent is a prevalent source of DOM in urban rivers many did not include sewage sources in the initial study design and did not sample effluent directly (Sickman et al., 2007; Petrone et al., 2011; Newcomer et al., 2012; Lambert et al., 2017). A few studies directly sampled effluent and found DOM was less aromatic (Westerhoff and Anning, 2000), or had lower C:N ratios (Gücker et al., 2011) compared to DOM in agricultural catchments. Similar to this study, Duan et al. (2014) sampled effluent DOM and found terrestrially derived OM was replaced by wastewater and autochthonous sources of DOM.
Deuterium as a Possible Effluent Tracer
Lake-DOM was the primary source of DOM, which also had enriched δ2H-DOM values (−86.1%0, SD 18.2) compared to all other sources. We expected Utah Lake DOM to have more negative δ2H values than terrestrial DOM sources due to autochthonous production, but Utah Lake had enriched δ2H-DOM values due to evaporative enrichment of δ2H-water in Utah Lake (Jameel et al., 2016). Microorganisms likely used enriched lake water for photosynthesis which would enrich microbially derived δ2H-DOM. However, Utah Lake also receives effluent from six WWTPs, and therefore WWTP as a source of DOM in Utah Lake cannot be discounted. The second most likely source of DOM was WWTP-DOM which we assumed would have a δ2H isotope value similar to the δ2H value of human derived organic matter. While deuterium values of humans vary greatly depending on diet (Mant et al., 2016), deuterium isotope values of human hair directly correlates with local tap water δ2H values (Ehleringer et al., 2008) which range from −131.9 to −93.6%0 in the Salt Lake Valley (Jameel et al., 2016). This is within the range of WWTP-DOM in this study.
Conclusions
Each size-class of OM was derived from different sources and varied depending on the dominance of effluent discharge to the river compared to lake water and primary production in summer. Autochthonous sources of CPOM and FPOM increased in summer but differed depending on size class. For example in summer, macrophytes were the primary autochthonous contributor to CPOM while derivatives of autochthonous particulates from Utah Lake increased compared to other OM sources of FPOM. DOM was primarily from WWTP effluent or algal sources from eutrophication in Utah Lake, or a combination of the two considering Utah Lake receives effluent from six WWTPs. As the primary sources of DOM in the Jordan River, the proportion of Lake-DOM and WWTP-DOM contributing to the Jordan River throughout the year has important implications for management efforts to reduce OM loads in the river considering DOM is the largest OM pool in the Jordan River.
Implications for Urban River Research
This study highlights a gap in evolving urban aquatic ecosystem conceptual frameworks which have yet to incorporate the role of higher order streams and rivers (e.g., >1,000 km2) and the effects of reservoirs or inlet/outlet lakes on urban OM source and quality. The Urban Stream Syndrome (Walsh et al., 2005) characterized hydrology of engineered headwater stream networks as flashy, which is the opposite of urban rivers like in this study which are highly regulated and sourced from a lake. Likewise, the Urban Watershed Continuum is a framework based on low order urban streams and calls for further research of OM dynamics in large, human altered rivers (Kaushal and Belt, 2012; Smith and Kaushal, 2015). Specifically, this study can inform broader investigations of whether urbanization has increased the proportion of autochthonously derived OM in rivers compared to reference watersheds. There are several examples of studies of OM quality and quantity in large, urban rivers with WWTP inputs, including foundational work in the Santa Cruz and Gila Rivers of Phoenix, AZ (Westerhoff and Anning, 2000; Edmonds and Grimm, 2011), Hudson River, NY (Findlay, 2005; del Giorgio and Pace, 2008; Caraco et al., 2010), and Sacramento River, CA (Sickman et al., 2007), but the results of these studies have yet to be incorporated into a larger framework that links headwaters, rivers lakes and reservoirs in human altered watersheds (Kaushal and Belt, 2012).
Implications for Urban Watershed Management
OM load reduction and regulation begins with source identification, and therefore, this study informs future management of urban river water quality. For example, the total maximum daily load plan developed for the Jordan River found excessive OM was the cause of a low dissolved oxygen impairment, and identified 35 possible sources of POM, primarily from stormwater runoff and tributaries (Cirrus Ecological Solutions, 2012). We narrowed sources of POM and DOM depending on season and found sources from Utah Lake and WWTPs contributed greatly to DOM, the largest pool of OM in the River (Epstein et al., 2016). Research on OM sources in urban watersheds can help managers to mitigate the effects of urban OM loads that result in hypoxic dead zones, as observed in the Chesapeake Bay (Zimmerman and Canuel, 2000) or in the case of the Jordan River, pollution of the Great Salt Lake (Baskin et al., 2002; Naftz et al., 2008).
Additionally, managers may care about sources of OM in rivers since excessive OM loads can increase the cost of wastewater treatment and make treatment less effective (Chow et al., 2005). Algal derived DOM reduces WWTP effectiveness through increased coagulant demand and membrane fouling (Nguyen et al., 2005; Henderson et al., 2007). Likewise, microbial and algal derived DOM is produced and persists throughout the treatment process, and upon chlorination may form hazardous disinfection by-products (Nguyen et al., 2005; Bridgeman et al., 2014). To prevent increased WWTP costs and energy use in the future, managers could consider strategies that may reduce autochthonous sources of OM, such as light and/or nutrient limitation.
Data Availability Statement
The datasets generated for this study are available on request to the corresponding author.
Author Contributions
JK and MB developed the study design and wrote the manuscript. JK collected and analyzed the samples, and analyzed the data.
Funding
This research was supported in part by NSF EPSCoR cooperative agreement OIA-1208732 awarded to Utah State University, as part of the State of Utah EPSCoR Research Infrastructure Improvement Award. Additional support was provided by the South Valley Water Reclamation Facility and Utah Department of Environmental Quality. Any opinions, findings, and conclusions or recommendations expressed are those of the authors and do not reflect the views of the National Science Foundation, South Valley Water Reclamation Facility, or the State of Utah.
Conflict of Interest
The authors declare that the research was conducted in the absence of any commercial or financial relationships that could be construed as a potential conflict of interest.
Acknowledgments
We thank Dave Epstein, Joe Crawford, Hayden Campbell, and Lisa Jacobson-Ward for help in the field and laboratory. This manuscript was improved by thoughtful comments from Rose M. Smith, Zach Aanderud, Matt Miller, Beth Neilson, and John Stark. We thank Melanie Caron at the Colorado Plateau Stable Isotope Facility and staff at the U. C. Davis Stable Isotope Facility for hydrogen stable isotope analysis guidance.
Supplementary Material
The Supplementary Material for this article can be found online at: https://www.frontiersin.org/articles/10.3389/fenvs.2019.00202/full#supplementary-material
References
Alexander, R. B., Böhlke, J. K., Boyer, E. W., David, M., Harveyt, J. W., Mulholland, P. J., et al. (2009). Dynamic modeling of nitrogen losses in river networks unravels the coupled effects of hydrological and biogeochemical processes. Biogeochemistry 93, 91–116. doi: 10.1007/s10533-008-9274-8
Ateia, M., Apul, O. G., Shimizu, Y., Muflihah, A., Yoshimura, C., and Karanfil, T. (2017). Elucidating adsorptive fractions of natural organic matter on carbon nanotubes. Environ. Sci. Technol. 51, 7101–7110. doi: 10.1021/acs.est.7b01279
Bade, D. L., Carpenter, S. R., Cole, J. J., Pace, M., Kritzberg, E., Van de Bogert, M. C., et al. (2007). Sources and fates of dissolved organic carbon in lakes as determined by whole-lake carbon isotope additions. Biogeochemistry 84, 115–129. doi: 10.1007/s10533-006-9013-y
Baker, A. (2001). Fluorescence excitation–emission matrix characterization of some sewage-impacted rivers. Environ. Sci. Technol. 35, 948–953. doi: 10.1021/es000177t
Baruch, E. M., Voss, K. A., Blaszczak, J. R., Delesantro, J., Urban, D. L., and Bernhardt, E. S. (2018). Not all pavements lead to streams: variation in impervious surface connectivity affects urban stream ecosystems. Freshw. Sci. 37, 673–684. doi: 10.1086/699014
Baskin, R. L., Waddell, K. M., Thiros, S. A., Giddings, E. M., Hadley, H. K., Stephens, D. W., et al. (2002). Water-Quality Assessment of the Great Salt Lake basins, Utah, Idaho, and Wyoming—Environmental Setting and Study Design. Salt Lake City, UT: US Geological Survey.
Battin, T. J., Kaplan, L. A., Findlay, S., Hopkinson, C. S., Marti, E., Packman, A. I., et al. (2008). Biophysical controls on organic carbon fluxes in fluvial networks. Nat. Geosci. 1, 95–100. doi: 10.1038/ngeo101
Bernot, M. J., Sobota, D. J., Hall, R. O., Mulholland, P. J., Dodds, W. K., Webster, J. R., et al. (2010). Inter-regional comparison of land-use effects on stream metabolism. Freshw. Biol. 55, 1874–1890. doi: 10.1111/j.1365-2427.2010.02422.x
Bridgeman, J., Gulliver, P., Roe, J., and Baker, A. (2014). Carbon isotopic characterisation of dissolved organic matter during water treatment. Water Res. 48, 119–125. doi: 10.1016/j.watres.2013.09.025
Brodie, C. R., Leng, M. J., Casford, J. S., Kendrick, C. P., Lloyd, J. M., Yongqiang, Z., et al. (2011). Evidence for bias in C and N concentrations and δ13C composition of terrestrial and aquatic organic materials due to pre-analysis acid preparation methods. Chem. Geol. 282, 67–83. doi: 10.1016/j.chemgeo.2011.01.007
Caraco, N., Bauer, J. E., Cole, J. J., Petsch, S., and Raymond, P. (2010). Millennial-aged organic carbon subsidies to a modern river food web. Ecology 91, 2385–2393. doi: 10.1890/09-0330.1
Cartwright, I. (2010). The origins and behaviour of carbon in a major semi-arid river, the Murray River, Australia, as constrained by carbon isotopes and hydrochemistry. Appl. Geochem. 25, 1734–1745. doi: 10.1016/j.apgeochem.2010.08.020
Chow, A. T., Gao, S., and Dahlgren, R. A. (2005). Physical and chemical fractionation of dissolved organic matter and trihalomethane precursors: a review. Aqua 54, 475–507. doi: 10.2166/aqua.2005.0044
Cirrus Ecological Solutions LC, and Stantec Consulting Inc. (2012). Jordan River Total Maximum Daily Load Water Quality Study–Phase 1. Utah Department of Environmental Quality.
Cloern, J. E., Canuel, E. A., and Harris, D. (2002). Stable carbon and nitrogen isotope composition of aquatic and terrestrial plants of the San Francisco Bay estuarine system. Limnol. Oceanogr. 3, 713–729. doi: 10.4319/lo.2002.47.3.0713
Collins, S. M., Kohler, T. J., Thomas, S. A., Fetzer, W. W., and Flecker, A. S. (2016). The importance of terrestrial subsidies in stream food webs varies along a stream size gradient. Oikos 125, 674–685. doi: 10.1111/oik.02713
Cory, R. M., and McKnight, D. M. (2005). Fluorescence spectroscopy reveals ubiquitous presence of oxidized and reduced quinones in dissolved organic matter. Environ. Sci. Technol. 39, 8142–8814. doi: 10.1021/es0506962
Cory, R. M., Miller, M. P., McKnight, D. M., Guerard, J. J., and Miller, P. L. (2010). Effect of instrument-specific response on the analysis of fulvic acid fluorescence spectra. Limnol. Oceanogr. 8, 67–78. doi: 10.4319/lom.2010.8.0067
del Giorgio, P. A., and Pace, M. L. (2008). Relative independence of organic carbon transport and processing in a large temperate river: the Hudson River as both pipe and reactor. Limnol. Oceanogr. 53, 185–197. doi: 10.4319/lo.2008.53.1.0185
Dong, M. M., and Rosario-Ortiz, F. L. (2012). Photochemical formation of hydroxyl radical from effluent organic matter. Environ. Sci. Technol. 46, 3788–3794. doi: 10.1021/es2043454
Doucett, R. R., Marks, J. C., Blinn, D. W., Caron, M., and Hungate, B. A. (2007). Measuring terrestrial subsidies to aquatic food webs using stable isotopes of hydrogen. Ecology 88, 1587–1592. doi: 10.1890/06-1184
Duan, S., Amon, R. M., and Brinkmeyer, R. L. (2014). Tracing sources of organic matter in adjacent urban streams having different degrees of channel modification. Sci. Tot. Environ. 485, 252–262. doi: 10.1016/j.scitotenv.2014.03.066
Edmonds, J. W., and Grimm, N. B. (2011). Abiotic and biotic controls of organic matter cycling in a managed stream. J. Geophys. Res. 116:G02015. doi: 10.1029/2010JG001429
Ehleringer, J. R., Bowen, G. J., Chesson, L. A., West, A. G., Podlesak, D. W., and Cerling, T. E. (2008). Hydrogen and oxygen isotope ratios in human hair are related to geography. Proc. Natl. Acad. Sci. U.S.A. 105, 2788–2793. doi: 10.1073/pnas.0712228105
Epstein, D. M., Kelso, J. E., and Baker, M. A. (2016). Beyond the urban stream syndrome: organic matter budget for diagnostics and restoration of an impaired urban river. Urban Ecosyst. 19, 1041–1061. doi: 10.1007/s11252-016-0556-y
Figueroa-Nieves, D., McDowell, W. H., Potter, J. D., Martínez, G., and Ortiz-Zayas, J. R. (2014). Effects of sewage effluents on water quality in tropical streams. J. Environ. Qual. 43, 2053–2063. doi: 10.2134/jeq2014.03.0139
Findlay, S. E. (2005). Increased carbon transport in the Hudson River: unexpected consequence of nitrogen deposition? Front. Ecol. Environ. 3, 133–137. doi: 10.1890/1540-9295(2005)003[0133:ICTITH]2.0.CO;2
Follstad Shah, J. J., Jameel, Y., Smith, R. M., Gabor, R. S., Brooks, P. D., and Weintraub, S. R. (2019). Spatiotemporal variability in water sources controls chemical and physical properties of a semi-arid urban river system. J. Am. Water Resour. Assoc. 55, 591–607. doi: 10.1111/1752-1688.12734
Gabor, R. S., Baker, A., McKnight, D. M., and Miller, M. P. (2014). “Fluorescence indices and their interpretation,” in Aquatic Organic Matter Fluorescence, eds P. G. Coble, J. Lead, A. Baker, D. M. Reynolds, and R. G. M. Spencer (New York, NY: Cambridge University Press), 303–338. doi: 10.1017/CBO9781139045452.015
Griffith, D. R., Barnes, R. T., and Raymond, P. A. (2009). Inputs of fossil carbon from wastewater treatment plants to US rivers and oceans. Environ. Sci. Technol. 43, 5647–5651. doi: 10.1021/es9004043
Gücker, B., Brauns, M., and Pusch, M. T. (2006). Effects of wastewater treatment plant discharge on ecosystem structure and function of lowland streams. J. North Am. Benthol. Soc. 25, 313–329. doi: 10.1899/0887-3593(2006)25[313:EOWTPD]2.0.CO;2
Gücker, B., Brauns, M., Solimini, A. G., Voss, M., Walz, N., and Pusch, M. T. (2011). Urban stressors alter the trophic basis of secondary production in an agricultural stream. Can. J. Fish. Aquat. Sci. 68, 74–88. doi: 10.1139/F10-126
Gudasz, C., Ruppenthal, M., Kalbitz, K., Cerli, C., Fiedler, S., Oelmann, Y., et al. (2017). Contributions of terrestrial organic carbon to northern lake sediments. Limnol. Oceanogr. 2, 218–227. doi: 10.1002/lol2.10051
Hansen, A. M., Kraus, T. E., Pellerin, B. A., Fleck, J. A., Downing, B. D., and Bergamaschi, B. A. (2016). Optical properties of dissolved organic matter (DOM): effects of biological and photolytic degradation. Limnol. Oceanogr. 61, 1015–1032. doi: 10.1002/lno.10270
Helley, E. J., and Smith, W. (1971). Development and Calibration of a Pressure-Difference Bedload Sampler. United States Geological Survey Open-File Report, 73–108. doi: 10.3133/ofr73108
Henderson, R. K., Baker, A., Parsons, S. A., and Jefferson, B. (2007). Characterisation of algogenic organic matter extracted from cyanobacteria, green algae and diatoms. Water Res. 42, 3435–3445. doi: 10.1016/j.watres.2007.10.032
Heo, J., Yoon, Y., Kim, D. H., Lee, H., Lee, D., and Her, N. (2016). A new fluorescence index with a fluorescence excitation-emission matrix for dissolved organic matter (DOM) characterization. Desalin. Water Treat. 57, 20270–20282. doi: 10.1080/19443994.2015.1110719
Hood, E., Williams, M. W., and McKnight, D. M. (2005). Sources of dissolved organic matter (DOM) in a Rocky Mountain stream using chemical fractionation and stable isotopes. Biogeochemistry 74, 231–255. doi: 10.1007/s10533-004-4322-5
Hooten, L. H. (2011). Utah Lake and The Jordan River Flood Control. Available online at: http://www.slcdocs.com/utilities/NewsEvents/news2011/news6282011.htm (acessed April 20, 2011).
Hosen, J. D., McDonough, O. T., Febria, C. M., and Palmer, M. A. (2014). Dissolved organic matter quality and bioavailability changes across an urbanization gradient in headwater streams. Environ. Sci. Technol. 48, 7817–7824. doi: 10.1021/es501422z
Imberger, S. J., Cook, P. L., Grace, M. R., and Thompson, R. M. (2014). Tracing carbon sources in small urbanising streams: catchment-scale stormwater drainage overwhelms the effects of reach-scale riparian vegetation. Freshw. Biol. 59, 168–186. doi: 10.1111/fwb.12256
Jaffé, R., McKnight, D., Maie, N., Cory, R., McDowell, W., and Campbell, J. (2008). Spatial and temporal variations in DOM composition in ecosystems: the importance of long-term monitoring of optical properties. J. Geophys. Res. 113:G04032. doi: 10.1029/2008JG000683
Jameel, Y., Brewer, S., Good, S. P., Tipple, B. J., Ehleringer, J. R., and Bowen, G. J. (2016). Tap water isotope ratios reflect urban water system structure and dynamics across a semiarid metropolitan area. Water Resour. Res. 52, 5891–5910. doi: 10.1002/2016WR019104
Kaplan, L. A., and Bott, T. L. (1989). Diel fluctuations in bacterial activity on streambed substrata during vernal algal blooms: effects of temperature, water chemistry, and habitat. Limnol. Oceanogr. 34, 718–733. doi: 10.4319/lo.1989.34.4.0718
Kaushal, S. S., and Belt, K. T. (2012). The urban watershed continuum: evolving spatial and temporal dimensions. Urban Ecosyst. 15, 409–435. doi: 10.1007/s11252-012-0226-7
Kaushal, S. S., Mayer, P. M., Vidon, P. G., Smith, R. M., Pennino, M. J., Newcomer, T. A., et al. (2014). Land use and climate variability amplify carbon, nutrient, and contaminant pulses: a review with management implications. JAWRA J. Am. Water Resour. Assoc. 50, 585–614. doi: 10.1111/jawr.12204
Kelso, J. E., and Baker, M. A. (2015). Filtering with a drill pump: an efficient method to collect suspended sediment. J. Am. Water Resour. Assoc. 52, 1–7. doi: 10.1111/1752-1688.12368
Kendall, C., Elliott, E. M., and Wankel, S. D. (2007). “Tracing anthropogenic inputs of nitrogen to ecosystems,” in Stable Isotopes in Ecology and Environmental Science, 2nd Edn. eds R. H. Michener and K. Lajtha (Malden, MA: Blackwell Publishing), 375–449. doi: 10.1002/9780470691854.ch12
Kendall, C., Silva, S. R., and Kelly, V. J. (2001). Carbon and nitrogen isotopic compositions of particulate organic matter in four large river systems across the United States. Hydrol. Process. 15, 1301–1346. doi: 10.1002/hyp.216
Kominoski, J. S., and Rosemond, A. D. (2012). Conservation from the bottom up: forecasting effects of global change on dynamics of organic matter and management needs for river networks. Freshw. Sci. 31, 51–68. doi: 10.1899/10-160.1
Korak, J. A., Dotson, A. D., Summers, R. S., and Rosario-Ortiz, F. L. (2014). Critical analysis of commonly used fluorescence metrics to characterize dissolved organic matter. Water Res. 49, 327–338. doi: 10.1016/j.watres.2013.11.025
Kritzberg, E. S., Cole, J. J., Pace, M. L., Granéli, W., and Bade, D. L. (2004). Autochthonous versus allochthonous carbon sources of bacteria: results from whole-lake 13C addition experiments. Limnol. Oceanogr. 49, 588–596. doi: 10.4319/lo.2004.49.2.0588
Kruschke, J. K. (2018). Rejecting or accepting parameter values in Bayesian estimation. Adv. Methods Pract. Psychol. Sci. 1, 270–280. doi: 10.1177/2515245918771304
Lambert, T., Bouillon, S., Darchambeau, F., Morana, C., Roland, F. A., Descy, J. P., et al. (2017). Effects of human land use on the terrestrial and aquatic sources of fluvial organic matter in a temperate river basin (The Meuse River, Belgium). Biogeochemistry 136, 191–211. doi: 10.1007/s10533-017-0387-9
Larsen, L., and Harvey, J. (2017). Disrupted carbon cycling in restored and unrestored urban streams: critical timescales and controls. Limnol. Oceanogr. 62, S160–S182. doi: 10.1002/lno.10613
Le Meur, M., Mansuy-Huault, L., Lorgeoux, C., Bauer, A., Gley, R., Vantelon, D., et al. (2017). Spatial and temportal variations of particulate organic matter from Moselle River and tributaries: a multimolecular investigation. Org. Geochem. 110, 45–56. doi: 10.1016/j.orggeochem.2017.04.003
Mant, M., Nagel, A., and Prowse, T. (2016). Investigating residential history using stable hydrogen and oxygen isotopes of human hair and drinking water. J. Foren. Sci. 61, 884–891. doi: 10.1111/1556-4029.13066
McCallister, S. L., and del Giorgio, P. A. (2008). Direct measurement of the δ13C signature of carbon respired by bacteria in lakes: linkages to potential carbon sources, ecosystem baseline metabolism, and CO2 fluxes. Limnol. Oceanogr. 53, 1204–1216. doi: 10.4319/lo.2008.53.4.1204
McClain, M. E., Boyer, E. W., Dent, C. L., Gergel, S. E, Grimm, N. B., Groffman, P. M., et al. (2003). Biogeochemical hot spots and hot moments at the interface of terrestrial and aquatic ecosystems. Ecosystems 6, 301–312. doi: 10.1007/s10021-003-0161-9
McElmurry, S. P., Long, D. T., and Voice, T. C. (2013). Stormwater dissolved organic matter: influence of land cover and environmental factors. Environ. Sci. Technol. 48, 45–53. doi: 10.1021/es402664t
Meyer, J. L., Paul, M. J., and Taulbee, W. K. (2005). Stream ecosystem function in urbanizing landscapes. J. North Am. Benthol. Soc. 24, 602–612. doi: 10.1899/04-021.1
Mineau, M. M., Wollheim, W. M., Buffam, I., Findlay, S. E., Hall, R. O. Jr., Hotchkiss, E. R., et al. (2016). Dissolved organic carbon uptake in streams: a review and assessment of reach-scale measurements. J. Geophys. Res. 121, 2019–2029. doi: 10.1002/2015JG003204
Mohamed, N. M., and Taylor, W. D. (2009). Relative contribution of autochthonous and allochthonous carbon to limnetic zooplankton: a new cross-system approach. Fundam. Appl. Limnol. Archiv. Hydrobiol. 175, 113–124. doi: 10.1127/1863-9135/2009/0175-0113
Murphy, K. R., Stedmon, C. A., Graeber, D., and Bro, R. (2013). Fluorescence spectroscopy and multi-way techniques. PARAFAC. Anal. Methods 5, 6557–6566. doi: 10.1039/c3ay41160e
Naftz, D., Angeroth, C., Kenney, T., Waddell, B., Darnall, N., Silva, S., et al. (2008). Anthropogenic influences on the input and biogeochemical cycling of nutrients and mercury in Great Salt Lake, Utah, USA. Appl. Geochem. 23, 1731–1744. doi: 10.1016/j.apgeochem.2008.03.002
Newcomer, T. A., Kaushal, S. S., Mayer, P. M., Shields, A. R., Canuel, E. A., Groffman, P. M., et al. (2012). Influence of natural and novel organic carbon sources on denitrification in forest, degraded urban, and restored streams. Ecol. Monogr. 82, 449–466. doi: 10.1890/12-0458.1
Nguyen, M. L., Westerhoff, P., Baker, L., Hu, Q., Esparza-Soto, M., and Sommerfeld, M. (2005). Characteristics and reactivity of algae-produced dissolved organic carbon. J. Environ. Eng. 131, 1574–1582. doi: 10.1061/(ASCE)0733-9372(2005)131:11(1574)
Ostapenia, A. P., Parparov, A., and Berman, T. (2009). Lability of organic carbon in lakes of different trophic status. Freshw. Biol. 54, 1312–1323. doi: 10.1111/j.1365-2427.2009.02183.x
Palmer, S. M., Hope, D., Billett, M. F., Dawson, J. J., and Bryant, C. L. (2001). Sources of organic and inorganic carbon in a headwater stream: evidence from carbon isotope studies. Biogeochemistry 52, 321–338. doi: 10.1023/A:1006447706565
Parlanti, E., Wörz, K., Geoffroy, L., and Lamotte, M. (2000). Dissolved organic matter fluorescence spectroscopy as a tool to estimate biological activity in a coastal zone submitted to anthropogenic inputs. Org. Geochem. 31, 1765–1781. doi: 10.1016/S0146-6380(00)00124-8
Parnell, A. (2016). Simmr-package A Stable Isotope Mixing Model. Version 0.3. Available online at: https://cran.r-project.org/web/packages/simmr/
Parnell, A. C., Phillips, D. L., Bearhop, S., Semmens, B. X., Ward, E. J., Moore, J. W., et al. (2013). Bayesian stable isotope mixing models. Environmetrics 24, 387–399. doi: 10.1002/env.2221
Parr, T. B., Cronan, C. S., Ohno, T., Findlay, S. E. G., Smith, S. M., and Simon, K. S. (2015). Urbanization changes the composition and bioavailability of dissolved organic matter in headwater streams. Limnol. Oceanogr. 60, 885–900. doi: 10.1002/lno.10060
Pennino, M. J., Kaushal, S. S., Murthy, S. N., Blomquist, J. D., Cornwell, J. C., and Harris, L. A. (2016). Sources and transformations of anthropogenic nitrogen along an urban river-estuarine continuum. Biogeosciences 13, 6211–6228. doi: 10.5194/bg-13-6211-2016
Petrone, K. C., Fellman, J. B., Hood, E., Donn, M. J., and Grierson, P. F. (2011). The origin and function of dissolved organic matter in agro-urban coastal streams. J. Geophys. Res. 116:G01028. doi: 10.1029/2010JG001537
Piñón-Gimate, A., Soto-Jiménez, M. F., Ochoa-Izaguirre, M. J., García-Pagés, E., and Páez-Osuna, F (2009). Macroalgae blooms and δ15N in subtropical coastal lagoons from the Southeastern Gulf of California: Discrimination among agricultural, shrimp farm and sewage effluents. Mar. Pollut. Bull. 58, 1144–1151. doi: 10.1016/j.marpolbul.2009.04.004
PSOMAS Consulting (2009). Utah Lake TMDL: Pollutant Loading Assessment and Designated Beneficial Use Impairment Assessment. Salt Lake City, UT: Utah Division of Water Quality.
Rasmussen, J. B. (2010). Estimating terrestrial contribution to stream invertebrates and periphyton using a gradient-based mixing model for δ13C. J. Ani. Ecol. 79, 393–402. doi: 10.1111/j.1365-2656.2009.01648.x
Schloerke, B., Crowley, J., Cook, D., Hofmann, H., Wickham, H., Briatte, F., et al. (2014). GGally: Extension to ggplot2. R package version 1:28.
Sickman, J., Zanoli, M., and Mann, H. (2007). Effects of urbanization on organic carbon loads in the Sacramento River, California. Water Resour. Res. 43:W11422. doi: 10.1029/2007WR005954
Smith, R. M., and Kaushal, S. S. (2015). Carbon cycle of an urban watershed: exports, sources, and metabolism. Biogeochemistry 126, 173–195. doi: 10.1007/s10533-015-0151-y
Smith, R. M., Kaushal, S. S., Beaulieu, J. J., Pennino, M., et al. (2017). Influence of infrastructure on water quality and greenhouse gas dynamics in urban streams. Biogeosciences 14, 2831–2849. doi: 10.5194/bg-14-2831-2017
Steinman, A. D., Lamberti, G. A., and Leavitt, P. R. (2007). “Biomass and pigments of benthic algae,” in Methods in Stream Ecology, eds F. R. Hauer and G. A. Lamberti (Amsterdam: Elsevier), 357–379.
Taipale, S. J., and Sonninen, E. (2009). The influence of preservation method and time on the δ13C value of dissolved inorganic carbon in water samples. Rapid Commun. Mass Spectrom. 23, 2507–2510. doi: 10.1002/rcm.4072
Wallace, J. B., Webster, J. R., and Woodall, W. R. (1977). The role of filter feeders in flowing waters. Arch. Hydrobiol. 79, 506–532.
Walsh, C. J., Roy, A. H., Feminella, J. W., Cottingham, P. D., Groffman, P. M., and Morgan, R. P. (2005). The urban stream syndrome: current knowledge and the search for a cure. J. North Am. Benthol. Soc. 24, 706–723. doi: 10.1899/04-028.1
Wassenaar, L., Venkiteswaran, J., Schiff, S., and Koehler, G. (2010). Aquatic community metabolism response to municipal effluent inputs in rivers quantified using diel δ 18O values of dissolved oxygen. Can. J. Fish. Aquat. Sci. 67, 1232–1246. doi: 10.1139/F10-057
Wassenaar, L. I., and Hobson, K. A. (2000). Improved method for determining the stable-hydrogen isotopic composition (dD) of complex organic materials of environmental interest. Environ. Sci. Technol. 34, 2354–2360. doi: 10.1021/es990804i
Weishaar, J. L., Aiken, G. R., Bergamaschi, B. A., Fram, M., et al. (2003). Evaluation of specific ultraviolet absorbance as an indicator of the chemical composition and reactivity of dissolved organic carbon. Environ. Sci. Technol. 37, 4702–4708. doi: 10.1021/es030360x
Westerhoff, P., and Anning, D. (2000). Concentrations and characteristics of organic carbon in surface water in Arizona: influence of urbanization. J. Hydrol. 236, 202–222. doi: 10.1016/S0022-1694(00)00292-4
Wilkinson, G. M., Pace, M. L., and Cole, J. J. (2013). Terrestrial dominance of organic matter in north temperate lakes. Glob. Biogeochem. Cycles 27, 43–51. doi: 10.1029/2012GB004453
Williams, C. J., Frost, P. C., Morales-Williams, A. M., Larson, J. H., Richardson, W. B., Chiandet, A. S., et al. (2016). Humanactivities cause distinct dissolved organic matter composition across freshwater ecosystems. Glob. Chang. Biol. 22, 613–626. doi: 10.1111/gcb.13094
Zimmerman, A. R., and Canuel, E. A. (2000). A geochemical record of eutrophication and anoxia in Chesapeake Bay sediments: anthropogenic influence on organic matter composition. Mar. Chem. 69, 117–137. doi: 10.1016/S0304-4203(99)00100-0
Keywords: freshwater, urban, particulate organic matter, DOM, isotopes, fluorescence, deuterium
Citation: Kelso JE and Baker MA (2020) Organic Matter Is a Mixture of Terrestrial, Autochthonous, and Wastewater Effluent in an Urban River. Front. Environ. Sci. 7:202. doi: 10.3389/fenvs.2019.00202
Received: 07 July 2019; Accepted: 16 December 2019;
Published: 10 January 2020.
Edited by:
Karen A. Kidd, McMaster University, CanadaReviewed by:
Renato Carreira, Pontifical Catholic University of Rio de Janeiro, BrazilErik J. S. Emilson, Natural Resources Canada, Canada
Copyright © 2020 Kelso and Baker. This is an open-access article distributed under the terms of the Creative Commons Attribution License (CC BY). The use, distribution or reproduction in other forums is permitted, provided the original author(s) and the copyright owner(s) are credited and that the original publication in this journal is cited, in accordance with accepted academic practice. No use, distribution or reproduction is permitted which does not comply with these terms.
*Correspondence: Julia E. Kelso, anVsaWEua2Vsc29AZ21haWwuY29t