 Rebecca J. Frei1,2*
 Benjamin W. Abbott1
 Remi Dupas3
 Sen Gu4Gerard Gruau4
 Zahra Thomas3
 Tamara Kolbe5
 Luc Aquilina4Thierry Labasque4
 Anniet Laverman6
 Ophelie Fovet3
 Florentina Moatar7
 Gilles Pinay7
- 1Department of Plant and Wildlife Sciences, Brigham Young University, Provo, UT, United States
- 2Department of Renewable Resources, University of Alberta, Edmonton, AB, Canada
- 3UMR SAS, INRA, AGRO OUEST, Rennes, France
- 4Univ Rennes, CNRS, OSUR, Géosciences Rennes, UMR 6118, Rennes, France
- 5Faculty of Geoscience, Geoengineering and Mining, Technische Universität Bergakademie Freiberg, Freiberg, Germany
- 6Centre National de la Recherche Scientifique (CNRS), ECOBIO – UMR 6553, Université de Rennes, Rennes, France
- 7RiverLy, Irstea, Lyon, France
Quantifying nutrient attenuation at watershed scales requires long-term water chemistry data, water discharge, and detailed nutrient input chronicles. Consequently, nutrient attenuation estimates are largely limited to long-term research areas or modeling studies, constraining understanding of the ecological characteristics controlling nutrient attenuation and complicating efforts to protect or restore water quality in developed and developing regions. Here, we combined long-term data and a broad suite of biogeochemical parameters from 49 watersheds in northwestern France to test how well instantaneous measurements can predict nitrogen (N) and phosphorus (P) attenuation at watershed scales. We evaluated 13 biogeochemical and 12 hydrological proxies of hydrological flowpaths, residence time, and biogeochemical transformation. Across the 49 watersheds, nutrient attenuation ranged from 88 to −2% for N and 99–96% for P. The strongest biogeochemical proxies of N attenuation were isotopes, rare earth elements (REEs), radon, and turbidity, together explaining 75% of observed variation. For P attenuation, REEs, isotopes, molecular weight of dissolved organic matter, and radon were the strongest proxies, but only explained 27% of observed variation. However, a single hydrological parameter—annual runoff—explained 91% of N attenuation and the relative abundance of schist bedrock explained 56% of P attenuation. We discuss how runoff both controls and reflects watershed hydrology, biogeochemistry, and nutrient attenuation. For example, runoff was correlated with long-term decreases in nutrient concentration, demonstrating how leakier watersheds recover more quickly from nutrient saturation. Given the immense fertilization capacity of modern society, we propose that eutrophication can only be solved by reducing nutrient inputs, though hydrochemical proxies can provide valuable information on where to carry out essential food production activities.
Introduction
Since the Industrial Revolution, humans have more than doubled reactive nitrogen (N) inputs (Gruber and Galloway, 2008) and quadrupled phosphorus (P) inputs (Elser and Bennett, 2011) into the Earth's ecosystems (Seitzinger et al., 2010; Foley et al., 2011; Abbott et al., 2018a). Consequently, approximately 80% of freshwater and coastal ecosystems now experience eutrophication induced by anthropogenic inputs of N and P (Howarth et al., 2000; Galloway et al., 2003; Poisvert et al., 2017; Le Moal et al., 2019). Though recognized as a planetary priority (Foley et al., 2011; Steffen et al., 2015; Le Moal et al., 2019), efforts to reduce eutrophication have had mixed results, partly because of two challenges that emerge at watershed scales (i.e., 1–10,000 km2). First, it is difficult to quantify the overall residence time of nutrients in complex watersheds, which ranges from minutes to millennia as nutrients may be recycled or stored in plant biomass, soil, and groundwater (Jarvie et al., 2013; Sebilo et al., 2013; Marçais et al., 2018; Carey et al., 2019; Kolbe et al., 2019). Second, the capacity of ecosystems to remove or permanently retain nutrients via vertical processes such as denitrification or diagenesis is highly variable, and the socioecological drivers (e.g., watershed characteristics and agricultural practices) of nutrient removal are poorly understood (Pinay et al., 2015; Abbott et al., 2016; Dupas et al., 2018; Goyette et al., 2018; Jarvie et al., 2019).
There are three general fates for nutrients moving through the soils, riparian zones, surface waters, and aquifers of a watershed: (1) Retention (i.e., a long or short-term delay) by biological and physical processes, including nutrient uptake, sorption, or hydrological residence time (Covino et al., 2010; Sebilo et al., 2013; Van Meter et al., 2016; Dupas et al., 2017; Ehrhardt et al., 2019), (2) Vertical removal to the atmosphere or lithosphere, including denitrification, aeolian transport, or mineral precipitation with various metals (Groffman et al., 2006; Seitzinger et al., 2006; Pinay et al., 2018; Randall et al., 2019), and (3) Longitudinal export from the watershed via surface or subsurface flow (Burt and Pinay, 2005; Seitzinger et al., 2010; Abbott et al., 2018a). The reactivity and mobility of organic and inorganic nutrients depend on and influence biogeochemical conditions (Abbott et al., 2016; Bernhardt et al., 2017), meaning that the fate of carbon, N, and P can vary substantially through time (e.g., storm events or seasons) and in space (e.g., different watersheds or biomes) (Dupas et al., 2016; Moatar et al., 2017; Musolff et al., 2017; Minaudo et al., 2019). Consequently, watersheds with similar nutrient inputs often have completely different nutrient export regimes, particularly for headwater watersheds that make up most of the terrestrial-aquatic interface (Bishop et al., 2008; Abbott et al., 2018b; Helton et al., 2018; Wollheim et al., 2018). This variability in nutrient attenuation capacity is likely associated with differences in surface and subsurface characteristics, including differences in water storage capacity and residence times, abundance and activity of biotic nutrient sinks (e.g., plant or microbial assimilation, dissimilatory microbial metabolism), and abiotic factors (e.g., high sorption capacity in soils, mineral precipitation, presence of chemical reducers in bedrock) (Hansen et al., 2002; Aquilina et al., 2012, 2018; Thomas and Abbott, 2018; Kolbe et al., 2019). All these factors are influenced by changes in hydrological connectivity, uneven distribution of reactants and organisms due to the co-evolution of surface and subsurface characteristics, and the stochastic nature of human and natural disturbance (Hansen et al., 2000; Thomas et al., 2015; Covino, 2017; Moatar et al., 2017).
Despite advances in understanding nutrient dynamics, it remains difficult to quantify nutrient retention and removal on timescales matching hydrological and nutrient residence times (Vitousek, 2004; Pinay et al., 2015; Ehrhardt et al., 2019). Additionally, many nutrient attenuation studies focus on single-nutrient dynamics, despite evidence that eutrophication is caused by interactions among multiple nutrients and factors (Carpenter et al., 1998; Elser et al., 2007; Paerl et al., 2016; Hobbie et al., 2017; Le Moal et al., 2019). Consequently, there is no straightforward way to predict a watershed's sensitivity to high nutrient inputs, seriously limiting our ability to prevent eutrophication or improve water quality where it has already been degraded. Quantifying nutrient attenuation at the watershed scale involves lengthy data acquisition and costly infrastructure (Burt, 1994; Howden et al., 2010; Burt et al., 2011), which are not always available in developing nations where agriculture and urbanization are intensifying fastest (Seitzinger et al., 2010; FAO, 2017; Dupas et al., 2019b).
In this context of variability, two conceptual approaches for predicting nutrient attenuation are the hot spots/control points concept, which predicts where and when biogeochemical reactions are more likely to occur (McClain et al., 2003; Bernhardt et al., 2017) and the Damköhler number, which uses the ratio of residence time to reaction time to predict how much of a reactant can be transformed or retained (Ocampo et al., 2006; Zarnetske et al., 2011; Oldham et al., 2013). Pinay et al. (2015) and Abbott et al. (2016) proposed to combine these concepts in the HotDam framework by combining multiple proxies of biogeochemical transformation, hydrological flowpaths, and hydrological residence time. Combining or crossing multiple proxies such as solute and isotopic concentrations, hydrograph properties, and organic matter can illustrate terrestrial and aquatic conditions across nutrient flowpaths (Pinay et al., 2015; Abbott et al., 2016; Shogren et al., 2019), potentially paving the way for a more systematic understanding of what controls nutrient attenuation in watersheds.
Here, we apply the HotDam framework to identify controls on attenuation of N and P in 49 small to medium watersheds in Brittany, France using a crossed-proxy approach. Our overarching goals were to understand the drivers of nutrient attenuation in agricultural watersheds and test how well nutrient attenuation could be predicted with easily measurable proxies. These proxies included nutrient stoichiometry, organic matter biodegradability, dissolved gases, rare earth elements (REEs), nitrate isotopes, and hydrograph parameters (Figure 1). We hypothesized that nutrient attenuation would be controlled by the hydrological properties of the watersheds (e.g., water residence time and dominant flowpaths), surface and subsurface characteristics (e.g., land use, topography, geology), and biogeochemical conditions (e.g., stoichiometry and spatiotemporal distribution of electron donors and acceptors; see Table 1). We tested these hypotheses by calculating mass balances of N and P for each watershed using 10 years of local, regional, or national agency data, and then sampling the watersheds three times across flow conditions and seasons to analyze the broad suite of proxies.
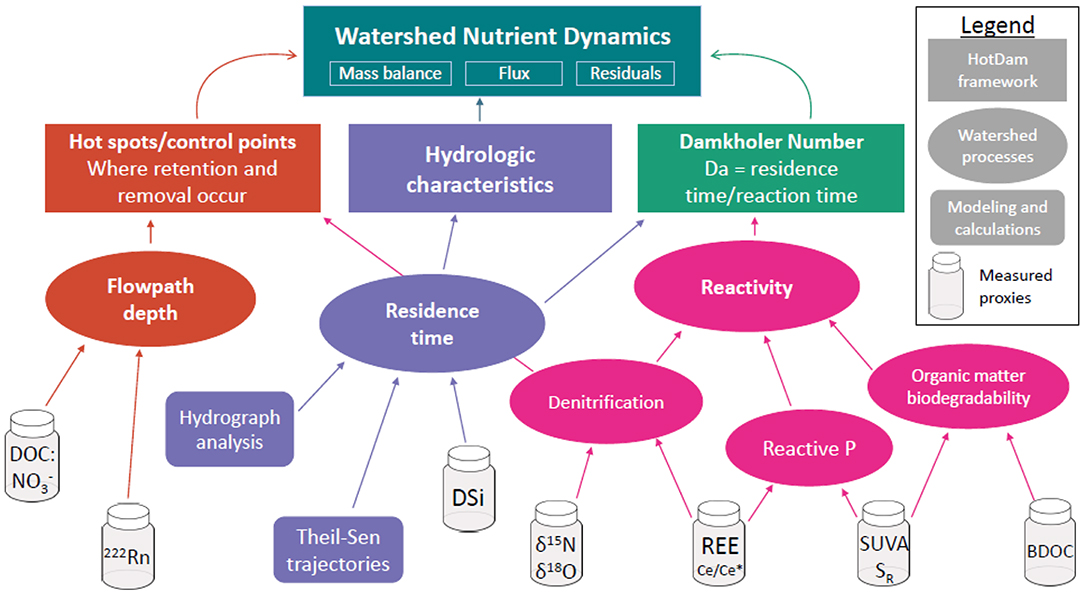
Figure 1. Conceptual diagram of the crossed-proxy approach we used to investigate controls on watershed-scale nutrient attenuation. We hypothesized that watershed-scale nutrient attenuation was a function of water flowpath (red), residence time (purple), and biogeochemical reactivity (pink).
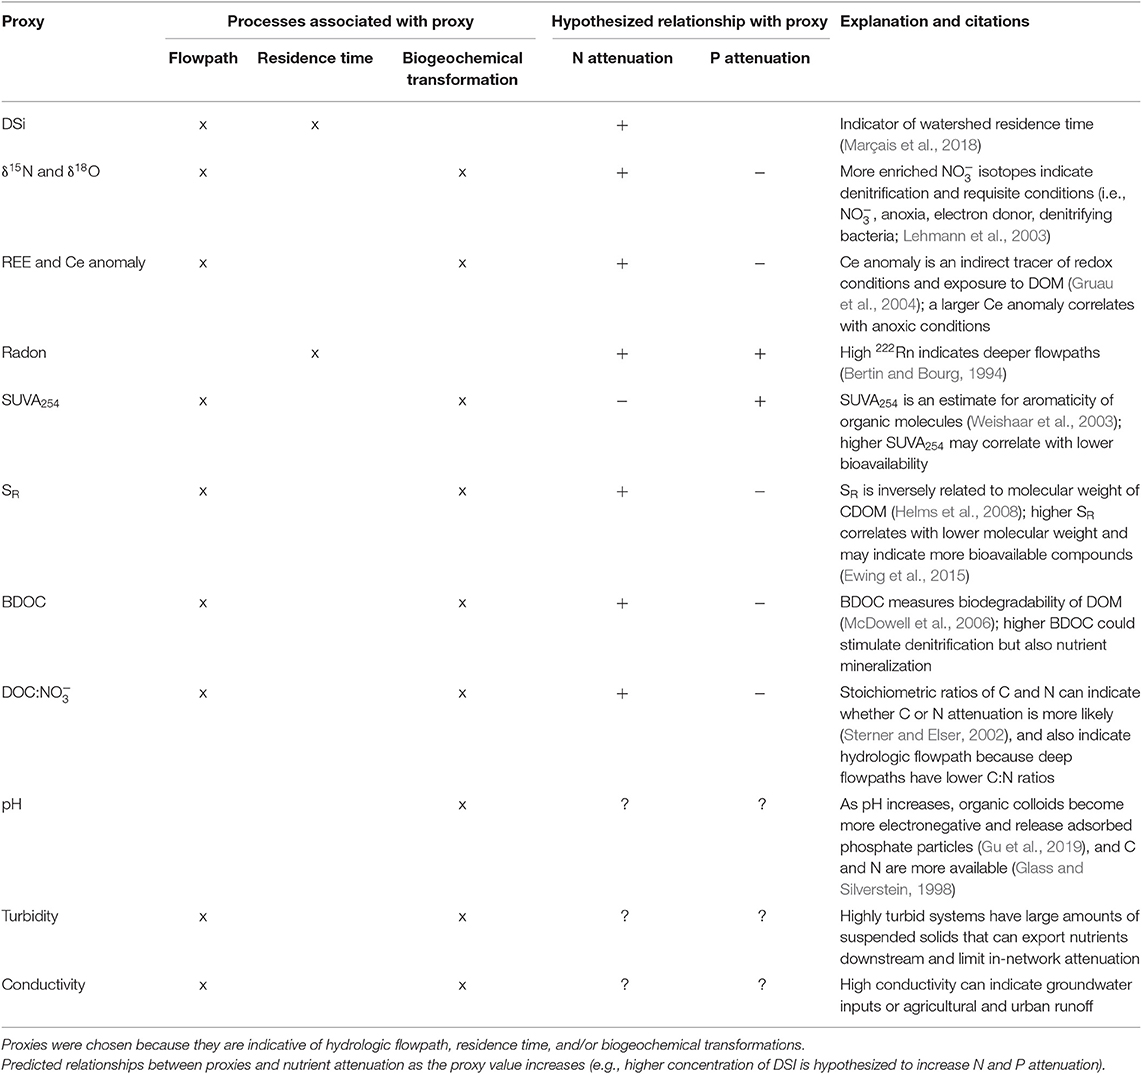
Table 1. List of proxies in our analysis and predictions of how they might affect nutrient attenuation.
Materials and Methods
Site Description and Experimental Design
The Brittany region of northwestern France has a rich repository of environmental data generated by academic and governmental research. For example, 27 of the 49 watersheds in this study had a nearby surface water monitoring station, which provided the concentration and discharge data necessary to calculate annual nutrient fluxes and long-term trends (Fovet et al., 2015; Thomas et al., 2019), and estimates of nutrient inputs were available for all watersheds (Poisvert et al., 2017). More generally, these intensively-managed, agricultural landscapes experience high but decreasing nutrient inputs, providing insight into how watershed-level nutrient fluxes respond to changes in nutrient loading (Galloway et al., 2008; Sutton et al., 2013; Poisvert et al., 2017; Dupas et al., 2018). The region is a part of the Armorican massif which is composed of metamorphic and igneous rock, primarily granite, schist, and micaschist (Aquilina et al., 2012; Goderniaux et al., 2013; Kolbe et al., 2016). The climate is temperate oceanic, with a mean annual temperature of 11.2°C and mean annual rainfall ranging from 1,400 mm in the west to 600 mm in the east, relatively well-distributed throughout the year (Gascuel-Odoux et al., 2010; Thomas et al., 2015, 2019). The area has an average stream density of about 1 km km−2, relatively shallow groundwater, and hydromorphic riparian soils that cover about 20% of the land surface (Mourier et al., 2008; Dupas et al., 2013; Marçais et al., 2018). Land use is dominated by row crops, indoor pig and poultry husbandry, and pastureland for cows (a mean of 80% agricultural cover across the study watersheds; Table S1), making Brittany one of the highest density regions in France and Europe for animal breeding (Gascuel-Odoux et al., 2010; Poisvert et al., 2017; Kim et al., 2019). N and P concentrations in many Brittany watersheds are decreasing, attributable primarily to reduction of point sources such as wastewater and feedlot effluent (Moatar et al., 2017; Abbott et al., 2018b; Dupas et al., 2018).
We analyzed stream water chemistry in 49 agricultural watersheds ranging from 2.38 to 2,080 km2 (Figure 2). Most of the watersheds were small to medium sized (mean area = 232 km2, median area = 18.2 km2), which was a consequence of Brittany's geography as a peninsula and our design to capture variability in headwater watersheds that make up the majority of the land-water interface (Burt and Pinay, 2005; Bishop et al., 2008; Heathwaite, 2010). Sampling points were typically near the coast, but above the zone of tidal influence (Figure 2). To capture variable flow conditions and seasonal differences, we collected samples during field campaigns in November 2015 (lowest flow), March 2016 (highest flow), and June 2018 (moderate flow; Figure S1). During each field campaign, we sampled all 49 sites within 1 week to capture watershed signals in comparable hydrological conditions. Seventeen of the watersheds were independent drainage basins and 32 were nested within the Couesnon and Rance watersheds (23 and 9 nested subwatersheds, respectively), allowing us to assess nutrient attenuation controls across a greater range of watershed sizes (Figure 2) and take advantage of previous research on those sites (Abbott et al., 2018a; Thomas et al., 2019). Though the sub-watersheds of the Couesnon and Rance watersheds are geographically close, they span the Brittany-wide range of observed land use and watershed characteristics (Table S1).
Figure 2. (a) Location of the 49 watersheds sampled during the 3 field campaigns (November 2015, March 2016, and June 2018) in Brittany, France. The Couesnon watershed is enlarged to show the 23 nested watersheds in greater detail. (b) Distribution of nutrient concentrations for dissolved organic carbon (DOC), nitrate (), and Molybdate-Reactive Phosphorus (MRP). Density plots above the Cartesian planes show seasonal shifts in nutrient concentrations along the x-axis.
Conceptual Approach
Nutrient retention and removal (hereafter “attenuation”) involve multiple hydrological and biogeochemical processes that are difficult to characterize because many of them are not directly observable due to long timescales or inaccessibility (e.g., groundwater processes) (Aquilina et al., 2018; Kolbe et al., 2019), 4-dimensional variation in subsurface characteristics (Sebilo et al., 2013; Musolff et al., 2015), and nutrient legacies (Van Meter and Basu, 2017; Ehrhardt et al., 2019). Consequently, to identify the ecological drivers of nutrient attenuation at watershed scales, we selected tracers or proxies that could be associated with hydrological flowpath, residence time, and biogeochemical reactions (Pinay et al., 2015; Abbott et al., 2016). Informed by the ecological control points concept, which assesses reaction rates in a spatiotemporal context (McClain et al., 2003; Bernhardt et al., 2017); and the Damköhler approach which assesses overall attenuation capacity (Ocampo et al., 2006; Oldham et al., 2013), we attempted to quantify biogeochemical and hydrological controls of N and P attenuation at watershed scales with a crossed-proxy approach (Abbott et al., 2016). We were particularly interested in why relationships between land use and stream nutrient concentrations and fluxes often break down at small scales (Burt and Pinay, 2005; Heathwaite, 2010), and how well watershed characteristics and easily measured proxies could predict nutrient attenuation and shine light on the relative importance of surface and subsurface attenuation processes (Ben Maamar et al., 2015; Dupas et al., 2019a; Kolbe et al., 2019) and hydrological time lags in soils, sediments, and aquifers (Thomas et al., 2012; Sebilo et al., 2013; Van Meter et al., 2016). To address these questions, we used a diverse set of physicochemical parameters described in detail in the Supplementary Information (SI: Proxy Toolbox) and briefly outlined below (Figure 1).
Proxies of Hydrological Residence Time and Flowpath
We used REEs, dissolved silica (DSi), and Radon-222 as proxies of where water went as it passed through the watershed, what conditions it experienced, and how long it stayed there (SI: Proxy Toolbox). The dissolved REE signature of water is initially set by the bedrock, but redox conditions can cause selective changes (Dia et al., 2000; Gruau et al., 2004). Specifically, cerium (Ce) readily oxidizes to Ce+4 and precipitates in the presence of oxygen (Moffett, 1990; De Carlo et al., 1997; Braun et al., 1998), creating a negative Ce anomaly in water that has experienced consistently oxidizing conditions (Gruau et al., 2004; Pinay et al., 2015). Because redox conditions and organic matter availability strongly influence N and P attenuation processes (e.g., denitrification; P adsorption by Fe-oxyhydroxides) (Stumm and Sulzberger, 1992; Pinay et al., 2015; Gu et al., 2019), we tested the relationship between the Ce anomaly of stream waters with nutrient attenuation at watershed scales. To assess water residence time, we used DSi concentration, which has been found to strongly correlate with subsurface residence time in many hydrogeological contexts (Ayraud et al., 2008; Marçais et al., 2018). Our DSi estimates of residence time, calculated using the empirical relationship derived in Marçais et al. (2018), agreed with estimates derived from chlorofluorocarbons (CFCs) and other dissolved gases from other studies in this region (Molénat et al., 2013; Ben Maamar et al., 2015; Kolbe et al., 2016). Radon-222 (222Rn) is another tool to constrain groundwater-surface water interactions (Bertin and Bourg, 1994; Cable et al., 1996; Stieglitz et al., 2010). A product of natural radioactive decay in igneous bedrock, 222Rn has a half-life of 3.82 days, making it an ideal tracer of deep flowpaths (Oyarzún et al., 2014). Because deep and long flowpaths increase the likelihood of encountering redox conditions suitable for N removal pathways such as denitrification, we measured 222Rn concentration in all stream water samples.
Proxies of Biogeochemical Transformation
To assess the degree of biogeochemical attenuation of nutrients and the relative importance of nutrient loading vs. nutrient removal, we quantified stable isotopes of (δ15N and δ18O), optical characteristics and biodegradability of dissolved organic matter (DOM), and nutrient stoichiometry (SI: Proxy Toolbox). Stable isotopes can indicate nutrient source and degree of biogeochemical processing (Mariotti et al., 1981; Lehmann et al., 2003; Malone et al., 2018). isotopes are particularly useful because is a dominant form of nitrogen in nutrient saturated ecosystems (Aber et al., 1998), organic and industrial fertilizers have distinct initial δ15N and δ18O (Bedard-Haughn et al., 2003; Lohse et al., 2013; Denk et al., 2017), and denitrification (both heterotrophic and autotrophic) strongly fractionates isotopes, enriching the residual δ15N and δ18O (Ayraud et al., 2006; Hosono et al., 2014; Malone et al., 2018; Sebilo et al., 2019). Therefore, we predicted that watersheds with isotopically-enriched would have higher N attenuation (Lehmann et al., 2003) or alternatively that they would have primarily organic fertilizer (Bedard-Haughn et al., 2003).
We used multiple characteristics of DOM to assess the degree of biogeochemical processing, nutrient source, and multi-elemental interactions. DOM has been described as a master variable that influences multiple nutrient cycles (e.g., it is a major source of inorganic N and P in nutrient-poor ecosystems) and general physicochemical conditions (McDowell, 2003; Zarnetske et al., 2018). DOM consists of dissolved organic carbon (DOC), N, P, and other nutrients in molecular forms ranging from complex molecules to simple compounds. The molecular composition of the DOM influences its biodegradability and photoreactivity, affecting its persistence in the ecosystem and influence on nutrient cycles (Wymore et al., 2018; Harjung et al., 2019). In addition to biodegradability incubations (details below), we calculated two optical proxies of DOM composition: specific ultra-violet absorbance at 254 nm (SUVA254) and the spectral ratio (SR) of slopes within the 275–290 and 350–400 nm range (Weishaar et al., 2003; Helms et al., 2008; Vonk et al., 2015). DOM concentration and characteristics can also indicate hydrological flowpaths because DOM is less abundant and more microbially altered in groundwater (Shen et al., 2015; Mu et al., 2017; Coble et al., 2019).
Nutrient stoichiometry, which is based on conservation of mass and constant proportions in many organisms, allows prediction of retention or release of different compounds based on availability and relative demand (Sterner and Elser, 2002; Allen and Gillooly, 2009; Helton et al., 2015). We used nutrient ratios as metrics of flowpath and biogeochemical transformation. For example, a negative relationship between DOC and has been widely observed in freshwater and estuarine ecosystems (Sterner and Elser, 2002; Taylor and Townsend, 2010; Stubbins, 2016). This relationship has been primarily attributed to stoichiometric controls, where abundant DOC promotes removal via denitrification since DOC is the most common electron donor and in high-DOC watersheds oxygen could be depleted more rapidly due to mineralization of DOC, resulting in more anoxic zones where denitrification can occur (Arango et al., 2007; Fork and Heffernan, 2013; Helton et al., 2015). Alternatively, the negative relationship between DOC and could simply be caused by a negative correlation between sources, where watersheds that favor deeper hydrological flowpaths have a carbon-poor and nitrogen-rich signal (Abbott et al., 2018b). Therefore, we predicted higher nutrient attenuation in catchments with greater DOC: ratios.
Hydrograph Metrics
The characteristics of river flow can indicate fundamental hydrological properties at watershed scales (Fang and Shen, 2017; Moatar et al., 2017). Higher peak flows during storm events can indicate greater near-surface runoff, while less responsive hydrographs and higher base flows between events can indicate longer residence time and greater proportion of subsurface flow (Feijoó et al., 2018; Kirchner, 2019). In this context, we calculated several, non-redundant hydrological metrics (see Table S2) based on daily stream flow: (i) the mean, (ii) coefficient of variation, (iii) skewness, (iv) kurtosis, (v) the autoregressive lag-one correlation coefficient (AR1), (vi) the amplitude, (vii) the phase of the seasonal signal (Archfield et al., 2014), and (viii) the W2. The W2 is an index of hydrologic reactivity that is the percentage of annual discharge that occurs during the highest 2% of flows (Walsh and Lawler, 1981; Moatar et al., 2013, 2017).
Field and Laboratory Analysis
To quantify the proxies described above, we collected water samples and measurements from 49 watersheds throughout Brittany, France (Figure 2). We selected the 49 sites based on accessibility, availability of historical data (nutrient input and export chronicles and land-use data), and to cover a range of watershed sizes. Field campaigns were in early November of 2015, late March of 2016, and late June of 2018.
At each site, we collected one 5-L sample of stream water for immediate sensor readings and eight smaller samples for laboratory analyses. From the first sample, we used a handheld multiparameter probe (YSI, incorporated; Yellow Springs, USA) to measure dissolved oxygen, redox, pH, temperature, and turbidity. We determined SUVA254 and SR from the same sample with a field-deployable spectrophotometer (s::can; Vienna, Austria). For the lab analyses, we immediately filtered subsamples using a 50 mL syringe and two 250 mL filter towers. We used a 0.2 μm cellulose acetate syringe filter to prepare samples for the analysis of cations, REEs, and isotopes. For the first filter tower, we used a 0.45 μm cellulose acetate filter to prepare samples for Molybdate-Reactive Phosphorus (MRP), anions, and DOC analysis. For the second tower, we used a 0.7 μm glass fiber filter, which removes most particulates but allows many bacteria to pass (Vonk et al., 2015), to prepare samples for the biodegradable DOC (BDOC) bioassay experiment. All filters, towers, and syringes were pre-rinsed with de-ionized water and flushed with sample prior to collecting final samples. We also collected an unfiltered, bubble-free 200 mL sample for 222Rn analysis. These samples were analyzed for 222Rn within 12 h of sampling using a radon detector (Durridge RAD7 analyzer, Billerica, USA), with most samples analyzed immediately in the field. Delayed samples were adjusted for time lags to correct 222Rn decay. The 222Rn values for the spring sampling were lost due to operator error.
MRP concentrations were determined colorimetrically via reaction with ammonium molybdate (Murphy and Riley, 1962), with a precision of ±4 μg l−1 (Gu et al., 2018). Nitrate isotope samples were frozen immediately and shipped to the UC Davis Stable Isotope Facility for analysis of δ15N and δ18O of by bacterial denitrification assay (McIlvin and Casciotti, 2011). Isotope ratios of δ15N and δ18O were measured using a ThermoFinnigan GasBench + PreCon trace gas concentration system connected to a ThermoScientific Delta V Plus isotope-ratio mass spectrometer (Bremen, Germany) with a precision of ± 0.4% and 0.5% for δ15N and δ18O, respectively. Cations and REE samples were analyzed by inductively coupled plasma mass spectrometry (ICP-MS; Agilent 7700×, Santa Clara, USA). Calibration curves and accuracy controls were performed following best practices (Yeghicheyan et al., 2013), using river water reference material for trace elements with a wide compositional range (SLRS-5, National Research Council of Canada). De-ionized water purified with a Milli-Q (Millipore, Darmstadt, Germany) system was used for blanks. Total relative uncertainties were ±5%.
We conduced BDOC bioassay experiments using four replicates of 100 mL aliquots of filtered stream water for each site and incubated in a dark incubation chamber for 28 days at 20°C (Vonk et al., 2015). We sampled each replicate at the beginning (t0) and end of the incubation (t28). The t0 samples were acidified with 6M HCl to a pH of 2 and stored in the refrigerator at 4°C until the t28 sampling. After the t28 samples were acidified, the t28 and t0 samples were analyzed together for DOC (Shimadzu TOC-5050A, Kyoto, Japan, precision ±5%) within 1 week. We calculated the percent BDOC for each sample using the following equation:
where DOCt0 and DOCt28 are the concentrations of DOC at t0 and t28. We reported the mean of the 4 replicates as the overall BDOC value per sampling for each site.
Watershed Characteristics and Nutrient Trends
To test how climate and landscape characteristics affect nutrient attenuation, we delineated all watersheds using ArcMap (ESRI) and extracted landscape characteristics including vegetation cover, land use, bedrock type, river network density, and flow regulation. Mean annual temperature and precipitation were downloaded from the WorldClim database (Fick and Hijmans, 2017) using the “raster” package in R (Version 3.5.2; R Core Team, 2018). To obtain long-term nutrient and hydrological discharge data, we selected monitoring stations using the “Near” tool in ArcMap. We obtained long-term data for 27 of the 49 watersheds and calculated annual runoff, nutrient flux, and attenuation for those 27 watersheds using 10 years of flow and water chemistry data ( and TP) from July 2008–July 2018. We calculated the eight flow metrics described above from the flow time series using the EflowStats R package.
We calculated mean annual specific discharge by averaging the flow per year and dividing by watershed area. We calculated N and P fluxes exported from the watershed using the discharge-weighted concentration method (Moatar et al., 2013; Raymond et al., 2013):
where Ci and Qi represent concentration and runoff at the time of sampling, is mean annual runoff, and k is a conversion factor to obtain fluxes in kg N or P ha−1 yr−1. We calculated apparent attenuation of and TP using the following mass-balance equation:
where Flux is calculated as described above (Equation 2) and Surplus is the watershed-specific nutrient surplus based on fertilizer inputs and crop yields (Poisvert et al., 2017; Dupas et al., 2018).
Because not all watersheds had nearby water quality and discharge stations, we calculated another metric of nutrient attenuation: the residuals from a regression of or TP concentration against percent agricultural cover. While this metric is much coarser than the mass-balance estimates of attenuation (Equation 3), it provided an independent metric of attenuation that was quantifiable even for watersheds without discharge and long-term data. Additionally, it allowed calculation of seasonal dynamics in the relationship between land use and nutrient concentration, whereas the mass-balance-based nutrient attenuation metric provided a single value derived from the entire decadal time series. We reasoned that because most nutrient inputs in this region come from agricultural activity, watersheds with nutrient concentrations above the trend line would be less attenuative and points below the line would be more attenuative, comparatively to the average data set (Figure 3). We used concentration for these calculations because it accounted for 92% of measured total N, and TP to account for all measured P (Figure S2).
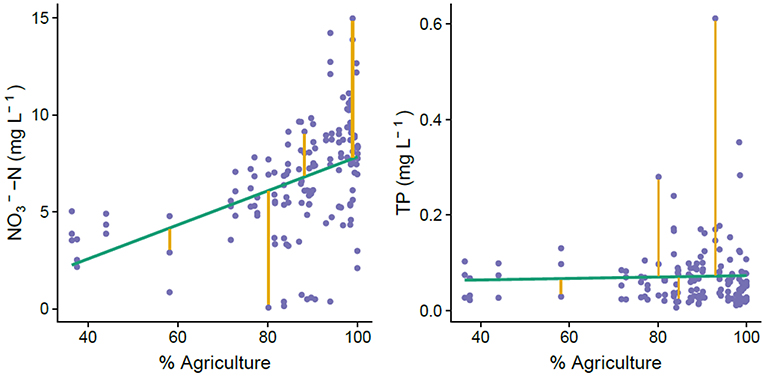
Figure 3. Visualization of how we calculated residuals in the relationship between agricultural land use and nutrient concentrations for each catchment. Because agriculture is the predominant nutrient source in the Brittany region, we used departure from the relationship between agriculture and nutrient concentration as a metric of nutrient attenuation capacity. Points above the regression line represent less attenuation capacity because there is more nutrient in the system than would be expected with this rough estimate of nutrient inputs.
One weakness of both the mass-balance and residual metrics of nutrient attenuation is that apparent attenuation can occur if significant time lags exits between nutrient inputs and export (Basu et al., 2011; Ehrhardt et al., 2019). Over the past two decades, agricultural practices have improved and many nutrient point sources have been eliminated in western France (Poisvert et al., 2017; Abbott et al., 2018b; Dupas et al., 2018), and we reasoned that the slope of the decline in nutrient concentration would be negatively correlated with hydrological nutrient legacy (i.e., watersheds with more groundwater and soil nutrient storage would have slower rates of nutrient decrease after inputs ceased or were reduced). For the 27 watersheds with long-term data, we calculated Theil-Sen slope estimates using the Siegel method, which provides an estimate of change through time that is highly robust to extreme values due to real variability (e.g., during high or low flows) or analytical errors (Abbott et al., 2018b). We correlated these slope estimates with the nutrient attenuation metrics to assess how much of the apparent attenuation could be due to hydrological nutrient legacy rather than more permanent removal and retention processes.
Quantifying Spatial Stability and Identifying Drivers of Nutrient Attenuation
We determined the persistence of spatial patterns through time for proxies and water chemistry across watersheds using the spatial stability concept (Abbott et al., 2018a; Dupas et al., 2019b). The Spearman rank correlation between each pair of sampling dates for each parameter indicates how much of the spatial structure is preserved through time. Spatial stability of water chemistry can result from high spatial variability and synchronous temporal variability (Abbott et al., 2018a; Dupas et al., 2019b).
To disentangle the controls on nutrient attenuation, we regressed each proxy against nutrient attenuation (mass balance and residuals) and fluxes. We used pairwise correlation and multiple linear regression (MLR) to identify which proxies were the most closely associated with nutrient attenuation. Because many of the proxy data were not linearly related with attenuation and fluxes, we used Spearman correlations to quantify the strength of relationships. For the MLR models we grouped predictors into two categories: biogeochemical proxies and hydrological and watershed characteristics (hereafter referred to as the proxy and hydro models, respectively). To test our hypotheses about controls on nutrient attenuation, we categorized each predictor based on whether it was most associated with hydrological and watershed characteristics or biogeochemical reactions (Figure 1, Table 1). We standardized all predictors (mean = 0 and standard deviation = 1) to allow comparison of parameter coefficients as a measure of relative contribution to model prediction of the response variable (nutrient mass balance estimates), and we checked for multicollinearity among predictors using the variance inflation factor (Abbott and Jones, 2015). We ran the models for each category (i.e., proxy and hydro models) and selected the most parsimonious model for each by stepwise regression. Though model selection techniques continue to be controversial in ecology (reviewed in Malone et al., 2018), our primary goal was to assess relative influence of the major predictors. As such, we simply discuss the overall trends (e.g., what parameters appeared repeatedly in multiple models) of individual and multiple regression results (Tables 2, 3) and we abstain from interpreting the inclusion or exclusion of less influential predictors.
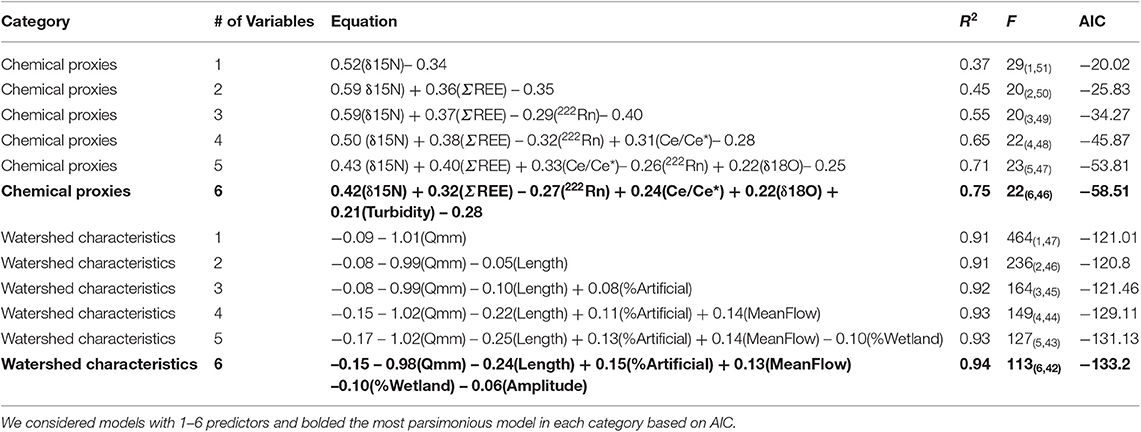
Table 2. Multiple linear regression models for N attenuation using chemical proxies and watershed characteristics.
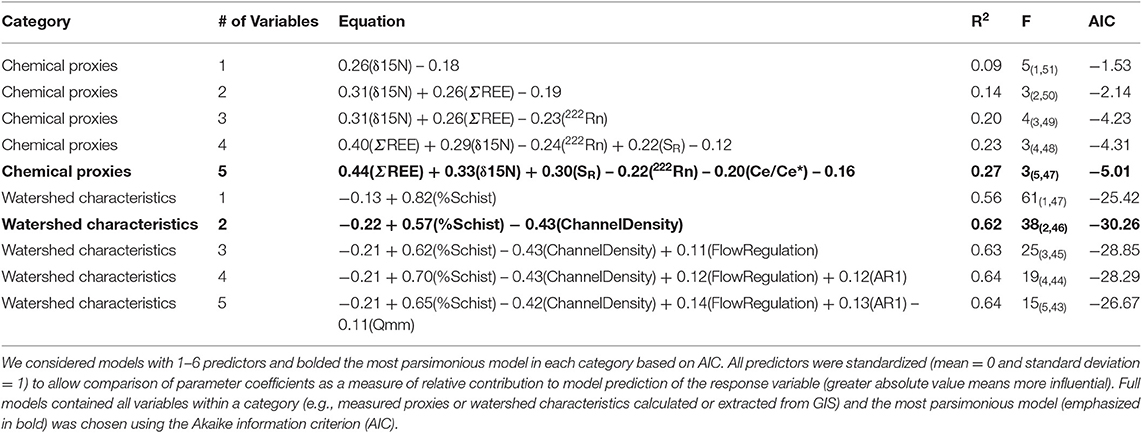
Table 3. Multiple linear regression models for P attenuation using chemical proxies and watershed characteristics.
Results
Nutrient Context and Spatial Stability of Water Chemistry
The three samplings captured distinct hydrological conditions, with low but variable discharge among sites in the fall sampling (November of 2015), highest discharge in the spring (March of 2016), and low and consistent discharge among sites in the summer (June of 2018; Figure S1). Nutrient concentrations and stoichiometry varied substantially across the watersheds and through time (e.g., 0–15 mg L−1 of N- and 0–0.6 mg L−1 of MRP). We observed a negative relationship between DOC and and a positive relationship between DOC and MRP, which varied somewhat seasonally (Figure 2b, Figure S1). Inorganic forms of N and P dominated total concentrations for these nutrients across watersheds, with making up 93% of total N and MRP making up 74% of TP (Figure S2).
For the 27 watersheds with decadal nutrient concentration data on a monthly time step, the long-term trends were fundamentally different for C, N, and P (Figure 4). Theil-Sen slope estimates for DOC concentration indicated slight increases through time for 75% of the watersheds, decreases for concentration for all but three watersheds, and no change for and TP concentrations (Figure 4).
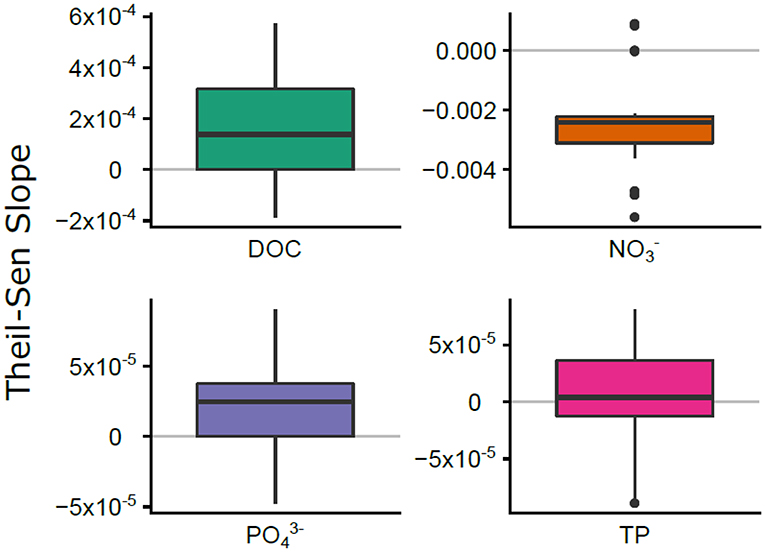
Figure 4. The distribution of Theil-Sen nutrient slopes for C, N, and P for the 27 watersheds with long-term nutrient data. Horizontal gray lines indicate zero slope (no temporal trend).
Spatial stability (persistence of spatial rankings through time) varied substantially among proxies and solutes (Figure 5). Conductivity, δ15N, TP, DSi, and many major ions showed high spatial stability (i.e., more than half the spatial pattern among the three sampling dates was preserved; ρ > 0.7). All the DOM properties, 222Rn, O2, temperature, and showed very low stability (i.e., ρ < 0.4) indicating substantial seasonal and potentially interannual variability, with the rest of the parameters showing moderate stability (Figure 5).
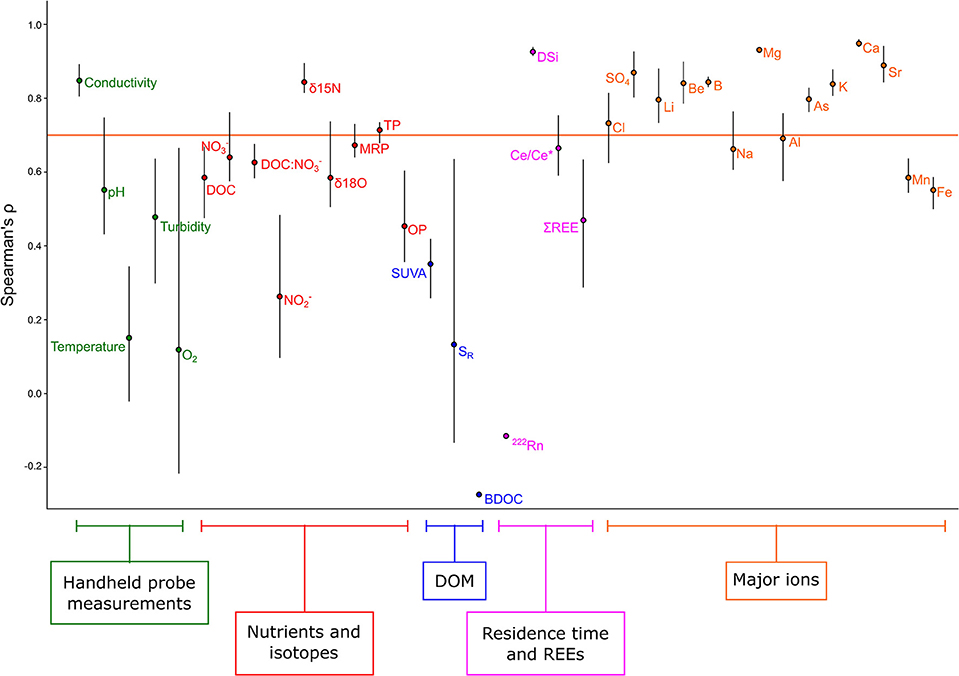
Figure 5. Spatial stability of biogeochemical tracers and chemical concentrations across all 49 watersheds. Parameters are grouped thematically by color. Solutes with a Spearman's ρ above the horizontal line maintain more than half the spatial pattern for that parameter in pairwise comparisons among the three sampling dates.
Differences in Attenuation and Fluxes in Agricultural Watersheds
Median nutrient attenuation as calculated by mass balance was 58.1% for N and 98.6% for P across the watersheds. N and P mass balance results were weakly correlated (R2 = 0.18, p < 0.001), indicating that watersheds with high attenuation for N tended to also have high attenuation for P (Figure 6). Results for N mass balance showed substantially higher variability than P mass balance, ranging from −2 to 88.4% for N but only 96.1 to 99.5% for P. As another estimate of nutrient attenuation, we calculated the residuals of the regression of percent agricultural cover and measured and TP concentrations (Figure 3). was significantly correlated with agricultural cover (R2 = 0.21, p < 0.001) and residuals from that relationship ranged from −7.23 to 6.93 mg L−1 with a median of −0.37 mg L−1. TP was not significantly correlated with agricultural cover (R2 = 0.001, p = 0.70) and residuals from that non-significant relationship ranged from −0.54 to 0.047 mg L−1 with a median of 0.016 mg L−1. N residuals showed a weak, positive correlation with N mass balance estimates (R2 = 0.15, p < 0.001; Figure 6), but we observed no relationship between P residuals and P mass balance (Figure 6).
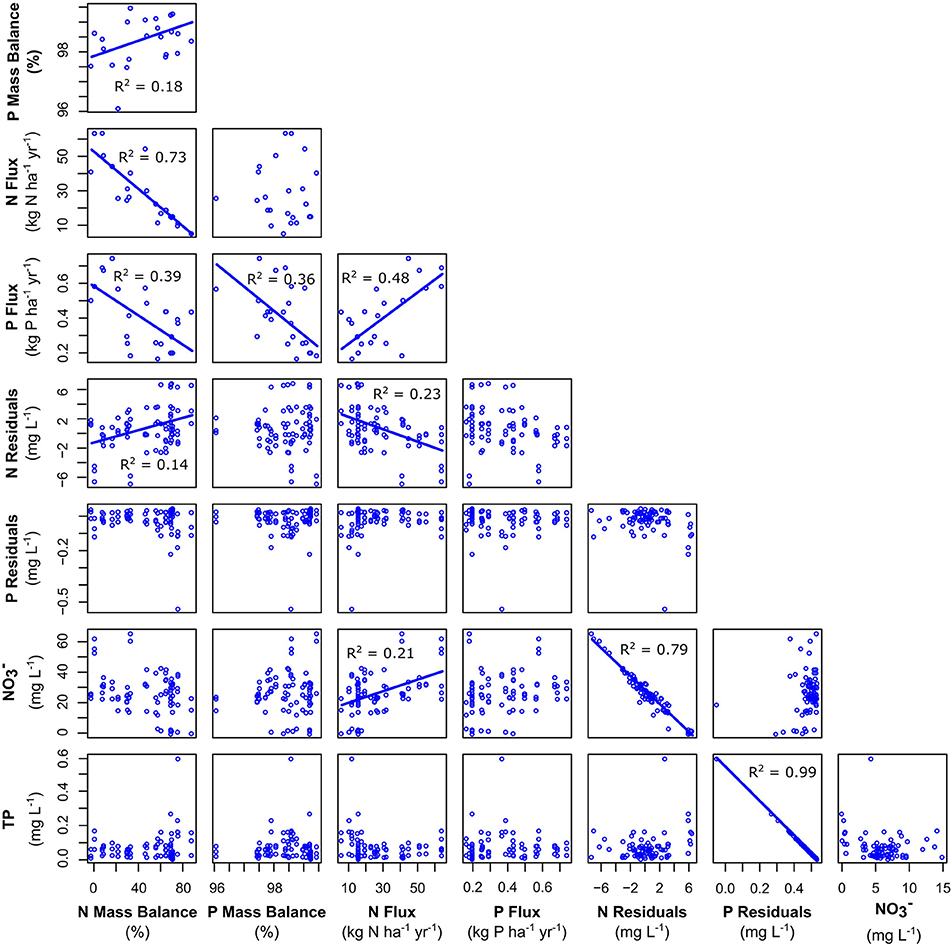
Figure 6. Relationships among our metrics of nutrient attenuation. Here, “Mass Balance” refers to the mass balance estimates of attenuation, “Flux” refers to the fluxes of those nutrients from the watersheds based on concentration and discharge data, and “Residuals” refers to the remaining variation in nutrient concentration after accounting for differences in agricultural land cover (Figure 3). Trend lines for significant correlations (p < 0.05) are shown and R2-values are reported.
N fluxes varied by an order of magnitude (6.1–64 kg N ha−1 yr−1) and were negatively correlated with mass balance estimates (R2 = 0.73, p < 0.001), with fluxes increasing as mass balance estimates decreased (Figure 6). P fluxes varied by a factor of 4 (0.17–0.69 kg P ha−1 yr−1) and were negatively correlated with P mass balance (R2 = 0.36, p < 0.001), but there was no relationship with P residuals.
Individual Predictors of Nutrient Attenuation
Based on the pairwise Spearman correlations with hydrological parameters, annual runoff was strongly negatively correlated with the N and P mass balance estimates (ρ = −0.89 and −0.41, respectively), and the hydrological reactivity index (W2) was strongly positively correlated with N and P mass balance (ρ = 0.60 and 0.32, respectively). For biogeochemical proxies, N mass balance estimates was correlated with δ15N and δ18O, 222Rn, Ce/Ce*, and DOC: stoichiometry (ρ > |0.40|) and had a weaker relationship with SUVA254 (ρ = −0.27; Figure 7). N residuals showed similar results for δ15N and δ18O (ρ > 0.40) but had a much weaker relationship with 222Rn, a much stronger relationship with DOC: (ρ = −0.20 and 0.71, respectively), and no significant relationship with Ce/Ce* or SUVA254. N fluxes showed similar but opposite relationships as mass balance, and a weak relationship with DSi was also observed (ρ = 0.23). P mass balance estimates was positively correlated with δ15N and δ18O (ρ = 0.41 and 0.29, respectively; Figure 8) and negatively correlated with 222Rn (ρ = −0.35). P residuals were strongly negatively correlated with δ15N and 222Rn (ρ = −0.52 and −0.44, respectively) and had weaker relationships with δ18O, Ce/Ce*, and SR (ρ < |0.25|). The P fluxes had similar but opposite relationships with the same proxies as mass balance, in addition to a negative relationship with DOC: (ρ = −0.40).
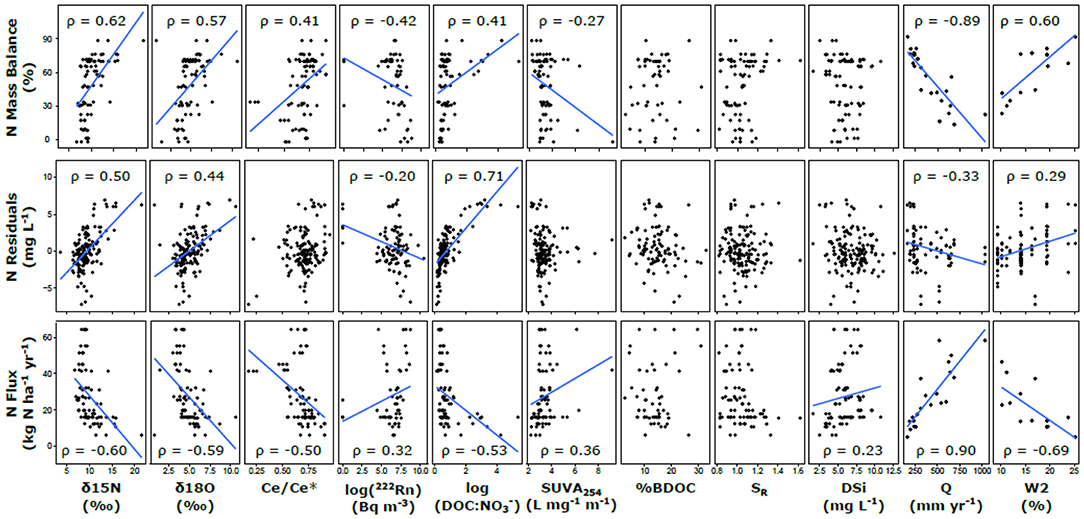
Figure 7. Correlation analysis of N attenuation metrics and biogeochemical proxies. Trend lines are shown when p < 0.05 for Spearman rank correlations between the parameters (relationships are not necessarily linear). This non-parametric test is robust to non-linearity in the relationships, which are only depicted linearly to indicate direction of the relationship.
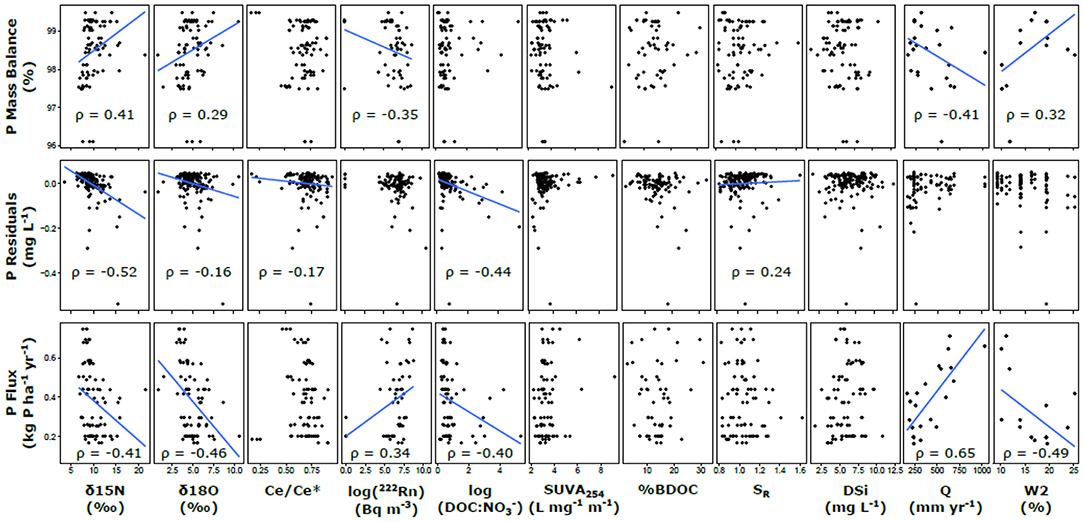
Figure 8. Correlation analysis of P attenuation metrics and proxies. Trend lines are included for significant Spearman correlations (p < 0.05) to test for potential relationships.
To test how nutrient legacy could be related to apparent nutrient attenuation, we correlated the decadal Theil-Sen concentration slopes (Figure 4, Figure S3) with estimates of nutrient attenuation. N mass balance estimates and residuals were positively correlated with decadal trends for , indicating that the watersheds experiencing the slowest decreases in through time tended to have higher apparent attenuation (R2 = 0.17 and 0.10, respectively, p < 0.05; Figure S3). N flux was negatively correlated with decadal trends, indicating that watersheds with faster decreases in had higher N fluxes (R2 = 0.25, p < 0.05). slopes were positively correlated with P mass balance estimates (R2 = 0.15, p < 0.05), indicating that the watersheds with the slowest decreases or greatest increases in had higher apparent P attenuation, but slopes were not significantly correlated with P residuals. TP fluxes were negatively correlated with trends (R2 = 0.27, p < 0.05).
Multiple Linear Regression Models of Nutrient Attenuation
For the hydro MLR models (only hydrological and watershed characteristics parameters), the models with only one predictor explained 91% of the variance explained by annual runoff for N mass balance estimates and 56% of the variance explained by the abundance of schist bedrock for P mass balance (see Tables 2, 3). The most parsimonious (based on AIC) hydro model for N mass balance estimates also included other hydrological and land use variables (e.g., mean annual flow and amplitude, and % artificial land cover, wetlands, and stream length), which slightly enhanced the model performance (adjusted R2 = 0.94, ΔAIC = 12.19). For P mass balance estimates, the initial hydro model (i.e., only relative abundance of schist) was improved by adding river density (adjusted R2 = 0.62, ΔAIC = 4.84). The final hydro model results are shown in Figure 9.
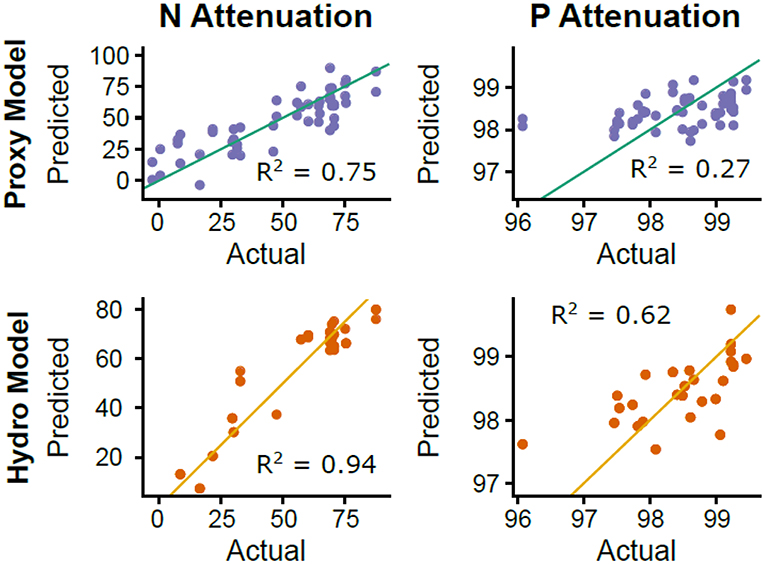
Figure 9. N and P attenuation (based on mass balance estimates reported as percentages) predicted by hydrological and watershed characteristics, and biogeochemical proxies. The “hydro” model included hydrological and watershed characteristics and the “proxy” model included biogeochemical proxy data from the three field campaigns (see Table 2).
The proxy MLR models that used biogeochemical proxies to predict attenuation did not explain as much variance as the hydro models, but they indicated other processes besides runoff and bedrock type that are important drivers of attenuation. For example, the single most important proxy for N was δ15N, which accounted for 37% of the variation in N mass balance estimates. However, the most parsimonious model included 5 other proxies (ΣREE, 222Rn, Ce/Ce*, δ18O, and turbidity), together accounting for 75% of the variation in N mass balance estimates. For P mass balance estimates, the single most important proxy was also δ15N, accounting for 9% of the variation. However, the most parsimonious model included 4 other proxies (ΣREE, SR, 222Rn, and Ce/Ce*), together explaining 27% of the variation in P mass balance estimates. Furthermore, the shared proxies between N and P attenuation models (e.g., δ15N, ΣREE, 222Rn, and Ce/Ce*) had surprisingly similar relationships in both direction and magnitude, apart from Ce/Ce* which had a positive relationship with N mass balance estimates and a negative relationship with P mass balance estimates. Proxy model results are shown in Figure 9.
Discussion
We hypothesized that hydrological properties, surface and subsurface characteristics, and biogeochemical conditions would interact to determine nutrient attenuation at watershed scales. Based on our analysis of 49 watersheds, 27 of which had long-term nutrient and discharge estimates, hydrological properties set the initial attenuation capacity, with secondary effects from biogeochemical conditions and land-use parameters. These results corroborate findings from other regions where runoff strongly controls nutrient attenuation and flux (Covino et al., 2010; Zarnetske et al., 2018; Ehrhardt et al., 2019). However, we point out that runoff is a high-level parameter that interacts with other hydrological metrics, watershed characteristics, and biogeochemical reactions at multiple spatiotemporal scales. Below, we discuss how runoff influences and is influenced by many ecological dynamics including long-term nutrient legacies, redox conditions, and land use, and how this could inform our local and global efforts to solve eutrophication.
Tradeoffs Between Nutrient Attenuation and Nutrient Recovery
At larger spatiotemporal scales, untangling proximate and ultimate drivers of nutrient flux and attenuation is exceedingly difficult because socioecological systems co-evolve based on shared and dynamic conditions (Thomas et al., 2015; Bogaart et al., 2016; Malone et al., 2018). Consequently, at medium to large scales, many risk factors for nutrient flux are co-linear, including climate, land use, soil type, ecosystem stature, and flow regime (Knoben et al., 2018; Lin et al., 2019; Smits et al., 2019). This has been observed within the boundaries of our study region, where agriculture tends to be more intense in areas underlain with micaschist, which is better suited for mechanical agriculture, but also more prone to nutrient export because of its soil and topographic properties (Thomas et al., 2015).
Of all the hydrochemical parameters we measured, annual runoff had the strongest single relationship with our long-term nutrient attenuation metrics (mass-balance, residuals, and nutrient flux). While this correlation is not surprising for flux, it reinforces a growing understanding that the routing and amount of lateral water flow fundamentally regulates hydrological connectivity and nutrient transport (Dupas et al., 2018; Zarnetske et al., 2018). Perhaps more interestingly, runoff was correlated with long-term trends in nutrient concentration (i.e., rate of nutrient recovery) in our dataset. This means that the high-runoff watersheds that have low nutrient attenuation tend to recover faster when nutrient inputs are decreased. This suggests that hydrological attenuation (Ehrhardt et al., 2019) is an important contributor to nutrient attenuation in these watersheds. It also makes sense in the context of soil and groundwater nutrient legacies—i.e., a system with more flow can be flushed faster—depending on the ratio between storage and flow (Basu et al., 2011; Van Meter and Basu, 2017; Abbott et al., 2018b). However, this inverse relationship between attenuation and recovery in agricultural watersheds raises the question of whether there is an inevitable tradeoff between nutrient resistance (i.e., nutrient removal capacity) and nutrient resilience (i.e., fast recovery rates; Goyette et al., 2018; Dupas et al., 2019a). Thinking comparatively between the two main nutrients in our study, the higher P attenuation values, which we know are associated with accumulation in soil and sediment rather than permanent removal (Hansen et al., 2002; Sharpley et al., 2013), and the much lower ratio of stock to flux (i.e., watershed P >> annual export of P) suggests that P follows this prediction of high resistance and extremely low resilience (Goyette et al., 2018; Haas et al., 2019).
Subsurface Processes as Key Regulators of Surface Concentrations and Fluxes
Though one valid interpretation of our findings is that hydrological dynamics, especially flow and river network density, dominate nutrient attenuation capacity, several lines of evidence suggest that a more complex range of factors regulates nutrient behavior in these watersheds. Water residence time, a fundamental ecohydrological property (Zarnetske et al., 2011; Kolbe et al., 2016; Thomas et al., 2016) was not associated with our attenuation metrics nor with recovery rates based on the long-term trends. This is likely because only a portion of the total residence time has the requisite conditions for biogeochemical processes to retain or remove nutrients. This concept, termed exposure time (Murphy et al., 1997; Oldham et al., 2013; Pinay et al., 2015), is central to the HotDam framework, because storage or transport in nonreactive zones only affects hydrological attenuation (i.e., time lags; Ehrhardt et al., 2019), not biogeochemical attenuation or removal (Abbott et al., 2016). For example, groundwater denitrification increases with depth in ~80% of watersheds where it has been quantified because of more abundant electron donors in deeper, unweathered bedrock (Kolbe et al., 2019). This dynamic also relates to the previously discussed relationship with runoff, because weathering rates are higher when there is greater water flow through the watershed (Marçais et al., 2018). Greater weathering could depress the vertical horizon where electron donors can sustain denitrification (Kolbe et al., 2019), meaning that higher runoff watersheds not only have shorter residence times, but that their biogeochemical reaction capacity may be lower.
Another indicator that annual runoff is not the sole control of nutrient dynamics is that several biogeochemical proxies associated with deep flowpaths and groundwater were strongly related to both N and P attenuation metrics. Nitrate isotopes, 222Rn, REEs, and DOC: were influential proxies of attenuation and fluxes, pointing to the importance of deep flowpaths and anoxia as drivers of nutrient removal (i.e., denitrification) and attenuation via biological and abiotic processes (Gu et al., 2018, 2019; Kolbe et al., 2019). While P is typically not transported through deep groundwater flowpaths because of physicochemical properties (Hansen et al., 2002), P varies systematically with discharge in many catchments with total P often increasing and MRP often decreasing as flow increases (Moatar et al., 2017). Additionally, excess in groundwater can trigger sulfate release and iron oxidation in the presence of pyrite, potentially mobilizing P via links with iron and sulfur in some environments (Smolders et al., 2010; Tang et al., 2016; van Dijk et al., 2019). In watersheds that are discharging their nutrient legacies (i.e., current nutrient loading < historical nutrient loading), concentrations are often higher in groundwater than in near-surface water (Abbott et al., 2018b; Dupas et al., 2018), which could create an indirect link between deep water flow and P attenuation dynamics (Dupas et al., 2015).
A surprising interaction between hydrology and biogeochemistry was the positive relationship between the W2 index (percentage of cumulative discharge that occurs during the highest 2% of daily discharge values) and nutrient attenuation. Contrary to major predictions of ecosystem ecology that nutrient attenuation decreases with hydrological pulses or floods (Fisher et al., 1998; Raymond et al., 2016; Wollheim et al., 2017), the watersheds in this region with higher W2 were relatively more attenuative of nutrients. However, it is important to note that Brittany has temperate hydrology with few floods (Thomas et al., 2019), meaning that the watersheds with relatively higher W2 are still not particularly flashy or hydrologically reactive compared with other regions (Moatar et al., 2013). In this instance, the positive correlation between nutrient attenuation and the W2 index could be associated with the weathering mechanism described previously (i.e., watersheds with a larger proportion of surface flow vs. groundwater flow could have less weathered and more reactive aquifers; Kolbe et al., 2019) or it could be associated with sediment legacies in and near the river network. In this region and many others, large stocks of nutrient-laden sediments have accumulated in streams, riparian zones, and small reservoirs (Song and Burgin, 2017; Feijoó et al., 2018). These sediments can be important or even primary sources of nutrients, particularly during low flow periods (Dupas et al., 2015; Gu et al., 2018). Watersheds with more powerful or more frequent floods could have flushed out these sediments, effectively increasing net nutrient attenuation by reducing internal loading.
Together, these multi-proxy findings suggest that subsurface characteristics, including hydrological flowpaths and the location of biogeochemical activity, are fundamental to regulating nutrient attenuation and export at watershed scales.
Comparison With Nutrient Attenuation in Different Biomes and Land Use Regimes
The high level of variability in N attenuation that we observed has also been observed in different climatic and anthropogenic contexts. Watersheds in the Northeastern United States have mass balance estimates that range from 9 to 74% (Campbell et al., 2004). While point-source P loading is relatively well-constrained (Kronvang et al., 2007; Grizzetti et al., 2012), watershed-scale estimates of P mass balance remain less common (Withers and Jarvie, 2008; Sharpley et al., 2013; Goyette et al., 2018). In natural ecosystems, P attenuation is often very high, though this varies strongly with ecosystem age and disturbance regime as well as stoichiometric conditions (Vitousek and Reiners, 1975; Verry and Timmons, 1982; Vitousek, 2004; Elser et al., 2007). In contrast, urban watersheds are often extremely leaky to P, with P mass balance estimates ranging from −7 to 74% with a mean of 22% (Hobbie et al., 2017). These urban P losses are attributable to the prevalence of impervious surfaces that decrease residence time, increase flashiness of water flow, and increase fluctuations between oxic and anoxic conditions (Hale et al., 2015, 2016; Blaszczak et al., 2019).
Preventing Rather Than Curing Nutrient Incontinence
The Anthropocene is characterized by concurrent and connected socioecological crises caused by human interference with many of the Earth's biological and abiotic cycles (Vitousek et al., 1997; Steffen et al., 2015; Abbott et al., 2019; Lade et al., 2019). Many proposed solutions to these crises seek to manage ecosystem response rather than modify human activity, essentially treating human demand as immutable (Jaggard et al., 2010; Garnier et al., 2014; Abbott et al., 2019). This tendency to cure rather than prevent is particularly prevalent in the fight against eutrophication, where researchers, policymakers, and land managers are going to great lengths to retain or remove anthropogenic nutrients in virtually every component of the watershed (Sharpley et al., 2008; Pu et al., 2014; Bol et al., 2018; Wollheim et al., 2018). Given how critical food production is to human wellbeing (Foley et al., 2011; Sutton et al., 2013; Rasul, 2016), these efforts are certainly justified and some nutrient mitigation practices such as cover crops, no-till cultivation, hedgerows, and riparian concentration can improve nutrient attenuation and enhance other ecosystem benefits (Hansen et al., 2000; Roley et al., 2016; Pinay et al., 2018; Thomas and Abbott, 2018). However, we believe that managing ecosystems to enhance nutrient removal will never solve eutrophication alone. Instead, a growing body of research suggests that managing human nutrient demand—i.e., reducing nutrient inputs into the Earth's watersheds—while also protecting nutrient attenuation capacity across the land to water gradient is the only comprehensive solution to eutrophication (Garnier et al., 2014; Bol et al., 2018; Leaf, 2018; Dupas et al., 2019a; Le Moal et al., 2019).
One reason for our position that nutrient prevention should be prioritized over attenuation is simply the immense fertilization capacity of our global society (Gruber and Galloway, 2008; Seitzinger et al., 2010). The capacity of ecosystems to assimilate or remove N and P can easily be overwhelmed by human nutrient inputs, and recovery from nutrient saturation can take decades to millennia (Dupas et al., 2018; Goyette et al., 2018; Haas et al., 2019; Randall et al., 2019). This raises the question of how can nutrient inputs be decreased while also achieving the sustainable development goal of eliminating malnutrition? One solution would be to only use N and P fertilizers to feed humans (Sutton et al., 2013). While population is projected to increase through 2050, most of the projected increases in global nutrient use stems from shifts in diet and per-capita consumption rather than population growth per se (Seitzinger et al., 2010; Liu et al., 2012; Sutton et al., 2013; Godfray et al., 2018). More than half of the global human nutrient and water footprints are due to livestock (Pelletier and Tyedmers, 2010; Herrero et al., 2013; Mekonnen and Hoekstra, 2015; Abbott et al., 2019), even though animal products represent a small portion of global nutrition and actually have a net negative effect on human health in many developed countries (Lassaletta et al., 2014; Godfray et al., 2018; Willett et al., 2019). This means that decreasing meat and dairy consumption could substantially reduce nutrient inputs while improving human health (Sutton et al., 2013; de Vrese et al., 2018; Godfray et al., 2018; Willett et al., 2019). Additionally, the creation of biofuels is incredibly nutrient intensive, though only marginally advantageous energetically and economically (Dominguez-Faus et al., 2009; Yang et al., 2011). Reducing livestock husbandry and biofuel cultivation—i.e., limiting fertilizer use to crops destined for direct human consumption—could decrease the global nutrient footprint by more than half, while also alleviating pressure on wildlife habitat and other Earth systems (Steffen et al., 2015; Springmann et al., 2018; Abbott et al., 2019).
While large-scale changes in diet and energy production have social and technical challenges of their own (Godfray et al., 2018; Willett et al., 2019), they could substantially reduce eutrophication, especially when combined with expanded control of nutrient point sources (e.g., wastewater treatment plants), which has been extremely effective at reducing nutrient export (Musolff et al., 2015; Abbott et al., 2018b; Le Moal et al., 2019). Assessing nutrient attenuation capacity at watershed scales with hydrochemical proxies could also contribute to these efforts by informing redistribution of essential human activities to more resistant or resilient parts of the landscape (Thomas et al., 2015; Abbott et al., 2018a; Dupas et al., 2019b; Refsgaard et al., 2019).
Data Availability Statement
All datasets generated for this study are included in the article/Supplementary Material.
Author Contributions
BA, GP, FM, and AL conceived the sampling design. RF, BA, SG, TK, and RD carried out field and laboratory work. RF, BA, and RD developed the core ideas of the paper with substantial contributions from all authors.
Funding
RF was funded by the Office of Research and Creative Activities at Brigham Young University (BYU) to promote experiential learning outside the classroom. BA was supported by the Department of Plant and Wildlife Sciences and College of Life Sciences at BYU. The initial sampling and analysis were supported by the European Union's Seventh Framework Program for research, technological development and demonstration under grant agreement no. 607150 (FP7-PEOPLE-2013-ITN–INTERFACES—Ecohydrologic interfaces as critical hotspots for transformations of ecosystem exchange fluxes and biogeochemical cycling).
Conflict of Interest
The authors declare that the research was conducted in the absence of any commercial or financial relationships that could be construed as a potential conflict of interest.
Acknowledgments
We thank François Rouault at Agrocampus Ouest for his field assistance and expertise, and we thank Gabriel Cano at BYU for his guidance on model selection. We also thank Nathalie Le Bris and Frédérique Pallois for assistance with incubations and chemical analyses at the Plateforme Analytique ECOBIO, and Martine Bouhnik-Le Coz and Eliot Chatton for assistance with rare earth analyses at Géochimie Environnementale (GrEEN), in Rennes, France.
Supplementary Material
The Supplementary Material for this article can be found online at: https://www.frontiersin.org/articles/10.3389/fenvs.2019.00200/full#supplementary-material
References
Abbott, B. W., Baranov, V., Mendoza-Lera, C., Nikolakopoulou, M., Harjung, A., Kolbe, T., et al. (2016). Using multi-tracer inference to move beyond single-catchment ecohydrology. Earth Sci. Rev. 160, 19–42. doi: 10.1016/j.earscirev.2016.06.014
Abbott, B. W., Bishop, K., Zarnetske, J. P., Minaudo, C., Chapin, F. S., Krause, S., et al. (2019). Human domination of the global water cycle absent from depictions and perceptions. Nat. Geosci. 12, 533–540. doi: 10.1038/s41561-019-0374-y
Abbott, B. W., Gruau, G., Zarnetske, J. P., Moatar, F., Barbe, L., Thomas, Z., et al. (2018a). Unexpected spatial stability of water chemistry in headwater stream networks. Ecol. Lett. 21, 296–308. doi: 10.1111/ele.12897
Abbott, B. W., and Jones, J. B. (2015). Permafrost collapse alters soil carbon stocks, respiration, CH4, and N2O in upland tundra. Glob. Change Biol. 21, 4570–4587. doi: 10.1111/gcb.13069
Abbott, B. W., Moatar, F., Gauthier, O., Fovet, O., Antoine, V., and Ragueneau, O. (2018b). Trends and seasonality of river nutrients in agricultural catchments: 18 years of weekly citizen science in France. Sci. Total Environ. 624, 845–858. doi: 10.1016/j.scitotenv.2017.12.176
Aber, J., McDowell, W., Nadelhoffer, K., Magill, A., Berntson, G., Kamakea, M., et al. (1998). Nitrogen saturation in temperate forest ecosystems. Bioscience 48, 921–934. doi: 10.2307/1313296
Allen, A. P., and Gillooly, J. F. (2009). Towards an integration of ecological stoichiometry and the metabolic theory of ecology to better understand nutrient cycling. Ecol. Lett. 12, 369–384. doi: 10.1111/j.1461-0248.2009.01302.x
Aquilina, L., Poszwa, A., Walter, C., Vergnaud, V., Pierson-Wickmann, A.-C., and Ruiz, L. (2012). Long-term effects of high nitrogen loads on cation and carbon riverine export in agricultural catchments. Environ. Sci. Technol. 46, 9447–9455. doi: 10.1021/es301715t
Aquilina, L., Roques, C., Boisson, A., Vergnaud-Ayraud, V., Labasque, T., Pauwels, H., et al. (2018). Autotrophic denitrification supported by biotite dissolution in crystalline aquifers (1): new insights from short-term batch experiments. Sci. Total Environ. 619–620, 842–853. doi: 10.1016/j.scitotenv.2017.11.079
Arango, C. P., Tank, J. L., Schaller, J. L., Royer, T. V., Bernot, M. J., and David, M. B. (2007). Benthic organic carbon influences denitrification in streams with high nitrate concentration. Freshw. Biol. 52, 1210–1222. doi: 10.1111/j.1365-2427.2007.01758.x
Archfield, S. A., Kennen, J. G., Carlisle, D. M., and Wolock, D. M. (2014). An objective and parsimonious approach for classifying natural flow regimes at a continental scale. River Res. Appl. 30, 1166–1183. doi: 10.1002/rra.2710
Ayraud, V., Aquilina, L., Labasque, T., Pauwels, H., Molenat, J., Pierson-Wickmann, A.-C., et al. (2008). Compartmentalization of physical and chemical properties in hard-rock aquifers deduced from chemical and groundwater age analyses. Appl. Geochem. 23, 2686–2707. doi: 10.1016/j.apgeochem.2008.06.001
Ayraud, V., Aquilina, L., Pauwels, H., Labasque, T., Pierson-Wickmann, A.-C., Aquilina, A.-M., et al. (2006). Physical, biogeochemical and isotopic processes related to heterogeneity of a shallow crystalline rock aquifer. Biogeochemistry 81, 331–347. doi: 10.1007/s10533-006-9044-4
Basu, N. B., Thompson, S. E., and Rao, P. S. C. (2011). Hydrologic and biogeochemical functioning of intensively managed catchments: a synthesis of top-down analyses. Water Resour. Res. 47:W00J15. doi: 10.1029/2011WR010800
Bedard-Haughn, A., van Groenigen, J. W., and van Kessel, C. (2003). Tracing 15N through landscapes: potential uses and precautions. J. Hydrol. 272, 175–190. doi: 10.1016/S0022-1694(02)00263-9
Ben Maamar, S., Aquilina, L., Quaiser, A., Pauwels, H., Michon-Coudouel, S., Vergnaud-Ayraud, V., et al. (2015). Groundwater isolation governs chemistry and microbial community structure along hydrologic flowpaths. Front. Microbiol. 6:1457. doi: 10.3389/fmicb.2015.01457
Bernhardt, E. S., Blaszczak, J. R., Ficken, C. D., Fork, M. L., Kaiser, K. E., and Seybold, E. C. (2017). Control points in ecosystems: moving beyond the hot spot hot moment concept. Ecosystems 20, 665–682. doi: 10.1007/s10021-016-0103-y
Bertin, C., and Bourg, A. C. M. (1994). Radon-222 and chloride as natural tracers of the infiltration of river water into an alluvial aquifer in which there is significant river/groundwater mixing. Environ. Sci. Technol. 28, 794–798. doi: 10.1021/es00054a008
Bishop, K., Buffam, I., Erlandsson, M., Fölster, J., Laudon, H., Seibert, J., et al. (2008). Aqua Incognita: the unknown headwaters. Hydrol. Process. 22, 1239–1242. doi: 10.1002/hyp.7049
Blaszczak, J. R., Delesantro, J. M., Urban, D. L., Doyle, M. W., and Bernhardt, E. S. (2019). Scoured or suffocated: urban stream ecosystems oscillate between hydrologic and dissolved oxygen extremes. Limnol. Oceanogr. 64, 877–894. doi: 10.1002/lno.11081
Bogaart, P. W., van der Velde, Y., Lyon, S. W., and Dekker, S. C. (2016). Streamflow recession patterns can help unravel the role of climate and humans in landscape co-evolution. Hydrol. Earth Syst. Sci. 20, 1413–1432. doi: 10.5194/hess-20-1413-2016
Bol, R., Gruau, G., Mellander, P.-E., Dupas, R., Bechmann, M., Skarbøvik, E., et al. (2018). Challenges of reducing phosphorus based water eutrophication in the agricultural landscapes of northwest Europe. Front. Mar. Sci. 5:276. doi: 10.3389/fmars.2018.00276
Braun, J.-J., Viers, J., Dupré, B., Polve, M., Ndam, J., and Muller, J.-P. (1998). Solid/Liquid REE Fractionation in the Lateritic System of Goyoum, East Cameroon: the Implication for the Present Dynamics of the Soil Covers of the Humid Tropical Regions. Geochim. Cosmochim. Acta 62, 273–299. doi: 10.1016/S0016-7037(97)00344-X
Burt, T. P. (1994). Long-term study of the natural environment - perceptive science or mindless monitoring? Prog. Phys. Geogr. Earth Environ. 18, 475–496. doi: 10.1177/030913339401800401
Burt, T. P., Howden, N. J. K., Worrall, F., and McDonnell, J. J. (2011). On the value of long-term, low-frequency water quality sampling: avoiding throwing the baby out with the bathwater. Hydrol. Process. 25, 828–830. doi: 10.1002/hyp.7961
Burt, T. P., and Pinay, G. (2005). Linking hydrology and biogeochemistry in complex landscapes. Prog. Phys. Geogr. Earth Environ. 29, 297–316. doi: 10.1191/0309133305pp450ra
Cable, J. E., Burnett, W. C., Chanton, J. P., and Weatherly, G. L. (1996). Estimating groundwater discharge into the northeastern Gulf of Mexico using radon-222. Earth Planet. Sci. Lett. 144, 591–604. doi: 10.1016/S0012-821X(96)00173-2
Campbell, J. L., Hornbeck, J. W., Mitchell, M. J., Adams, M. B., Castro, M. S., Driscoll, C. T., et al. (2004). Input-output budgets of inorganic nitrogen for 24 forest watersheds in the northeastern United States: a review. Water Air. Soil Pollut. 151, 373–396. doi: 10.1023/B:WATE.0000009908.94219.04
Carey, J. C., Abbott, B. W., and Rocha, A. V. (2019). Plant uptake offsets silica release from a large Arctic tundra wildfire. Earths Future 7, 1044–1057. doi: 10.1029/2019EF001149
Carpenter, S. R., Caraco, N. F., Correll, D. L., Howarth, R. W., Sharpley, A. N., and Smith, V. H. (1998). Nonpoint pollution of surface waters with phosphorus and nitrogen. Ecol. Appl. 8, 559–568. doi: 10.1890/1051-0761(1998)008[0559:NPOSWW]2.0.CO;2
Coble, A. A., Koenig, L. E., Potter, J. D., Parham, L. M., and McDowell, W. H. (2019). Homogenization of dissolved organic matter within a river network occurs in the smallest headwaters. Biogeochemistry 143, 85–104. doi: 10.1007/s10533-019-00551-y
Covino, T. (2017). Hydrologic connectivity as a framework for understanding biogeochemical flux through watersheds and along fluvial networks. Geomorphology 277, 133–144. doi: 10.1016/j.geomorph.2016.09.030
Covino, T., McGlynn, B., and Baker, M. (2010). Separating physical and biological nutrient retention and quantifying uptake kinetics from ambient to saturation in successive mountain stream reaches. J. Geophys. Res. 115:G04010. doi: 10.1029/2009JG001263
De Carlo, E. H., Wen, X.-Y., and Irving, M. (1997). The influence of redox reactions on the uptake of dissolved Ce by suspended Fe and Mn oxide particles. Aquat. Geochem. 3, 357–389. doi: 10.1023/A:1009664626181
de Vrese, P., Stacke, T., and Hagemann, S. (2018). Exploring the biogeophysical limits of global food production under different climate change scenarios. Earth Syst. Dyn. 9, 393–412. doi: 10.5194/esd-9-393-2018
Denk, T. R. A., Mohn, J., Decock, C., Lewicka-Szczebak, D., Harris, E., Butterbach-Bahl, K., et al. (2017). The nitrogen cycle: a review of isotope effects and isotope modeling approaches. Soil Biol. Biochem. 105, 121–137. doi: 10.1016/j.soilbio.2016.11.015
Dia, A., Gruau, G., Olivié-Lauquet, G., Riou, C., Molénat, J., and Curmi, P. (2000). The distribution of rare earth elements in groundwaters: assessing the role of source-rock composition, redox changes and colloidal particles. Geochim. Cosmochim. Acta 64, 4131–4151. doi: 10.1016/S0016-7037(00)00494-4
Dominguez-Faus, R., Powers, S. E., Burken, J. G., and Alvarez, P. J. (2009). The water footprint of biofuels: a drink or drive issue? Environ. Sci. Technol. 43, 3005–3010. doi: 10.1021/es802162x
Dupas, R., Abbott, B. W., Minaudo, C., and Fovet, O. (2019a). Distribution of landscape units within catchments influences nutrient export dynamics. Front. Environ. Sci. 7:43. doi: 10.3389/fenvs.2019.00043
Dupas, R., Curie, F., Gascuel-Odoux, C., Moatar, F., Delmas, M., Parnaudeau, V., et al. (2013). Assessing N emissions in surface water at the national level: comparison of country-wide vs. regionalized models. Sci. Total Environ. 443, 152–162. doi: 10.1016/j.scitotenv.2012.10.011
Dupas, R., Gruau, G., Gu, S., Humbert, G., Jaffrézic, A., and Gascuel-Odoux, C. (2015). Groundwater control of biogeochemical processes causing phosphorus release from riparian wetlands. Water Res. 84, 307–314. doi: 10.1016/j.watres.2015.07.048
Dupas, R., Jomaa, S., Musolff, A., Borchardt, D., and Rode, M. (2016). Disentangling the influence of hydroclimatic patterns and agricultural management on river nitrate dynamics from sub-hourly to decadal time scales. Sci. Total Environ. 571, 791–800. doi: 10.1016/j.scitotenv.2016.07.053
Dupas, R., Minaudo, C., and Abbott, B. W. (2019b). Stability of spatial patterns in water chemistry across temperate ecoregions. Environ. Res. Lett. 14:074015. doi: 10.1088/1748-9326/ab24f4
Dupas, R., Minaudo, C., Gruau, G., Ruiz, L., and Gascuel-Odoux, C. (2018). Multidecadal trajectory of riverine nitrogen and phosphorus dynamics in rural catchments. Water Resour. Res. 54, 5327–5340. doi: 10.1029/2018WR022905
Dupas, R., Musolff, A., Jawitz, J. W., Rao, P. S. C., Jäger, C. G., Fleckenstein, J. H., et al. (2017). Carbon and nutrient export regimes from headwater catchments to downstream reaches. Biogeosciences 14, 4391–4407. doi: 10.5194/bg-14-4391-2017
Ehrhardt, S., Kumar, R., Fleckenstein, J. H., Attinger, S., and Musolff, A. (2019). Trajectories of nitrate input and output in three nested catchments along a land use gradient. Hydrol. Earth Syst. Sci. 23, 3503–3524. doi: 10.5194/hess-23-3503-2019
Elser, J., and Bennett, E. (2011). Phosphorus cycle: a broken biogeochemical cycle. Nature 478, 29–31. doi: 10.1038/478029a
Elser, J. J., Bracken, M. E. S., Cleland, E. E., Gruner, D. S., Harpole, W. S., Hillebrand, H., et al. (2007). Global analysis of nitrogen and phosphorus limitation of primary producers in freshwater, marine and terrestrial ecosystems. Ecol. Lett. 10, 1135–1142. doi: 10.1111/j.1461-0248.2007.01113.x
Ewing, S. A., O'Donnell, J. A., Aiken, G. R., Butler, K., Butman, D., Windham-Myers, L., et al. (2015). Long-term anoxia and release of ancient, labile carbon upon thaw of Pleistocene permafrost. Geophys. Res. Lett. 42, 10730–10738. doi: 10.1002/2015GL066296
Fang, K., and Shen, C. (2017). Full-flow-regime storage-streamflow correlation patterns provide insights into hydrologic functioning over the continental US. Water Resour. Res. 53, 8064–8083. doi: 10.1002/2016WR020283
FAO, (ed.). (2017). The Future of Food and Agriculture: Trends and Challenges. Rome: Food and Agriculture Organization (FAO) of the United Nations.
Feijoó, C., Messetta, M. L., Hegoburu, C., Gómez Vázquez, A., Guerra-López, J., Mas-Pla, J., et al. (2018). Retention and release of nutrients and dissolved organic carbon in a nutrient-rich stream: a mass balance approach. J. Hydrol. 566, 795–806. doi: 10.1016/j.jhydrol.2018.09.051
Fick, S. E., and Hijmans, R. J. (2017). WorldClim 2: new 1-km spatial resolution climate surfaces for global land areas. Int. J. Climatol. 37, 4302–4315. doi: 10.1002/joc.5086
Fisher, S. G., Grimm, N. B., Martí, E., Holmes, R. M., and Jones, J. B. Jr. (1998). Material spiraling in stream corridors: a telescoping ecosystem model. Ecosystems 1, 19–34. doi: 10.1007/s100219900003
Foley, J. A., Ramankutty, N., Brauman, K. A., Cassidy, E. S., Gerber, J. S., Johnston, M., et al. (2011). Solutions for a cultivated planet. Nature 478, 337–342. doi: 10.1038/nature10452
Fork, M. L., and Heffernan, J. B. (2013). Direct and indirect effects of dissolved organic matter source and concentration on denitrification in northern Florida rivers. Ecosystems 17, 14–28. doi: 10.1007/s10021-013-9705-9
Fovet, O., Ruiz, L., Faucheux, M., Molénat, J., Sekhar, M., Vertès, F., et al. (2015). Using long time series of agricultural-derived nitrates for estimating catchment transit times. J. Hydrol. 522, 603–617. doi: 10.1016/j.jhydrol.2015.01.030
Galloway, J. N., Aber, J. D., Erisman, J. W., Seitzinger, S. P., Howarth, R. W., Cowling, E. B., et al. (2003). The nitrogen cascade. BioScience 53, 341. doi: 10.1641/0006-3568(2003)053[0341:TNC]2.0.CO;2
Galloway, J. N., Townsend, A. R., Erisman, J. W., Bekunda, M., Cai, Z., Freney, J. R., et al. (2008). Transformation of the nitrogen cycle: recent trends, questions, and potential solutions. Science 320, 889–892. doi: 10.1126/science.1136674
Garnier, J., Billen, G., Vilain, G., Benoit, M., Passy, P., Tallec, G., et al. (2014). Curative vs. preventive management of nitrogen transfers in rural areas: lessons from the case of the Orgeval watershed (Seine River basin, France). J. Environ. Manage. 144, 125–134. doi: 10.1016/j.jenvman.2014.04.030
Gascuel-Odoux, C., Weiler, M., and Molenat, J. (2010). Effect of the spatial distribution of physical aquifer properties on modelled water table depth and stream discharge in a headwater catchment. Hydrol. Earth Syst. Sci. 14, 1179–1194. doi: 10.5194/hess-14-1179-2010
Glass, C., and Silverstein, J. (1998). Denitrification kinetics of high nitrate concentration water: pH effect on inhibition and nitrite accumulation. Water Res. 32, 831–839. doi: 10.1016/S0043-1354(97)00260-1
Goderniaux, P., Davy, P., Bresciani, E., de Dreuzy, J.-R., and Le Borgne, T. (2013). Partitioning a regional groundwater flow system into shallow local and deep regional flow compartments. Water Resour. Res. 49, 2274–2286. doi: 10.1002/wrcr.20186
Godfray, H. C. J., Aveyard, P., Garnett, T., Hall, J. W., Key, T. J., Lorimer, J., et al. (2018). Meat consumption, health, and the environment. Science 361:eaam5324. doi: 10.1126/science.aam5324
Goyette, J.-O., Bennett, E. M., and Maranger, R. (2018). Low buffering capacity and slow recovery of anthropogenic phosphorus pollution in watersheds. Nat. Geosci. 11, 921–925. doi: 10.1038/s41561-018-0238-x
Grizzetti, B., Bouraoui, F., and Aloe, A. (2012). Changes of nitrogen and phosphorus loads to European seas. Glob. Change Biol. 18, 769–782. doi: 10.1111/j.1365-2486.2011.02576.x
Groffman, P. M., Altabet, M. A., Böhlke, J. K., Butterbach-Bahl, K., David, M. B., Firestone, M. K., et al. (2006). Methods for measuring denitrification: diverse approaches to a difficult problem. Ecol. Appl. 16, 2091–2122. doi: 10.1890/1051-0761(2006)016[2091:MFMDDA]2.0.CO;2
Gruau, G., Dia, A., Olivié-Lauquet, G., Davranche, M., and Pinay, G. (2004). Controls on the distribution of rare earth elements in shallow groundwaters. Water Res. 38, 3576–3586. doi: 10.1016/j.watres.2004.04.056
Gruber, N., and Galloway, J. N. (2008). An Earth-system perspective of the global nitrogen cycle. Nature 451, 293–296. doi: 10.1038/nature06592
Gu, S., Gruau, G., Dupas, R., Petitjean, P., Li, Q., and Pinay, G. (2019). Respective roles of Fe-oxyhydroxide dissolution, pH changes and sediment inputs in dissolved phosphorus release from wetland soils under anoxic conditions. Geoderma 338, 365–374. doi: 10.1016/j.geoderma.2018.12.034
Gu, S., Gruau, G., Malique, F., Dupas, R., Petitjean, P., and Gascuel-Odoux, C. (2018). Drying/rewetting cycles stimulate release of colloidal-bound phosphorus in riparian soils. Geoderma 321, 32–41. doi: 10.1016/j.geoderma.2018.01.015
Haas, M., Baumann, F., Castella, D., Haghipour, N., Reusch, A., Strasser, M., et al. (2019). Roman-driven cultural eutrophication of Lake Murten, Switzerland. Earth Planet. Sci. Lett. 505, 110–117. doi: 10.1016/j.epsl.2018.10.027
Hale, R. L., Scoggins, M., Smucker, N. J., and Suchy, A. (2016). Effects of climate on the expression of the urban stream syndrome. Freshw. Sci. 35, 421–428. doi: 10.1086/684594
Hale, R. L., Turnbull, L., Earl, S. R., Childers, D. L., and Grimm, N. B. (2015). Stormwater infrastructure controls runoff and dissolved material export from arid urban watersheds. Ecosystems 18, 62–75. doi: 10.1007/s10021-014-9812-2
Hansen, N. C., Daniel, T. C., Sharpley, A. N., and Lemunyon, J. L. (2002). The fate and transport of phosphorus in agricultural systems. J. Soil Water Conserv. 57, 409–417.
Hansen, N. C., Gupta, S. C., and Moncrief, J. F. (2000). Snowmelt runoff, sediment, and phosphorus losses under three different tillage systems. Soil Tillage Res. 57, 93–100. doi: 10.1016/S0167-1987(00)00152-5
Harjung, A., Perujo, N., Butturini, A., Romaní, A. M., and Sabater, F. (2019). Responses of microbial activity in hyporheic pore water to biogeochemical changes in a drying headwater stream. Freshw. Biol. 64, 735–749. doi: 10.1111/fwb.13258
Heathwaite, A. L. (2010). Multiple stressors on water availability at global to catchment scales: understanding human impact on nutrient cycles to protect water quality and water availability in the long term. Freshw. Biol. 55, 241–257. doi: 10.1111/j.1365-2427.2009.02368.x
Helms, J. R., Stubbins, A., Ritchie, J. D., Minor, E. C., Kieber, D. J., and Mopper, K. (2008). Absorption spectral slopes and slope ratios as indicators of molecular weight, source, and photobleaching of chromophoric dissolved organic matter. Limnol. Oceanogr. 53, 955–969. doi: 10.4319/lo.2008.53.3.0955
Helton, A. M., Ardón, M., and Bernhardt, E. S. (2015). Thermodynamic constraints on the utility of ecological stoichiometry for explaining global biogeochemical patterns. Ecol. Lett. 18, 1049–1056. doi: 10.1111/ele.12487
Helton, A. M., Hall, R. O., and Bertuzzo, E. (2018). How network structure can affect nitrogen removal by streams. Freshw. Biol. 63, 128–140. doi: 10.1111/fwb.12990
Herrero, M., Havlík, P., Valin, H., Notenbaert, A., Rufino, M. C., Thornton, P. K., et al. (2013). Biomass use, production, feed efficiencies, and greenhouse gas emissions from global livestock systems. Proc. Natl. Acad. Sci. U.S.A. 110, 20888–20893. doi: 10.1073/pnas.1308149110
Hobbie, S. E., Finlay, J. C., Janke, B. D., Nidzgorski, D. A., Millet, D. B., and Baker, L. A. (2017). Contrasting nitrogen and phosphorus budgets in urban watersheds and implications for managing urban water pollution. Proc. Natl. Acad. Sci. U.S.A. 114, 4177–4182. doi: 10.1073/pnas.1618536114
Hosono, T., Tokunaga, T., Tsushima, A., and Shimada, J. (2014). Combined use of δ13C, δ15N, and δ34S tracers to study anaerobic bacterial processes in groundwater flow systems. Water Res. 54, 284–296. doi: 10.1016/j.watres.2014.02.005
Howarth, R. W., Anderson, D. B., Cloern, J. E., Elfring, C., Hopkinson, C. S., Lapointe, B., et al. (2000). Nutrient pollution of coastal rivers, bays, and seas. Issues Ecol. 7, 1–16.
Howden, N. J. K., Burt, T. P., Worrall, F., Whelan, M. J., and Bieroza, M. (2010). Nitrate concentrations and fluxes in the River Thames over 140 years (1868–2008): are increases irreversible? Hydrol. Process. 24, 2657–2662. doi: 10.1002/hyp.7835
Jaggard, K. W., Qi, A., and Ober, E. S. (2010). Possible changes to arable crop yields by 2050. Philos. Trans. R. Soc. B Biol. Sci. 365, 2835–2851. doi: 10.1098/rstb.2010.0153
Jarvie, H. P., Sharpley, A. N., Flaten, D., and Kleinman, P. J. A. (2019). Phosphorus mirabilis: illuminating the past and future of phosphorus stewardship. J. Environ. Qual. 48, 1127–1132. doi: 10.2134/jeq2019.07.0266
Jarvie, H. P., Sharpley, A. N., Withers, P. J. A., Scott, J. T., Haggard, B. E., and Neal, C. (2013). Phosphorus mitigation to control river eutrophication: murky waters, inconvenient truths, and “postnormal” science. J. Environ. Qual. 42, 295–304. doi: 10.2134/jeq2012.0085
Kim, H.-R., Yu, S., Oh, J., Kim, K.-H., Oh, Y.-Y., Kim, H. K., et al. (2019). Assessment of nitrogen application limits in agro-livestock farming areas using quantile regression between nitrogen loadings and groundwater nitrate levels. Agric. Ecosyst. Environ. 286:106660. doi: 10.1016/j.agee.2019.106660
Kirchner, J. W. (2019). Quantifying new water fractions and transit time distributions using ensemble hydrograph separation: theory and benchmark tests. Hydrol. Earth Syst. Sci. 23, 303–349. doi: 10.5194/hess-23-303-2019
Knoben, W. J. M., Woods, R. A., and Freer, J. E. (2018). A quantitative hydrological climate classification evaluated with independent streamflow data. Water Resour. Res. 54, 5088–5109. doi: 10.1029/2018WR022913
Kolbe, T., de Dreuzy, J.-R., Abbott, B. W., Aquilina, L., Babey, T., Green, C. T., et al. (2019). Stratification of reactivity determines nitrate removal in groundwater. Proc. Natl. Acad. Sci. U.S.A. 116, 2494–2499. doi: 10.1073/pnas.1816892116
Kolbe, T., Marçais, J., Thomas, Z., Abbott, B. W., de Dreuzy, J.-R., Rousseau-Gueutin, P., et al. (2016). Coupling 3D groundwater modeling with CFC-based age dating to classify local groundwater circulation in an unconfined crystalline aquifer. J. Hydrol. 543, 31–46. doi: 10.1016/j.jhydrol.2016.05.020
Kronvang, B., Vagstad, N., Behrendt, H., Bøgestrand, J., and Larsen, S. E. (2007). Phosphorus losses at the catchment scale within Europe: an overview. Soil Use Manag. 23, 104–116. doi: 10.1111/j.1475-2743.2007.00113.x
Lade, S. J., Steffen, W., Vries, W., de Carpenter, S. R., Donges, J. F., Gerten, D., et al. (2019). Human impacts on planetary boundaries amplified by Earth system interactions. Nat. Sustain. 1–10. doi: 10.1038/s41893-019-0454-4
Lassaletta, L., Billen, G., Grizzetti, B., Garnier, J., Leach, A. M., and Galloway, J. N. (2014). Food and feed trade as a driver in the global nitrogen cycle: 50-year trends. Biogeochemistry 118, 225–241. doi: 10.1007/s10533-013-9923-4
Le Moal, M., Gascuel-Odoux, C., Ménesguen, A., Souchon, Y., Étrillard, C., Levain, A., et al. (2019). Eutrophication: a new wine in an old bottle? Sci. Total Environ. 651, 1–11. doi: 10.1016/j.scitotenv.2018.09.139
Leaf, S. (2018). Taking the P out of pollution: an English perspective on phosphorus stewardship and the Water Framework Directive. Water Environ. J. 32, 4–8. doi: 10.1111/wej.12268
Lehmann, M. F., Reichert, P., Bernasconi, S. M., Barbieri, A., and McKenzie, J. A. (2003). Modelling nitrogen and oxygen isotope fractionation during denitrification in a lacustrine redox-transition zone. Geochim. Cosmochim. Acta 67, 2529–2542. doi: 10.1016/S0016-7037(03)00085-1
Lin, P., Pan, M., Beck, H. E., Yang, Y., Yamazaki, D., Frasson, R., et al. (2019). Global reconstruction of naturalized river flows at 2.94 million reaches. Water Resour. Res. 55, 6499–6516. doi: 10.1029/2019WR025287
Liu, C., Kroeze, C., Hoekstra, A. Y., and Gerbens-Leenes, W. (2012). Past and future trends in grey water footprints of anthropogenic nitrogen and phosphorus inputs to major world rivers. Ecol. Indic. 18, 42–49. doi: 10.1016/j.ecolind.2011.10.005
Lohse, K. A., Sanderman, J., and Amundson, R. (2013). Identifying sources and processes influencing nitrogen export to a small stream using dual isotopes of nitrate. Water Resour. Res. 49, 5715–5731. doi: 10.1002/wrcr.20439
Malone, E. T., Abbott, B. W., Klaar, M. J., Kidd, C., Sebilo, M., Milner, A. M., et al. (2018). Decline in ecosystem δ13C and mid-successional nitrogen loss in a two-century postglacial chronosequence. Ecosystems 21, 1659–1675. doi: 10.1007/s10021-018-0245-1
Marçais, J., Gauvain, A., Labasque, T., Abbott, B. W., Pinay, G., Aquilina, L., et al. (2018). Dating groundwater with dissolved silica and CFC concentrations in crystalline aquifers. Sci. Total Environ. 636, 260–272. doi: 10.1016/j.scitotenv.2018.04.196
Mariotti, A., Germon, J. C., Hubert, P., Kaiser, P., Letolle, R., Tardieux, A., et al. (1981). Experimental determination of nitrogen kinetic isotope fractionation: some principles; illustration for the denitrification and nitrification processes. Plant Soil 62, 413–430. doi: 10.1007/BF02374138
McClain, M. E., Boyer, E. W., Dent, C. L., Gergel, S. E., Grimm, N. B., Groffman, P. M., et al. (2003). Biogeochemical hot spots and hot moments at the interface of terrestrial and aquatic ecosystems. Ecosystems 6, 301–312. doi: 10.1007/s10021-003-0161-9
McDowell, W. H. (2003). Dissolved organic matter in soils—future directions and unanswered questions. Geoderma 113, 179–186. doi: 10.1016/S0016-7061(02)00360-9
McDowell, W. H., Zsolnay, A., Aitkenhead-Peterson, J. A., Gregorich, E. G., Jones, D. L., Jödemann, D., et al. (2006). A comparison of methods to determine the biodegradable dissolved organic carbon from different terrestrial sources. Soil Biol. Biochem. 38, 1933–1942. doi: 10.1016/j.soilbio.2005.12.018
McIlvin, M. R., and Casciotti, K. L. (2011). Technical updates to the bacterial method for nitrate isotopic analyses. Anal. Chem. 83, 1850–1856. doi: 10.1021/ac1028984
Mekonnen, M. M., and Hoekstra, A. Y. (2015). Global gray water footprint and water pollution levels related to anthropogenic nitrogen loads to fresh water. Environ. Sci. Technol. 49, 12860–12868. doi: 10.1021/acs.est.5b03191
Minaudo, C., Dupas, R., Gascuel-Odoux, C., Roubeix, V., Danis, P.-A., and Moatar, F. (2019). Seasonal and event-based concentration-discharge relationships to identify catchment controls on nutrient export regimes. Adv. Water Resour. 131:103379. doi: 10.1016/j.advwatres.2019.103379
Moatar, F., Abbott, B. W., Minaudo, C., Curie, F., and Pinay, G. (2017). Elemental properties, hydrology, and biology interact to shape concentration-discharge curves for carbon, nutrients, sediment, and major ions. Water Resour. Res. 53, 1270–1287. doi: 10.1002/2016WR019635
Moatar, F., Meybeck, M., Raymond, S., Birgand, F., and Curie, F. (2013). River flux uncertainties predicted by hydrological variability and riverine material behaviour. Hydrol. Process. 27, 3535–3546. doi: 10.1002/hyp.9464
Moffett, J. W. (1990). Microbially mediated cerium oxidation in sea water. Nature 345:421. doi: 10.1038/345421a0
Molénat, J., Gascuel-Odoux, C., Aquilina, L., and Ruiz, L. (2013). Use of gaseous tracers (CFCs and SF6) and transit-time distribution spectrum to validate a shallow groundwater transport model. J. Hydrol. 480, 1–9. doi: 10.1016/j.jhydrol.2012.11.043
Mourier, B., Walter, C., and Merot, P. (2008). Soil distribution in valleys according to stream order. CATENA 72, 395–404. doi: 10.1016/j.catena.2007.07.012
Mu, C. C., Abbott, B. W., Wu, X. D., Zhao, Q., Wang, H. J., Su, H., et al. (2017). Thaw depth determines dissolved organic carbon concentration and biodegradability on the Northern Qinghai-Tibetan plateau. Geophys. Res. Lett. 2017:GL075067. doi: 10.1002/2017GL075067
Murphy, E. M., Ginn, T. R., Chilakapati, A., Resch, C. T., Phillips, J. L., Wietsma, T. W., et al. (1997). The influence of physical heterogeneity on microbial degradation and distribution in porous media. Water Resour. Res. 33, 1087–1103. doi: 10.1029/96WR03851
Murphy, J., and Riley, J. P. (1962). A modified single solution method for the determination of phosphate in natural waters. Analytica. Chimica. Acta. 27, 31–36. doi: 10.1016/S0003-2670(00)88444-5
Musolff, A., Fleckenstein, J. H., Rao, P. S. C., and Jawitz, J. W. (2017). Emergent archetype patterns of coupled hydrologic and biogeochemical responses in catchments. Geophys. Res. Lett. 44, 4143–4151. doi: 10.1002/2017GL072630
Musolff, A., Schmidt, C., Selle, B., and Fleckenstein, J. H. (2015). Catchment controls on solute export. Adv. Water Resour. 86, 133–146. doi: 10.1016/j.advwatres.2015.09.026
Ocampo, C. J., Oldham, C. E., and Sivapalan, M. (2006). Nitrate attenuation in agricultural catchments: shifting balances between transport and reaction. Water Resour. Res. 42:W01408. doi: 10.1029/2004WR003773
Oldham, C. E., Farrow, D. E., and Peiffer, S. (2013). A generalized Damköhler number for classifying material processing in hydrological systems. Hydrol. Earth Syst. Sci. 17, 1133–1148. doi: 10.5194/hess-17-1133-2013
Oyarzún, R., Jofré, E., Maturana, H., Oyarzún, J., and Aguirre, E. (2014). Use of 222radon as a simple tool for surface water–groundwater connectivity assessment: a case study in the arid Limarí basin, north-central Chile. Water Environ. J. 28, 418–422. doi: 10.1111/wej.12057
Paerl, H. W., Scott, J. T., McCarthy, M. J., Newell, S. E., Gardner, W. S., Havens, K. E., et al. (2016). It takes two to tango: when and where dual nutrient (N & P) reductions are needed to protect lakes and downstream ecosystems. Environ. Sci. Technol. 50, 10805–10813. doi: 10.1021/acs.est.6b02575
Pelletier, N., and Tyedmers, P. (2010). Forecasting potential global environmental costs of livestock production 2000–2050. Proc. Natl. Acad. Sci. U.S.A. 107, 18371–18374. doi: 10.1073/pnas.1004659107
Pinay, G., Bernal, S., Abbott, B. W., Lupon, A., Marti, E., Sabater, F., et al. (2018). Riparian corridors: a new conceptual framework for assessing nitrogen buffering across biomes. Front. Environ. Sci. 6:47. doi: 10.3389/fenvs.2018.00047
Pinay, G., Peiffer, S., De Dreuzy, J.-R., Krause, S., Hannah, D. M., Fleckenstein, J. H., et al. (2015). Upscaling nitrogen removal capacity from local hotspots to low stream orders' drainage basins. Ecosystems 18, 1101–1120. doi: 10.1007/s10021-015-9878-5
Poisvert, C., Curie, F., and Moatar, F. (2017). Annual agricultural N surplus in France over a 70-year period. Nutr. Cycl. Agroecosyst. 107, 63–78. doi: 10.1007/s10705-016-9814-x
Pu, J., Feng, C., Liu, Y., Li, R., Kong, Z., Chen, N., et al. (2014). Pyrite-based autotrophic denitrification for remediation of nitrate contaminated groundwater. Bioresour. Technol. 173, 117–123. doi: 10.1016/j.biortech.2014.09.092
R Core Team (2018). R: A Language and Environment for Statistical Computing. Vienna: R Foundation for Statistical Computing. Available online at: https://www.R-project.org/
Randall, M. C., Carling, G. T., Dastrup, D. B., Miller, T., Nelson, S. T., Rey, K. A., et al. (2019). Sediment potentially controls in-lake phosphorus cycling and harmful cyanobacteria in shallow, eutrophic Utah Lake. PLoS ONE 14:e0212238. doi: 10.1371/journal.pone.0212238
Rasul, G. (2016). Managing the food, water, and energy nexus for achieving the Sustainable Development Goals in South Asia. Environ. Dev. 18, 14–25. doi: 10.1016/j.envdev.2015.12.001
Raymond, P. A., Saiers, J. E., and Sobczak, W. V. (2016). Hydrological and biogeochemical controls on watershed dissolved organic matter transport: pulse-shunt concept. Ecology 97, 5–16. doi: 10.1890/14-1684.1
Raymond, S., Moatar, F., Meybeck, M., and Bustillo, V. (2013). Choosing methods for estimating dissolved and particulate riverine fluxes from monthly sampling. Hydrol. Sci. J. 58, 1326–1339. doi: 10.1080/02626667.2013.814915
Refsgaard, J. C., Hansen, A. L., Højberg, A. L., Olesen, J. E., Hashemi, F., Wachniew, P., et al. (2019). Spatially differentiated regulation: can it save the Baltic Sea from excessive N-loads? Ambio 48, 1278–1289. doi: 10.1007/s13280-019-01195-w
Roley, S. S., Tank, J. L., Tyndall, J. C., and Witter, J. D. (2016). How cost-effective are cover crops, wetlands, and two-stage ditches for nitrogen removal in the Mississippi River Basin? Water Resour. Econ. 15, 43–56. doi: 10.1016/j.wre.2016.06.003
Sebilo, M., Aloisi, G., Mayer, B., Perrin, E., Vaury, V., Mothet, A., et al. (2019). Controls on the isotopic composition of nitrite (δ15N and δ18O) during denitrification in freshwater sediments. Sci. Rep. 9, 1–14. doi: 10.1038/s41598-019-54014-3
Sebilo, M., Mayer, B., Nicolardot, B., Pinay, G., and Mariotti, A. (2013). Long-term fate of nitrate fertilizer in agricultural soils. Proc. Natl. Acad. Sci. U.S.A. 110, 18185–18189. doi: 10.1073/pnas.1305372110
Seitzinger, S., Harrison, J. A., Böhlke, J. K., Bouwman, A. F., Lowrance, R., Peterson, B., et al. (2006). Denitrification across landscapes and waterscapes: a synthesis. Ecol. Appl. 16, 2064–2090. doi: 10.1890/1051-0761(2006)016[2064:DALAWA]2.0.CO;2
Seitzinger, S. P., Mayorga, E., Bouwman, A. F., Kroeze, C., Beusen, A. H. W., Billen, G., et al. (2010). Global river nutrient export: a scenario analysis of past and future trends. Glob. Biogeochem. Cycles 24. doi: 10.1029/2009GB003587
Sharpley, A., Gburek, W., and Heathwaite, L. (2008). Agricultural phosphorus and water quality: sources, transport and management. Agric. Food Sci. 7, 297–314. doi: 10.23986/afsci.72855
Sharpley, A., Jarvie, H. P., Buda, A., May, L., Spears, B., and Kleinman, P. (2013). Phosphorus legacy: overcoming the effects of past management practices to mitigate future water quality impairment. J. Environ. Qual. 42, 1308–1326. doi: 10.2134/jeq2013.03.0098
Shen, Y., Chapelle, F. H., Strom, E. W., and Benner, R. (2015). Origins and bioavailability of dissolved organic matter in groundwater. Biogeochemistry 122, 61–78. doi: 10.1007/s10533-014-0029-4
Shogren, A. J., Zarnetske, J. P., Abbott, B. W., Iannucci, F., Frei, R. J., Griffin, N. A., et al. (2019). Revealing biogeochemical signatures of Arctic landscapes with river chemistry. Sci. Rep. 9, 1–11. doi: 10.1038/s41598-019-49296-6
Smits, A. P., Ruffing, C. M., Royer, T. V., Appling, A. P., Griffiths, N. A., Bellmore, R., et al. (2019). Detecting signals of large-scale climate phenomena in discharge and nutrient loads in the Mississippi-Atchafalaya river basin. Geophys. Res. Lett. 46, 3791–3801. doi: 10.1029/2018GL081166
Smolders, A. J. P., Lucassen, E. C. H. E. T., Bobbink, R., Roelofs, J. G. M., and Lamers, L. P. M. (2010). How nitrate leaching from agricultural lands provokes phosphate eutrophication in groundwater fed wetlands: the sulphur bridge. Biogeochemistry 98, 1–7. doi: 10.1007/s10533-009-9387-8
Song, K., and Burgin, A. J. (2017). Perpetual phosphorus cycling: eutrophication amplifies biological control on internal phosphorus loading in agricultural reservoirs. Ecosystems 20, 1483–1493. doi: 10.1007/s10021-017-0126-z
Springmann, M., Clark, M., Mason-D'Croz, D., Wiebe, K., Bodirsky, B. L., Lassaletta, L., et al. (2018). Options for keeping the food system within environmental limits. Nature 562, 519–525. doi: 10.1038/s41586-018-0594-0
Steffen, W., Richardson, K., Rockström, J., Cornell, S. E., Fetzer, I., Bennett, E. M., et al. (2015). Planetary boundaries: guiding human development on a changing planet. Science 347:1259855. doi: 10.1126/science.1259855
Sterner, R. W., and Elser, J. J. (2002). Ecological Stoichiometry: The Biology of Elements from Molecules to the Biosphere. Princeton, NJ: Princeton University Press. doi: 10.1515/9781400885695
Stieglitz, T. C., Cook, P. G., and Burnett, W. C. (2010). Inferring coastal processes from regional-scale mapping of 222Radon and salinity: examples from the Great Barrier Reef, Australia. J. Environ. Radioact. 101, 544–552. doi: 10.1016/j.jenvrad.2009.11.012
Stubbins, A. (2016). A carbon for every nitrogen. Proc. Natl. Acad. Sci. U.S.A. 113, 10736–10738. doi: 10.1073/pnas.1612995113
Stumm, W., and Sulzberger, B. (1992). The cycling of iron in natural environments: considerations based on laboratory studies of heterogeneous redox processes. Geochim. Cosmochim. Acta 56, 3233–3257. doi: 10.1016/0016-7037(92)90301-X
Sutton, M. A., Bleeker, A., Howard, C. M., Bekunda, M., Grizzetti, B., de Vries, W., et al. (2013). Our Nutrient World: The Challenge to Produce More Food and Energy With Less Pollution. Edinburgh: NERC/Centre for Ecology & Hydrology. Available online at: http://initrogen.org/index.php/publications/our-nutrient-world (accessed October 20, 2017).
Tang, Y., Van Kempen, M. M. L., Van der Heide, T., Manschot, J. J. A., Roelofs, J. G. M., Lamers, L. P. M., et al. (2016). A tool for easily predicting short-term phosphorus mobilization from flooded soils. Ecol. Eng. 94, 1–6. doi: 10.1016/j.ecoleng.2016.05.046
Taylor, P. G., and Townsend, A. R. (2010). Stoichiometric control of organic carbon–nitrate relationships from soils to the sea. Nature 464, 1178–1181. doi: 10.1038/nature08985
Thomas, Z., and Abbott, B. W. (2018). Hedgerows reduce nitrate flux at hillslope and catchment scales via root uptake and secondary effects. J. Contam. Hydrol. 215, 51–61. doi: 10.1016/j.jconhyd.2018.07.002
Thomas, Z., Abbott, B. W., Troccaz, O., Baudry, J., and Pinay, G. (2015). Proximate and ultimate controls on carbon and nutrient dynamics of small agricultural catchments. Biogeosci. Discuss. 12, 15337–15367. doi: 10.5194/bgd-12-15337-2015
Thomas, Z., Ghazavi, R., Merot, P., and Granier, A. (2012). Modelling and observation of hedgerow transpiration effect on water balance components at the hillslope scale in Brittany. Hydrol. Process. 26, 4001–4014. doi: 10.1002/hyp.9198
Thomas, Z., Rousseau-Gueutin, P., Abbott, B. W., Kolbe, T., Le Lay, H., Marçais, J., et al. (2019). Long-term ecological observatories needed to understand ecohydrological systems in the Anthropocene: a catchment-scale case study in Brittany, France. Reg. Environ. Change 19, 363–377. doi: 10.1007/s10113-018-1444-1
Thomas, Z., Rousseau-Gueutin, P., Kolbe, T., Abbott, B. W., Marçais, J., Peiffer, S., et al. (2016). Constitution of a catchment virtual observatory for sharing flow and transport models outputs. J. Hydrol. 543, 59–66. doi: 10.1016/j.jhydrol.2016.04.067
van Dijk, G., Wolters, J., Fritz, C., de Mars, H., van Duinen, G. J., Ettwig, K. F., et al. (2019). Effects of groundwater nitrate and sulphate enrichment on groundwater-fed mires: a case study. Water. Air. Soil Pollut. 230:122. doi: 10.1007/s11270-019-4156-3
Van Meter, K. J., and Basu, N. B. (2017). Time lags in watershed-scale nutrient transport: an exploration of dominant controls. Environ. Res. Lett. 12:084017. doi: 10.1088/1748-9326/aa7bf4
Van Meter, K. J., Basu, N. B., Veenstra, J. J., and Burras, C. L. (2016). The nitrogen legacy: emerging evidence of nitrogen accumulation in anthropogenic landscapes. Environ. Res. Lett. 11:035014. doi: 10.1088/1748-9326/11/3/035014
Verry, E. S., and Timmons, D. R. (1982). Waterborne nutrient flow through an upland-peatland watershed in Minnesota. Ecology 63, 1456–1467. doi: 10.2307/1938872
Vitousek, P. M. (2004). Nutrient Cycling and Limitation: Hawai'i as a Model System. Princeton, NJ: Princeton University Press. Available online at: https://press.princeton.edu/titles/7798.html (accessed May 4, 2019).
Vitousek, P. M., Mooney, H. A., Lubchenco, J., and Melillo, J. M. (1997). Human domination of earth's ecosystems. Science 277, 494–499. doi: 10.1126/science.277.5325.494
Vitousek, P. M., and Reiners, W. A. (1975). Ecosystem succession and nutrient retention: a hypothesis. Bioscience 25, 376–381. doi: 10.2307/1297148
Vonk, J. E., Tank, S. E., Mann, P. J., Spencer, R. G. M., Treat, C. C., Striegl, R. G., et al. (2015). Biodegradability of dissolved organic carbon in permafrost soils and aquatic systems: a meta-analysis. Biogeosciences 12, 6915–6930. doi: 10.5194/bg-12-6915-2015
Walsh, R. P. D., and Lawler, D. M. (1981). Rainfall seasonality: description, spatial patterns and change through time. Weather 36, 201–208. doi: 10.1002/j.1477-8696.1981.tb05400.x
Weishaar, J. L., Aiken, G. R., Bergamaschi, B. A., Fram, M. S., Fujii, R., and Mopper, K. (2003). Evaluation of specific ultraviolet absorbance as an indicator of the chemical composition and reactivity of dissolved organic carbon. Environ. Sci. Technol. 37, 4702–4708. doi: 10.1021/es030360x
Willett, W., Rockström, J., Loken, B., Springmann, M., Lang, T., Vermeulen, S., et al. (2019). Food in the Anthropocene: the EAT-Lancet Commission on healthy diets from sustainable food systems. Lancet 393, 447–492. doi: 10.1016/S0140-6736(18)31788-4
Withers, P. J. A., and Jarvie, H. P. (2008). Delivery and cycling of phosphorus in rivers: a review. Sci. Total Environ. 400, 379–395. doi: 10.1016/j.scitotenv.2008.08.002
Wollheim, W. M., Bernal, S., Burns, D. A., Czuba, J. A., Driscoll, C. T., Hansen, A. T., et al. (2018). River network saturation concept: factors influencing the balance of biogeochemical supply and demand of river networks. Biogeochemistry 141, 503–521. doi: 10.1007/s10533-018-0488-0
Wollheim, W. M., Mulukutla, G. K., Cook, C., and Carey, R. O. (2017). Aquatic nitrate retention at river network scales across flow conditions determined using nested in situ sensors. Water Resour. Res. 53, 9740–9756. doi: 10.1002/2017WR020644
Wymore, A. S., Potter, J., Rodríguez-Cardona, B., and McDowell, W. H. (2018). Using in-situ optical sensors to understand the biogeochemistry of dissolved organic matter across a stream network. Water Resour. Res. 54, 2949–2958. doi: 10.1002/2017WR022168
Yang, J., Xu, M., Zhang, X., Hu, Q., Sommerfeld, M., and Chen, Y. (2011). Life-cycle analysis on biodiesel production from microalgae: water footprint and nutrients balance. Bioresour. Technol. 102, 159–165. doi: 10.1016/j.biortech.2010.07.017
Yeghicheyan, D., Bossy, C., Bouhnik Le Coz, M., Douchet, C., Granier, G., Heimburger, A., et al. (2013). A compilation of silicon, rare earth element and twenty-one other trace element concentrations in the natural river water reference material SLRS-5 (NRC-CNRC). Geostand. Geoanal. Res. 37, 449–467. doi: 10.1111/j.1751-908X.2013.00232.x
Zarnetske, J. P., Bouda, M., Abbott, B. W., Saiers, J., and Raymond, P. A. (2018). Generality of hydrologic transport limitation of watershed organic carbon flux across ecoregions of the United States. Geophys. Res. Lett. 45, 11702–11711. doi: 10.1029/2018GL080005
Keywords: nitrogen, phosphorus, attenuation, biogeochemical proxy, nutrient legacy
Citation: Frei RJ, Abbott BW, Dupas R, Gu S, Gruau G, Thomas Z, Kolbe T, Aquilina L, Labasque T, Laverman A, Fovet O, Moatar F and Pinay G (2020) Predicting Nutrient Incontinence in the Anthropocene at Watershed Scales. Front. Environ. Sci. 7:200. doi: 10.3389/fenvs.2019.00200
Received: 22 June 2019; Accepted: 13 December 2019;
Published: 14 January 2020.
Edited by:
Rebecca Elizabeth Tharme, Riverfutures Ltd, United KingdomReviewed by:
Teresa Ferreira, University of Lisbon, PortugalLuiz Ubiratan Hepp, Universidade Regional Integrada do Alto Uruguai e das Missões, Brazil
Copyright © 2020 Frei, Abbott, Dupas, Gu, Gruau, Thomas, Kolbe, Aquilina, Labasque, Laverman, Fovet, Moatar and Pinay. This is an open-access article distributed under the terms of the Creative Commons Attribution License (CC BY). The use, distribution or reproduction in other forums is permitted, provided the original author(s) and the copyright owner(s) are credited and that the original publication in this journal is cited, in accordance with accepted academic practice. No use, distribution or reproduction is permitted which does not comply with these terms.
*Correspondence: Rebecca J. Frei, cmZyZWlAdWFsYmVydGEuY2E=