 Abishek Sankara Narayan
 Manuel Fischer1,3
 Christoph Lüthi
95% of researchers rate our articles as excellent or good
Learn more about the work of our research integrity team to safeguard the quality of each article we publish.
Find out more
METHODS article
Front. Environ. Sci. , 14 January 2020
Sec. Water and Wastewater Management
Volume 7 - 2019 | https://doi.org/10.3389/fenvs.2019.00198
This article is part of the Research Topic City-Wide Sanitation: The Urban Sustainability Challenge View all 14 articles
Social network analysis (SNA) is a versatile and increasingly popular methodological tool to understand structures of relationships between actors involved in governance situations. Given the complexity of the set of stakeholders involved in the governance of Water, Sanitation and Hygiene (WASH) and the diversity of their interests, this article proposes SNA to the WASH sector. The use of SNA as an appropriate diagnostic tool for planning Citywide Inclusive Sanitation is explored. Missing data is a major problem for SNA in the studies of governance situations, especially in low- and middle-income countries. Therefore, a novel validation methodology for incomplete SNA data, relying on information from internal and external experts is proposed. SNA and the validation method is then applied to study the governance of decentralized wastewater treatment in four cities of India. The results corroborate key differences between mega and secondary cities in terms of institutions, community engagement and overall sanitation situation including aspects of decentralized wastewater treatment plants, based on the city types.
Social Network Analysis (SNA) is a method of detecting and interpreting structures and patterns of connections between actors who may be individuals, collectives or institutions (Scott, 2017). SNA is a versatile tool for different applications due to its graphical representation, structural intuition and systematic data interpretation (Freeman, 2004; Borgatti and Ofem, 2010). It has been increasingly used in a variety of fields from political science (Fischer and Sciarini, 2016; Victor et al., 2016), business marketing (Iacobucci, 1996), social psychology (Pearson and Michell, 2000) to public health (Valente et al., 2008), and environmental governance (Bodin and Crona, 2009; Bodin, 2017). More substantively, SNA is designed to deal with data on relations among entities, and thus data that describes interconnected phenomena, and consists of non-interdependent observations. Whenever a researcher believes that relations among entities are crucial for understanding a given phenomenon, SNA can provide important insights (see Table 1)1.
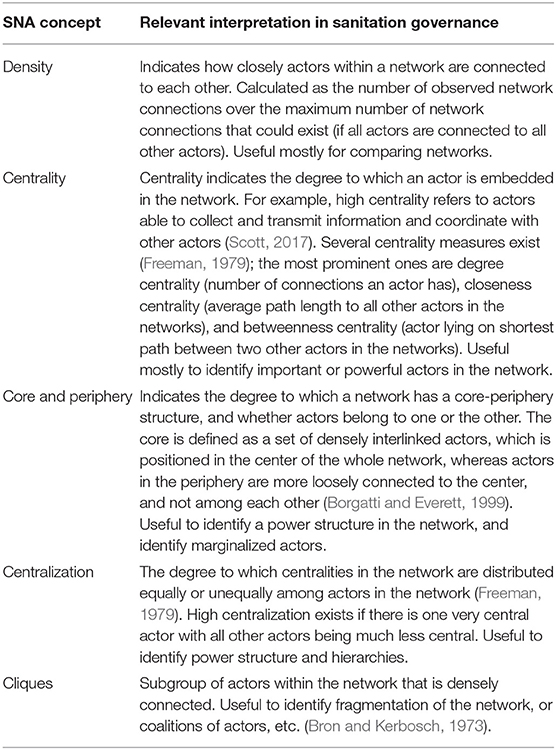
Table 1. Contextualized explanation of relevant SNA concepts for the WASH sector.
Governance in water, sanitation and hygiene (WASH) for development, especially in urban sanitation, is complex and commonly involves a number of stakeholders interacting across administrative levels, sectors and demographics (Strande et al., 2014). For instance, political economy studies of WASH and related urban services in Asian low- and middle-income countries, have revealed that the complexity of governance combined with weak institutions are a detriment to urban service delivery (Boex et al., 2020). In such a context, SNA can be used to describe and analyze the polycentricity of governance and institutions relevant for economic development. Furthermore, SNA has been related to (e.g., Ostrom, 2009) crucial concepts of polycentric governance (by assessing the complex patterns of different actors participating in a diversity of parallel decision-making bodies, e.g., Lubell, 2013), and social-ecological systems (by assessing how governance networks of actors are related to underlying ecological networks, e.g., Bodin, 2017). The use of SNA for such contexts can thus take the potentially important structure of relations2 among different actors into account, and could offer a different and possibly more appropriate perspective as compared to more conventional stakeholder analysis methods, which are often employed in WASH research and practice. The importance of SNA in understanding the complex adaptive systems existent in WASH for development has been indicated by Neely (2013) to answer the questions of why and how to ensure sustainability of community WASH interventions.
More specifically, SNA has several key advantages for the analysis of complex governance situations. First, SNA can help in identifying and interpreting specific roles of given actors in the governance network including gatekeeper or broker roles (Bodin and Crona, 2009; Ingold and Varone, 2012; Ingold, 2014). These actors can be crucial for the diffusion of information and best practices, or the elaboration of compromise solutions in governance networks. Second, a graphical representation of the SNA, a network graph (or sociogram) provides intuitive visual insights of the interactions between actors and allows for identification of key and marginalized players, and therefore could facilitate more equitable stakeholder involvement. Such information could pave the way for effective stakeholder engagement, taking into account formal, and informal networks, and reveal possibilities to build on existing social structures and points of interventions that improve success in WASH governance. For example, using SNA for identifying collaborative social networks for better water resource governance in the Mkindo catchment, Tanzania (Stein et al., 2011). A deeper understanding of stakeholder relations can increase the likelihood of collective action resulting in higher success of interventions (Prell et al., 2009). The use of SNA for identifying key characteristics of stakeholder networks that support institutional development has been shown in the service delivery of rural water supply in several low- and middle-income countries (McNicholl et al., 2017). Third, the very process of SNA data gathering has positive effects on the participation of stakeholders and the building of relationships with them (Jami and Walsh, 2014), while also increasing their awareness of other actors in the network. This is particularly useful in planning for the paradigm shift in urban sanitation that is Citywide Inclusive Sanitation (CWIS), which is based on equity in sanitation service delivery, combined use of diverse sanitation systems, and safe management of fecal waste along the entire sanitation value chain (Lüthi and Narayan, 2018).
Despite the potential benefits of SNA for research in the WASH sector, there has been a preference for stakeholder analysis over SNA, especially in urban sanitation studies (Reed et al., 2009; Lüthi et al., 2011; Reymond, 2014; Myers, 2016). Stakeholder analysis has been criticized for lack of consistency, halved perspectives, and for being in want of accounting informal relations (Hermans, 2005; Reed et al., 2009). Stakeholder analysis is purely qualitative and relies solely on interviews, focus group discussions, and snowball sampling to identify stakeholder interest and influence (Reed et al., 2009). SNA, on the other hand, can be both quantitative or qualitative, and allows for a more mixed methods approach (Edwards, 2010). Studies advocate combining SNA and stakeholder analysis to produce fine-grained insights in water infrastructure planning, because this would improve rigor and offer complimentary perspectives that would help to create a more complete situational diagnosis of stakeholder interest and interactions (Lienert et al., 2013). Other studies have promoted this view in natural resource governance and participatory planning (Paletto et al., 2015; Yamaki, 2017).
One important disadvantage of conventional SNA methodology and related data gathering through surveys or interviews (Wasserman and Faust, 1994) are problems in data collection similar to most other key informant methodologies. SNA requires reliable data to draw strong inferences from the analysis of the networks. This presents the need for a systematic validation procedure, which could mitigate the issues that arise with unreliable data, especially from research in low- and middle-income countries3, where data quality and availability is a consistent issue (Becker et al., 2012). Since most WASH research is carried out in similar settings, an appropriate validation procedure is even more relevant.
Decentralized wastewater treatment systems in India have witnessed an exponential increase in their uptake across the country in the last decade. This was prompted by an 2006 amendment to the environmental clearance laws that mandated that large buildings (built up area above 20,000 m2) treat sewage in situ. An estimated 20,000 small-scale Sewage Treatment Plants (STP), serving between 10 and 1,000 households, are currently in operation using various technologies (Ulrich et al., 2019). A majority of them are found in cities, both mega and secondary. However, due to the lack of a clear policy framework and jurisdictional overlap between governing agencies at various levels, the performance and sustainability of such small-scale sanitation systems (SSS)4 are affected (Chandragiri et al., 2019). Sustainable long-term operation of such SSS require effective governance (Ross et al., 2014). Understanding the governance of SSS can also help inform future policies for their planning, implementation and long-term monitoring. Such a study can also help the understanding of the nuanced differences between mega and secondary cities in India, which have inherent differences in institutional set up, urbanization, citizen engagement, decentralized wastewater treatment, and sanitation at large.
Therefore, the combined aim of this paper is to: (i) propose SNA as a useful tool for WASH research and practice, (ii) introduce a novel validation methodology for SNA, and (iii) explore the differences in sanitation governance between mega and secondary cities in India, using SNA as a tool. In doing so, this paper presents the first research carrying out social network analysis research for urban sanitation settings.
The goal in the first stage was to gather SNA data on the governance networks in four Indian cities based on interviews and surveys. This type of data gathering in the field is well established for SNA and has been previously used as a systematic method to describe and analyze the governance network between multiple stakeholders in areas such as the water sector (Lienert et al., 2013; Angst, 2018), natural resources governance (Bodin and Crona, 2009), climate governance (Ingold and Fischer, 2014), energy governance (Fischer, 2015), policies for reducing emissions (Brockhaus et al., 2014), and planning (Dempwolf and Lyles, 2012; Gerber et al., 2013). In this initial attempt, the relevant actors responsible for the SSS present in the four Indian cities (Chennai, Bangalore, Mysore and Coimbatore) were identified through informal expert contacts and document analysis (a set of about 15–20 actors per case, e.g., national, state and city level public administrations, international organizations, relevant boards, and associations, etc. An overview of actors appears in Table 2). Individual representatives of the relevant organizations were then contacted by email and phone in order to interview them or have them fill out a written survey with the same content. For example, in order to assess the relevant network relations among actors, the survey/interview protocol asked actor A to “check, on a pre-defined list of all relevant actors – all those actors with which actor A regularly exchanged technical information on sanitation issues within the last 10 years.”
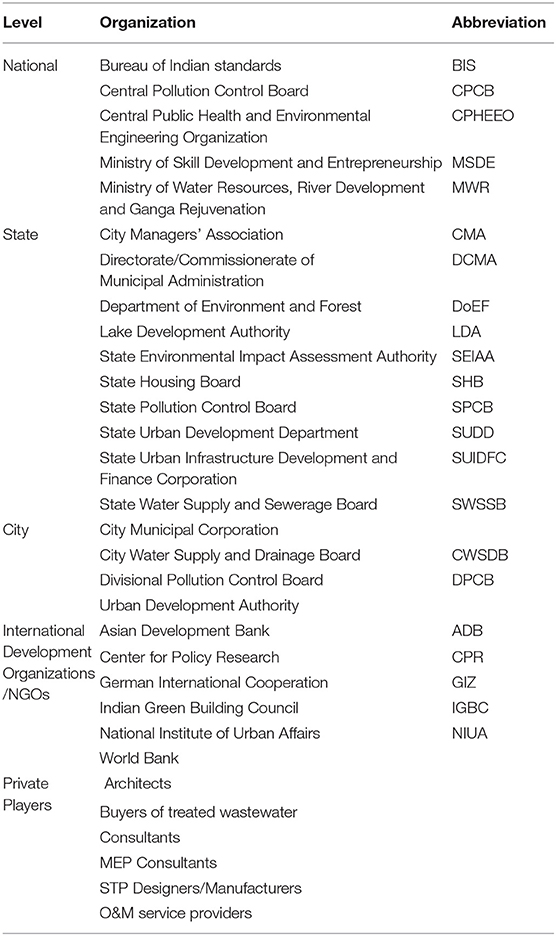
Table 2. List of actors identified in the first step for Karnataka and Tamil Nadu. See Figure 1.
A common problem with gathering network data directly from the stakeholders themselves is low response rates, as with any other interview and survey data gathering. In the present case, the interview and survey response rates on average were <40% (with a maximum of 50% in Bangalore and a minimum of 27% in Coimbatore). Common reasons for non-response are that individuals do not feel competent to answer the questions, are not interested in filling surveys, do not have time, do not want information about their organization to appear in studies, etc. These reasons were mentioned by actors in this specific case, but they correspond to common reasons for non-response in survey and interview-based research. Overall, while low response rates is a common problem specific to social science research in low- and middle-income countries such as India, it is also an issue in many studies of this nature elsewhere, including SNA research in the United States, for example (Lubell et al., 2017).
Low response rates lead to incomplete data. Data can be incomplete with respect to actors that are missing, or, more frequently, with respect to relations between the actors that are missing. Concerning the latter, survey and interview data gathering in the context of SNA always has two potential sources of information for the relations between two actors, that is, from one or the other actor. While this can mitigate issues of low response rates (if actor A indicates a relation to actor B, but information from actor B is missing, the researcher still has partial information on that relation), missing data in SNA can still be problematic for several reasons. Most importantly, incomplete network data can lead to unreliable estimates of network-level statistics, given that network-level statistics are based on the structure of the entire network (Burt, 1987). For example, centrality is a popular network measure used to identify the most important actors in a governance network (Table 1). Centrality measures can be incorrect due to missing data, or if parts of the networks are missing or disconnected from each other (Costenbader and Valente, 2003). More substantively, the analysis of incomplete network data might lead to the erroneous identification of important actors through wrong or unstable centrality indices. It can further lead to inaccurate density measures (see Table 1), if the percentage of missing data differs between the networks to be compared.
In order to increase the validity of the data gathered on the four cities in India, a validation methodology was developed. The objective of the process was to validate an existing, incomplete network, using available expertise from informants who have high knowledge of the case and the relationships the actors share within the network. This process of eliciting expert judgements has been previously used for WASH studies in low- and middle-income countries where data is often not readily available and knowledge from experts was found to be invaluable (Montangero and Belevi, 2007). Similar practices have been employed, albeit scarcely, to elicit network data for social network analysis. Carley and Krackhardt (1996) involved a third person within the network to comment on connections between dyadic relations, the equivalent of an “insider.” Here, the cognitive inconsistency between non-symmetric and non-reciprocated relations between actors were studied, using such insiders. Orenstein and Phillips (1978) used press reporters to give information about political actors' relations, a case which used members completely outside of the network, an “outsider.” As mentioned by Dorelan et al. (1989), it is important for these outsiders to be in the margins of the study group and yet remain knowledgeable.
Insiders bring in detailed information about relations between actors based on their direct experience and a perspective only available to them. Similarly, outsiders are beneficial due to their ability to view the entire network without direct involvement and, therefore, without egocentric biases (Dorelan et al., 1989). Using these two established types of informants, insiders and outsiders, simultaneously, allows for an additional level of confirmation to be obtained regarding network data between actors, while also reducing any possible perception biases.
In order to improve data reliability, a seven-step validation procedure has been proposed below. This procedure is based on network graphs that are visualizations of the social network. Most importantly, these visualizations include nodes (also called vertices) to represent the actors in the governance networks and ties (also called links or edges) to represent relations between the actors. Colors and sizes of nodes and ties can be used to represent attributes of these elements. For example, different colors can be used to represent different types of actors, and tie size can be used to represent the intensity of a relation. The steps of the validation procedure are grouped as desk based steps (1–3), field based steps (4–6) and reconciliation steps (7).
1. Usage of existing incomplete or desk based network graph
The initial network graph stems from an incomplete social network analysis, with either missing actors or missing information on relations between actors. The incompleteness can be either due to low response rates in interviews or surveys, or to the fact that it was a purely desk based study, which needs validation from the field to bring it closer to the reality of the different types of relations among actors.
2. Expert identification
This could either be carried out from a Power-Interest matrix, choosing actors with high interest (Quadrant-1 & 4 in Figure 1)5 or who could be chosen from case knowledge. 10–20% percent of the number of actors in the entire network graph, depending on its size, could feature as experts. It is preferable to keep this percentage low, otherwise there is a risk of carrying out an elaborate conventional SNA procedure of interviewing most actors, again with problems of missing responses. It also helps target the most valuable experts and ease the reconciliation (Step 7).
3. Insider–Outsider selection
An equal number of insiders and outsiders (defined as above) have to be selected from the experts. Those actors positioned in the core of the network graph with high centrality are classified as insiders and those actors who are either in the periphery of the previous network graph or who do not feature as an actor at all, and yet have high interest and/or knowledge about the context of the social network, will be classified as expert outsiders.
4. Discussion based on a simplified unconnected version
A simple version of the network graph, where actors are arranged randomly with equal sizes and without color codes or connections between them, is presented to each expert (insider and outsider). This ensures that there is only basic inference on the part of the actors, possible from the representation, and does not create any biases. In order to deal with the first basic issue, concerning missing data in the SNA (missing actors), it is verified that all important actors are featured, and that no non-important actor is included. If not, the suggested actors are added or deleted (for example: Divisional PCB is removed as mentioned in Figure 2).
5. Simplified version to make connections
Post the actor verification on step 4, the perceived relations between them are requested from the expert in order to deal with the second missing data issue in the SNA, that is, missing relations among actors. Types of connections vary by case; in governance, typical connections include information exchange (technical and administrative), collaboration, line reporting, etc. (Victor et al., 2016). These connections could be formal only, or informal only, or both- as required by the network graph. Initially, the obvious connections are marked, and then the less visible connections, such as informal or inter-sector connections are made (for example: International Organizations and Private Companies in Figure 2). This exercise might take some time, and often requires prompt questions.
6. Existing network graph for representation questions
Post the simplified unconnected version, the original non-validated network graph is presented to the expert, and representative questions are discussed. The expert is then invited to verify which actors are central or peripheral actors, which connections are present or not, and whether the size and positions of all actors are right, according to his view (note that the position of the actor usually represents its centrality, and the size can represent different types of information, in this case Eigenvector centrality). Additionally, any weak, non-existent or irrelevant connections are marked to be removed (for example: a weak connection between the Central Pollution Control Board and International Organizations was marked for removal in Figure 3. Similarly connections between urban development authority and divisional pollution control board, and state funding corporation and pollution control board were also suggested to be removed)6.
7. Data reconciliation
Based on all the data collected from the above steps 1–6, the corresponding binary adjacency matrix is filled as 1 or 0–the pair of actors being connected or not connected, respectively. When there are conflicting responses for the same connection from various sources, the reconciliation for the relation is carried out based on the following (see example in text further below):
(i) Data from the previous network graph;
(ii) Weightage of expertise of insiders and outsiders;
(iii) Documental evidence found;
(iv) Justification provided during the interview;
(v) Substantial case knowledge.
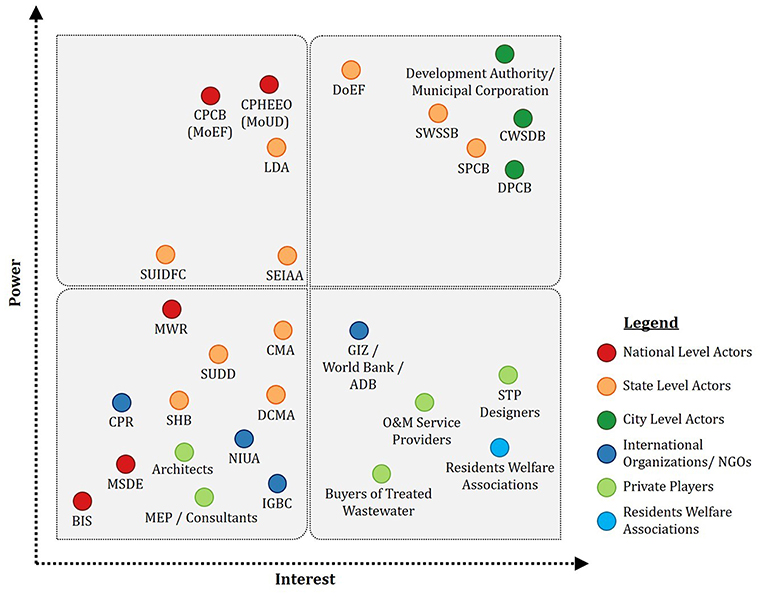
Figure 1. Power-interest matrix of potential stakeholders involved in small-scale sanitation governance at the local level. Refer to Table 2 for abbreviations. Color coding is followed in all other network graphs presented below.
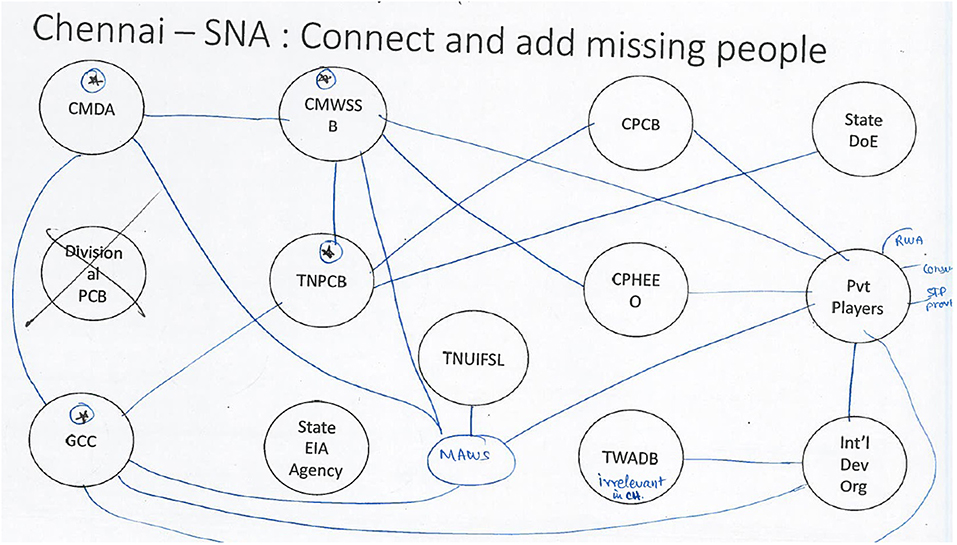
Figure 2. Representation of the discussion based on the simplified version mentioned in Steps 4 and 5 of the validation procedure.
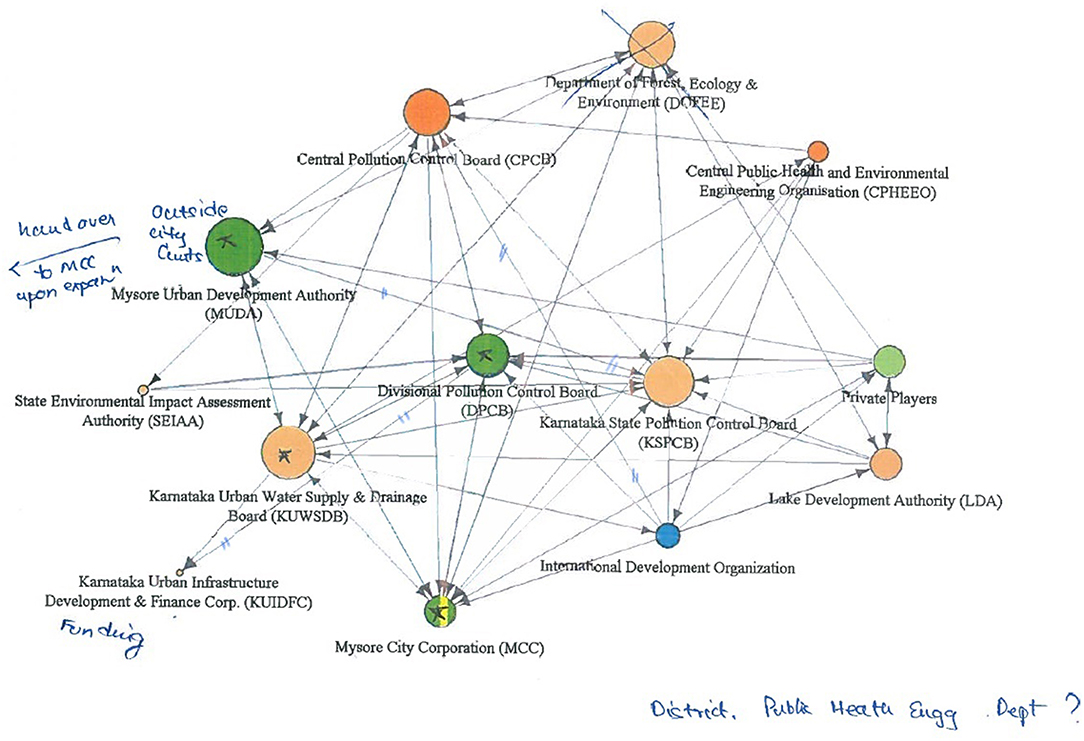
Figure 3. Representation of the discussion based on the initial version of the network graph mentioned in Step 6 of the validation procedure.
For the validation procedure proposed in this paper, four key stakeholders were chosen for each of the four cities and, a total of 16 validation interviews were carried out (Table 3). For reasons of potential research fatigue (Clark, 2008), all the stakeholders chosen were new and had not been interviewed for the previous social network analysis. This was possible, since these actors were not part of the earlier SNA interviews (due to poor selection, unavailability or inaccessibility at that point of time), which resulted in analysis being incomplete in the first place. In addition, certain experts, who were retired or switched careers, yet still had significant knowledge were included in the validation study.
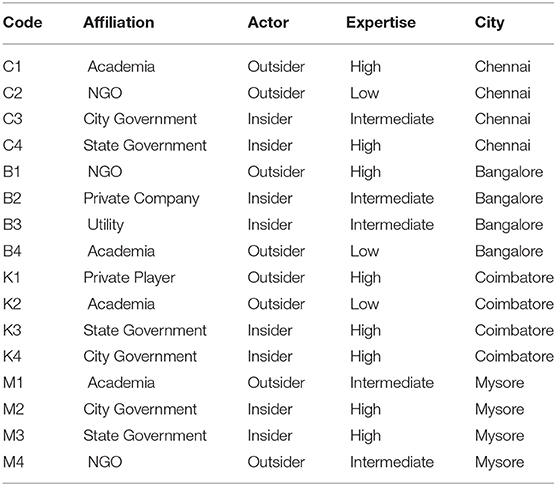
Table 3. Key Informants interviewed for validation with their expertise levels and interview codes.
While such a validation method allows for the gathering of additional data to complement incomplete networks and thus provides an improvement over incomplete survey- or desk-based studies, there are obviously some challenging issues as well. Below, four such challenges and their mitigation are discussed.
Firstly, knowledge biases, exercise preferences and effective priming are concerns for the format of the validation methodology. The order of steps 5 and 6 were found to be critical in drawing out major connections in the expert's opinions without biasing. This sequence also ensured that the actors are primed for a more visually complex, information dense and influential network graph. Through the combined usage of time consuming step 5 and visually intimidating step 6, experts who had a preference for one step over the other were also catered to. Experts are often senior and time pressed; therefore, the process had to be time effective and flexible. Therefore, this two-pronged approach reduces the amount of information lost due to temporal and methodological leaks.
Secondly, clarity in criteria for connections is important to establish at the beginning. Interpretation of the requirements of an existent connection varies depending on experts, and has to explicitly clarified. These assumptions could result in inaccurate connections (for example: are solely funding agencies of decentralized STP projects involved in governance, even if they have no responsibility apart from their financial contributions?). There is the possibility that large biases could emerge from the experts as well (for example: private sector experts tend to focus on their importance, while government players tend to downplay the former's importance (see Fischer and Sciarini, 2015). Both aforementioned concerns, could be mitigated by objectively administering the interview with clarity on the relational requirements and minimizing information spill to prevent biases.
Thirdly, prompting is frequently employed in order to maximize the information elicited from the experts, especially in circumstances where inherent knowledge or previous connections are to be challenged. This could potentially lead to interview frustration or bias (Bowling, 2005). At a certain point when all major connections are explored, to bring out inconspicuous connections, prompting is found to be necessary. The researchers must have a considerable amount of prior case in order to carefully prompt when required. For example in step 5, the connection between private company and the pollution control board, in several cases required prompting to be considered for either connecting or not.
Finally, conflicting information leads to difficulties in reconciliation. Since the validation methodology relies on fewer respondents, albeit experts, it requires care to bring in diverse perspectives. Otherwise, the SNA could risk becoming skewed through purposeful sampling (Patton, 1990). The validation procedure finally rests on the systematic reconciliation of conflicting data points. This is carried out qualitatively and involves the judgement of the researcher, which, yet again, places the requisite of prior substantive case knowledge on the researcher. Since the method itself is a mix of qualitative data collection and quantitative data analysis, these limitations are inherent and require careful consideration while selecting experts and being systematic during the reconciliation. However, such limitations are prevalent in most qualitative methods (Taylor et al., 2015), including conventional social network analysis (Scott, 2017). The reconciliation procedure becomes crucial when the experts give varying and frequently conflicting network data. Therefore, systematic assessment of the data needs to be carried out, based on expertise weightage, documental evidence, substantive case knowledge, and justification provided during the interviews. For example, when C3 and C4 (Table 3) had conflicting views on one specific connection between the city corporation and state pollution control board, C4's view was withstanding since C4 earlier held the positions at both city and state levels. Additionally, C4's justification proved to be more convincing with references to policy documents.
In the results section, we present and compare the governance of decentralized wastewater treatment in four cities based on the data received from the different steps of the data collection, including the validation procedure. Since the goal is to describe governance networks and compare different cases, SNA as a standalone method lacks context to interpret the network graphs and needs to be used in conjunction with other research methods, especially qualitative methods to gain deeper understanding of the situation and prevent simplistic conclusions on the stakeholder interactions (Prell et al., 2009; Edwards, 2010). Therefore, this validated network data was used in compliment with two workshops and 76 in-depth qualitative key informant interviews, which provided the background and context on urban wastewater management in India, for the selected mega and secondary cities, and the differences between them were explored (see results section). In addition, the institutional and performance analysis of the specific small-scale sanitation systems in the four cities was available to provide additional perspectives relevant to this analysis (Ulrich et al., 2019). The validated data was processed using the user friendly SNA specific open source software Gephi (Bastian et al., 2009), and represented using Force Atlas configuration without any manual manipulation.
In this section, four main results regarding the use of SNA for our case study are presented. Firstly, the comparison of the pre-validated SNA with the validated SNA, and the major modifications made from the validation exercise are given. Secondly, a detailed illustration of using SNA to understand governance of decentralized wastewater treatment in one particular city–Chennai, is made. Thirdly, the differences between mega and secondary cities in terms of sanitation are presented, and then SNA results are discussed in relation to few of these key differences.
The initial procedure yielded an incomplete network, based on which pre-validated network graphs were created for the four cities of Chennai, Bangalore, Mysore and Coimbatore (Figures 4A–D). Similarly, network graphs were created using the validated network data for the same cities (Figures 5A–D). The five major differences that are clearly visible are discussed below—actor influence, removal of irrelevant actors, addition of important actors, centralities of actors and densities of overall network.
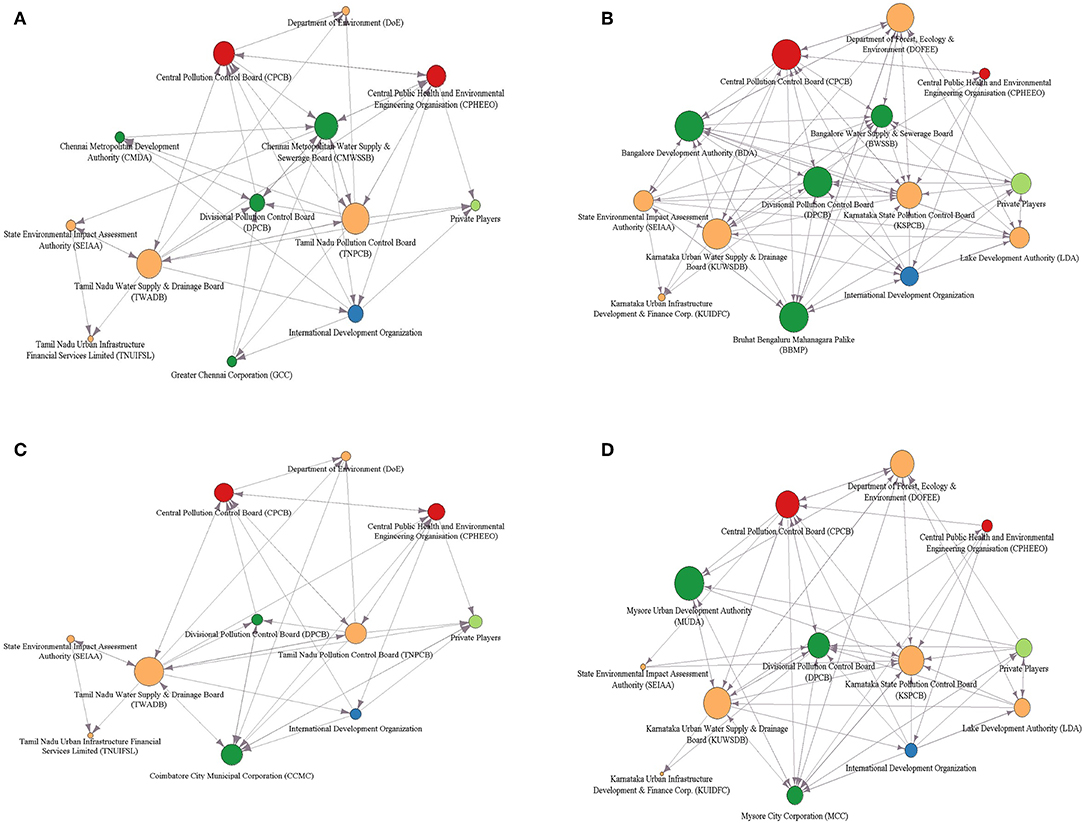
Figure 4. Pre-validated network graph of actors present in (A) Chennai, (B) Bangalore, (C) Coimbatore, and (D) Mysore.
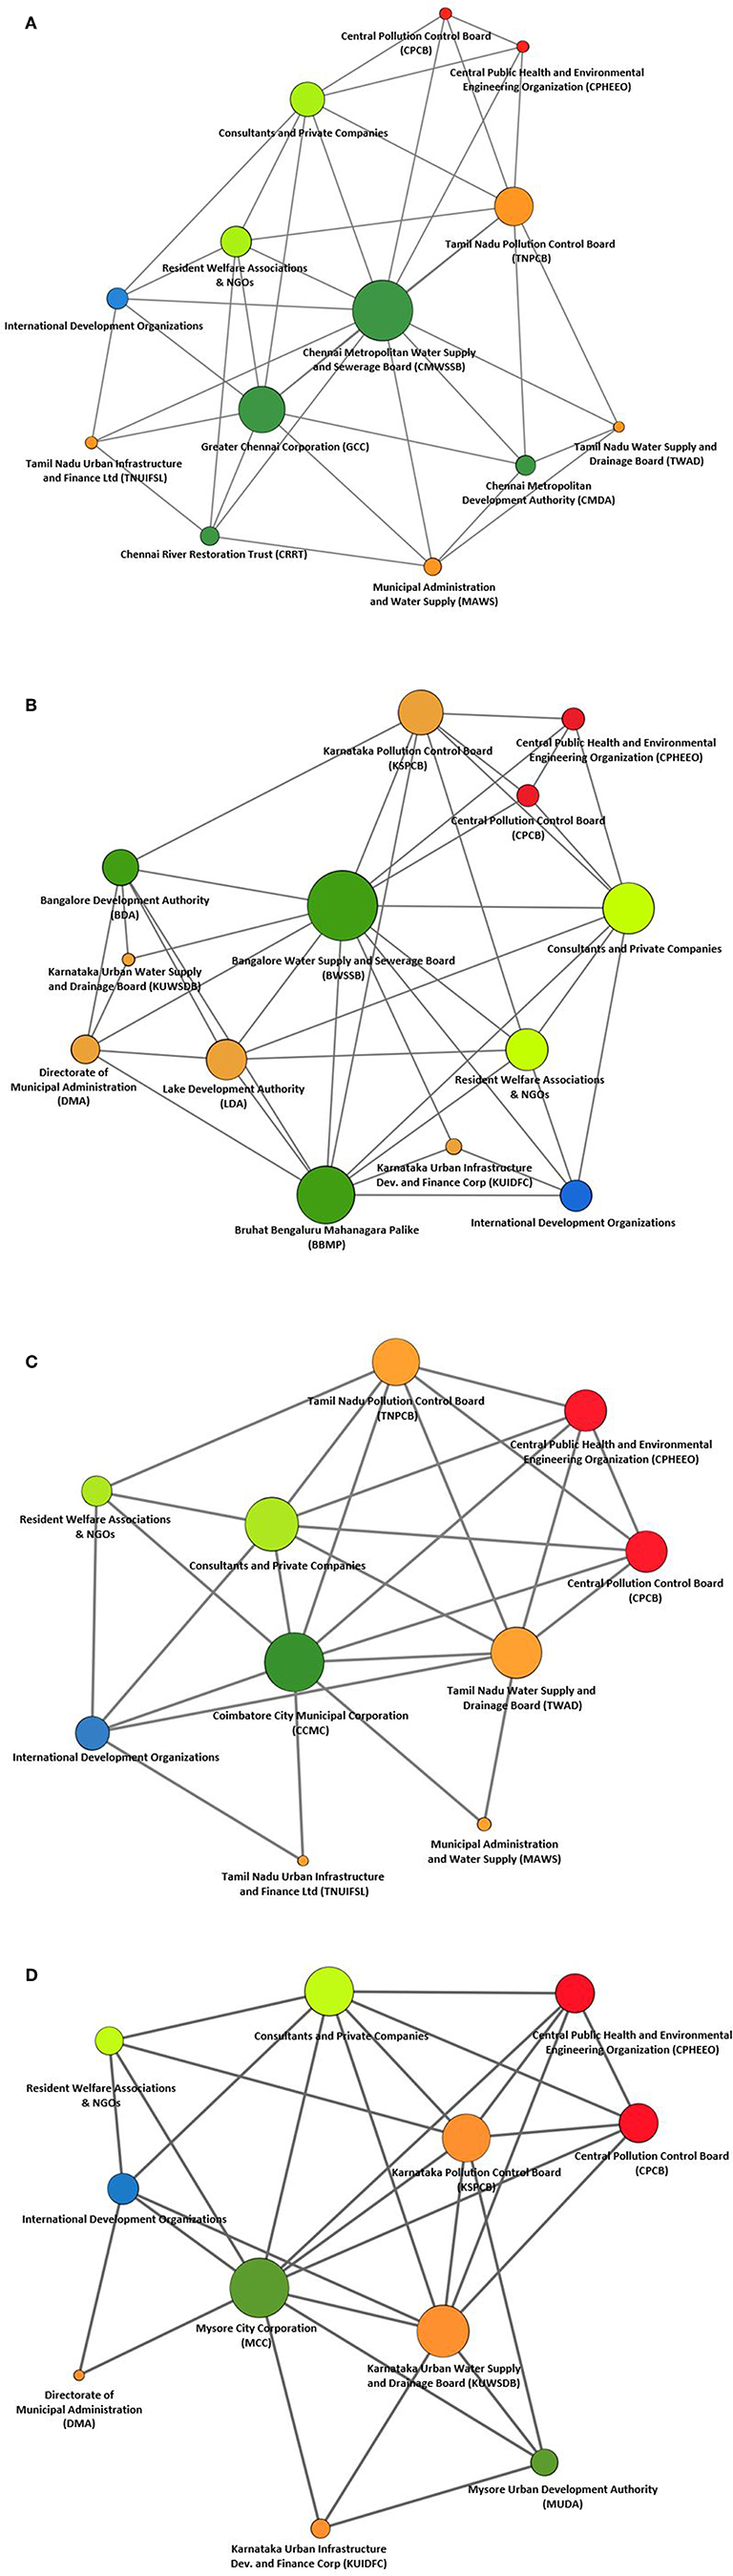
Figure 5. Validated network graph of actors present in (A) Chennai, (B) Bangalore, (C) Coimbatore, and (D) Mysore.
In the interviews, it was unanimously stated that certain actors had a much bigger role in implementation than others who only had soft powers to influence policies. Actors were then broadly classified as implementing actors and influencing actors. For example, comparing Figures 4B, 5B, the Central Pollution Control Board (CPCB) and the Central Public Health and Environmental Engineering Organization (CPHEEO) are influencing actors, while Bangalore's Water Utility (BWSSB) and Resident Welfare Associations (RWAs) are implementing actors. It is important to note that the aforementioned influencing actors are at the national level, while implementing actors are at local level. CPCB sets effluent standards while CPHEEO develops engineering manuals, and both are strong influencers in designing SSS for all contexts. Whereas, BWSSB and RWAs are actors that are directly involved in the building, operation and maintenance of SSS. Although these influencing and implementing actors could have been visually marked differently in their node7 characteristics, the validated network graph clearly makes the distinction through their position in the core or periphery (Table 1), and their node sizes that represent their centrality measures.
Through step 4, the most relevant actors were identified, and unimportant actors were removed. This resulted in changes in the actors present in the network. The main actors removed were the State Environmental Impact Assessment Agency (SEIAA), the Divisional PCB (DPCB), and the Department of Environment (DoE), due to their relative insignificance in the governance of SSS. SEIAA was removed due to the fact that the Impact Assessment Certifications for construction and operation of STPs are within the purview of the respective state pollution control boards (CPCB, 2016). DPCB is a department within the state PCB and, therefore, does not require explicit mention. DoE as a department does not directly play any role apart from being the state level agency that the PCB reports to.
Additions were made to the social network, as certain actors were found to play a directly influencing or implementing role in SSS for these cities. In Figure 5A, Chennai River Restoration Trust (CRRT), a special purpose vehicle (an independent legal entity with a specific goal, which in this case has the mandate of the rejuvenation of urban water bodies in Chennai) was found to be engaged in the setting up of SSS and also in coordinating with other actors for SSS's wider establishment, and was therefore, added. Similarly, the node Private Players (Figures 4A–D), was meant to represent RWAs, NGOs, private STP companies, and consultants. Since the adjacency matrix of their relationship with other actors varied highly, they were split into two groups (Figures 5A–D). Further, the main agency that directed all municipal governance including water and sanitation was the Municipal Administration and Water Supply (MAWS) in the state of Tamil Nadu, and the Directorate of Municipal Administration (DMA) in the state of Karnataka. These agencies were found to play a bigger role in the smaller cities with respect to SSS.
Overall, the centralities of actors changed with modification in the network data. The most central agency is no longer the PCB, but the utility (CMWSSB/BWSSB) in the mega cities of Chennai and Bangalore while the municipal corporation (CMC/MCC) became the most central actor in the secondary cities of Coimbatore and Mysore, with the parastatal water supply and drainage board (TWAD/KUWSDB) playing a bigger role in the latter two.
The densities of the networks of the four cities have also changed to reflect a more uniform network density across the four cases (Table 4). This is a result of the changes in the overall number of actors and the changes in the individual relations of each actor. The higher values are due to the elimination of irrelevant actors who earlier had minimum connections, thereby increasing the overall network density.
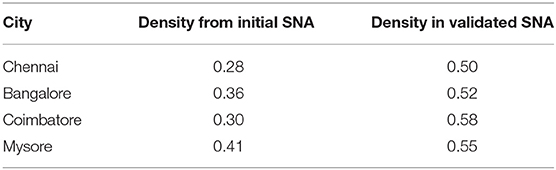
Table 4. Network densities for the respective cities before and after validation.
In order to illustrate the usage of SNA for insights into the governance of decentralized wastewater treatment, the case of Chennai is taken as an example (Figure 5A). There are a total of 13 key actors involved in the city's SSS. The network overview characteristics, such as network density and average path length provide basic insight into the network graph. A density of 0.50 indicates quite strong connections, as half of the actors are directly connected with each other. The network diameter of 2 shows that the longest distance between two nodes positioned afar is 2, and for them to have contact there is one actor in between. The average path length of 1.5 corroborates this by suggesting that on an average, any two actors are connected through one and a half other actors. These network characteristics are particularly useful when comparing networks, but are more difficult to interpret by themselves. For example, we can state that a network in one city is denser than in another city, but it is hard to judge whether the network is dense, per se, as this depends very much on the type of network (type of context, types of nodes, types of ties, etc.).
All actors either perform the roles of implementing or influencing agencies and, as mentioned before, this is not explicitly labeled, but the size of the nodes and their positions form a core and periphery structure (Table 1) which indicates whether the actors are implementing or influencing. In the case of Chennai, the Utility (CMWSSB), the municipal corporation (GCC), State PCB (TNPCB), Consultants & Private Companies, and RWAs & NGOs are directly involved in the process of commissioning, licensing, building, operating, and maintaining SSS. Therefore, they are clearly seen to be implementing agencies, while all the others remain only as influencing agencies since they only have indirect involvement in the process, such as financing, setting standards for discharge and performance, providing expertise, advocating or simply approving SSS projects.
The centralities of these actors offer more detail in terms of how much power they have within the network. This also translates to how much influence they have in governance within this context. Among the many different centralities (Table 1), degree centrality and betweenness centrality are the most relevant in the present case, as they offer simple measures of an actor's influence within the network. Together, they offer a complimentary set of perspectives i.e., degree centrality represents the simple number of connections an actor has—and thus the actor's potential to serve as a hub. Whereas, betweeness centrality represents the extent to which an actor is placed on a path between other actors. The latter shows the power an actor has in controlling information exchange between other actors, and how the network will get disrupted if that actor is removed. Table 5 provides the values of centralities for all actors involved in SSS governance in Chennai. For example, CMWSSB as the most central actor has connections to all other 12 actors, whereas four actors are connected to only a third of the network (degree centralities of 4). The betweenness centralities are more complicated to interpret directly from the measure, but suggest a clear hierarchy in terms of the actors able to connect other actors within the network. While both centrality measures offer theoretically informed complementary perspectives, they are also highly correlated, suggesting that actors cumulate different aspects of centralities and related potential for influence, etc.
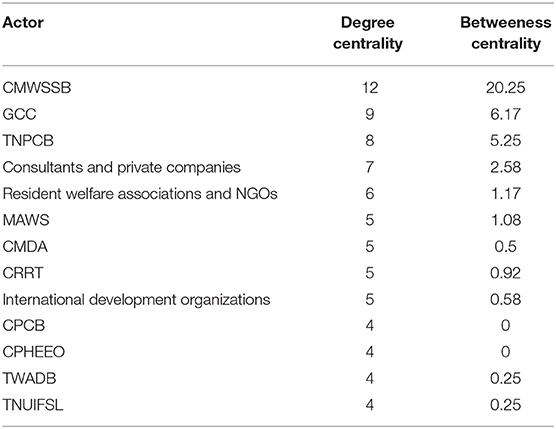
Table 5. Centrality measures of different actors in Chennai.
Based on the centralities, actors and their most suitable functions can be identified. For information diffusion, the actor with the highest centrality measures (both degree and betweeness) is CMWSSB. They are best placed to inform all actors of policy changes, standard settings, and best practices. For, the role of monitoring, a governmental agency requires a high centrality and to be within the core of the network, yet independent enough that it is not easily influenced by virtue of its connections to other actors. In this case, CMWSSB, GCC and TNPCB are relevant agencies for monitoring the performance of SSS in Chennai. TNPCB has already been constitutionally mandated to monitor all sewage treatment discharges, according to the Water Act of 1974. A recent notification from the National Ministry of Forests and Environment has delegated the power of ensuring compliance with environmental standards, to the urban local bodies such as GCC (Chandragiri et al., 2019). In reality, there is little clarity on these institutional mandates for the long-term monitoring of SSS and each of these agencies have their own limitations in terms of jurisdictional reach and capacity (Chandragiri et al., 2019). Therefore, purely looking at the SNA, CMWSSB is the most central actor with the highest betweeness centrality by far; it has access to most of the other actors involved in SSS. In addition, CMWSSB is an independent agency and works toward overall sanitation provision for the city; it is best suited to perform the role of monitoring individual SSS. Further, since CMWSSB themselves are required to report to TNPCB about their own treatment performance, TNPCB could be the ultimate custodian of the monitoring database and capable of performing the final verification audits of SSS performances. This function is suitable to their limited organizational capacity.
In the planning process of CWIS projects, it is important to involve all stakeholders present (Narayan and Luthi, 2019). In this particular case of governance of SSS, actors, such as CRRT, who advocate for SSS and for the restoration of urban water bodies in the city, are often not included in the planning. Similarly, CMDA who is responsible for zoning and approval of all construction plans including those of SSS, does not even feature in conventional stakeholder analysis for the same reason. This is also evident from the lack of connections between international organizations involved in SSS projects and CRRT/CMDA. Such agencies can be powerful allies when forming coalitions to create policy shifts or simply to help support the planning of SSS in CWIS projects.
SNA can also inform about many other aspects of WASH research and practice, such as the important role of consultants and private companies in setting up SSS as seen by their betweeness centrality, or the limited connections international organizations have with state and national level actors in SSS governance (visible in the network graphs in Figures 5A–D). These all have a direct effect on the governance of this sector. These are all deeper insights which other methods such as stakeholder analysis, often fall short in bringing to light.
Although there is no standardized definition for the boundary of a city, the administrative jurisdiction, built up area and degree of economic and social interconnectedness together provide a delineation of what is a city. Mega cities are, however, clearly defined as urban agglomerations with a population more than ten million (UN DESA, 2016). Secondary cities are more complicated to describe, as they are contextually defined in terms of population, functionality, connectivity and hierarchy. However, at large, these are cities with a population that is between 10 and 50% of the largest city in the country, and contribute significantly to the regional and subnational economies (Roberts, 2014).
In India, cities are classifiede under several systems by the revenue departments, census agencies, central ministry of urban development and individual state governments (Nandi and Gamkhar, 2013). At the national level, the Class system and Tier system are popular and they classify cities by population and economic contribution. They are however, inconsistent with international terminology and vary even between each other. Therefore, in our analysis henceforth, international definitions are followed. Mega cities are 10 million above in population and secondary cities are ones with a population of at least one million, and feature among the top five in the economic hierarchy of the state.
Therefore, Chennai and Bangalore with populations of 10–11 million each feature as mega cities, whereas Coimbatore and Mysore with populations of 1–3 million each (UN DESA, 2016) and by virtue of their positions in the respective state hierarchy, feature as secondary cities. The reason for choosing to study these four cities is multi-fold. Among the five mega cities in India, Chennai and Bangalore were most comparable by size and demography. The states of Tamil Nadu and Karnataka to which they belong, respectively, have dedicated and progressive sanitation policies. Hence, within the two states, the respective secondary cities of Coimbatore and Mysore were chosen due to high data availability from past projects. Therefore, by reducing inherent variability, the key differences with respect to sanitation could be better focused.
In the sanitation sector, especially within India, the differences between rural and urban contexts (O'Reilly and Louiss, 2014; Chaudhuri and Roy, 2017) and the characteristics of small towns have been previously explored (Sundaravadivel and Vigneswaran, 2001; Singh et al., 2015). However, there has been no study to date of the differences between mega and secondary cities in the WASH context. There are considerable differences in their institutional set up, funding availability, community engagement, urbanization and presence of SSS (Table 6) that are worth exploring8. These differences are important in planning for CWIS, which aims to contextually determine sustainable sanitation interventions (Lüthi and Narayan, 2018). Since the governance landscape, business ecosystem, stakeholder involvement and local knowledge vary significantly between these two types of cities, accounting for these differences in the planning and design stage of sanitation systems, especially in SSS, augers well for their success and sustainability.
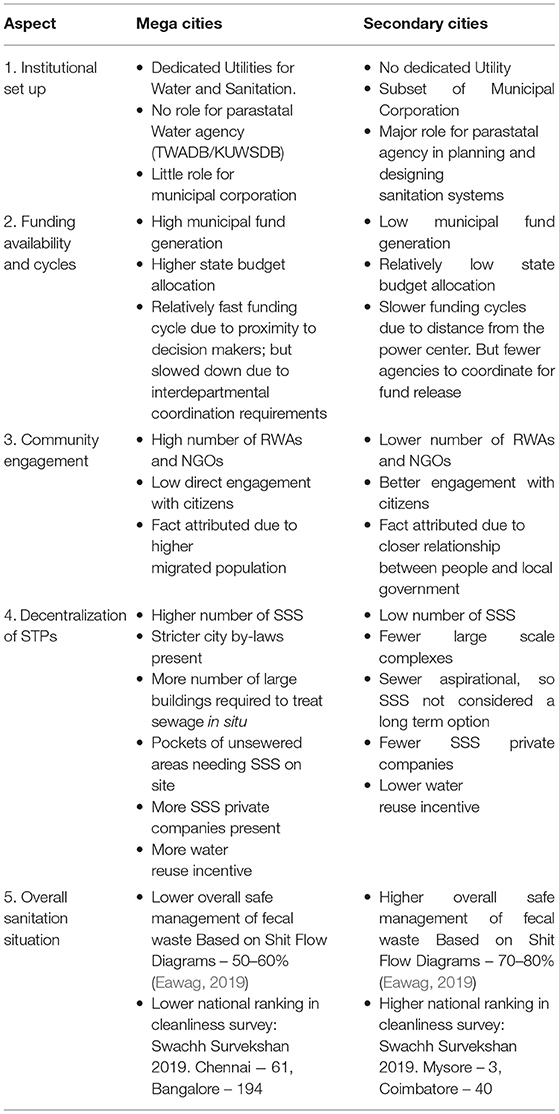
Table 6. Key differences between Mega Cities and Secondary Cities of India in overall sanitation as summarized from qualitative interviews and workshops.
The network graphs (Figures 5A–D) and their related measures (Table 1) that result from the SNA can be usefully related to some of the differences between mega and secondary cities with respect to sanitation, particularly SSS (Table 6). Other differences, however, are beyond the scope of SNA. The discussion below focuses on three key differences that relate to SNA.
Firstly, the differences in the institutional set up are visibly seen, as the number of actors involved, and their respective positions in the network graph vary. Sanitation in mega cities is governed by a dedicated utility, while sanitation in secondary cities is often governed within the municipal corporation itself. This is clearly seen through the central actors in the network graphs (Figures 5A–D), where the utilities of Chennai and Bangalore (CMWSSB/BWSSB) assume the central positions, whereas in Mysore and Coimbatore, they are replaced by the municipal corporations (MCC/CMC), along with a larger role for the parastatal agencies (TWAD/KUWSDB). Similarly, due to the limited capacity available for SSS planning in secondary cities (Chandragiri et al., 2019), consultants and private companies end up playing a larger role (see Figures 5C,D).
Secondly, community engagement is another key difference between mega and secondary cities. In the former, there are a higher number of non-governmental organizations (NGOs) and resident welfare associations (RWAs) reported; yet, the quality of engagement with the citizens is relatively lower when compared to the secondary cities. One plausible explanation from experts for this, is the higher amount of migrants venturing into mega cities for job opportunities, who have a significantly lesser connection with the governance of the cities, when compared to the residents who have spent a majority of their lives in secondary cities, and the latter have a greater motivation for better governance and infrastructure. Studies have suggested that the sense of belonging among migrants toward a new city, their past experiences, and the broader narrative in place, affect their involvement in urban governance (McDuie-Ra, 2012; Scholten et al., 2017; Wessendorf, 2017). This aspect is not clearly deductible from the present network graphs, since the quality of the relations were not accounted for in this analysis. Nevertheless, SNA as a tool has the scope to do such an analysis and can represent the quality of relations though the thickness or shades of color in the connections.
Thirdly, the overall sanitation situation in the two secondary cities have been found to be considerably better than that of the two mega cities, as seen in the results of the “Fecal Waste Flow Diagram” (also called “SFD”) assessments (Eawag, 2019). The national level survey on cleanliness, which includes fecal waste and solid waste management, have placed Mysore and Coimbatore in the top 50, whereas, Chennai and Bangalore are 61 and 194 (MoHUA, 2019). However, Chennai, along with Bangalore, consistently ranked above 100 in the past editions. The SNA for these four cities can contribute to the explanation of this diagnostic. Mega cities have issues regarding coordination and overlapping jurisdictions, which the network graphs have visually revealed with multiple actors (Utility, Municipal Corporation, Pollution Control Board and City Development Authority) involved in SSS governance and implementation, yet having limited connections between them. This causes issues in sanitation governance and leads to slower funding cycles even though the proximity to power centers is closer in mega cities. The overall graph density further gives an insight into relatively poorly connected actors in mega cites compared to marginally better secondary cites (Table 4).
The above results indicate that SNA could bring out useful information and new perspectives for WASH governance that other methods miss out. SNA can also corroborate key qualitative evidence, while allowing for a systematic comparison of the governance networks in different cities.
The validation method itself goes beyond the WASH sector and can be applied in any situation where the reliability of network data is low. The validation methodology proposed in this paper is particularly useful when data reliability is low due to poor response rates; it helps validate incomplete and desk based SNAs, which was found to be the case in the initial attempt of carrying out a conventional SNA.
The results also reveal that a simple SNA, such as the present case, has limitations in terms of the differentiating factors that could be analyzed between mega and secondary cities. Yet, this limitation can be significantly overcome. There is scope for SNA as a tool to get more complex, and to account for the quality, strength and formality of connections by weighing the relationship and representing them using thickness, patterns and color shades of edges connecting nodes (e.g., Brandes and Wagner, 2004).
The reconciliation procedure in the validation methodology relies on the researcher having inherent case knowledge and places emphasis on their judgement. Albeit systematic, the replicability of results is uncertain, as in any other qualitative method. Since the reconciled data is a binary matrix of relations, there is high risk of low replicability. This can be mitigated if the reconciliation is based on statistical measures of centrality or simply Bayesian, which then could be represented as weighted edges. The size of nodes, which currently represents centrality, could also be altered to represent other factors, such as perceived importance, size of organization, power, interest, or any other factors the research would benefit in representing.
It is important to use SNA in tandem with other methods to derive relevant conclusions that are complimentary. SNA as a standalone method risks being simplistic with little context sensitivity. Depending on the research question, SNA in compliment with stakeholder analysis, qualitative interviews, focus group discussions, stakeholder workshops, discourse analysis, etc., could deliver deeper insights. This has been shown throughout the results, which uses contextual information from qualitative interviews and document analysis to strengthen various arguments, such as the larger role of the private sector in driving SSS in secondary cities. Furthermore, additional useful questions could be asked based on the network data, and involving more advanced statistical tools. For example, Exponential Random Graph Models (ERGMs) (Cranmer et al., 2016; Fischer and Sciarini, 2016) and similar models allow for inferences on the factors associated with network ties between two actors. Relying on such methods could for example reveal whether actors exchange information mainly due to their ideological similarity, or due to being part of the same institutional arena. Based on such results, concrete measure could be taken to strengthen network relations among a given set of actors in the entire network.
Therefore, SNA has the potential to be a powerful tool in the WASH sector, especially when planning for Citywide Inclusive Sanitation (CWIS), which involves participation of all stakeholders, in order to provide equitable and context appropriate solutions. Therefore, the results of an SNA, along with a stakeholder analysis, adds value to the initial step of planning—a diagnostic study of sanitation governance in the select city. SNA as a process is just as valuable as the results, since it allows for the identification of marginalized stakeholders who are part of the sanitation governance, by not just the researcher, but also the survey participants themselves (Valente et al., 2015; Hauck et al., 2016). SNA as a process, proposed in this paper, is enriching for the participants as well, since it uses techniques of knowledge co-production which engages the local actors in social learning (see Schröter et al., 2018). Such a tool is important in the urban WASH sector, especially in low and middle-income countries, such as India, where the complexity of stakeholders involved is immense. This could help the planning for CWIS become inclusive even at the local level closest to implementation. It could identify actors who could potentially act as policy entrepreneurs or form advocacy coalitions to bring about policy shifts (Ingold, 2011).
The differences in mega and secondary cities that are presented also significantly help in planning for SSS in particular. Lack of monitoring leads to poor operation and maintenance, which then leads to poor performance of systems, and ultimately results in failure of SSS, as proved in India (Davis et al., 2019; Ulrich et al., 2019). The present SNA has been shown to identify the actors who are best suited to carry out the long-term monitoring of SSS. Although WASH governance is not rigid and can be adaptable (Rosenqvist, 2018; Chandragiri et al., 2019), based on an actor's position and connections, their functional potential could be explored to identify which actors are best placed to perform certain functions—central actors for information diffusion and overall influence, and peripheral actors for support functions, presence of cliques for collaboration etc. Such nuanced and visual information will be a useful addition, when seeking to strengthen governance, by using stakeholder participation tools in local scale systems such as The Governance Spectrum and Role play Scenarios (Mitchell and Ross, 2016) or form the basis for action research using participatory design games as used in the study of governance of community-managed sanitation services in Indonesia (Rosenqvist, 2018).
Further research is necessary to understand the limits of using SNA for the WASH sector, and of the validation methodology presented. The proof concept tested in this article has <15 actors in each of the four cities. The feasibility of the usage and validation could be tested for larger networks, where the nodes are not institutional actors but individual actors, in cases directly involving implementation of CWIS interventions.
The paper proposes SNA as a useful tool for the WASH sector, especially in planning for CWIS. It provides deeper insight into the stakeholders involved in governance situations, such as decentralized wastewater treatment. Apart from visually representing the actors and the exchange of information between the connections, SNA has been shown to be used for comparing contextual differences between different cases, such as SSS governance in mega and secondary cities.
The validation procedure helps to overcome the problem of low response rates in the gathering of network data, which results in incomplete SNA and leads to unreliable network graphs and centralities. The problem of incomplete or desk based SNA, which is frequently present in research in the WASH sector of low- and middle-income countries can be overcome through the use of the proposed validation methodology. The novel use of the combination of insiders and outsiders with expert knowledge, balances the biases and widens the perspective of the SNA.
The proof of this concept is tested in four mega and secondary cities in India—Chennai, Bangalore, Coimbatore and Mysore, for the context of the governance of decentralized wastewater treatment. Using Chennai as an example, the use of SNA to show fine grained insights, such as overall network densities, actor centralities, and functional suitability of actors to perform monitoring has been illustrated. This, combined with the inferences from qualitative analyses, shows that the SNA can corroborate few key differences between mega and secondary cities with respect to SSS governance, their institutions, community engagement, funding availability and the overall sanitation situation. These differences are important considerations to be discussed when planning and designing CWIS projects for such cities.
The datasets generated for this study are available on request to the corresponding author.
According to Eawag Ethical Review of Projects involving human subjects, this was deemed minimal risk. All participatory data collected was through verbal consent and fully anonymised.
All authors listed have made a substantial, direct and intellectual contribution to the work, and approved it for publication.
Initial network graphs were made in the 4S project, funded by Bill and Melinda Gates Foundation. All subsequent research costs were funded internally by Eawag. Open Access publication costs were covered by Lib4RI.
The authors declare that the research was conducted in the absence of any commercial or financial relationships that could be construed as a potential conflict of interest.
The authors express their appreciation to the members of the 4S project, Lukas Ulrich, Philippe Reymond, Harsh Patel and Tamara Kabir, for their contribution in data collection and the initial network analysis. The authors also wish to acknowledge Paul Donahue and Jonas Heiberg for their assistance in strengthening the manuscript.
1. ^Table 1 adapted from Prell et al. (2009). For further SNA concepts, see Prell et al. (2009), Wasserman and Faust (1994), and Scott (2017). Table 1 provides five relevant SNA concepts for WASH, of which first three are focused in the results and discussion sections.
2. ^In this article, the words relations/connections between actors/stakeholders are used interchangeably. “Connections between actors” is often used to describe SNA specific points and “relations between stakeholders” to describe case specifics.
3. ^For recent applications of SNA on questions of governance in low- and middle-income countries, see e.g., Brockhaus et al. (2014), Andriamihaja et al. (2019), Fischer et al. (2019), Gorris et al. (2019).
4. ^In order to be consistent in terminology, for all the interviews, “small scale sanitation systems” were used to refer to decentralized STPs that serve between 10 and 1,000 households.
5. ^As part of the study, a stakeholder analysis with a power interest matrix, was carried out for the above cases (Figure 1) (Chandragiri et al., 2019). The power interest matrix classifies the stakeholders identified according to the power they hold and their interest in the decision making process on all aspects of decentralized wastewater treatment plants in each of these cities (Reymond, 2014). “Power” (vertical dimension) refers to the ability of an actor to make decisions and to influence the system, independently of its formal role. “Interest” (horizontal dimension) refers to their involvement in the sector, based on their responsibility (Ackermann and Eden, 2011).
6. ^Note that additional important information on network relations among actors could be the direction of the relation (directed or undirected, depending on the type of relation) or the weight of the relation (vs. only the presence and absence of the relation). In this study, pre-validated networks are directed, and due to the nature of information exchanged, the validation process yielded undirected networks.
7. ^Nodes are representation of actors within the network graph. Their color, size and position are important visual characteristics that define them. Other statistics, such as various centralities for each of the nodes, can also be calculated (Scott, 2017).
8. ^Although most of the differentiating characteristics of mega and secondary cities mentioned, including institutions and community engagement, are common across all of India, there could well be unique factors in each city that create outliers in their sanitation situations. Additionally, the differences explored here only have limited extrapolation outside the sub-continent.
Ackermann, F., and Eden, C. (2011). Strategic management of stakeholders: theory and practice. Long Range Plann. 44, 179–196. doi: 10.1016/j.lrp.2010.08.001
Andriamihaja, O. R., Metz, F., Zaehringer, J. G., Fischer, M., Messerli, P., Andriamihaja, O. R., et al. (2019). Land competition under telecoupling: distant actors' environmental versus economic claims on land in north-eastern Madagascar. Sustainability 11:851. doi: 10.3390/su11030851
Angst, M. (2018). Bottom-up identification of subsystems in complex governance systems. Policy Stud. J. doi: 10.1111/psj.12301
Bastian, M., Heymann, S., and Jacomy, M. (2009). Gephi : An Open Source Software for Exploring and Manipulating Networks Visualization and Exploration of Large Graphs. Available online at: www.aaai.org/ocs/index.php/ICWSM/09/paper/view/154 (accessed June 25, 2019).
Becker, S., Bryman, A., Ferguson, H., and Thomas, H. (2012). Understanding Research for Social Policy and Practice : Themes, Methods and Approaches. Available online at: https://books.google.co.uk/books?hl=en&lr=&id=QB-LaGf05z0C&oi=fnd&pg=PR1&dq=qualitative+research+bryman+2012&ots=m5bQaBMfUT&sig=jYRn6pTlFfx56tn_V6T_6Tmdttg&redir_esc=y#v=onepage&q=qualitativeresearchbryman2012&f=false (accessed August 8, 2017).
Bodin, Ö. (2017). Collaborative environmental governance: achieving collective action in social-ecological systems. Science 357:eaan1114. doi: 10.1126/science.aan1114
Bodin, Ö., and Crona, B. I. (2009). The role of social networks in natural resource governance: what relational patterns make a difference? Glob. Environ. Chang. 19, 366–374. doi: 10.1016/j.gloenvcha.2009.05.002
Boex, J., Malik, A. A., Brookins, D., Edwards, B., and Zaidi, H. (2020). “The political economy of urban governance in asian cities: delivering water, sanitation and solid waste management services,” in New Urban Agenda in Asia-Pacific: Governance for Sustainable and Inclusive Cities, eds B. Dahiya and A. Das (Singapore: Springer Singapore), 301–329. doi: 10.1007/978-981-13-6709-0_11
Borgatti, S. P., and Everett, M. G. (1999). Models of corerperiphery structures Stephen. Soc. Networks 21, 375–395. doi: 10.1016/S0378-8733(99)00019-2
Borgatti, S. P., and Ofem, B. (2010). “Social network theory and analysis,” in Social Network Theory and Educational Change, 17–29. Available online at: https://www.researchgate.net/profile/Stephen_Borgatti/publication/298097232_Overview_Social_network_theory_and_analysis/links/5715549508ae0f1a39b1a475/Overview-Social-network-theory-and-analysis.pdf (accessed June 6, 2019).
Bowling, A. (2005). Mode of questionnaire administration can have serious effects on data quality. J. Public Health 27, 281–291. doi: 10.1093/pubmed/fdi031
Brandes, U., and Wagner, D. (2004). “Analysis and visualization of social networks,” in Graph Drawing Software, eds M. Jünger and P. Mutzel (Berlin; Heidelberg: Springer Science & Business Media), 321–340. doi: 10.1007/978-3-642-18638-7_15
Brockhaus, M., Di Gregorio, M., and Carmenta, R. (2014). REDD+ policy networks: exploring actors and power structures in an emerging policy domain. Ecol. Soc. 19:29. doi: 10.5751/ES-07098-190429
Bron, C., and Kerbosch, J. (1973). Algorithm 457: finding all cliques of an undirected graph. Commun. ACM 16, 575–577. doi: 10.1145/362342.362367
Burt, R. S. (1987). A note on missing network data in the general social survey. Soc. Networks 9, 63–73. doi: 10.1016/0378-8733(87)90018-9
Carley, K. M., and Krackhardt, D. (1996). Cognitive inconsistencies and non-symmetric friendship. Soc. Networks 18, 1–27. doi: 10.1016/0378-8733(95)00252-9
Chandragiri, R., Reymond, P., and Ulrich, L. (2019). Governance of Small-Scale Sanitation in India - Institutional Analysis an Policy Recommendations. Zurich: Eawag. Available online at: www.sandec.ch/4S
Chaudhuri, S., and Roy, M. (2017). Rural-urban spatial inequality in water and sanitation facilities in India: a cross-sectional study from household to national level. Appl. Geogr. 85, 27–38. doi: 10.1016/j.apgeog.2017.05.003
Costenbader, E., and Valente, T. W. (2003). The stability of centrality measures when networks are sampled. Soc. Networks 25, 283–307. doi: 10.1016/S0378-8733(03)00012-1
CPCB (2016). Hazardous Waste Management Series - Environmental Impact Assessment Notification. New Delhi: Ministry of Environment, Government of India. Available online at: www.cpcb.nic.in
Cranmer, S. J., Leifeld, P., McClurg, S. D., and Rolfe, M. (2016). Navigating the range of statistical tools for inferential network analysis. Am. J. Pol. Sci. 61, 237–251. doi: 10.1111/ajps.12263
Davis, A., Javernick-Will, A., and Cook, S. M. (2019). The use of qualitative comparative analysis to identify pathways to successful and failed sanitation systems. Sci. Total Environ. 663, 507–517. doi: 10.1016/j.scitotenv.2019.01.291
Dempwolf, C. S., and Lyles, L. W. (2012). The uses of social network analysis in planning: a review of the literature. J. Plan. Lit. 27, 3–21. doi: 10.1177/0885412211411092
Dorelan, P., Albert, L. H., Doreian, P., Louis, H., and Albert (1989). Partitioning political actor networks: some quantitative tools for analyzing qualitative networks. J. Quant. Anthropol. 1, 279–291. Available online at: https://www.ifip.com/Partitioning_Political_Actor.html (accessed June 4, 2019).
Eawag (2019). Diagnostic Report of Sanitation in Four Indian Cities - CWIS Study. Dubendorf: Eawag. Available online at: www.sandec.ch/CWIS
Edwards, G. (2010). “Mixed-method approaches to social network analysis,” in ESRC National Centre for Research Methods Review Paper (Manchester), 30.
Fischer, M. (2015). Collaboration patterns, external shocks and uncertainty: swiss nuclear energy politics before and after Fukushima. Energy Policy 86, 520–528. doi: 10.1016/j.enpol.2015.08.007
Fischer, M., Nguyen, M., and Strande, L. (2019). Context matters: horizontal and hierarchical network governance structures in the Vietnamese sanitation sector. Ecol. Soc. 24, 228–241. doi: 10.5751/ES-11036-240317
Fischer, M., and Sciarini, P. (2015). Unpacking reputational power: intended and unintended determinants of the assessment of actors' power. Soc. Networks 42, 60–71. doi: 10.1016/j.socnet.2015.02.008
Fischer, M., and Sciarini, P. (2016). Drivers of collaboration in political decision making: a cross-sector perspective. J. Polit. 78, 63–74. doi: 10.1086/683061
Freeman, L. C. (1979). Centrality in social networks conceptual clarification. Soc. Networks 1, 215–239. doi: 10.1016/0378-8733(78)90021-7
Freeman, L. C. (2004). A Study in the Sociology of Formal Organization (Vancouver, BC: Empirical Press).
Gerber, E. R., Henry, A. D., and Lubell, M. (2013). Political homophily and collaboration in regional planning networks. Am. J. Pol. Sci. 57, 598–610. doi: 10.1111/ajps.12011
Gorris, P., Glaser, M., Idrus, R., and Yusuf, A. (2019). The role of social structure for governing natural resources in decentralized political systems: insights from governing a fishery in Indonesia. Public Adm. 97, 654–670. doi: 10.1111/padm.12586
Hauck, J., Schmidt, J., and Werner, A. (2016). Using social network analysis to identify key stakeholders in agricultural biodiversity governance and related land-use decisions at regional and local level. Ecol. Soc. 21:49. doi: 10.5751/ES-08596-210249
Hermans, L. M. (2005). Actor Analysis for Water Resources Management: Putting the Promise into Practice. Available online at: https://repository.tudelft.nl/islandora/object/uuid%3Ae5980ebc-4fbe-4db7-8f91-d7e1134a8726 (accessed June 6, 2019).
Iacobucci, D. (1996). Networks in Marketing. Thousand Oaks, CA: Sage Publications. Available online at: https://books.google.ch/books?hl=de&lr=&id=SBA5DQAAQBAJ&oi=fnd&pg=PP1&dq=business+marketing+social+network+analysis&ots=-BFJuqKhY8&sig=utQIhqVJxMUVuMoQ0hiUo3sXC0c#v=onepage&q=businessmarketingsocialnetworkanalysis&f=false (accessed July 11, 2019).
Ingold, K. (2011). Network structures within policy processes coalitions, power, and brokerage in swiss climate policy. Policy Stud. J. 39, 435–459. doi: 10.1111/j.1541-0072.2011.00416.x
Ingold, K. (2014). How involved are they really? A comparative network analysis of the institutional drivers of local actor inclusion. Land Use Policy 39, 376–387. doi: 10.1016/j.landusepol.2014.01.013
Ingold, K., and Fischer, M. (2014). Drivers of collaboration to mitigate climate change: an illustration of swiss climate policy over 15 years. Glob. Environ. Chang. 24, 88–98. doi: 10.1016/j.gloenvcha.2013.11.021
Ingold, K., and Varone, F. (2012). Treating policy brokers seriously: evidence from the climate policy. J. Public Adm. Res. Theory 22, 319–346. doi: 10.1093/jopart/mur035
Jami, A. A. N., and Walsh, P. R. (2014). The role of public participation in identifying stakeholder synergies in wind power project development: the case study of Ontario, Canada. Renew. Energy 68, 194–202. doi: 10.1016/j.renene.2014.02.004
Lienert, J., Schnetzer, F., and Ingold, K. (2013). Stakeholder analysis combined with social network analysis provides fine-grained insights into water infrastructure planning processes. J. Environ. Manage. 125, 134–148. doi: 10.1016/j.jenvman.2013.03.052
Lubell, M. (2013). Governing institutional complexity: the ecology of games framework. Policy Stud. J. 41, 537–559. doi: 10.1111/psj.12028
Lubell, M., Jasny, L., and Hastings, A. (2017). Network governance for invasive species management. Conserv. Lett. 10, 699–707. doi: 10.1111/conl.12311
Lüthi, C., and Narayan, A. S. (2018). “Citywide inclusive sanitation: achieving the urban water SDGs,” in Perspectives Integrated Policy Briefs: Urban Waters-How Does Water Impact and is Impacted by Cities and Human Settlements?, Vol. 1, eds L. Camarena, H. Machado-Filho, L. Casagrande, R. Byrd, A. Tsakanika, S. Wotton (Rio de Janeiro: World Centre for Sustainable Development), 11–13. Available online at: https://riopluscentre.org/publications/urban-waters
Lüthi, C., Panesar, A., Schütze, T., Norström, A., Mcconville, J., Parkinson, J., et al. (2011). Sustainable Sanitation in Cities - A Framework for Action. Rijswijk: Papiroz Publishing House.
McDuie-Ra, D. (2012). Northeast Migrants in Delhi: Race, Refuge and Retail. Amsterdam: Amsterdam University Press.
McNicholl, D., McRobie, A., and Cruickshank, H. (2017). Characteristics of stakeholder networks supporting local government performance improvements in rural water supply: cases from Ghana, Malawi, and Bolivia. Water Altern. 10, 541–561. Available online at: http://www.water-alternatives.org/index.php/alldoc/articles/vol10/v10issue2/369-a10-2-19/file (accessed July 20, 2019).
Mitchell, C., and Ross, K. (2016). Governance of Local Scale Sanitation: How to Design Governance for Lasting Service? Guidance Material: Introduction. Available online at: https://opus.lib.uts.edu.au/bitstream/10453/78645/1/ISF-UTS_2016_Local-scaleSanitationIndonesia_Guidance-Material-Intro.pdf (accessed July 20, 2019).
MoHUA (2019). Swachh Survekshan - National Cleanliness Report. New Delhi. Available online at: https://swachhsurvekshan2019.org/
Montangero, A., and Belevi, H. (2007). Assessing nutrient flows in septic tanks by eliciting expert judgement: a promising method in the context of developing countries. Water Res. 41, 1052–1064. doi: 10.1016/j.watres.2006.10.036
Myers, J. (2016). Urban community-led total sanitation: a potential way forward for co-producing sanitation services. Waterlines 35, 388–396. doi: 10.3362/1756-3488.2016.028
Nandi, S., and Gamkhar, S. (2013). Urban challenges in India: a review of recent policy measures. Habitat Int. 39, 55–61. doi: 10.1016/j.habitatint.2012.10.001
Narayan, A. S., and Luthi, C. (2019). Citywide inclusive sanitation - old wine in new bottle? Sandec News, 21–22. Available online at: www.sandec.ch.
Neely, K. (2013). “Understanding WASH through complex adaptive systems theory,” in Delivering water, sanitation and hygiene services in an uncertain environment: Proceedings of the 36th WEDC International Conference, ed R. J. Shaw (Nakuru), 1–5.
O'Reilly, K., and Louiss, E. (2014). The toilet tripod: understanding successful sanitation in rural India. Heal. Place 29, 43–51. doi: 10.1016/j.healthplace.2014.05.007
Orenstein, A., and Phillips, W. (1978). Understanding Social Research : an Introduction. Boston: Boston Allyn and Bacon. Available online at: https://trove.nla.gov.au/work/11416809?q&sort=holdings+desc&_=1559653594983&versionId=170147236 (accessed June 4, 2019).
Ostrom, E. (2009). A general framework for analyzing sustainability of social-ecological systems. Science 325, 419–422. doi: 10.1126/science.1172133
Paletto, A., Hamunen, K., and De Meo, I. (2015). Social network analysis to support stakeholder analysis in participatory forest planning. Soc. Nat. Resour. 28, 1108–1125. doi: 10.1080/08941920.2015.1014592
Patton, M. (1990). Qualitative evaluation and research methods. Qual. Eval. Res. Methods 169–186. Available online at: https://legacy.oise.utoronto.ca/research/field-centres/ross/ctl1014/Patton1990.pdf (accessed July 20, 2019).
Pearson, M., and Michell, L. (2000). Smoke rings: social network analysis of friendship groups, smoking and drug-taking. Drugs Educ. Prev. Policy 7, 21–36. doi: 10.1080/713660095
Prell, C., Hubacek, K., and Reed, M. (2009). Stakeholder analysis and social network analysis in natural resource management. Handb. Appl. Syst. Sci. 1920, 367–383. doi: 10.1080/08941920802199202
Reed, M. S., Graves, A., Dandy, N., Posthumus, H., Hubacek, K., Morris, J., et al. (2009). Who's in and why? A typology of stakeholder analysis methods for natural resource management. J. Environ. Manage. 90, 1933–1949. doi: 10.1016/j.jenvman.2009.01.001
Reymond, P. (2014). “Stakeholder analysis,” in Faecal Sludge Management. Systems Approach for Implementation and Operation, eds L. Strande, M. Ronteltap, and D. Brdjanovic (London: IWA Publishing), 319–329.
Roberts, B. H. (2014). Managing Systems of Secondary Cities: Policy Responses in International Development. Brussels: Cities Alliance.
Rosenqvist, T. (2018). Experiencing Everyday Sanitation Governance : A Critical Inquiry into the Governance of Community-Managed Sanitation Services in Indonesia and Whether it Could be Otherwise. Sydney, NSW: University of Technology.
Ross, K., Abeysuriya, K., Mikhailovich, N., and Mitchell, C. (2014). Governance for Decentralised Sanitation : Global Practice Scan. Available online at: http://communitysanitationgovernance.info/wp-content/uploads/2016/06/20140125-ADRAS-GDS-Global-Practice-Scan-a.pdf (accessed July 20, 2019).
Scholten, P., Collett, E., and Petrovic, M. (2017). Mainstreaming migrant integration? A critical analysis of a new trend in integration governance. Int. Rev. Adm. Sci. 83, 283–302. doi: 10.1177/0020852315612902
Schröter, B., Hauck, J., Hackenberg, I., and Matzdorf, B. (2018). Bringing transparency into the process: social network analysis as a tool to support the participatory design and implementation process of payments for ecosystem services. Ecosyst. Serv. 34, 206–217. doi: 10.1016/j.ecoser.2018.03.007
Scott, J. (2017). Social network analysis. 4th ed. London, UK: Sage. Available online at: https://uk.sagepub.com/en-gb/eur/social-network-analysis/book249668 (accessed June 6, 2019).
Singh, N. K., Kazmi, A. A., and Starkl, M. (2015). A review on full-scale decentralized wastewater treatment systems: techno-economical approach. Water Sci. Technol. 71, 468–478. doi: 10.2166/wst.2014.413
Stein, C., Ernstson, H., and Barron, J. (2011). A social network approach to analyzing water governance: the case of the Mkindo catchment, Tanzania. Phys. Chem. Earth 36, 1085–1092. doi: 10.1016/j.pce.2011.07.083
Strande, L., Ronteltap, M., and Brdjanovic, D. eds. (2014). Faecal Sludge Management - Systems Approach for Implementation and Operation. The Hague: IWA.
Sundaravadivel, M., and Vigneswaran, S. (2001). Wastewater collection and treatment technologies for semi-urban areas of India: a case study. Water Sci. Technol. 43, 329–336. doi: 10.2166/wst.2001.0699
Taylor, S., Bogdan, R., and DeVault, M. (2015). Introduction to Qualitative Research Methods: A Guidebook and Resource. 4th ed. Hoboken, NJ: John Wiley & Sons. Available online at: https://books.google.ch/books?hl=en&lr=&id=pONoCgAAQBAJ&oi=fnd&pg=PR11&ots=Qhyefx5y4R&sig=j9ngog_GnzKRiwjWVn3b5KpgCGE (accessed June 26, 2019).
Ulrich, L., Luthi, C., Reymond, P., Chandragiri, R., and Philip, L. (2019). Small Scale Sanitation Systems in India: Final Report of 4S Project. Zurich: Eawag. Available online at: www.sandec.ch/4S
Valente, T. W., Coronges, K. A., Stevens, G. D., and Cousineau, M. R. (2008). Collaboration and competition in a children's health initiative coalition: a network analysis. Eval. Program Plann. 31, 392–402. doi: 10.1016/j.evalprogplan.2008.06.002
Valente, T. W., Palinkas, L. A., Czaja, S., Chu, K., and Brown, C. H. (2015). Social network analysis for program implementation. PLoS ONE 10:e0131712. doi: 10.1371/journal.pone.0131712
Victor, J. N., Montgomery, A. H., and Lubell, M. eds. (2016). The Oxford Handbook of Political Networks. New York, NY: Oxford University Press.
Wasserman, S., and Faust, K. (1994). Social Network Analysis : Methods and Applications. Cambridge: Cambridge University Press. doi: 10.1017/CBO9780511815478
Wessendorf, S. (2017). Migrant belonging, social location and the neighbourhood: recent migrants in East. Urban Stud. 56, 131–146 doi: 10.1177/0042098017730300
Keywords: social network analysis, validation methodology, decentralized wastewater treatment, mega and secondary cities, citywide inclusive sanitation
Citation: Narayan AS, Fischer M and Lüthi C (2020) Social Network Analysis for Water, Sanitation, and Hygiene (WASH): Application in Governance of Decentralized Wastewater Treatment in India Using a Novel Validation Methodology. Front. Environ. Sci. 7:198. doi: 10.3389/fenvs.2019.00198
Received: 24 July 2019; Accepted: 06 December 2019;
Published: 14 January 2020.
Edited by:
Alberto Tiraferri, Politecnico di Torino, ItalyReviewed by:
Tanja Rosenqvist, RMIT University, AustraliaCopyright © 2020 Narayan, Fischer and Lüthi. This is an open-access article distributed under the terms of the Creative Commons Attribution License (CC BY). The use, distribution or reproduction in other forums is permitted, provided the original author(s) and the copyright owner(s) are credited and that the original publication in this journal is cited, in accordance with accepted academic practice. No use, distribution or reproduction is permitted which does not comply with these terms.
*Correspondence: Abishek Sankara Narayan, YWJpc2hlay5uYXJheWFuQGVhd2FnLmNo
Disclaimer: All claims expressed in this article are solely those of the authors and do not necessarily represent those of their affiliated organizations, or those of the publisher, the editors and the reviewers. Any product that may be evaluated in this article or claim that may be made by its manufacturer is not guaranteed or endorsed by the publisher.
Research integrity at Frontiers
Learn more about the work of our research integrity team to safeguard the quality of each article we publish.