 Gretchen J. McCarthy
 Nicholas E. Ray
 Robinson W. Fulweiler
- 1Department of Earth and Environment, Boston University, Boston, MA, United States
- 2Department of Biology, Boston University, Boston, MA, United States
Non-native species introductions are associated with a range of ecosystem changes such as habitat destruction, competition with native species, and biodiversity losses. Less well known is the role non-native species play in altering biogeochemical processes, such as the emission of greenhouse gases (GHGs). In this study we used laboratory incubations to compare seasonal (spring, summer, fall) emissions of the GHGs nitrous oxide (N2O), methane (CH4), and carbon dioxide (CO2) from native (Crassostrea virginica) and non-native (Ostrea edulis) oysters collected from a northern temperate estuary (Duxbury Bay, Massachusetts, USA). We observed strong seasonal signals in GHG fluxes, where C. virginica was the higher GHG emitter, and produced on average twice as much N2O (0.39 nmol g−1 dry tissue weight hr−1) and 20 times as much CH4 (1.31 nmol g DTW−1 hr−1) compared to O. edulis (0.16 nmol N2O g DTW−1 hr−1 and 0.07 nmol CH4 g DTW−1 hr−1). C. virginica also had significantly (p < 0.001) higher summer maximum production rates of CO2 compared to O. edulis (53.4 μmol g DTW−1 hr−1 and 45.4 μmol g DTW−1 hr−1, respectively). Despite these differences, chlorophyll-a consumption rates between the species were similar (p = 0.95). These results suggest that the non-native O. edulis is a lower GHG emitter than the native C. virginica and highlight that, at least in terms of GHG emissions, this non-native species introduction may not be detrimental to the environment.
Introduction
The introduction of non-native species to both terrestrial and aquatic ecosystems is a growing global concern (Vitousek et al., 1996; Castro-Díez et al., 2019; Seebens et al., 2019). In some cases, these non-native species have led to dramatic declines in biodiversity (Molnar et al., 2008) and displacement of native species (Byers, 2000; Rossong et al., 2006). In other cases, they appear to have little to no impact (e.g., Grosholz, 2005). The effect of non-native species on marine ecosystems is not well constrained. A recent meta-analysis examined the impact of 76 exotic marine species (just 6% of the listed exotics) on marine communities and found that these species caused a small, but significant decrease in ecological variables such as primary producers and multi-trophic assemblages (Anton et al., 2019). Of note, they reported that mollusks were one of just four taxonomic groups related to declines in the ecological function of many native marine taxa (Anton et al., 2019). This finding agrees with a variety of studies on the ecological impacts of exotic bivalves (Sousa et al., 2009; Helmer et al., 2019). One of the best-known examples is the introduction of the Pacific oyster, Magallana gigas (formerly Crassostrea gigas) to Europe. M. gigas has reportedly changed sediment properties (Green et al., 2012), shifted macrozoobenthic communities (Kochmann et al., 2008), and altered food web structure (Souchu et al., 2001). Alternatively, other studies have reported minimal ecosystem impacts following the introduction of M. gigas (Krassoi et al., 2008; Wilkie et al., 2012; Zwerschke et al., 2016).
In North America, the European Flat Oyster (Ostrea edulis) was intentionally introduced to the state of Maine (United States, US) with aims to establish an oyster fishery in the 1950s (Laing et al., 2006). Today, O. edulis has expanded its range south, and is now established from Maine to Rhode Island (FAO, 2009). The impact of this non-native species on ecosystem function is largely unknown. In this study, we compared emissions of nitrous oxide (N2O) and methane (CH4) from O. edulis and C. virginica, as previous research has shown that bivalves can be sources of these two powerful greenhouse gases (GHG) which have global warming potentials 298 and 25 times more than carbon dioxide (CO2), respectively (Myhre et al., 2013).
Microbial processes occurring on (e.g., shell epibiota), or within (e.g., mantle cavity, digestive system) oysters can produce or consume N2O. For example, both nitrification (which can produce N2O) and denitrification (which can produce or consume N2O) occur on C. virginica shells, although shell denitrification rates are higher from living oysters (Caffrey et al., 2016). Arfken et al. (2017) used a metabolic approach to demonstrate that the relative abundance of denitrifying bacteria was higher in C. virginica whole oysters and shells compared to nearby sediments, and concluded that oysters appear to be denitrifying “hot spots.” Denitrification has also been confirmed in the epibiota of the Sydney Rock Oyster (Saccostrea glomerata; Erler et al., 2017). Most recently, significant N2O emissions have been observed from the C. virginica digestive system (Ray et al., 2019a). Additionally, experimental incubations of living C. virginica individuals showed oysters switched from being a N2O sink to a N2O source when incubation water was enriched with dissolved inorganic nitrogen (DIN; Gárate et al., 2019). Together, these studies demonstrate that oysters support dynamic microbial ecosystems capable of altering N2O fluxes in coastal ecosystems.
Compared to N2O, we know much less about CH4 cycling in oysters. Previous research shows that bivalve gut cavities can house archaeal methanogenic symbionts and methanotrophs can live in the mantle cavities of bivalves (Childress et al., 1986; Bonaglia et al., 2017). Thus, it seems reasonable to propose that oysters too may host CH4 producing and consuming organisms. However, a recent study reported only very low CH4 emissions from C. virginica (0.00038 ± 0.00046 μmol CH4 gDW−1 hr−1), rates not statistically different from zero (Ray et al., 2019b). Thus, CH4 emissions from oysters are largely unknown, but potentially small.
Within this context, we quantified the net fluxes of N2O and CH4, as well as chlorophyll-a by C. virginica and O. edulis over an annual temperature cycle. We also measured dissolved oxygen uptake and used it to estimate CO2 release for each species using a respiratory quotient from the literature (Galtsoff et al., 1964). Our primary goals were to quantify GHG emissions from a native (C. virginica) and non-native (O. edulis) oyster species, to examine how these GHG fluxes varied with environmental parameters (e.g., temperature, salinity) and oyster characteristics (i.e., dry tissue and shell weight), and to add to the growing literature on the potential role non-native species play in altering biogeochemical cycling. We hypothesized that each species would release N2O, but little to no CH4, and that GHG fluxes would increase with temperature.
Methods
Site Description
We collected oysters and site water from Duxbury Bay (Massachusetts, USA) on six occasions between September 2017 and August 2018 (Figure S1). Duxbury Bay is a shallow system with an average water depth of 3 m at high tide, and several exposed mudflats at low tide (Feinman et al., 2018). The system exchanges 70% of its water volume with the Atlantic Ocean twice daily (Lawson, 2011).
Sample Collection
During each sampling event, we measured water column dissolved oxygen (DO) concentration, pH, salinity, and temperature using a Hach HQ40d, equipped with LDO101, PHC301, and CDC401 probes (Table S1). We measured water column chlorophyll-a concentrations in duplicate with a 60 mL polypropylene syringe and glass fiber filters (Whatman GF/F, 0.70 μm pore size). Chlorophyll-a filters were stored at −80°C until analysis.
Upon collection, oysters were immediately placed in a cooler filled with site water. We also collected unfiltered site water in carboys. Both were transported back to the laboratory, and kept in a dark environmental chamber set to in situ field temperature. Once in the environmental chamber, air-stones were placed in the oyster filled cooler and the carboys and were gently bubbled overnight (>12 h) to keep the overlaying water oxygenated.
Oyster GHG Incubation
C. virginica and O. edulis individuals were randomly assigned to an incubation chamber filled with site water using a random number generator (Randomness and Integrity Services Ltd.). Each treatment (i.e., native: C. virginica and non-native: O. edulis) had three clear polyvinyl chloride (PVC) chambers (2.106 L) per incubation. In cool months (September 2017, March 2018, April 2018, June 2018), we placed four oysters in each chamber. In warmer months (July 2018, August 2018) we placed three oysters in each chamber to ensure DO would not drop too rapidly during the incubation due to elevated oyster respiration. We changed the number of oysters used in summer incubations to reduce the risk of hypoxic conditions in the chambers during warm temperatures and higher rates of respiration. For each incubation, we also incubated triplicate chambers containing site water alone (i.e., water column control chambers) to account for any fluxes occurring in the water column.
Before sealing the chambers with gas tight lids, we collected samples for the initial chlorophyll-a concentrations in each chamber using the methods described above for chlorophyll-a collection in the field. We repeated this sampling at the end of the incubation. We then sealed each chamber without any air headspace using gas-tight acrylic lids equipped with inflow and outflow ports (Ray et al., 2019a). Magnetic stir bars fixed to the core tops provided gentle mixing of the overlying water (~40 revolutions min−1). Incubation time was determined by balancing the following criteria: achieving at least a 62.5 μM (2 mg O2 L−1) drop in DO (Foster and Fulweiler, 2016) over the course of five sampling time points at intervals of ~20–60 min, and maintaining DO concentrations above the hypoxic threshold (>62.5; Heiss et al., 2012). DO concentrations were measured at three time points (initial, middle, and final) using an optical dissolved oxygen sensor (Hach LDO101). Gas samples for N2O and CH4 were collected in duplicate water samples at five time points allowing for overflow for each sample vials into 12 mL Labco Limited Exetainer® with gastight septa. Sample vials were filled from the bottom with ~3 times the overflow volume and preserved with 25 μL of saturated zinc chloride solution (Ray et al., 2019b). These samples were immediately transferred to a refrigerator (4–6 °C) until further analysis.
During our six incubations, some chambers did drop below the hypoxic threshold. In the July incubation, all three of the O. edulis chambers went hypoxic, and in the August incubation, two O. edulis chambers went hypoxic. Regardless, our flux data remained linear, so we included these chambers in our analysis. Lights in the environmental chamber were left on during the gas incubations due to short sampling windows. At the start and end of incubations, we visually checked that oysters were open and actively filtering water.
Within 24 h of the incubation, we measured the shell length, width, and depth (cm) of each oyster. We then shucked the oysters, weighed their shell and tissue wet mass (g), and placed them in a drying oven set to 60°C until a constant weight was reached.
Calculating Shell Surface Area
In order to estimate shell surface area, we used photogrammetric processing software (Agisoft Metashape Professional 1.5.2) to create three-dimensional mesh renderings of a subset of specimens (n = 36 for C. virginica and n = 32 for O. edulis). Each mesh was crafted from a series of ~50 images of each specimen top, curved shell only, taken with a digital camera.
Sample Analysis and Flux Calculations
Chlorophyll-a analysis was conducted by extracting the sample filter in 10 mL of 90% acetone, followed by fluorometric analysis using a Turner Model AU-10 Digital Fluorometer with Optical Kit P/N 10-040R (Arar and Collins, 1997; Carey and Fulweiler, 2013).
We measured concentrations of dissolved N2O and CH4 gas directly using a headspace equilibration technique followed by analysis of the sample headspace using gas chromatography (GC) following published methods (Kling et al., 1991; Foster and Fulweiler, 2016). All standard curves had R2 ≥ 0.995 for six data points used. The detection limits during sample analysis were 0.383 μM for N2O and 5.188 μM for CH4.
Flux rates of each GHG were determined by calculating the slope of the linear regression of analyte concentration over the incubation time (Giblin et al., 1997; Hopkinson et al., 1999; Heiss et al., 2012) A flux was only considered significant when R2 ≥ 0.65 and p < 0.10 (Prairie, 1996; Foster and Fulweiler, 2016). If these criteria were not met, the flux was determined to equal zero, and indicated that either no flux occurred, there was a balance between production and consumption processes in the chamber, or fluxes occurred at rates below the detection limit (Foster and Fulweiler, 2016). The resulting fluxes were scaled by total dry tissue mass and all GHG fluxes are reported as nmol hr−1 g DTW−1. Chlorophyll-a and DO flux rates were calculated as the difference in final and initial concentrations over the incubation time, scaled by total dry tissue mass, and are reported as μmol hr−1 g DTW−1. We calculated oyster CO2 production using a respiratory quotient (RQ) of 0.83 for C. virginica (Galtsoff et al., 1964) and O. edulis because we were unable to find an RQ value for O. edulis in the literature (Table S3). In all cases, a positive flux indicates production of an analyte by the oyster while a negative flux indicates the consumption of analyte from the water column by the oysters (Fulweiler et al., 2008; Heiss et al., 2012).
Statistical Analysis
All statistical analyses were conducted using R studio (version 3.4.4) and were considered statistically significant when p ≤ 0.05. We compared shell area per g DTW, shell dimensions, and tissue and shell mass between species using Wilcoxon rank-sum tests. We compared whether fluxes were significantly differently from zero using one-sample Wilcoxon signed rank tests. Before comparing fluxes between species, we identified the distributions that best described each flux using the fitdistrplus package (Marie et al., 2015). N2O fluxes best fit a lognormal distribution, CH4 and chlorophyll-a fluxes were normally distributed, and CO2 fluxes best fit a gamma distribution.
To compare net fluxes between species we used a mixed model approach. In order to best meet model assumptions, we first shifted all of the N2O and O2 data so that all values were positive, and then applied a log transformation to the N2O data. CH4, CO2, and chlorophyll-a fluxes were not transformed. Next, we constructed a Generalized Linear Model (GLM) for each flux, using the lme4 package (Bates et al., 2015) with oyster species and temperature as fixed effects. For the CO2 data, we used a gamma family in the model. We then compared whether the two species differed using a pairwise least-square mean test of the GLM with the emmeans package (Lenth, 2018). Additionally, we tested whether fluxes differed between seasons by constructing models that included oyster species and season as fixed effects, and then compared seasons using pairwise least-square mean tests. We also compared fluxes between species using this model (Table S6).
Correlations between GHG fluxes and salinity, respiration, feeding rates, and shell characteristics for each species were calculated using Pearson correlation tests. We did not run correlations for shell surface area and GHG flux because we did not have area measurements for all of our specimens. We used Pearson correlation tests to quantify if any biotic (e.g., feeding rates, shell characteristics) or abiotic factors (e.g., salinity) we measured were related to GHG emissions from each species. Additionally, we tested for correlations between fluxes of the three GHGs to see if there were any common flux patterns. Finally, we used linear regressions to test if temperature could be used to predict the magnitude of GHG flux for each species.
Results
Physical Characteristics of Oyster Species
C. virginica and O. edulis shells had statistically different shell widths (p < 0.001) and depths (p < 0.001) but not shell lengths (p = 0.08). On average, O. edulis used in the experiment were longer (mean length of 8.93 ± 0.25 cm) than C. virginica (mean length 8.22 ± 0.13). O. edulis was also wider (mean width 8.25 ± 0.15 cm) than C. virginica with mean widths (mean width 5.78 ± 0.13 cm). However, C. virginica had a deeper cup (2.19 ± 0.07 cm) than O. edulis (1.91 ± 0.06 cm) (Tables S2, S4). The average dry tissue mass per gram dry shell mass (DTW per g DSW) was significantly different between treatments (p < 0.01) where O. edulis had more tissue per gram of shell than C. virginica (mean 0.11 ± 0.02 DTW g DSW−1 and 0.08 ± 0.01 DTW g DSW−1, respectively). For the subset of shells we measured, shell surface area was not significantly different between species (p = 0.33). However, C. virginica had significantly (p < 0.001) more shell area per tissue mass (110.34 ± 8.7 cm2 shell g DTW−1) than O. edulis (67.91 ± 4.02 cm2 shell g DTW−1).
GHG Fluxes and Correlation Analysis
Both oyster species emitted N2O at rates significantly different from zero (C. virginica p = 0.02 and O. edulis p = 0.02). On average, C. virginica emitted more than twice as much N2O than O. edulis (0.39 ± 0.16 nmols hr−1 g DTW −1 and 0.16 ± 0.06 nmols hr−1 g DTW−1, respectively), but these rates were not statistically different (p = 0.276). In general, net N2O production was observed during spring (March and April 2018) and fall (September 2017) while little N2O flux occurred during the summer (June, July and August 2018) (Figure 1A). N2O fluxes were statistically higher in spring compared to summer (p < 0.01) or fall (p = 0.05), and higher in the fall compared to summer (p < 0.01) (Table S5). There was no significant relationship between N2O fluxes and temperature for either species (Figures 2A,B). Additionally, N2O fluxes were only correlated to salinity for C. virginica (Table 1) and to g DTW for O. edulis (Table 2; Figure S2).
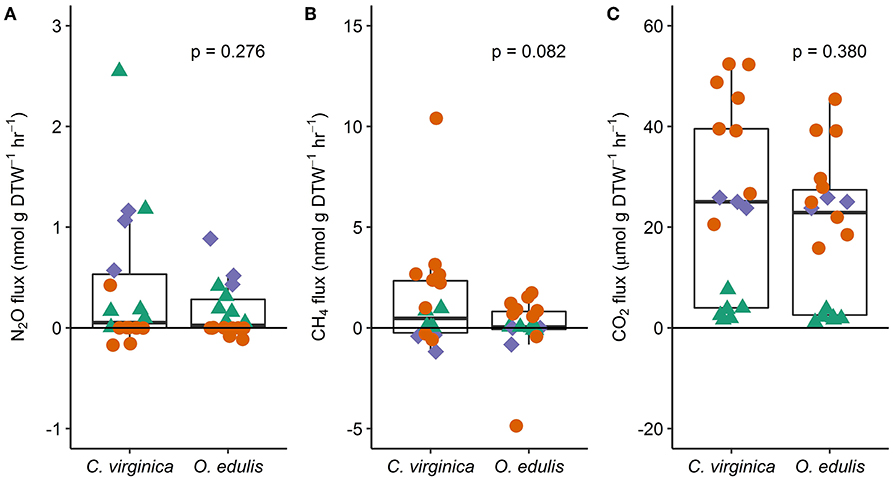
Figure 1. Fluxes of nitrous oxide (A), methane (B), and carbon dioxide (C) from native (C. virginica) and non-native oysters (O. edulis); n = 18 for each species and flux, except n = 17 for C. virginica CO2 fluxes. P-values show the result of least squares means tests comparing the mean flux between the native and non-native oysters. Each point represents an individual flux measurement (spring: green triangles, summer: orange circles, and fall: blue diamonds). Points below the zero-line show net consumption, and points above show net production.
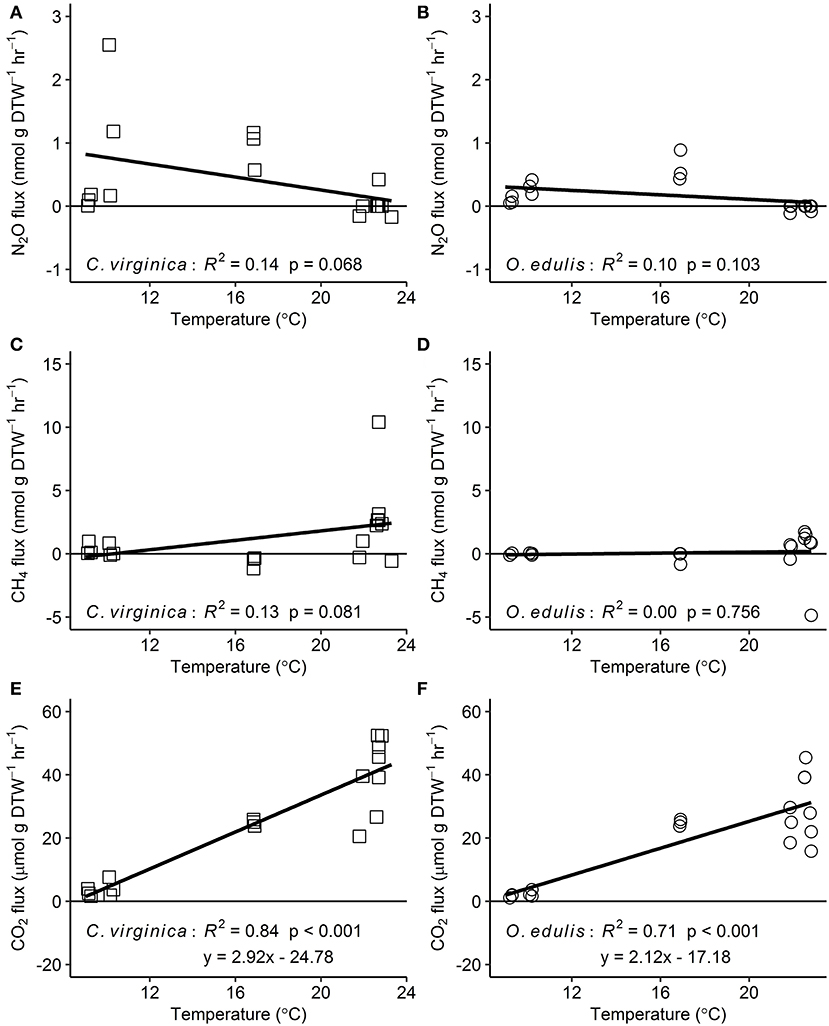
Figure 2. Relationships between temperature and nitrous oxide (A,B), methane (C,D), and carbon dioxide (E,F) fluxes for native (C. virginica: open squares) and non-native oysters (O. edulis: open circles); n = 18 for each species and flux, except n = 17 for C. virginica CO2 fluxes. R2 and p-values from linear regressions. Points below the zero-line show net consumption, and points above show net production.
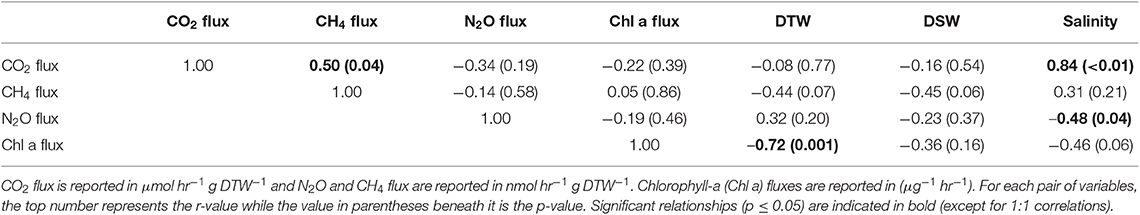
Table 1. Pearson correlations between greenhouse gas fluxes, g dry oyster tissue (DTW) and g dry oyster shell (DSW), and salinity for C. virginica.
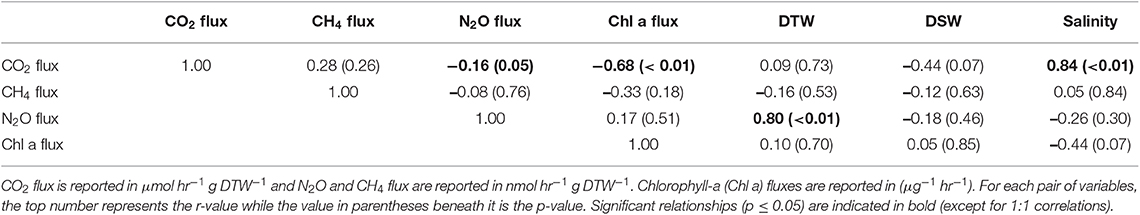
Table 2. Pearson correlations between greenhouse gas fluxes, g dry oyster tissue (DTW) and g dry oyster shell (DSW), and salinity for O. edulis.
Neither C. virginica (p = 0.06) nor O. edulis (p = 0.22) released CH4 at rates statistically different from zero when all incubations were pooled. CH4 fluxes also did not differ significantly between species (p = 0.08). Despite not being statistically significant, C. virginica produced, on average, more than twenty times as much CH4 as O. edulis (mean 1.31 ± 2.62 nmol hr−1 g DTW −1 and 0.07 ± 1.41 nmol hr−1 g DTW −1, respectively). Generally, CH4 release occurred during the summer (June, July and August 2018), while small rates of CH4 production, or oxidation, were observed during the spring (March and April 2018) and fall (September 2017) (Figure 1B), though these seasonal changes were not statistically different (Table S5). Similarly, temperature was not a significant predictor of CH4 flux (Figures 2C,D). C. virginica CH4 fluxes were positively correlated with CO2 fluxes (Table 1) while CH4 fluxes from O. edulis were not correlated any of the parameters we measured (Table 2; Figure S2).
CO2 production rates were not significantly different between C. virginica and O. edulis (p = 0.38) and mean rates of production were 24.77 ± 18.88 μmols hr−1 g DTW −1 and 19.44 ± 14.52 μmols hr−1 g DTW −1, respectively. However, C. virginica had a higher maximum production rate of CO2 than O. edulis during the summer (53.4 μmols hr−1 g DTW−1 and 45.4 μmols hr−1 g DTW −1, respectively; Figure 1C). CO2 release was lower in the spring compared to summer (p < 0.01) or fall (p < 0.01), and there was no difference in CO2 release between summer and fall (p = 0.31) (Table S5). Temperature was a significant predictor of CO2 release from both species (Figures 2E,F). C. virginica CO2 production was positively correlated with CH4 flux and salinity (Table 1), while O. edulis CO2 production was positively correlated with salinity and negatively correlated with chlorophyll-a consumption (Table 2; Figure S2).
Chlorophyll-a consumption rates for C. virginica and O. edulis were both significantly different from zero (p < 0.01 for each species), but were not significantly different between species (p = 0.95). Chlorophyll-a consumption was lower in the spring compared to summer (p = 0.03) or fall (p = 0.02), but consumption was not different between summer and fall (p = 0.64) (Table S5). C. virginica chlorophyll-a consumption rates were negatively correlated with DTW (Table 2) and O. edulis chlorophyll-a consumption rates were negatively correlated to CO2 production and temperature (Table 2).
Pairwise comparisons between species using a model with season and species as fixed effects yielded the same results as the model with temperature and species as fixed effects (Table S6).
Discussion
Here we demonstrate that both the native C. virginica and the non-native O. edulis produce significant amounts of N2O and CO2, but not CH4. Mean annual CH4 fluxes were not statistically different between the two oysters however, they varied temporally with consumption in the fall and spring and notable pulses of production in the summer months (Figure 1B). Although not significantly different, C. virginica produced twice as much N2O and ~twenty times more CH4 than the non-native O. edulis. Further, we show that GHG fluxes and chlorophyll-a consumption rates were not driven by a common set of environmental parameters, nor did fluxes vary consistently with oyster characteristics. These chlorophyll consumption rates may be an underestimate as the chamber was closed and thus we did not introduce new food overtime.
Because metabolic processes scale with temperature, we anticipated GHG fluxes to be highest during warm summer months, but this pattern only held for CO2. Perhaps this is not surprising, as we measured net fluxes and thus N2O and CH4 production and consumption processes could both be stimulated by warmer temperatures. Regardless, the overall net effect of temperature on N2O and CH4 fluxes appears to be zero, an effect previously observed for sediment N2O fluxes (Foster and Fulweiler, 2016). Instead, we observed highest N2O fluxes at the intermediate temperatures during March and September, suggesting that during these time periods other factors may be more important in regulating oyster N2O flux. For example, Gárate et al. (2019) found that the addition of DIN to incubations of C. virginica more than tripled rates of N2O release. Previous research has proposed that N2O is released from bivalves due to inefficient nitrification in the shell biofilm (Rossong et al., 2006; Svenningsen et al., 2012; Heisterkamp et al., 2013; Ray et al., 2019a), or as a byproduct of denitrification in the gut (Stief et al., 2009; Heisterkamp et al., 2010; Svenningsen et al., 2012; Ray et al., 2019a). Sediment N2O fluxes also increase with higher concentrations of DIN in the water column as nitrification and denitrification become less efficient (Seitzinger and Nixon, 1985; Beaulieu et al., 2011). In this study, we did not measure DIN concentrations in the site water. However, we can estimate periods of high DIN at our sampling sites using daily discharge data from the closest United States Geological Survey gage (USGS 01105870) located on the Jones River, which empties into Duxbury Bay. River discharge is typically positively correlated with DIN loading to estuaries (e.g., Fulweiler and Nixon, 2005). The period of highest river discharge—and therefore likely highest DIN loading—during the course of our study was in March 2018. This was followed by a decrease in discharge through the summer months, and another peak in discharge in September 2018. These times also correspond with the highest oyster N2O emissions we measured. Further, we recorded a significant negative correlation between N2O flux and salinity for C. virginica. Thus, we hypothesize that during periods of relatively low salinity, riverine water that is higher in DIN drives the emission of N2O from both the native and non-native oyster, and suggest that in estuarine systems, seasonal patterns of DIN loading from river discharge are more important in regulating oyster N2O release than temperature or oyster species.
Similar to N2O, CH4 fluxes were not predicted by temperature alone, though fluxes of the largest magnitude, regardless of release or uptake, occurred during the warmest incubations. We have a poor understanding of how bivalves regulate CH4 fluxes, and the conditions that promote or inhibit CH4 release. We know that the Baltic Clam (Limecola balthica), hosts archaeal methanogenic symbionts inside its gut cavities (Bonaglia et al., 2017), and deep-sea mussels (Bathymodiolus thermophilus) have methanotrophic symbionts in their mantle cavities (Childress et al., 1986), demonstrating that microbes responsible for regulating CH4 in marine environments do associate with bivalves. Our results show that there is both production and consumption of CH4 by oysters, yet the environmental drivers of these processes are unclear. It is likely that microbially-mediated methanogenesis and methanotrophy both proceed simultaneously in oysters, and occurrences of CH4 release or uptake are due to environmental conditions turning these pathways on or off. We recorded a significant positive correlation between CO2 and CH4 release in C. virginica, suggesting that when more CO2 is present (and less O2 is available) near the oyster, oxygen levels are low enough to slow methanotrophy and allow some CH4 to escape. Alternatively, with lower O2, methanogenesis may become more rapid, with no change in methanotrophy.
Ray et al. (2019b) measured GHG emissions from C. virginica and the sediments beneath them, and then compared the CO2-equivalent cost per g protein from oysters with terrestrial livestock. In their estimation, which only required N2O and CH4 emissions from the oyster as CO2 from respiration is not included in estimates of other animal GHG release, they assumed that N2O and CH4 release from oysters was highest in the summer, and used summer GHG release values across the whole life-cycle of the oyster as a conservative approach. They estimated an oyster GHG cost of 0.13 kg CO2-eq kg protein−1. While their approach was correct for assuming no difference in flux due to temperature, here we demonstrate that N2O and CH4 emissions do not necessarily proceed most rapidly during warm summer months. While the mean rate of N2O release in this study (0.39 nmol g DTW−1 hr−1) is relatively close to that reported by Ray et al. (2019a: 0.12 nmol g DTW−1 hr−1), it is slightly higher due to the spring and fall samples. Similarly, Ray et al. (2019b) reported a flux of 0 for CH4. Yet in this study we measured instances of release and consumption, and only reported a value of zero for C. virginica as the p-value comparing the CH4 flux against zero was equal to 0.06, instead of the ≤ 0.05 value we selected as “statistically significant” before beginning the experiment. If we use the slightly higher mean values reported in this study and the same methods as Ray et al. (2019b), who estimated a GHG cost of 0.13 kg CO2-eq kg protein−1, we estimate that C. virginica has a GHG cost of 1.3 kg CO2-eq kg protein−1 and O. edulis has a GHG cost of 0.52 kg CO2-eq kg protein−1. While higher than the previous estimate, these values are still much lower than the GHG cost of beef, which is 465.5 kg CO2-eq kg protein−1 (Opio et al., 2013; ARS, 2018; Ray et al., 2019b). It is likely that N2O releases by oysters is only a small portion of their nitrogen budget (Ray et al., 2019a). Additionally, the CH4 observed emissions were <0.01% of the average CO2 emissions and generally, oyster reefs are net carbon sinks (Dame et al., 1989).
This study adds to our overall understanding of the role oysters in general, and a native vs. non-native oyster species in particular, play in regulating GHG emissions from coastal ecosystems. It demonstrates that, at least in terms of GHG fluxes, the non-native oyster species appears to produce less GHGs compared to the native species. This study is just a first step in understanding how oysters alter estuarine GHG emissions. Future research could address how oyster mediated GHG fluxes vary with changes in oyster physiology and behavior, as well as with different ecosystem parameters (e.g., seasonal nutrient concentrations and phytoplankton assemblages). Overall, this study highlights that ecological impacts of non-native species introductions are complex and vary by the ecological parameter being studied.
Data Availability Statement
The datasets generated for this study are available on request to the corresponding author.
Author Contributions
RF provided the funding and facilities for this research. GM and NR completed the field, laboratory, and data analyses. All authors designed the research, contributed to writing and editing of this manuscript, and agree to be listed and accept responsibility for the manuscript.
Funding
This research was funded in part by a Rhode Island Sea Grant award to RF, as well as a Boston University Undergraduate Research Opportunities Program award to GM. NR was supported through a Dean's Fellowship and teaching fellowships through the Boston University Biology Department, a Boston University Marine Program Warren McLeod Research Fellowship, and a summer fellowship provided by The Frederick S. Pardee Center for the Study of the Longer-Range Future.
Conflict of Interest
The authors declare that the research was conducted in the absence of any commercial or financial relationships that could be construed as a potential conflict of interest.
Acknowledgments
We thank the New England Estuarine Research Society who provided a platform and helpful feedback for GM to present this research. We thank Alia Al-Haj for helping train GM on the GC and for other technical support. We also thank the Christian Horne Farm Crew and the Island Creek Shellfish Farm to access to their oyster aquaculture lease for sampling. We also thank the Vincent family for establishing the Lara Vincent Research Assistance Award, which was awarded to GJM and supported the publication of this manuscript.
Supplementary Material
The Supplementary Material for this article can be found online at: https://www.frontiersin.org/articles/10.3389/fenvs.2019.00194/full#supplementary-material
References
Anton, A., Geraldi, N. R., Lovelock, C. E., Apostolaki, E. T., Bennett, S., Cebrian, J., et al. (2019). Global ecological impacts of marine exotic species. Nat. Ecol. Evol. 3, 787–800. doi: 10.1038/s41559-019-0851-0
Arar, E. J., and Collins, G. B. (1997). Method 445.0: In Vitro Determination of Chlorophyll a and Pheophytin a in Marine and Freshwater Algae by Fluorescence. Washington, DC: United States Environmental Protection Agency, Office of Research and Development, National Exposure Research Laboratory.
Arfken, A., Song, B., Bowman, J. S., and Piehler, M. (2017). Denitrification potential of the eastern oyster microbiome using a 16S rRNA gene based metabolic inference approach. PLoS ONE 12:e0185071. doi: 10.1371/journal.pone.0185071
Bates, D., Maechler, M., Bolker, B., and Walker, S. (2015). Fitting linear mixed-effects models using lme4. J. Stat. Softw. 67, 1–48. doi: 10.18637/jss.v067.i01
Beaulieu, J. J., Tank, J. L., Hamilton, S. K., Wollheim, W. M., Hall, R. O., Mulholland, P. J., et al. (2011). Nitrous oxide emission from denitrification in stream and river networks. Proc. Natl. Acad. Sci. U.S.A. 108, 214–219. doi: 10.1073/pnas.1011464108
Bonaglia, S., Brüchert, V., Callac, N., Vicenzi, A., Chi Fru, E., and Nascimento, F. J. A. (2017). Methane fluxes from coastal sediments are enhanced by macrofauna. Sci. Rep. 7, 1–10. doi: 10.1038/s41598-017-13263-w
Byers, J. E. (2000). Competition between two estuarine snails: implications for invasions of exotic species. Ecology 81, 1225–1239. doi: 10.1890/0012-9658(2000)081[1225:CBTESI]2.0.CO;2
Caffrey, J. M., Hollibaugh, J. T., and Mortazavi, B. (2016). Living oysters and their shells as sites of nitrification and denitrification. Mar. Pollut. Bull. 112, 86–90. doi: 10.1016/j.marpolbul.2016.08.038
Carey, J. C., and Fulweiler, R. W. (2013). Watershed land use alters riverine silica cycling. Biogeochemistry 113, 525–544. doi: 10.1007/s10533-012-9784-2
Castro-Díez, P., Vaz, A. S., Silva, J. S., van Loo, M., Alonso, Á., Aponte, C., et al. (2019). Global effects of non-native tree species on multiple ecosystem services. Biol. Rev. 94, 1477–1501. doi: 10.1111/brv.12511
Childress, J. J., Fisher, C. R., Brooks, J. M., Kennicutt, M. C., Bidigare, R., and Anderson, A. E. (1986). A methanotrophic marine molluscan (bivalvia, mytilidae) symbiosis: mussels fueled by gas. Science 233, 1306–1308. doi: 10.1126/science.233.4770.1306
Dame, F. R., Spurrier, D. J., and Wolaver, G. T. (1989). Carbon, nitrogen and phosphorus processing by an oyster reef. Mar. Ecol. Prog. Ser. 54, 249–256.
Erler, D. V., Welsh, D. T., Bennet, W. W., Meziane, T., Hubas, C., Nizzoli, D., et al. (2017). The impact of suspended oyster farming on nitrogen cycling and nitrous oxide production in a sub-tropical Australian estuary. Estuar. Coast. Shelf Sci. 192, 117–127. doi: 10.1016/j.ecss.2017.05.007
FAO (2009). Ostrea Edulis. FAO, 1–13. Available online at: http://www.fao.org/fishery/culturedspecies/Ostrea_edulis/en
Feinman, S. G., Farah, Y. R., Bauer, J. M., and Bowen, J. L. (2018). The influence of oyster farming on sediment bacterial communities. Estuaries Coasts 41, 800–814. doi: 10.1007/s12237-017-0301-7
Foster, S. Q., and Fulweiler, R. W. (2016). Sediment nitrous oxide fluxes are dominated by uptake in a temperate estuary. Front. Mar. Sci. 3:40. doi: 10.3389/fmars.2016.00040
Fulweiler, R. W., and Nixon, S. W. (2005). Export of nitrogen, phosphorus, and suspended solids from a southern New England watershed to Little Narragansett Bay. Biogeochemistry 76, 567–593. doi: 10.1007/s10533-005-0444-7
Fulweiler, R. W., Nixon, S. W., Buckley, B. A., and Granger, S. L. (2008). Net sediment N2 fluxes in a coastal marine system-experimental manipulations and a conceptual model. Ecosystems 11, 1168–1180. doi: 10.1007/s10021-008-9187-3
Galtsoff, P., Hole, W., Costello, D. P., Edwards, R. L., Henley, C., Higgins, E., et al. (1964). The American Oyster, 1964. Fish. Bull. 64, 1–458.
Gárate, M., Moseman-Valtierra, S., and Moen, A. (2019). Potential nitrous oxide production by marine shellfish in response to warming and nutrient enrichment. Mar. Pollut. Bull. 146, 236–246. doi: 10.1016/j.marpolbul.2019.06.025
Giblin, A. E., Hopkinson, C. S., and Tucker, J. (1997). Benthic metabolism and nutrient cycling in Boston Harbor, Massachusetts. Estuaries 20, 346–364. doi: 10.2307/1352349
Green, D. S., Boots, B., and Crowe, T. P. (2012). Effects of non-indigenous oysters on microbial diversity and ecosystem functioning. PLoS ONE 7:e0048410. doi: 10.1371/journal.pone.0048410
Grosholz, E. D. (2005). Recent biological invasion may hasten invasional meltdown by accelerating historical introductions. Proc. Natl. Acad. Sci. U.S.A. 102, 1088–1091. doi: 10.1073/pnas.0308547102
Heiss, E. M., Fields, L., and Fulweiler, R. W. (2012). Directly measured net denitrification rates in offshore New England sediments. Cont. Shelf Res. 45, 78–86. doi: 10.1016/j.csr.2012.06.002
Heisterkamp, I. M., Schramm, A., De Beer, D., and Stief, P. (2010). Nitrous oxide production associated with coastal marine invertebrates. Mar. Ecol. Prog. Ser. 415, 1–9. doi: 10.3354/meps08727
Heisterkamp, I. M., Schramm, A., Larsen, L. H., Svenningsen, N. B., Lavik, G., de Beer, D., et al. (2013). Shell biofilm-associated nitrous oxide production in marine molluscs: processes, precursors and relative importance. Environ. Microbiol. 15, 1943–1955. doi: 10.1111/j.1462-2920.2012.02823.x
Helmer, L., Farrell, P., Hendy, I., Harding, S., Robertson, M., and Preston, J. (2019). Active management is required to turn the tide for depleted Ostrea edulis stocks from the effects of overfishing, disease and invasive species. PeerJ 7, 1–26. doi: 10.7717/peerj.6431
Hopkinson, C. S., Giblin, A. E., Tucker, J., and Garritt, R. H. (1999). Benthic metabolism and nutrient cycling along an estuarine salinity gradient. Estuaries 22, 863–881. doi: 10.2307/1353067
Kling, G. W., Kipphut, G. W., and Miller, M. C. (1991). Arctic lakes and streams as gas conduits to the atmosphere : implications for tundra carbon budgets. Science 251, 298–301. doi: 10.1126/science.251.4991.298
Kochmann, J., Buschbaum, C., Volkenborn, N., and Reise, K. (2008). Shift from native mussels to alien oysters: differential effects of ecosystem engineers. J. Exp. Mar. Bio. Ecol. 364, 1–10. doi: 10.1016/j.jembe.2008.05.015
Krassoi, F. R., Brown, K. R., Bishop, M. J., Brendan, P., and Summerhayes, S. (2008). Condition-specific competition allows coexistence of competitively superior exotic oysters with native oysters. J. Anim. Ecol. 77, 5–15. doi: 10.1111/j.1365-2656.2007.01316.x
Laing, I., Walker, P., and Areal, F. (2006). Return of the native–is European oyster (Ostrea edulis) stock restoration in the UK feasible? Aquat. Living Resour. 19, 283–287. doi: 10.1051/alr:2006029
Lawson, N. (2011). The State of Duxbury Bay 2009. Available online at: https://www.town.duxbury.ma.us/sites/duxburyma/files/uploads/duxbury_bay_management_study_2009.pdf
Lenth, R. (2018). emmeans: Estimated Marginal Means, Aka Least-Squares Means. R package version 1.2.3.
Marie, A., Delignette-muller, L., Dutang, C., Denis, J., and Delignette-muller, M. M. L. (2015). Fitdistrplus: an R package for fitting fistributions. J. Stat. Softw. 64, 1–34. doi: 10.18637/jss.v064.i04
Molnar, J. L., Gamboa, R. L., Revenga, C., and Spalding, M. D. (2008). Assessing the global threat of invasive species to marine biodiversity. Front. Ecol. Environ. 6:64. doi: 10.1890/070064
Myhre, G., Shindell, D., Breon, F.-M., Collins, W., Fuglestvedt, J., Huang, J., et al. (2013). “Anthropogenic and natural radiative forcing,” in Climate Change 2013: The Physical Science Basis. Contribution of Working Group 1 to the Fifth Assessment Report of the Intergovernmental Panel on Climate Change, eds. T. F. Stockner, D. Qin, G.-K. Plattner, M. Tignor, S. K. Allen, J. Boschung, et al. (Cambridge; New York, NY: Cambridge University Press), 659–740.
Opio, C., Gerber, P., Mottet, A., Falcucci, A., Tempio, G., MacLeod, M., et al. (2013). Greenhouse Gas Emissions from Ruminant Supply Chains–A Global Life Cycle Assessment. Rome: Food and Agriculture Organization of the United Nations. Available online at: http://www.fao.org/3/i3461e/i3461e00.htm
Prairie, Y. T. (1996). Evaluating the predictive power of regression models. Can. J. Fish. Aquat. Sci. 53, 490–492. doi: 10.1139/f95-204
Ray, N., Henning, M., and Fulweiler, R. (2019a). Nitrogen and phosphorus cycling in the digestive system and shell biofilm of the eastern oyster (Crassostrea virginica). Mar. Ecol. Prog. Ser. 621, 95–105. doi: 10.3354/meps13007
Ray, N. E., Maguire, T. J., Al-Haj, A. A., Henning, M., and Fulweiler, R. W. (2019b). Low greenhouse gas emissions from oyster aquaculture. Environ. Sci. Technol. 53, 9118–9127. doi: 10.1021/acs.est.9b02965
Rossong, M. A., Williams, P. J., Comeau, M., Mitchell, S. C., and Apaloo, J. (2006). Agonistic interactions between the invasive green crab, Carcinus maenas (Linnaeus) and juvenile American lobster, Homarus americanus (Milne Edwards). J. Exp. Mar. Bio. Ecol. 329, 281–288. doi: 10.1016/j.jembe.2005.09.007
Seebens, H., Briski, E., Ghabooli, S., Shiganova, T., MacIsaac, H. J., and Blasius, B. (2019). Non-native species spread in a complex network: the interaction of global transport and local population dynamics determines invasion success. Proc. R. Soc. B Biol. Sci. 286:20190036. doi: 10.1098/rspb.2019.0036
Seitzinger, S. P., and Nixon, S. W. (1985). Eutrophication and the rate of denitrification and N20 production in coastal marine sediments. Limnol. Oceanogr. 30, 1332–1339. doi: 10.4319/lo.1985.30.6.1332
Souchu, P., Vaquer, A., Collos, Y., Landrein, S., and Bibent, B. (2001). Influence of shellfish farming activities on the biogeochemical composition of the water column in Thau lagoon. Mar. Ecol. Process Ser. 218, 141–152. doi: 10.3354/meps218141
Sousa, R., Gutiérrez, J. L., and Aldridge, D. C. (2009). Non-indigenous invasive bivalves as ecosystem engineers. Biol. Invasions 11, 2367–2385. doi: 10.1007/s10530-009-9422-7
Stief, P., Poulsen, M., Nielsen, L. P., Brix, H., and Schramm, A. (2009). Nitrous oxide emission by aquatic macrofauna. Proc. Natl. Acad. Sci. U.S.A. 106, 4296–4300. doi: 10.1073/pnas.0808228106
Svenningsen, N. B., Heisterkamp, I. M., Sigby-Clausen, M., Larsen, L. H., Nielsen, L. P., Stief, P., et al. (2012). Shell biofilm nitrification and gut denitrification contribute to emission of nitrous oxide by the invasive freshwater mussel Dreissena polymorpha (Zebra mussel). Appl. Environ. Microbiol. 78, 4505–4509. doi: 10.1128/AEM.00401-12
ARS (2018). USDA National Nutrient Database for Standard Reference, Legacy. Beltsville, MD: Agricultural Research Service.
Vitousek, P. M., Loope, L. L., and Westbrooks, R. (1996). Biological invasions as global environmental change. Am. Sci. 84, 218–229.
Wilkie, E. M., Bishop, M. J., and Connor, W. A. O. (2012). Journal of experimental marine biology and ecology are native Saccostrea glomerata and invasive Crassostrea gigas oysters' habitat equivalents for epibenthic communities in south-eastern Australia? J. Exp. Mar. Bio. Ecol. 420–421, 16–25. doi: 10.1016/j.jembe.2012.03.018
Keywords: methane, nitrous oxide, exotic species, coastal biogeochemistry, carbon dioxde
Citation: McCarthy GJ, Ray NE and Fulweiler RW (2019) Greenhouse Gas Emissions From Native and Non-native Oysters. Front. Environ. Sci. 7:194. doi: 10.3389/fenvs.2019.00194
Received: 17 July 2019; Accepted: 02 December 2019;
Published: 19 December 2019.
Edited by:
Elena Tricarico, University of Florence, ItalyReviewed by:
Nadescha Zwerschke, British Antarctic Survey (BAS), United KingdomCamilla Bertolini, Ca' Foscari University of Venice, Italy
Copyright © 2019 McCarthy, Ray and Fulweiler. This is an open-access article distributed under the terms of the Creative Commons Attribution License (CC BY). The use, distribution or reproduction in other forums is permitted, provided the original author(s) and the copyright owner(s) are credited and that the original publication in this journal is cited, in accordance with accepted academic practice. No use, distribution or reproduction is permitted which does not comply with these terms.
*Correspondence: Gretchen J. McCarthy, Z2ptbWNjQGJ1LmVkdQ==; Robinson W. Fulweiler, cndmQGJ1LmVkdQ==