- 1Aquaveo, LLC, Provo, UT, United States
- 2Department of Civil and Environmental Engineering, Brigham Young University, Provo, UT, United States
- 3International Centre for Integrated Mountain Development (ICIMOD), Lalitpur, Nepal
- 4National Oceanic and Atmospheric Administration (NOAA), Silver Springs, MD, United States
Hydrologic modeling can be used to aid in decision-making at the local scale. Developed countries usually have their own hydrologic models; however, developing countries often have limited hydrologic modeling capabilities due to factors such as the maintenance, computational costs, and technical capacity needed to run models. A global streamflow prediction system (GSPS) would help decrease vulnerabilities in developing countries and fill gaps in areas where no local models exist by providing extensive results that can be filtered for specific locations. However, large-scale forecasting systems come with their own challenges. These New hydroinformatic challenges can prevent these models from reaching their full potential of becoming useful in the decision making process. This article discusses these challenges along with the background leading to the development of a large-scale streamflow prediction system. In addition, we present a large-scale streamflow prediction system developed using the GloFAS-RAPID model. The developed model covers Africa, North America, South America, and South Asia. The results from this model are made available using a Hydrologic Modeling as a Service approach (HMaaS) as an answer to some of the discussed challenges. In contrast to the traditional modeling approach, which makes results available only to those with the resources necessary to run hydrologic models, the HMaaS approach makes results available using web services that can be accessed by anyone with an internet connection. Web applications and services for providing improved data accessibility, and addressing the discussed hydroinformamtic challenges are also presented. The HydroViewer app, a custom application to display model results and facilitate data consumption and integration at the local level is presented. We also conducted validation tests to ensure that model results are acceptable. Some of the countries where the presented services and applications have been tested include Argentina, Bangladesh, Colombia, Peru, Nepal, and the Dominican Republic. Overall, a HMaaS approach to operationalize a GSPS and provide meaningful and easily accessible results at the local level is provided with the potential to allow decision makers to focus on solving some of the most pressing water-related issues we face as a society.
1. Introduction
The creation of a global high-resolution streamflow prediction system fills a critical need for many water-related application areas, including food security, climate change, and risk reduction. The United Nations (UN) has adopted a set of goals that aspire to greater prosperity for our society while maintaining a sustainable approach. The list, known as the Sustainable Development Goals (SDGs), includes seventeen different goals aimed at areas of need such as poverty and hunger. This set of goals highlights how important water is for the success of humankind as more than half of the seventeen goals are directly related to water, and one can argue that many other goals if not all are indirectly and positively affected by a greater understanding and use of water resources. Complementary to the UN's SDGs, the SENDAI Framework for Disaster Risk Reduction constitutes an agreement endorsed by the UN to reduce disaster risk, and subsequently the losses of lives, livelihoods, and environmental assets at the individual, community, and country scale due to natural disasters.
Early warning systems have been identified a one of the main strategies to help reduce environmental risks, especially those due to hydrological events (Hallegatte, 2012; Alfieri et al., 2013; Wilhite et al., 2014; Cools et al., 2016). The main concept behind any disaster risk reduction or mitigation is to lower the costs of such events. The effectiveness of flood preparedness has been proven by various general and localized estimates that compare the initial cost of the initiative with the potential cost of a given flood event or a number of them (Godschalk et al., 2009; Kelman, 2013; Kull et al., 2013). Developed countries usually possess the resources required to develop and operate models that provide the necessary information to drive their own flood warning system. The US National Water Model and the European Flood Awareness System are prime examples of such models. While most of the developed world has adequate data, models, tools, and experience, developing countries often lack the capacity to produce and maintain their own modeling infrastructure, which in turn increases their vulnerability. Organizations like the World Bank have recognized that international assistance is essential for developing countries to overcome vulnerability. With floods being one of the most recurrent and costly natural disaster around the world, the development of a global streamflow prediction system (GSPS) as a source to feed local early warning systems also has the potential to markedly improve risk reduction, especially in areas lacking the resources to develop their own models. A GSPS that supplements and fills gaps in local information can be used to help us understand how to better respond to extreme events such as floods and droughts, and prepare accordingly.
The development of a functional global high-resolution hydrologic model was deemed one of the “grand challenges” within hydrology (Wood et al., 2011). A functional global model must have sufficient resolution to be relevant at local scales. The development of large-scale high-resolution models has become a focus for many hydro-meteorological scientists in response to this challenge.
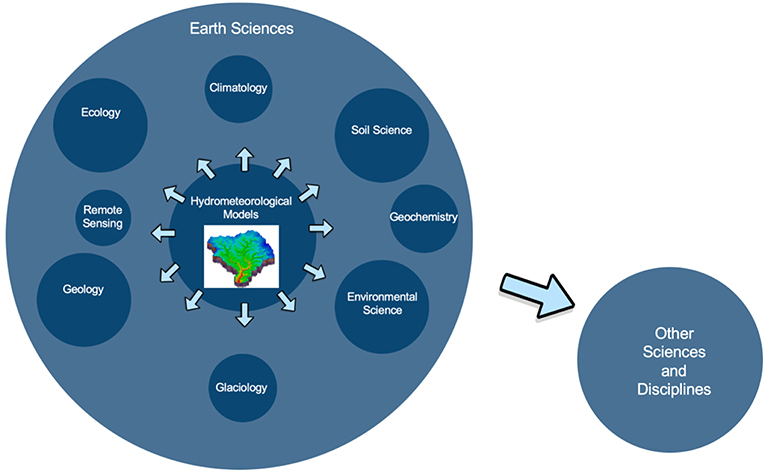
In recent years, a number of large-scale models have emerged (Rodell et al., 2004; Lindström et al., 2010; Alfieri et al., 2013; NOAA, 2016). The development of such models has been possible due to the evolution of hydrologic modeling, which includes a number of internal scientific advances, but also a vertical expansion where elements from other sciences such as meteorology have been integrated. As a result, we have increased our ability to predict hydrologic events by linking atmospheric and land surface models so they can work as one integrated hydrometeorological model. Advances in other disciplines, such as information technology and computer science, have also made the development of larger-scale models possible, by providing local access to large datasets that cannot be downloaded and explored on a desktop environment. In addition, probabilistic forecasts offer an alternative to incorporate the uncertainty introduced by the inputs used to run a hydro-meteorological model through ensemble forecasting (Demeritt et al., 2013). This expansion of hydrologic modeling opens the door for greater application in all the earth sciences and provides valuable support to solving the wider set of interdisciplinary problems articulated in the SDG's. Figure 1 shows a concept example of how hydrometeorological models can provide water intelligence in a multidisciplinary environment that aims to solve complex problems.
While many advancements and improvements to hydrometeorological models have been and are being made, there are major challenges remaining to make these large-scale models relevant at the local scale where decisions are made. For example. the inherent uncertainty introduced by models themselves can be significant and should not be overlooked (Butts et al., 2004). In addition, while traditional discharge calibration from observed discharge can improve model performance in a specific area, it is difficult to find a single parameterization that works well for a large-scale model given its inherent (Sperna Weiland et al., 2015).
On the other hand, the amount of data produced by large-scale models presents yet a new hydroinformatic challenge. Furthermore, integrating and communicating model results has historically been a major challenge due to the evolving nature of hydrology and hydrologic models (Beran and Piasecki, 2009).
In general, communicating water data to different groups (e.g., scientists, emergency responders, decision makers, and the general public) has also been a major challenge due to their distinct contexts and needs (Souffront Alcantara et al., 2017). The answer to this challenge is being answered by the adoption of standards, a push to create Earth Observation Systems (EOS) and model results that can be accessed as services, and the creation of derivative tools that facilitate the interpretation and application of data.
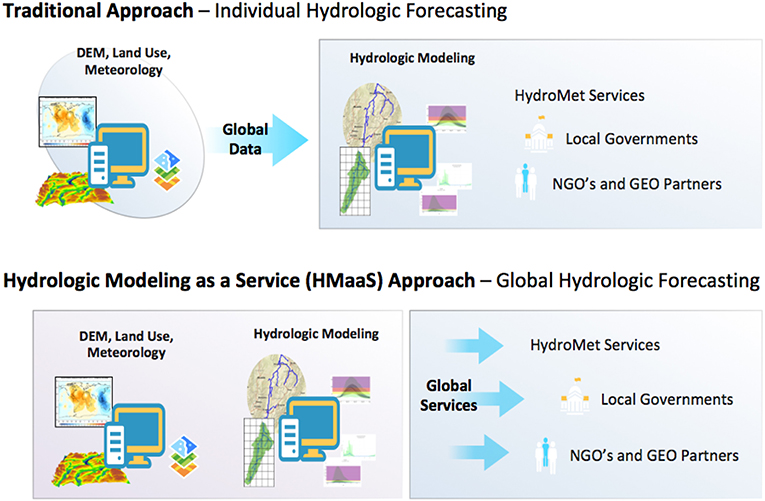
Replicating a hydrologic model, with the same or different inputs and coverage, requires technical skill, and computational resources. The overall cost of deploying, running, and maintaining the model are also limiting factors. Since decision makers and stakeholders are not expected to have the skills necessary to provide sustainable hydrologic modeling predictions, capacity building and specific training at the technical level is usually the solution. However, this is often a short-term solution mainly due to maintenance costs after the end of the project/funds, and to the loss of the original trained staff over time. While a number of large-scale models that provide hydrologic information useful for areas lacking a local model already exist, the available resolution for these models is usually not adequate at the local scale. A HMaaS approach solves these issues by taking advantage of the latest cloud computing and information communication technologies to provide model results as a service at a meaningful resolution, thus alleviating local maintenance costs, reducing the necessary technical training, and allowing investors to focus on providing training and funds for the actual problems that hydrologic modeling is needed for such as water distribution issues, and early warning systems (Figure 2).
This paper summarizes our effort to create a streamflow prediction system covering most of the globe with sufficient detail to be useful locally while emphasizing the need to make results readily available to different user groups using a state-of-the-art service-oriented technology. Implementation and validation results are presented. Additionally, the extended challenges resulting from the creation of such a model are discussed in detail.
2. Hydrologic Modeling and Hydroinformatic Challenges
Communicating model results has historically been a major barrier between engineers and scientists, and decision makers. A successful model needs to provide clear and actionable information to meet the demand of its user community. However, in the case of hydrologic models, there is a range of distinct users with very specific, but totally different needs. These groups range from scientists to the general public. The nature of scientific research makes data discovery and retrieval a need that requires constant attention. This is not the case for other user groups. In other words, finding model data is not a priority in decision making. Therefore, most models often fail to be relevant to other groups due to the difficulty of obtaining model results in a relatively straightforward way.
Modeling as a Service (MaaS) is a distribution mechanism in which a provider makes a model, or modeling results available to stakeholders through the use of web services. This concept, which evolved from the Software as a Service (SaaS) (Choudhary, 2007), and the Anything as a Service (XaaS) (Duan et al., 2015) principles has gained speed as an answer to challenges in the deployment of environmental models in general. Roman et al. (2009) discussed the challenge of migrating stand-alone applications to services on the web. Furthermore, Li et al. (2017) proposed a MaaS as a solution to the many challenges of deploying models in the geospatial sciences.
The realization that even if a robust model that provides clear and accurate results won't be useful unless results are readily available and presented in context has opened the doors to addressing some of these extended challenges in the field of Hydroinformatics. These challenges do not only cover communication issues like data accessibility, relevancy, and clarity; but also include big data issues like storage, maintenance, and metrics tracking, and adoption issues like ownership, partnering, branding, and overall implementation alternatives at the local level. Adding to these issues is data validation, which has traditionally been a model challenge, but more so in the case of large-scale models. We have divided these hydroinformatic challenges in four main areas in order to better discuss them.
• Big Data
• Communication
• Adoption
• Validation
2.1. Big Data
A GSPS requires a solid cyberinfrastructure where results can be computed, stored, visualized, and retrieved. Moreover, a continuous operational forecast system requires a workflow that can be run automatically. This would include the download and organization of model inputs, which would add to the already large amount of data produced by the model. Therefore, the cyberinfrastructure for a global model is bound to include organizational tasks to download, archive, and delete data. Traditionally, hydrologic models have been run on local servers, however with the latest advances in Information and Communication Technologies (ICT), and in accordance with the MaaS concept, cloud storage and computing has become an indispensable resource.
Cloud computing offers a number of advantages for the development of an operational global forecast prediction system using a MaaS approach. Some of the most obvious advantages include: the removal of expensive computing hardware and storage for every local agency, cloud cyberinfrastructures are scalable, maintenance time and costs are removed with machines being maintained by the cloud provider. In addition, the entire system can be managed from one place (usually a dashboard). A task manager can handle the entire workflow from data input collection to model results storing. This is not unique to cloud computing environments, but it becomes a must when dealing with High Performance Computing (HPC) as would be the case with a global high resolution streamflow prediction system.
2.2. Communication
In the last few decades, the emergence of standards for the sharing and distributing hydrologic data has made communicating and disseminating water data much easier. Some of these standards include WaterML, which offers a simple structure for working with time series data (Almoradie et al., 2013); netCDF, which offers a more solid structure for working with multi-dimensional data (Rew and Davis, 1990); and GIS open web service standards like Web Mapping Service (WMS), Web Feature Service (WFS), and Web Processing Service (WPS), which offer a common denominator for exposing geospatially enabled water data in a dynamic way that is compatible with most available web-based visualization tools.
The adoption of the standards mentioned above has helped reduce the existing gap between data producers and data users in the hydrologic community. However, most of the focus on data communication is usually placed on scientific/research users. Furthermore, water data needs to be effectively communicated not only to the scientific community, but also to decision makers, emergency responders, and the general public. Water data needs to be presented as actionable information that is accessible and understandable for all user levels (Souffront Alcantara et al., 2017).
A solution to communicating results to the broad set of groups needing access to results is to develop intuitive web applications and services that allow users to interact with the data according to their specific needs. HMaaS through the use of a web app has many benefits. Results can be displayed using open standards, while other functionality can be added to satisfy user needs from a simple web browser. Web apps can successfully link the back-end cyberinfrastructure needed to generate forecast results with state-of-the art web development technologies to create a dynamic environment where users from different levels can access information that is relevant to them by taking advantage of open standards like WaterML, and OGC's WMS, WFS, and WPS.
2.3. Adoption
Adopting a new technology usually depends on the estimated benefits and costs of implementation. In the case of a large-scale streamflow prediction system, there are a number of general and specific factors that will determine such benefits and costs, and therefore influence implementation at the local level. Some of the general factors include the existence of a local system, and the disposition of the local community to incorporate or integrate a global system. In such a case, the global system's value would most likely be in serving as a secondary tool to trigger action, to corroborate when an extreme event is forecasted by the local system, or fill gaps from the limitations of local models in space or application. Obviously, the greatest value of a global system comes when there is no local system available.
More specific factors regarding the adoption of a global forecasting system include the time it takes to adopt new technologies, and who would take responsibility for the success/failure of the model in predicting events accurately. Principles like the Technology Acceptance Model (TAM) suggest that the adoption of a new technology depends on the perceived ease of use and usefulness of the technology (Davis, 1986). In theory, a HMaaS system offers a relatively ease of use by eliminating the costs of producing the model in favor of offering forecast results as web services that can be consumed by anyone and through programmatic means to develop derivative applications as needed. However, it is important to notice that while a forecast is provided, model results still need to be interpreted by able professionals, and decision support systems that enable responses to forecasted events remain the responsibility of the local community. Therefore, an understanding of model assumptions, limitations, and application is required at the local level. In addition, each country/region that decides to implement a global prediction system will have a vested interest in the good performance of the model. To this end, a mechanism to provide feedback and keep track of model performance is necessary.
The success or failure of the model to predict imposes certain responsibility on the owner of the model. But with a global system, ownership may not be initially clear. While the developer of the model provides results, interpretation, and response to the model fall at the local level. In practical terms, the weight of the decision support system developed from the model is of far more importance than the generation of a model. As a result, it is advised that a multi-criteria approach be used to support decisions whenever possible. Examples of such systems usually include multiple models, or observation data integration (Niswonger et al., 2014; Wan et al., 2014; Horita et al., 2015; Svoboda et al., 2015; Ahmadisharaf et al., 2016). Based on these factors, users may welcome or reject ownership and therefore responsibility over certain aspects of a global model. To this end, there are a number of implementation levels that would depend on what is determined to work better at the local level by the local agency itself.
1. External model consumption through a web app: The model is accessed from a generic web app developed to display the complete global model. Additional functionality in the app would allow for extraction and visualization of data for a specific area. This generic app could be hosted by an international organization working with different countries/regions.
2. Internal model consumption through a web app: The model is generated on-premise and displayed and accessed the generic web app. Internal generation would allow for computation of areas of interest only.
3. External model consumption through web services: The model is accessed through open standards and a REST API, and displayed using a customizable web app or integrated into an existing visualization tool.
2.4. Validation
The accuracy and uncertainty of a model need to be quantified before forecasts can be trusted for any decision-making. Traditionally, models are tested and calibrated for specific areas. This poses an additional challenge for a large-scale forecast system. Given the global extent, validation and calibration would be a very arduous task. To this end, many large-scale models have instead carried over the uncertainty of their inputs by presenting an ensemble result that accounts for input uncertainty.
Another way the accuracy of the forecast can be evaluated is by comparing results to observed data. Assuming a global model has been adopted at a regional or local scale, the model could be easily compared to regional or local observed data. Moreover, a global forecast that uses open standards improves the ability to compare with any other existing dataset. However, a mechanism to facilitate data comparison would be needed to ensure that comparisons could be made in any specific area following similar criteria.
3. Materials and Methods
A high-density large-scale streamflow prediction system covering most of the world has been developed using GloFAS runoff, ERA Interim data, and the RAPID routing model. The workflow to generate these forecasts was deployed completely on the cloud. Two main web applications exist to interact with the results, while a REST API has also been developed to easily retrieve data without the need of a web interface, or for which custom views and subareas can be created in a separate web interface. A number of validation tests have also been performed to assert that: (1) the high-density routed forecasts yield, in essence, the same result as the original GloFAS and ERA Interim result; (2) variability on the chosen resolution to route the runoff does not alter the results at a given location; (3) model results are close to observed data at different locations around the world.
GloFAS is an ensemble hydrologic model that generates 51 different runoff forecasts for the major rivers of the world on a global grid with a resolution of 16 km2 on a continuous basis. A 52nd forecast is generated at a resolution of 8 km2. GloFAS was released in 2011 by ECMWF and the European Commission's Joint Research Centre (JRC) as part of the Copernicus Emergency Management System (CEMS), and has been quasi-operational since July 2011, and fully operational since April 2018. The GloFAS system is composed of an integrated hydrometeorological forecasting chain and of a monitoring system that analyzes daily results and shows forecast flood events on a dedicated web platform (Alfieri et al., 2013). This model uses real-time and historical observations in combination with a Data Assimilation System (DAS) and a Global Circulation Model (GCM). The underlying framework used to create GloFAS is ECMWF's Integrated Forecasting System (IFS). GloFAS uses HTESSEL for its land surface scheme. HTESSEL is a hydrologically revised version of the Tiled ECMWF Scheme for Surface Exchanges over Land (TESSEL) model (Balsamo et al., 2008). This new land surface scheme corrected the absence of a surface runoff component in its predecessor, among other minor improvements.
The ERA-Interim data is the result of a global atmospheric reanalysis produced also by ECMWF. This data covers from January 1980 through December 2014 (35 years) for the entire globe. One of the advantages of using reanalysis is that the data provides a global view that encompasses many essential climate variables in a physically consistent framework, with only a short time delay (Dee et al., 2011). This type of data becomes invaluable in areas where no actual observed data are available. A runoff derivative of this atmospheric reanalysis was produced on a 40 km2 global grid using a land surface model simulation in HTESSEL.
GloFAS forecasts can be visualized from their main website (http://www.globalfloods.eu/glofas-forecasting/), which combines the forecasts from GloFAS and the simulated historic run from the ERA Interim to provide an awareness system that displays warning points and the probability of an event occurring based on the ensemble forecasts and return periods extracted from the ERA data.
RAPID is a numerical model that simulates the propagation of water flow waves in networks of rivers composed of tens to hundreds of thousands of river reaches (David et al., 2016). The RAPID model is based on the Muskingum method, which has a time and a dimensionless parameter as its main variables. RAPID successfully created a way to efficiently adapt the Muskingum method to any river network.
In an effort to create a higher density version of GloFAS that would include smaller, but important streams Snow et al. (2016) combined GloFAS with the River Application for Parallel Computation of Discharge (RAPID) routing model covering the main hydrologic regions within the United States. This work addresses GloFAS' density challenge by routing model results through a predefined river network that provides results not only for major rivers but for any potential river in the world. The Streamflow Prediction Tool (SPT), a web app similar to the main GloFAS application, was also originally developed as part of this work. The SPT provides an intuitive user interface that allows for the easy lookup and visualization of results. Other advances of this app include the capability to present dynamic hydrographs as opposed to static images. We have improved the SPT by incorporating a REST API, and improving the visualization of results.
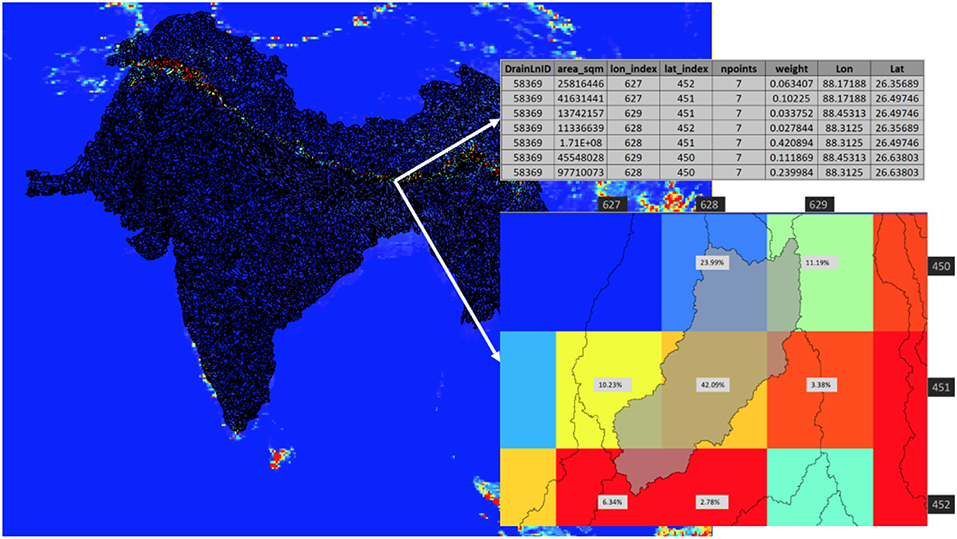
We created a river network and weight tables for Africa, North America, South America, and South Asia following the methodology presented by Snow et al. (2016) as shown in Figure 3. A river network for a specific area is created using the HydroSHEDS dataset, which is a hydrographic dataset based on elevation data from the Shuttle Radar Topography Mission (SRTM) that provides data at a global scale (Lehner et al., 2008). In addition to generating hydrography, this preprocessing also generates weight tables, and Muskingum/RAPID parameters for converting the gridded results from GloFAS to a vector-based forecast using the river network.
3.1. Implementation and Visualization
We have deployed two web applications to display results using the Tethys Platform framework. Tethys is a web framework for facilitating the development of water resources web applications. It includes specific open-source software components that address the unique development needs of water resources web apps with the main goal to lower the barrier of web app development for water resource scientists and engineers (Swain et al., 2016). The first web app, the SPT, was originally developed by Snow et al. (2016). The SPT provides an interactive map where users can select a specific river reach and display a hydrograph for that reach with a 10-day forecast and the 2, 10, and 20 year return periods corresponding to that reach. Some of the improvements to the SPT include the visual design of the app, especially the graph area, but more significantly the incorporation of a REST API.
A REST API is a web service that can be used to access data without the need of a web interface. REST APIs use the http protocol to request data where parameters are passed through a Uniform Resource Locator (URL) string using a predetermined organization. This development facilitates integration of our forecast results with third-party web apps, or any other workflow; the automation of forecast retrievals using any programing language; and the development of derived applications that consume these results through the API and further process them as opposed to incurring on the same computational costs of generating their own forecast results. This last use, allows for the development of lightweight applications that provide complex results by relying on APIs from other apps.
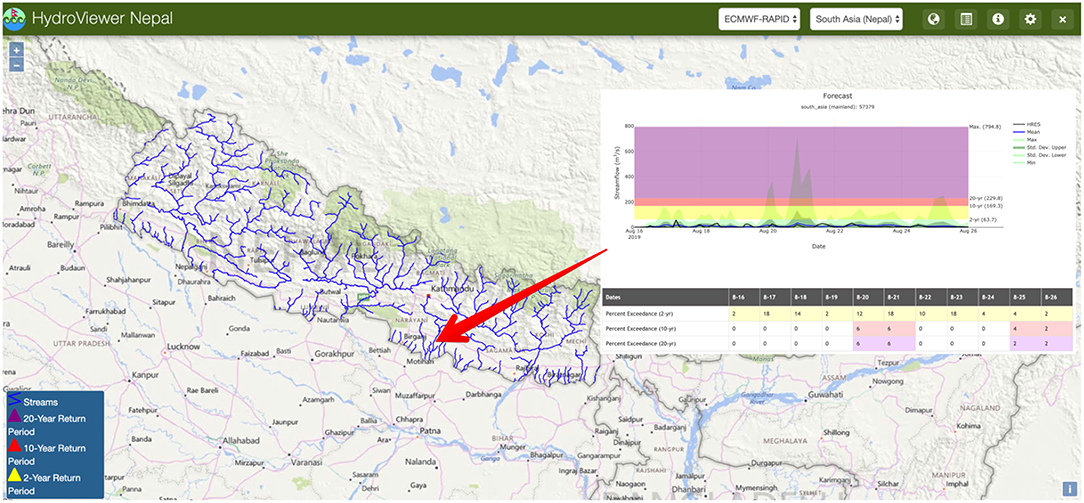
The HydroViewer app is an example of such a lightweight web application. It was designed to visualize streamflow forecasts for specific regions using different model alternatives, which can be added to the app in a relatively easy way. So far the app includes the aforementioned GloFAS-RAPID model, the South Asia Land Assimilation System (SALDAS), and the High Intensity Weather Assessment Toolkit (HIWAT) model for monitoring intense thunderstorms. This app relies on the use of REST APIs to retrieve and visualize water data as opposed to incurring into computational costs. The HydroViewer app was also designed to allow customizations for the specific region it is deployed to. This allows users to rebrand the web app and integrate it into their system. Figure 4 shows the HydroViewer app design.
A cloud-computing environment approach was used to deploy our workflow and make it accessible on the Internet. Two Virtual Machines were deployed on the cloud, one for performing the main computations necessary to generate the forecasts, and the other for hosting spatial web services for data visualization purposes.
3.2. Validation
Modeled data validation is essential for determining the value and limitations of the data. Jackson et al. (2019) compiled a number of commonly used error metrics that can be used to compare hydrologic modeled data to observed data. Some of these metrics include the Root Mean Square Error (RMSE) and derivatives, Coefficient of Determination, Coefficient of Correlation, Anomaly Correlation Coefficient, Nash-Sutcliffe Efficiency (NSE), and the Spectral Angle. Most of these error metrics have been compiled in a Python package called HydroStats (https://github.com/BYU-Hydroinformatics/Hydrostats).
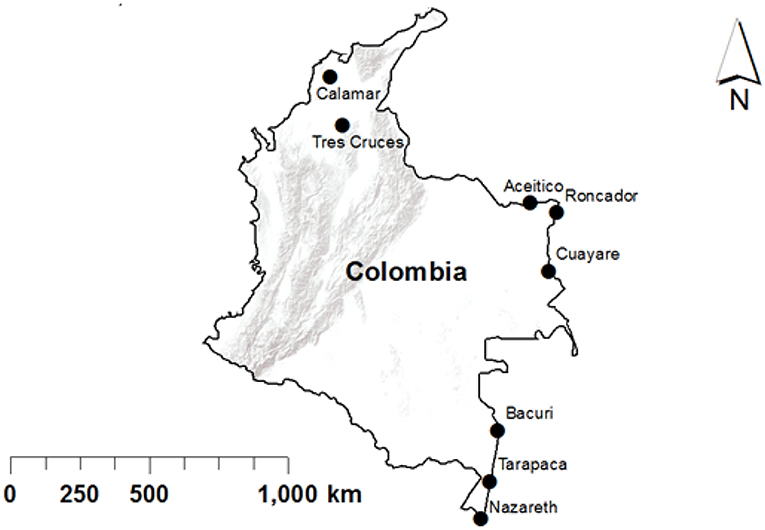
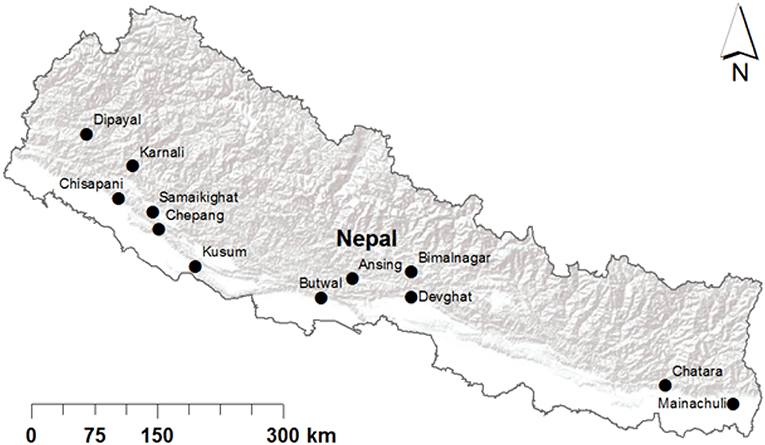
Using HydroStats, we compared our modeled results to observed data from Colombia, and Nepal. We analyzed eight stations for the former, and 12 stations for the latter (Figures 5, 6). In our analysis, we used a number of different metrics. We used the anomaly correlation coefficient, the root mean square error, the interquartile range normalized root mean square error, the Nash-Sutcliffe Efficiency metric, the Pearson correlation coefficient, the Spearman correlation coefficient, the spectral angle metric, the improved Kling-Gupta efficiency, and the refined index of agreement. We chose to use this suite of metrics to give a more complete picture of how well the simulated data correlates to the observed data (Krause et al., 2005).
We performed a comparison between our high-density routed results with the gridded result from GloFAS at selected locations. Data was collected from six GloFAS locations found in Nepal including Chatara, Chepang, Chisapani, Devghat, Kusum, and Parigaun. Our assumption was that if our result had similar trends and values to those of the original GloFAS runoff then it meant that our RAPID processing did not introduce any significant bias by converting the gridded GloFAS results to a higher density vector result based on a river network. In addition, we also assumed that the results of this comparison could be applied to other areas outside of the locations used for the comparison.
Data was collected every day for 9 weeks and summarized weekly. We used the mean flow of both datasets to perform the comparison as the best representation from all the ensembles. The flows from the GSPS were easily accessed through the use of the developed REST API. Because the flows from GloFAS came exclusively in a hydrograph image, values had to be digitized from the hydrograph images.
Multiple watersheds from distinct regions in the United States were tested to determine the effect of varying the catchment area resolution of the sub-basins within the watershed. The following criteria were used to select the watersheds.
• Watershed size of several hundred square kilometers.
• United States Geological Survey (USGS) gage station proximity to mouth.
• Relatively pristine area with no reservoirs.
Potential watersheds were selected from the USGS Hydro-Climatic Data Network, a collection of roughly 700 watersheds with relatively unimpaired flows.
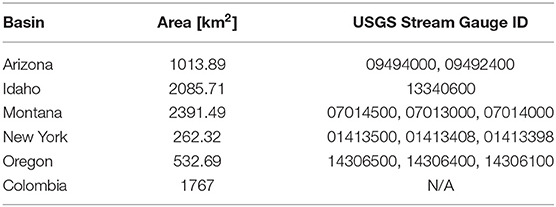
The selected sites included: the Meramec River near Sullivan, MO; the East Branch Delaware River at Margaretville, NY; the Alsea River near Tidewater, OR; the White River near Fort Apache, AZ; and North Fork Clearwater River near Canyon Ranger Station, ID. Another similar site, the Negro River in Colombia, was also tested (see Table 1).
The GloFAS-RAPID historical simulation was run for each watershed at three different resolutions (Table 2). The streamflow at the basins' mouths were compared using HydroStats. The resulting streamflows were also compared to observed data from USGS stream gage stations.
4. Results
A GSPS covering Africa, North America, South America, and South Asia at a resolution of 350 m2 was developed and deployed using cloud services and following a MaaS approach. The cloud cyberinfrastructure and workflows develop provide an alternative to the storing and data management side of the big data challenges described in section 2.1. Two web applications as well as a REST API were developed to communicate forecast results and provide alternatives that users can choose depending on their needs. These web applications and services directly address the communication challenges described in section 2.2. A series of validation tests were also performed on the results to determine that (1) our downscaling process did not alter results compared to the original GloFAS forecasts, (2) changing the catchment area of a river reach did not alter results downstream; that is, streamflow volume remained the same for downstream reaches, and (3) modeled results were close to observed results at different locations around the world.
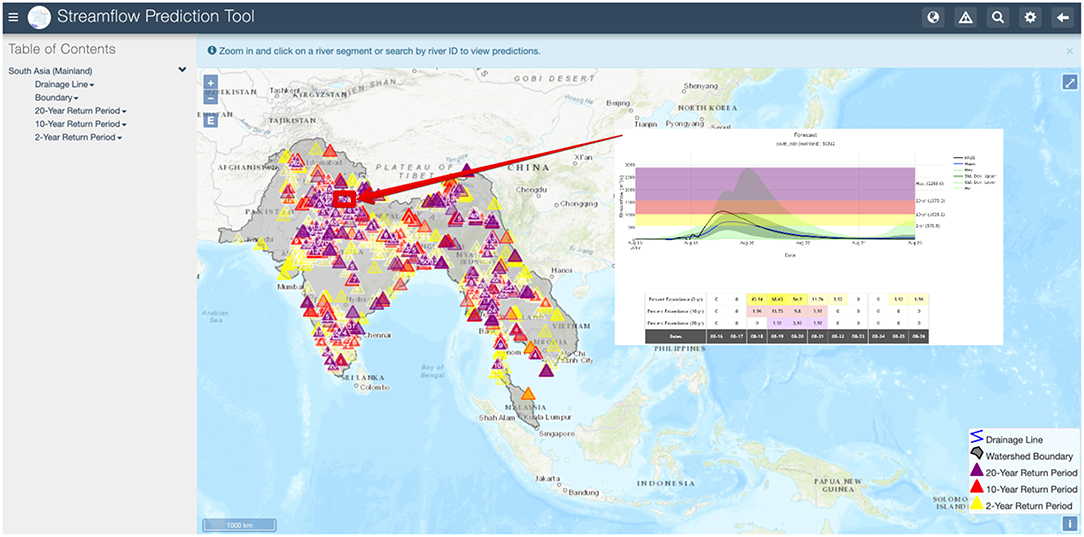
The new SPT provides visualization of our GloFAS-RAPID results as well as data retrieval in CSV and WaterML formats. Forecast results are available in the app for 1 week, after which they are removed and archived. Forecasts for a specific reach can be accessed by clicking on the reach. A pop-up window displays the dynamic hydrograph, which includes common interactions like zoom in or out, and data download as an image or CSV file. The hydrograph includes the 2, 10, and 20-year return periods to provide context of how much water is too much for a specific reach. The 51 ensembles are displayed using statistics that include the mean, min, max, and standard deviation. A percent exceedance table also displays the probability of a specific flow value surpassing a return period based on the prediction in each individual ensemble (Figure 7).
The SPT REST API was developed to facilitate data access. It includes methods to programmatically retrieve forecast statistics, as well as individual forecast ensembles. It also provides methods to retrieve the computed 35 year historic simulation, and derivatives such as return periods of each river reach within the regions. The REST API includes the following methods:
• GetForecasts: a method to extract forecast statistics from the 51 different ensembles available from the GloFAS-RAPID results. The available statistics are mean, max, min, and standard deviation. A high-resolution 52nd ensemble result is also available.
• GetEnsemble: a method to extract individual ensembles. Each ensemble can be retrieved separately, or a range of ensemble can be selected.
• GetHistoricData: a method to extract the 35 years of historic simulated data for a specific river reach.
• GetReturnPeriods: a method to extract the 2, 10, and 20 year return periods for a specific river reach calculated using the historic simulation.
• GetAvailableDates: a method for extracting the available forecasted dates.
• GetWarningPoints: a method that returns the center of a river reach along with information about the forecasted flow and if it is greater than any of the calculated return periods for that reach.
The REST API is the key functionality behind the HMaaS approach. It allows for programmatic data retrieval, and in turn, for the development of lightweight applications that provide results by relying on the API as opposed to local computational resources.
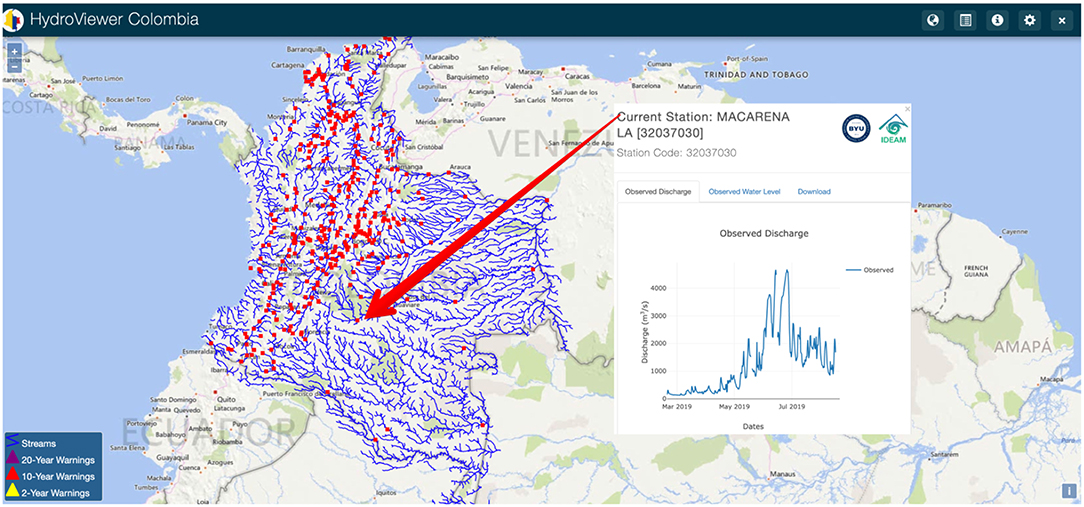
The HydroViewer app is a lightweight web application that allows users to display relevant data and customize the web app according to stakeholder needs. This app makes use of web services to display results as opposed to replicating the hardware, software, and modeling cyberinfrastructure to generate its own hydrological forecasts. The app uses the REST API to access forecast results and publicly available geospatial web services to display hydrographic data. The interface of the app can be customized to display the colors and logo of the organization it is deployed for, thus allowing users at the local scale to rebrand it as their own and market it as their own product. In addition, the HydroViewer app was designed with the principle of visualizing hydrologic results from different models, not only the GloFAS-RAPID model.
Customizations for different organizations also include the addition of hydrographs displaying observed data, data comparison displays, or the inclusion of other important geospatial data such as districts or country boundaries. Instances of the HydroViewer have been deployed for the following countries: Argentina, Bangladesh, Brazil, Colombia, La Hispaniola (The Dominican Republic, and Haiti), Nepal, and Peru. Figure 8 shows the customized HydroViewer for Colombia.
The incorporation of a REST API has enabled the development of more complex web applications that use forecast results retrieved using the REST API. Some of these web apps include flood mapping, reservoir monitoring, and statistical analysis applications. These apps benefit from a REST API by consuming the forecast results made available through the REST API endpoints. This allows for the creation of specialized apps that do not have the need to spend computational resources on recalculating essential input data such as streamflow.
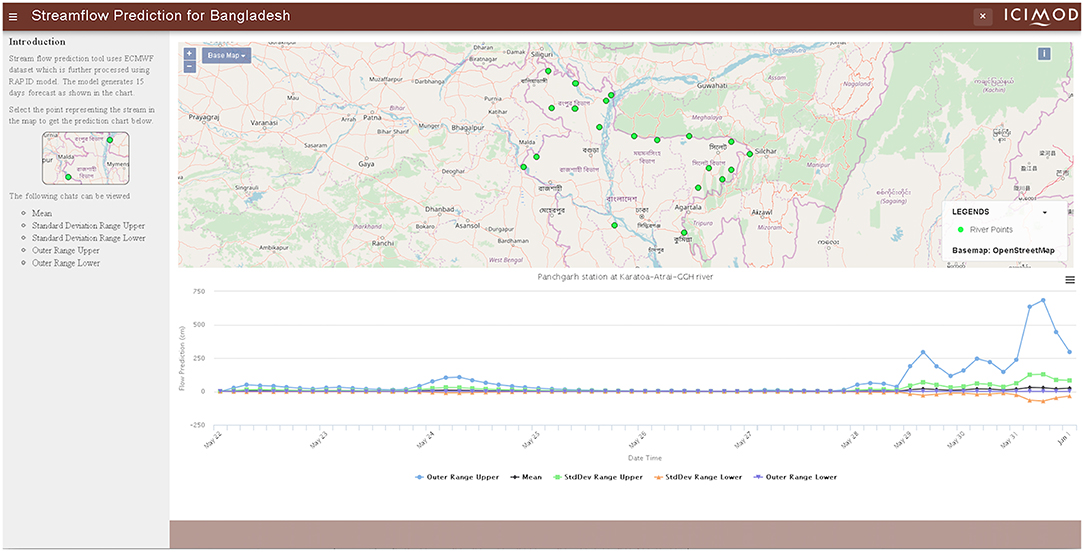
The developed REST API was used to develop custom applications at the International Centre for Integrated Mountain Development (ICIMOD) and also during trainings at the national and regional level to retrieve hydrologic information. One of the applications developed is the Bangladesh Transboundary Streamflow Prediction Tool (Figure 9). This app provides streamflow predictions for Bangladesh's Flood Forecasting and Warning Center (FFWC), in combination with observed data from twenty stations near the international border areas of Bangladesh. The data produced is mainly used as an input to feed internal hydraulic models in an effort to improve lag-time estimations.
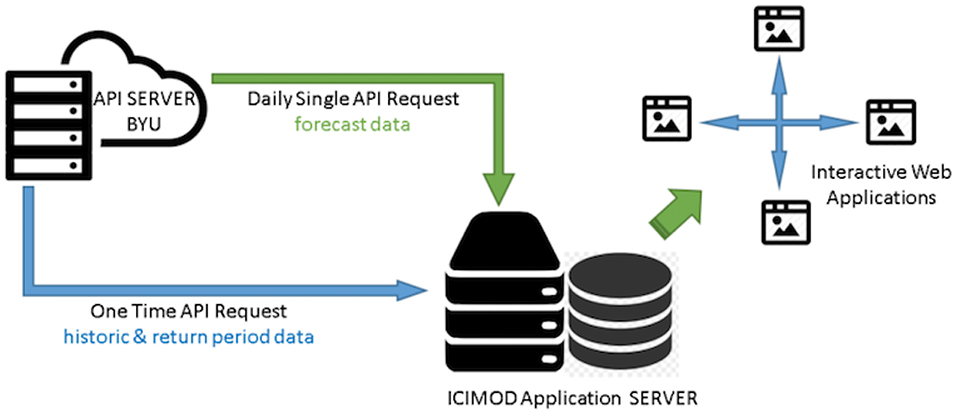
In addition, ICIMOD has fully integrated the HMaaS services into their cyberinfrastructure (Figure 10). ICIMOD has improved the performance of their applications and data center by implementing a workflow that downloads daily forecast data during low demand times using the REST API. The stored data is then used for different applications during high demand.
The Dominican Republic provides another example where the web services and visualization tools have helped strengthen vulnerabilities. An array of derivative applications that take advantage of the REST API have been subsequently developed. These applications range from reservoir storage monitoring to flood mapping and risk management. In particular, the custom version of the HydroViewer app for the Dominican Republic provides another layer of information by combining the previously existing Flash Flood Guidance system (Georgakakos, 2006) with the developed GSPS (Figure 11).
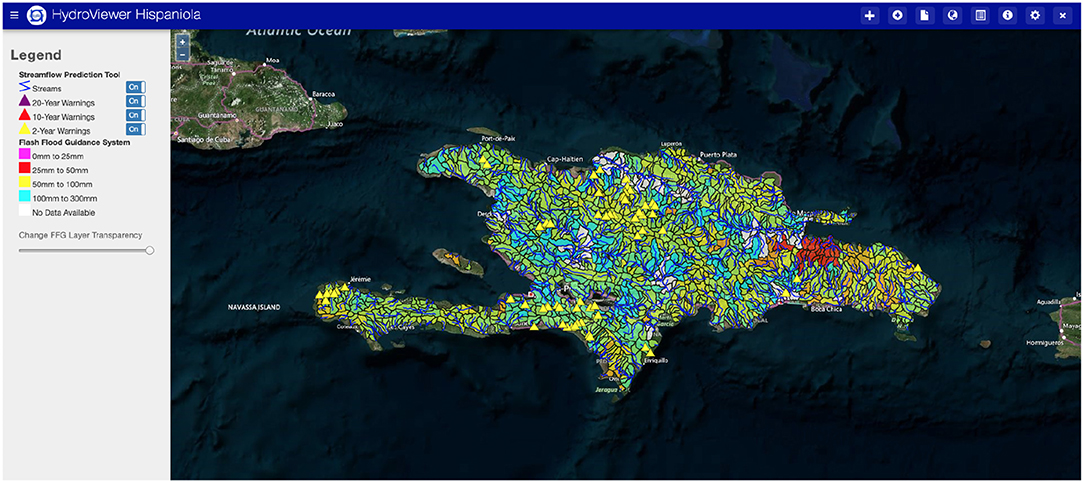
Figure 11. Hispaniola HydroViewer displaying both the Flash Flood Guidance and the Global Streamflow Prediction systems.
In general, the development of the HydroViewer app and the REST API facilitate the adoption and integration of the developed streamflow prediction system by providing a lightweight application that can be easily deployed and customized to visualize and interpret results, and providing a way for results to be integrated and combined with existing resources through the use of the REST API.
4.1. Validation Results
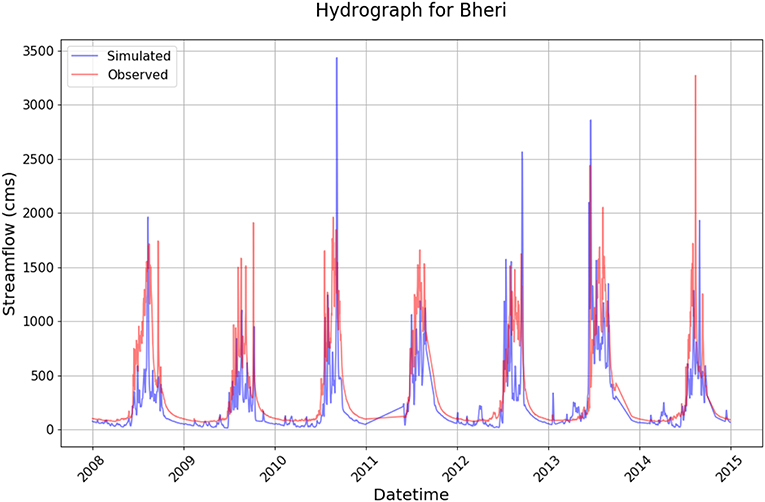
We compared our historic simulation results to observed data from 20 different locations in Nepal and Colombia. Figure 12 shows that the routed historic simulation successfully follows the same pattern as the observed data and captures most events with a tendency to under-predict. Data sheet 1 has the charts for Colombia and Data Sheet 2 the charts for Nepal. Table 3 shows a summary of the error metrics when comparing forecasted results with observed data at the selected locations.
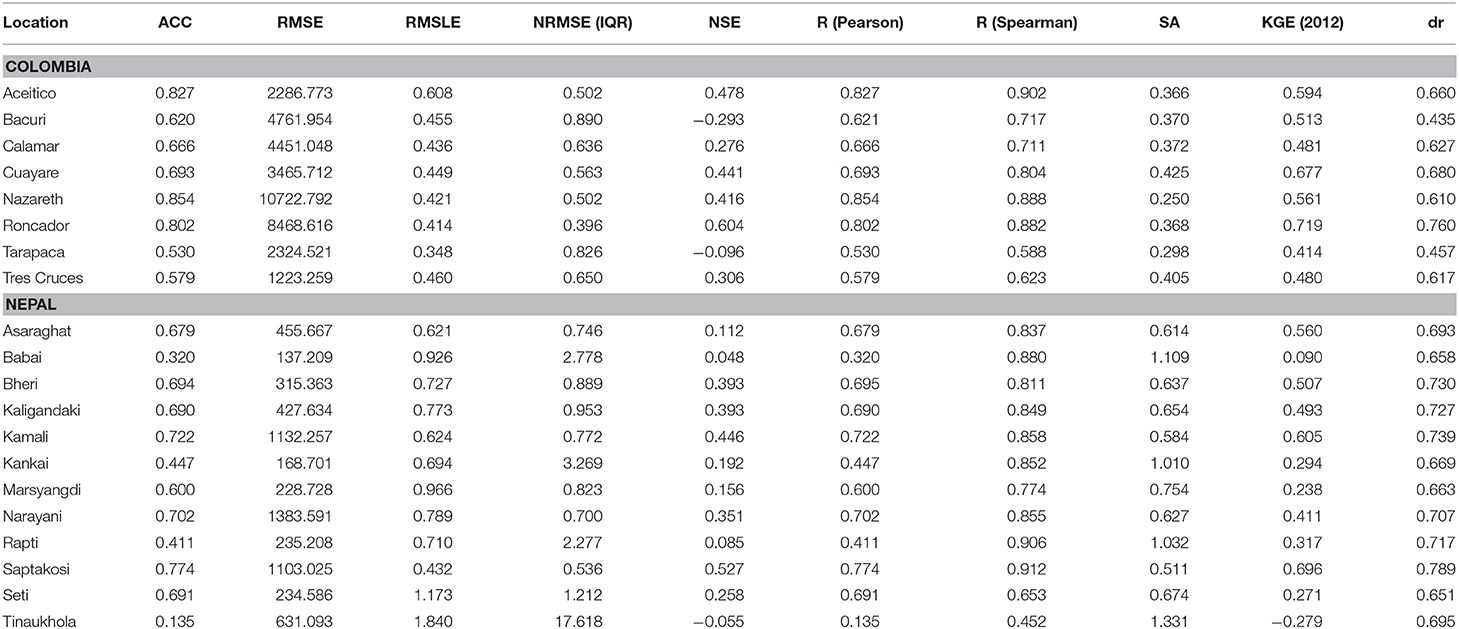
Table 3. Error metrics for Colombia and Nepal (Data sheet 1 has the charts for Colombia and Data Sheet 2 the charts for Nepal).
We performed an analysis to determine if our GloFAS-RAPID routed results were similar to the coarser GloFAS results. Data was collected for 9 weeks during the summer of 2017 and summarized weekly.
We found that GloFAS-RAPID provides a very similar result to the original GloFAS and follows trends with very similar shapes. This information demonstrates that even though GloFAS-RAPID is routing results over smaller watersheds, results from the same locations are still very similar in volume, with the main differences being the initialization methods used with each model, and the differences in the terrain and hydrography used for the routing. Table S1 corresponds to the validation exercise.
Finally, we performed an analysis to determine if our selected watershed size for routing results had any effect or introduced any variability on forecasted results. This was done by comparing forecasted results at the mouth of a watershed using three different spatial decompositions of the watershed upstream.
As expected, the results from varying resolutions at the mouth of all the tested watersheds did not yield any significant differences in the results. These results are consistent with the fact that the RAPID preprocessing methodology assigns a percentage of the total runoff volume to each sub-basin. The sum of these volumes at the mouth of a watershed should always be about the same. Aside from initial validation, data validation for a large-scale forecast prediction system at specific locations is a complicated task. This is in part due to the extent covered by the model. Local involvement is necessary to validate results and to provide feedback about the model. The collaboration efforts described above, as well as the development of validation tools, and accessibility tools such as REST APIs that facilitate forecasted and observed data analyses, provide a long term approach to validating and improving overall model results at the local level.
5. Conclusion
The traditional hydrologic modeling approach presents a major barrier for areas that lack the necessary resources to run a model. A HMaaS was developed to answer the need for water information in areas lacking the resources to run their own models. A large-scale streamflow prediction system based on the ECMWF ensemble global runoff forecast. However, this new model presents a series of challenges to run in an operational environment and to make the resulting streamflow information useful at the local scale. These “hydroinformatic” challenges were divided into four categories: big data, data communication, adoption, and validation. The developed model provides a high-density result by routing runoff volume from ECMWF using the RAPID routing model. A HMaaS approach was used to provide an answer to the communication challenges faced by a model covering such a large area. A cloud cyberinfrastructure was developed to host model workflows, inputs, and outputs. Web applications were deployed to expose results over the Internet. Web services such as a REST API and geospatial services were created to provide accessibility to forecasted results. Additional web applications were created with the main goal to allow customizations and provide flexibility for local agencies to use results according to specific needs. These projects were demonstrated in different countries around the world. Some of these countries include: Argentina, Bangladesh, Brazil, Colombia, Haiti, Peru, Nepal, Tanzania, the Dominican Republic, and the United States. We tested our results by comparing our forecasts to observed data. We determined that our model results are in essence the same as the GloFAS results, but in a higher density. We also determined that the our forecasted results are usually close to observed values and are able to capture most extreme events. Finally, we analyzed the effect of density variations on our model, and determined that sub-basin sizes do not significantly affect results at the mouth of the watershed.
Data Availability Statement
The high-density results from our GloFAS-RAPID model runs can be accessed through the SPT or for a specific area using the HydroViewer app. These apps are currently available online at two different portals: the NASA SERVIR app portal (https://tethys.servirglobal.net/apps/), and the BYU app portal (https://tethys.byu.edu/apps/). The source code for the latest version of the SPT can be found at https://github.com/BYU-Hydroinformatics/tethysapp-streamflow_prediction_tool, while detailed documentation including installation and use can be found at https://byu-streamflow-prediction-tool.readthedocs.io/en/latest/. The source code and documentation for the HydroViewer app can be found at https://github.com/BYU-Hydroinformatics/hydroviewer.
Author Contributions
EN, DA, and NJ helped conceive and guide the research for this work. MS helped conceive the original idea of Hydrologic Modeling as a Service as well as carry the bulk of the research and implementation of the global model presented. KS developed a derivative tool that makes use of the model service through its REST API and helped integrate the services in ICIMOD. CE carried the multiple resolution comparison analysis presented. WR developed the HydroStats package and performed the comparison analysis using observed data. CK compared the presented model to the original GloFAS model. AG guided efforts in comparing the traditional and hydrologic modeling as a service approaches through activities in the Group on Earth Observations (GEO).
Funding
This work was supported by the NASA ROSES SERVIR Applied Research Grant NNX16AN45G.
Conflict of Interest
MS and CK were employed by Aquaveo LLC.
The remaining authors declare that the research was conducted in the absence of any commercial or financial relationships that could be construed as a potential conflict of interest.
Acknowledgments
The authors wish to recognize collaborators: Cedric David and Alan Snow who developed key software; Christel Prudhomme, Florian Pappenberger, and Ervin Zsoter from ECMWF and Peter Salamon of JRC; the Copernicus Emergency Management System that made GloFAS forecasts available; NASA SERVIR for opportunity to test and validate model results; the Esri team who helped develop the global services visualization; and Microsoft's AI for Earth who provided cloud services necessary to run the model.
Supplementary Material
The Supplementary Material for this article can be found online at: https://www.frontiersin.org/articles/10.3389/fenvs.2019.00158/full#supplementary-material
References
Ahmadisharaf, E., Kalyanapu, A. J., and Chung, E.-S. (2016). Spatial probabilistic multi-criteria decision making for assessment of flood management alternatives. J. Hydrol. 533, 365–378. doi: 10.1016/j.jhydrol.2015.12.031
Alfieri, L., Burek, P., Dutra, E., Krzeminski, B., Muraro, D., Thielen, J., et al. (2013). GloFAS-global ensemble streamflow forecasting and flood early warning. Hydrol. Earth Syst. Sci. 17, 1161–1175. doi: 10.5194/hess-17-1161-2013
Almoradie, A., Jonoski, A., Popescu, I., and Solomatime, D. (2013). Web based access to water related data using OGCWaterML 2.0. Int. J. Adv. Comput. Sci. Appl. 3, 83–89. doi: 10.14569/SpecialIssue.2013.030310
Balsamo, G., Beljaars, A., Scipal, K., Viterbo, P., van den Hurk, B., Hirschi, M., et al. (2008). A revised hydrology for the ECMWF model: verification from field site to terrestrial water storage and impact in the integrated forecast system. J. Hydrometeorol. 10, 623–643. doi: 10.1175/2008JHM1068.1
Beran, B., and Piasecki, M. (2009). Engineering new paths to water data. Comput. Geosci. 35, 753–760. doi: 10.1016/j.cageo.2008.02.017
Butts, M. B., Payne, J. T., Kristensen, M., and Madsen, H. (2004). An evaluation of the impact of model structure on hydrological modelling uncertainty for streamflow simulation. J. Hydrol. 298, 242–266. doi: 10.1016/j.jhydrol.2004.03.042
Choudhary, V. (2007). “Software as a service: implications for investment in software development,” in 2007 40th Annual Hawaii International Conference on System Sciences (HICSS'07) (Waikola, HI: IEEE), 209a. doi: 10.1109/HICSS.2007.493
Cools, J., Innocenti, D., and O'Brien, S. (2016). Lessons from flood early warning systems. Environ. Sci. Policy 58, 117–122. doi: 10.1016/j.envsci.2016.01.006
David, C. H., Famiglietti, J. S., Yang, Z. L., Habets, F., and Maidment, D. R. (2016). A decade of RAPID–Reflections on the development of an open source geoscience code. Earth Space Sci. 3, 226–244. doi: 10.1002/2015EA000142
Davis, F. D. Jr. (1986). A technology acceptance model for empirically testing new end-user information systems: theory and results (dissertation). Ph.D. thesis, Massachusetts Institute of technology, Cambridge, MA, United States.
Dee, D. P., Uppala, S. M., Simmons, A. J., Berrisford, P., Poli, P., Kobayashi, S., et al. (2011). The ERA-Interim reanalysis: configuration and performance of the data assimilation system. Q. J. R. Meteorol. Soc. 137, 553–597. doi: 10.1002/qj.828
Demeritt, D., Nobert, S., Cloke, H. L., and Pappenberger, F. (2013). The European Flood Alert System and the communication, perception, and use of ensemble predictions for operational flood risk management. Hydrol. Process. 27, 147–157. doi: 10.1002/hyp.9419
Duan, Y., Fu, G., Zhou, N., Sun, X., Narendra, N. C., and Hu, B. (2015). “Everything as a service (XaaS) on the cloud: origins, current and future trends,” in 2015 IEEE 8th International Conference on Cloud Computing (Waikola, HI: IEEE), 621–628. doi: 10.1109/CLOUD.2015.88
Georgakakos, K. P. (2006). Analytical results for operational flash flood guidance. J. Hydrol. 317, 81–103. doi: 10.1016/j.jhydrol.2005.05.009
Godschalk, D. R., Rose, A., Mittler, E., Porter, K., and West, C. T. (2009). Estimating the value of foresight: aggregate analysis of natural hazard mitigation benefits and costs. J. Environ. Plan. Manage. 52, 739–756. doi: 10.1080/09640560903083715
Hallegatte, S. (2012). A Cost Effective Solution to Reduce Disaster Losses in Developing Countries: Hydro-Meteorological Services, Early Warning, and Evacuation. Waikola, HI: The World Bank. doi: 10.1596/1813-9450-6058
Horita, F. E. A., de Albuquerque, J. P., Degrossi, L. C., Mendiondo, E. M., and Ueyama, J. (2015). Development of a spatial decision support system for flood risk management in Brazil that combines volunteered geographic information with wireless sensor networks. Comput. Geosci. 80, 84–94. doi: 10.1016/j.cageo.2015.04.001
Jackson, E. K., Roberts, W., Nelsen, B., Williams, G. P., Nelson, E. J., and Ames, D. P. (2019). Introductory overview: error metrics for hydrologic modelling–A review of common practices and an open source library to facilitate use and adoption. Environ. Modell. Softw. 119, 32–48. doi: 10.1016/j.envsoft.2019.05.001
Krause, P., Boyle, D. P., and Bäse, F. (2005). Comparison of different efficiency criteria for hydrological model assessment. Adv. Geosci. 5, 89–97. doi: 10.5194/adgeo-5-89-2005
Kull, D., Mechler, R., and Hochrainer-Stigler, S. (2013). Probabilistic cost-benefit analysis of disaster risk management in a development context. Disasters 37, 374–400. doi: 10.1111/disa.12002
Lehner, B., Verdin, K., and Jarvis, A. (2008). New global hydrography derived from spaceborne elevation data. EOS Trans. Am. Geophys. Union 89, 93–94. doi: 10.1029/2008EO100001
Li, Z., Yang, C., Huang, Q., Liu, K., Sun, M., and Xia, J. (2017). Building model as a service to support geosciences. Comput. Environ. Urban Syst. 61, 141–152. doi: 10.1016/j.compenvurbsys.2014.06.004
Lindström, G., Pers, C., Rosberg, J., Strömqvist, J., and Arheimer, B. (2010). Development and testing of the HYPE (Hydrological Predictions for the Environment) water quality model for different spatial scales. Hydrol. Res. 41, 295–319. doi: 10.2166/nh.2010.007
Niswonger, R. G., Allander, K. K., and Jeton, A. E. (2014). Collaborative modelling and integrated decision support system analysis of a developed terminal lake basin. J. Hydrol. 517, 521–537. doi: 10.1016/j.jhydrol.2014.05.043
Rew, R., and Davis, G. (1990). NetCDF: an interface for scientific data access. IEEE Comput. Graph. Appl. 10, 76–82. doi: 10.1109/38.56302
Rodell, M., Houser, P. R., Jambor, U., Gottschalck, J., Mitchell, K., Meng, C.-J., et al. (2004). The global land data assimilation system. Bull. Am. Meteorol. Soc. 85, 381–394. doi: 10.1175/BAMS-85-3-381
Roman, D., Schade, S., Berre, A. J., Bodsberg, N. R., and Langlois, J. (2009). “Model as a service (MaaS),” in AGILE Workshop: Grid Technologies for Geospatial Applications (Hanover).
Snow, A. D., Christensen, S. D., Swain, N. R., Nelson, E. J., Ames, D. P., Jones, N. L., et al. (2016). A high-resolution national-scale hydrologic forecast system from a global ensemble land surface model. J. Am. Water Resour. Assoc. 52, 950–964. doi: 10.1111/1752-1688.12434
Souffront Alcantara, M. A., Crawley, S., Stealey, M. J., Nelson, E. J., Ames, D. P., and Jones, N. L. (2017). Open water data solutions for accessing the national water model. Open Water J. 4:3. Available online at: https://scholarsarchive.byu.edu/openwater/vol4/iss1/3
Sperna Weiland, F. C., Vrugt, J. A., van Beek, R. L., Weerts, A. H., and Bierkens, M. F. (2015). Significant uncertainty in global scale hydrological modeling from precipitation data errors. J. Hydrol. 529, 1095–1115. doi: 10.1016/j.jhydrol.2015.08.061
Svoboda, M. D., Fuchs, B. A., Poulsen, C. C., and Nothwehr, J. R. (2015). The drought risk atlas: Enhancing decision support for drought risk management in the United States. J. Hydrol. 526, 274–286. doi: 10.1016/j.jhydrol.2015.01.006
Swain, N. R., Christensen, S. D., Snow, A. D., Dolder, H., Espinoza-Dávalos, G., Goharian, E., et al. (2016). A new open source platform for lowering the barrier for environmental web app development. Environ. Modell. Softw. 85, 11–26. doi: 10.1016/j.envsoft.2016.08.003
Wan, Z., Hong, Y., Khan, S., Gourley, J., Flamig, Z., Kirschbaum, D., and Tang, G. (2014). A cloud-based global flood disaster community cyber-infrastructure: development and demonstration. Environ. Modell. Softw. 58, 86–94. doi: 10.1016/j.envsoft.2014.04.007
Wilhite, D. A., Sivakumar, M. V. K., and Pulwarty, R. (2014). Managing drought risk in a changing climate: the role of national drought policy. Weather Climate Extremes 3, 4–13. doi: 10.1016/j.wace.2014.01.002
Keywords: cyberinfrastructure, data visualization, hydroinformatics, hydrologic modeling, XaaS
Citation: Souffront Alcantara MA, Nelson EJ, Shakya K, Edwards C, Roberts W, Krewson C, Ames DP, Jones NL and Gutierrez A (2019) Hydrologic Modeling as a Service (HMaaS): A New Approach to Address Hydroinformatic Challenges in Developing Countries. Front. Environ. Sci. 7:158. doi: 10.3389/fenvs.2019.00158
Received: 31 May 2019; Accepted: 30 September 2019;
Published: 23 October 2019.
Edited by:
Ashutosh S. Limaye, National Aeronautics and Space Administration (NASA), United StatesReviewed by:
Teresa Ferreira, University of Lisbon, PortugalSharad Kumar Jain, National Institute of Hydrology (Roorkee), India
Kel Markert, University of Alabama in Huntsville, United States
Copyright © 2019 Souffront Alcantara, Nelson, Shakya, Edwards, Roberts, Krewson, Ames, Jones and Gutierrez. This is an open-access article distributed under the terms of the Creative Commons Attribution License (CC BY). The use, distribution or reproduction in other forums is permitted, provided the original author(s) and the copyright owner(s) are credited and that the original publication in this journal is cited, in accordance with accepted academic practice. No use, distribution or reproduction is permitted which does not comply with these terms.
*Correspondence: Michael A. Souffront Alcantara, bXNvdWZmcm9udEBhcXVhdmVvLmNvbQ==
 Michael A. Souffront Alcantara
 E. James Nelson
 Kiran Shakya
 Christopher Edwards
 Wade Roberts
 Corey Krewson1
 Daniel P. Ames
 Norman L. Jones