 Maximiliano Viale1*
 Emilio Bianchi2Leandro Cara1
 Lucas E. Ruiz1
 Ricardo Villalba1Pierre Pitte1
 Mariano Masiokas1
 Juan Rivera1Laura Zalazar1
- 1Instituto Argentino de Nivología, Glaciología y Ciencias Ambientales, CCT-CONICET-Mendoza, Mendoza, Argentina
- 2Universidad de Río Negro, Sede Andina, El Bolsón, Argentina
The prominent Andes cordillera induces significant differences in climates between its eastern and western slopes. These climatic differences are largely reflected by contrasting vegetation and ice coverages but remain poorly documented. This study quantifies the abrupt changes of precipitation and cloud properties at both sides of the Andes south of 20°S by using surface daily precipitation and satellite (CloudSat and MODIS) data during the 2006–2016 period. Results show that the precipitation changes drastically and precipitating clouds can be of very different nature on each side of the Andes. In the tropical Andes (20–25°S), precipitation normally falls from a sole layer of thick stratiform and convective precipitating clouds during the warm semester, but the annual mean accumulation is about 10–100 times larger on the eastern than on the western slopes. A sole layer of low stratus clouds dominates over the Pacific coast, occasionally producing light rains, whereas high, thin, and non-precipitating clouds dominate most of the time over the continent. In the subtropical Andes (25–35°S), annual mean precipitation is similar on both sides, however, it falls from convective and stratiform precipitating clouds in the warm semester on the eastern slopes, and from stratiform precipitating clouds in the cold semester, mostly as frozen particles, on the western slopes. These different features on both slopes denote a climatic transition between the tropics and extratropics. In the extratropical Andes (south of 35°S), stratiform cloud types produces precipitation on both sides during all the year, but the annual mean precipitation and cloud frequency are enhanced on the western slopes and strongly reduced on the eastern slopes of the Andes. Cloud frequencies are higher than in the subtropics and evenly distributed as single- or multi-layers of low, middle and high clouds. Frozen particles become important in precipitating clouds over the mountains and on the lee side. These findings demonstrate the significant influence of the Andes cordillera on the climate all along southwestern South America, and constitute an excellent example of how the simple dependence of climate on latitude can be substantially altered by the topography.
Introduction
The long meridional extent of the Andes profoundly alter the frontal precipitation systems of the extratropical cyclones approaching from the southern Pacific Ocean (e.g., Smith and Evans, 2007; Garreaud et al., 2013), whereas the high Andean elevations in the tropics and subtropics strongly modulate local atmospheric circulation and moisture content that trigger convective precipitation systems (e.g., Falvey and Garreaud, 2005). As a result, the climate on the western and eastern sides of the Andes shows opposite patterns regardless the latitude and the nature of dominant precipitation. Indeed, this provides a good example of how the orographic effects of a prominent north-south oriented mountain chain alters the simple dependence of climate on latitude.
In the western tropics of South America, the high mean elevation (~4,500 m) and width (~400 km) of the Andean plateau separate the extremely dry climate to the west from the rainy climate to the east. Permanent subsidence, i.e., descending dry air from high to low levels associated with the southeast Pacific subtropical anticyclone, prevent the coastal western side of the plateau from rain and humidity (Takahashi and Battisti, 2007a,b; Reboita et al., 2010). In contrast, warm and humid air, transported to the eastern slopes of the Andes by synoptic eastern and diurnal mountain winds, prevails over the eastern foothills of the plateau. The orographic lifting of these winds triggers, along with the synoptic lifting from mid-level low pressure or equatorward fronts, abundant convective precipitations on the eastern slope of the Andes (e.g., Vuille, 1999; Espinoza et al., 2015). South of 35°S in the extratropics, the prevailing westerlies from the Pacific and their associated frontal precipitation systems are deprived of moisture when passing over the relatively narrow (< 150 km) and low (~1,500 m) Andes, raining over the western slopes and drying over the eastern slopes (e.g., Miller, 1976; Garreaud et al., 2013; Bianchi et al., 2016; Viale et al., 2018). In the transition (25–35°S) between the tropics and the extratropics, climate in the Andes resembles that of the extratropics with wintertime precipitation falling mostly on the western slopes (e.g., Falvey and Garreaud, 2007; Viale and Nuñez, 2011), and that of the tropics with summer precipitation falling mostly on the eastern slopes (e.g., Viale and Garreaud, 2014).
The interactions between the atmospheric circulation and the Andes topography lead to important differences in climates at each side of the range. The north-south orientation of the Andes, perpendicular to both prevailing subtropical and extratropical winds, introduces marked climatic variations that remain poorly quantified. For instance, dense rainforests on the eastern flank of the tropical Andean plateau contrast with extreme desert conditions on its western flank. On the other hand, rainy forests in the Chilean slopes of the Patagonian Andes contrast with the Argentinean dry slopes and the Patagonian steppe. Despite these marked differences in vegetation induced by marked gradients in climate, a thorough assessment of the cross-barrier variations in precipitation and cloudiness has not been conducted yet. The lack of ground-based observations along the complex, inaccessible terrain of the Andes range has precluded for several decades significant advances in the knowledge of the interactions between atmospheric circulations, precipitation systems and topography. In addition, some questions dealing with the western extent of the easterly rain over the Andean plateau or the change of the cross-barrier gradient of mean precipitation still remain open.
Limited details of cross-barrier variations in precipitation and cloud properties in the Andes can be found in pioneering climatological studies covering Argentina, Chile, and South America (Hoffman, 1975; Miller, 1976; Prohaska, 1976; Ereño and Hoffman, 1978). More recent observational studies were limited to a portion of the subtropical Andes, between 30 and 36°S latitude (Masiokas et al., 2006; Viale and Nuñez, 2011; Viale and Garreaud, 2014), and to the windward Andean slopes (i.e., the Chilean side, Falvey and Garreaud, 2007; Viale and Garreaud, 2015). Specifically, we expect to gain an integral understanding of the orographic effect of the Andes on the climate of southern South America by performing detailed analyses along a long range of the Andes (20–55°S) and across the entire mountain chain. The objective of this study is to quantify the variations of precipitation, cloudiness, and cloud properties in cross-barrier direction of the Andes, from subtropical latitudes (20°S) to the southern tip (55°S) of the South American continent. Variations in these climatic variables strongly control water resources and insolation across the Andes. The use of increasingly available surface precipitation data in the region, and multiyear measurements of cloudiness and cloud properties from the MODIS and CloudSat polar-orbiting satellites over remote areas in the mountain and the adjacent Pacific Ocean, allows us to address this goal.
Data and Methods
Surface Data
Daily precipitation (accumulations at 1200 UTC = 0900 LT) datasets managed by national agencies in Argentina (Secretaría de Infraestructura y Política Hídrica), and Servicio Meteorológico Nacional, SMN) and Chile (Dirección General de Aguas, DGA, and Dirección Meteorológica de Chile, DMC) were used in this study. A total of 733 stations with < 10% of missing values covering the 2006–2016 period of record were retained for our analyses. Figure 1A shows the location of the precipitation stations in southwestern South America superimposed on a topographic map of the Andes. Due to the inaccessibility and remoteness of the mountain range, most stations are located in low-elevation areas adjacent to the Andes. Few stations are located south of 45°S along the western slope of the Andes and on the high elevations in the subtropical Andes, where most stations record snow accumulation. Most stations have rain gauges that collect rainfall, whereas a small number of stations have snow pillow sensors that record automatically daily snow water equivalent. Surface stations are colored in Figure 1 according to their locations with respect to the crest of the Andes. As we show later, cross-barrier zones are defined based on topographic elevations (Figures 1B,C) and used to group surface and satellite data. Thus, different colored stations refer to different cross-barrier zones (i.e., upstream, upslope, downslope, and lee zones). Since most surface stations are located along mountain passes following river valleys within the mountain chain, the elevation of surface stations is usually lower than the mean altitude of the surrounding peaks (Figures 1B,C).
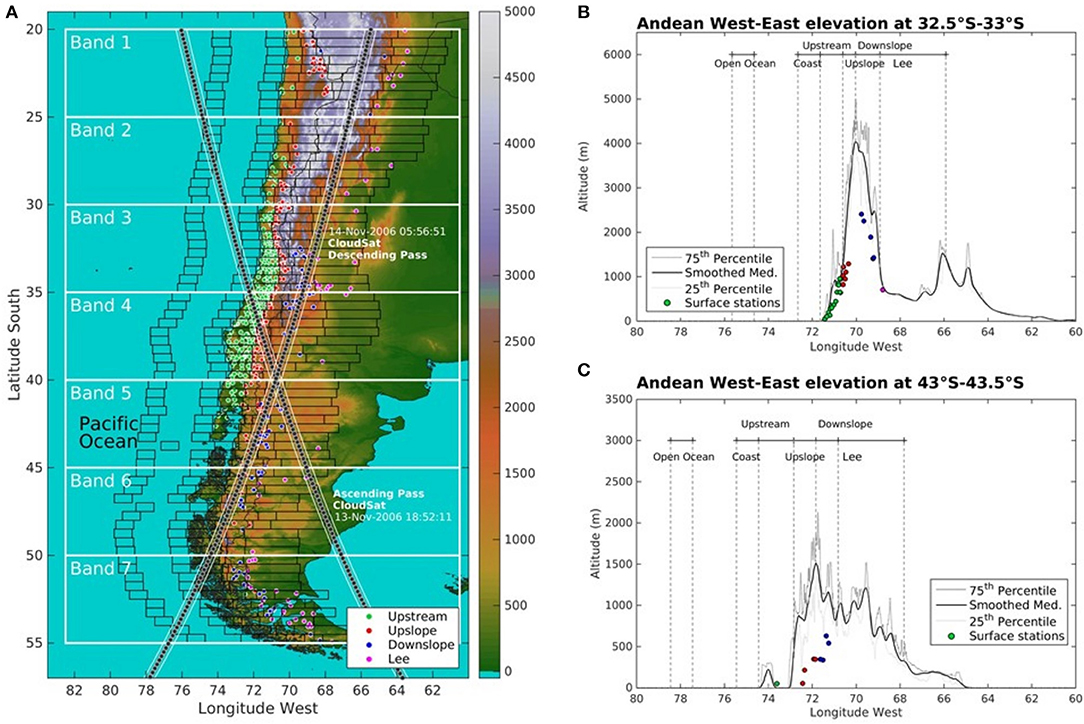
Figure 1. (A) Map showing the study region in southwestern South America with the location of daily surface precipitation sensors represented by circles colored according to its location with respect to the Andes crest. A color-coded topographic map is included with the Argentina-Chile border that represents approximately the crestline of the Andes. Two swaths of the polar-orbiting CloudSat satellite are plotted to illustrate the methodology for grouping the datasets. (B,C) Two meridionally averaged west-east cross sections of the Andes altitude (black line) and its 25th and 75th percentile altitudes (light and dark gray lines) are presented for the 33–33.5°S and the 43–43.5°S latitudinal bands, representative of the subtropical and extratropical Andes, respectively. A total of 70 cross sections shown in (A) and calculated within 0.5°-width rectangles are used to define cross-barrier zones for grouping meridionally the surface and satellite data. The white rectangles represent the 5°-width latitudinal bands used for grouping latitudinally vertical profiles from the CloudSat dataset (see details in the text). Surface precipitation gauges are plotted with green, red, blue, and magenta circles that represent its location in upstream, upslope, downslope, and lee cross-barrier zones, respectively.
Satellite Data
To characterize cloudiness and cloud properties over the Andes and its adjacent areas, we used Moderate Resolution Imaging Spectroradiometer (MODIS) and CloudSat satellite data. Both satellite datasets were analyzed over the southwest coast of South America during the 2006–2016 period, which overlaps the period of surface precipitation data. The satellite data cover the entire mountain range, allowing a fair comparison between the clouds systems upwind and downwind of the Andes. MODIS instruments are on board of the Aqua and Terra satellites, while a Cloud Profiling Radar sensor (CPR, Im et al., 2005) is on board of CloudSat satellite. These three polar-orbiting satellites pass twice a day over the Andes with tight formation in NASA's A-Train constellation (Stephens et al., 2002). Specifically, the binary cloud-flag included in the fractional snow cover field of the Snow Cover Daily L3 Global Grid V6 product (MOD10A1 and MYD10A1) were used, which informs on the presence of clouds on 500 m x 500 m grid by combining visible and infrared reflectance (Hall and Salomonson, 2006; Hall et al., 2006). This binary cloud-flag is available in daytime since 2000 (2002 for Aqua) at about 1500 UTC (1200 LST) and 1900 UTC (1600 LST) for the Terra and Aqua satellites, respectively, at the National Snow and Ice Data Center website (http://nsidc.org/). The cloud-flag metric used here has been processed by Cara et al. (2016) only over land areas for snow cover exploration.
Unlike traditional weather radars, the W-band (94 Ghz) radar aboard of the CloudSat satellite is sensitive to cloud and light precipitation rather than moderate and heavy precipitation particles (Im et al., 2005). After a battery failure of the CloudSat spacecraft in April 2011, CloudSat retrieves data only in the sunlight portion of the orbit, which correspond to about 1900 UTC in the Andes. The retrieval of each orbit or granule is saved in one file and has approximately 37,088 profiles. Their horizontal resolution is 1.7 km in cross-track direction by 1.3 km in along-track direction, and 125 vertical bins of reflectivity factor with 240 m gate spacing from the surface to near 30 km height. As an example, we show in Figure 1A two passes of the CloudSat satellite. The organization in space of the data is explained in the next subsection. For the purposes of this study, rainy and non-rainy profiles from the 2B-CLDCLASS (Sassen and Wang, 2008) and the 2C-PRECIP-COLUMN (Haynes et al., 2009) products from the most recent version 5 were analyzed. A rainy profile was identified by using the precipitation flags with high confidence level. Insights of the macro-physical properties of precipitating and non-precipitating clouds were gained by analyzing the cloud types, layers, cloud-depths, as well as the liquid content. In particular, valuable inferences of climate were retrieved by looking at main cloud types, recognized by the World Metorological Organization, and estimated by the 2B-CLDCLASS algorithm. The algorithm estimates eight main cloud types: Cirrus (Ci), AltoStratus (As), AltoCumulus (Ac), Stratus (St), StratusCumulus (Sc), Cumulus (Cu), NimboStratus (Ns), and Deep Convection (DC). Since CPR radar sensitivity detects clouds rather than precipitation, the near-surface signal can be largely attenuated under a heavy rainy situation or over complex terrain due to the absorption or multi-scattering by large hydrometeors and/or surface clutter contamination (Mace et al., 2007; Marchand et al., 2008). In fact, the level of attenuation is used as a source of information to estimate rainfall on surface but only over the oceans (Haynes et al., 2009).
Grouping Observational Data in Cross-Barrier Zones and Latitudinal Bands
The methodology used to group the observational data for examining the Andes influence on precipitation and clouds is the same applied by Viale and Garreaud (2015) to the upwind sector (Chilean side) of the Andes between 30 and 55°S. Here, we extended the coverage northward until 20°S and eastward over the whole downwind Argentinean portion. To this effect, we considered a series of zonal transects extending from the Pacific Ocean to the lee side of the Andes. The transects have a width of 0.5° of latitude, covering from 20 to 55°S with no overlap (Figure 1A). For each transect, we defined a mean zonal elevation profile across the Andes based on the meridional mean from the GTOPO (30 s) DEM and determined the longitude and altitude of the Andean crest (highest point). We then subdivided each transect in six cross-barrier zones starting from the crest of the Andes to the west: upslope, upstream, coastal and open ocean, and to the east: downslope and lee zones (Figures 1B,C). The up- and down-slopes zones extend from the crest to the western and eastern foothills, respectively, defined as the point with an elevation equal to a quarter of the crest elevation within each transect. The upstream and the lee zones extend from the western and eastern foothills to the Pacific coastline (identified by the mean transect height equal to zero), and to 300 km eastward in the Argentinean lowlands, respectively. Most of the Chilean and Argentinean surface stations are located in these low elevation zones. Finally, we defined the coastal and open ocean zones as the parts of the transect extending westward from the coastline to 100 km and from 300 to 400 km offshore, respectively.
Surface and satellite-based data were grouped according to their cross-barrier and latitudinal locations, using the six zones previously defined. Note that this grouping does not consider the actual elevation of the station nor the satellite footprint but rather the 0.5° meridionally averaged topographic profile. Previous studies have pointed out that the relationships between precipitation and altitude improves when considering the surrounding elevation instead the specific elevation of the station (e.g., Rasmussen and Tangborn, 1976; Frei and Schär, 1998; Falvey and Garreaud, 2007).
To ensure a good sample size that provides robust statistics of the satellite profiles, we grouped the 0.5° latitude transects in seven latitudinal bands of 5° each (i.e., in the area enclosed by white rectangles in Figure 1A). Over the period 2006–2016, the number of satellites passes (profiles) available for each zone ranged from 400 (105) on the Pacific Ocean to 1,500 (3.5 105) on the leeside of the Andes (Figure 2). It should be noted that differences in the number of satellite profiles arise partially from the slightly different meridional widths of the cross-barrier zones. However, the total number of profiles to estimate cloud features is large in the final 5° width latitudinal bands (Figure 2).
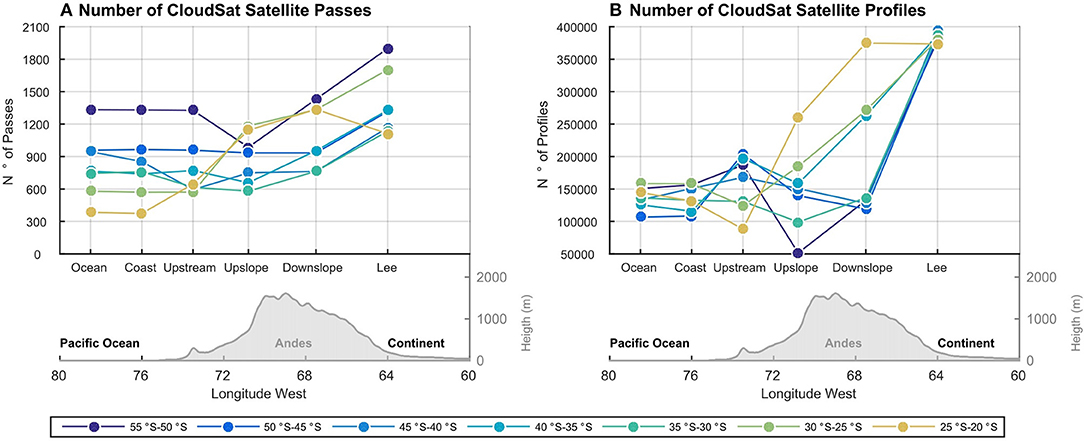
Figure 2. Number of CloudSat satellite (A) passes and (B) pixels over different cross-barrier zones (displayed in x-axes) and different 5°-width latitudinal bands (i.e., color coded) during the period 2006–2016. The meridional-averaged cross-sections of the Andes elevations between 20 and 55°S are plotted below each panel for reference. See Figure 1A for two swaths of the CloudSat satellite passing over the studied region.
Contrasting Precipitation Amounts and Regimes Across the Andes as Seen by Surface Data
Let us begin describing the cross-barrier variations in precipitation, considering daily surface data for two key variables, the annual mean precipitation (Rm) and the contribution of cold semester (Apr-Sep) to the annual total precipitation (Wm in %). Wm provides a measure of the precipitation seasonality along the year. Figures 3, 4 show 2° latitude-width transects of Rm and Wm across the subtropical (20–34°S) and extratropical (34–55°S) Andes, respectively, while Table 1 show the areal mean of Rm values in each transect. Note that for most of the transects in the subtropics there is a scarcity of stations in the interior of the barrier, a limitation that persists in surface data and was partially solved by using satellite data.
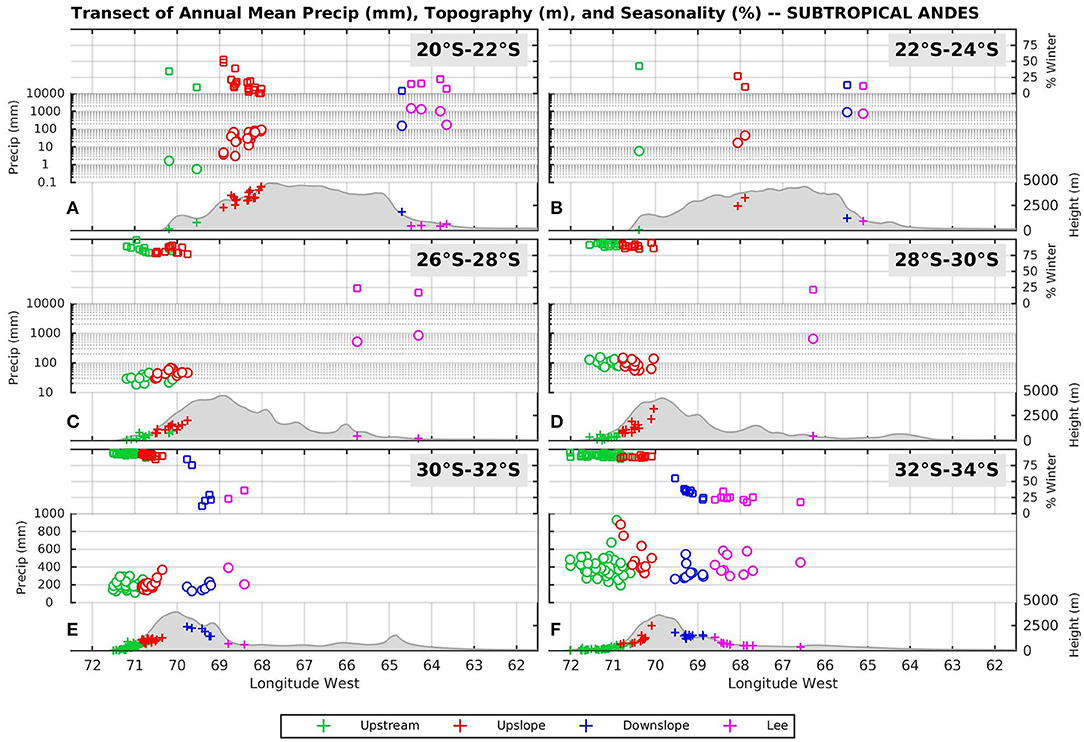
Figure 3. Transects of annual precipitation (mm in the middle subpanel) and percentage of cold-semester (AMJJAS) precipitation to the annual total in the top subpanels, recorded by surface precipitation gauges across the subtropical Andes over the period 2006–2016. Each transect is plotted within a 2° width latitudinal band according to the data availability: (A) 20–22°S, (B) 22–24°S, (C) 26–28°S, (D) 28–30°S, (E) 30–32°S, and (F) 32–34°S. The mean cross-barrier altitude of the Andes and the elevation of surface sensors are plotted in each transect (at the inferior part of each subpanel). The different colors correspond to different cross-barrier zones where precipitation sensors are located (see legend below and section Data and Methods for details).
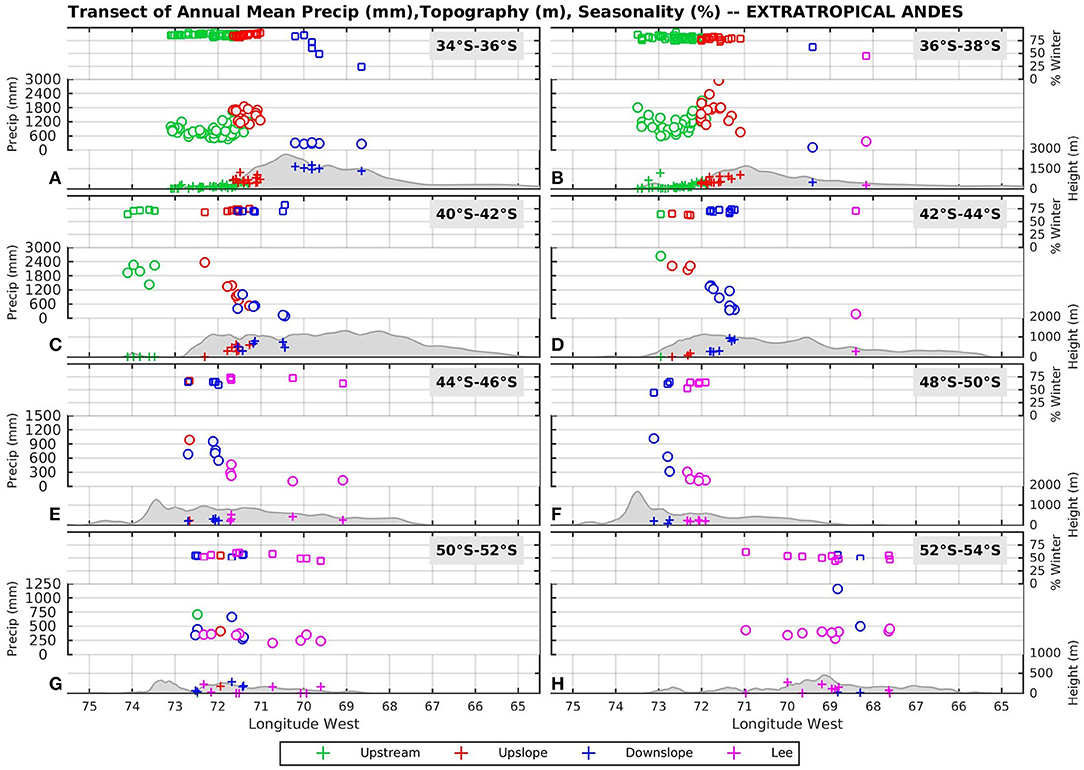
Figure 4. Same as Figure 3 but for the extratropical Andes. Again, each transect is plotted within a 2° width latitudinal band according to the data availability: (A) 34–36°S, (B) 36–38°S, (C) 40–42°S, (D) 42–44°S, (E) 44–46°S, (F) 48–50°S, (G) 50–52°S, and (H) 52–54°S.
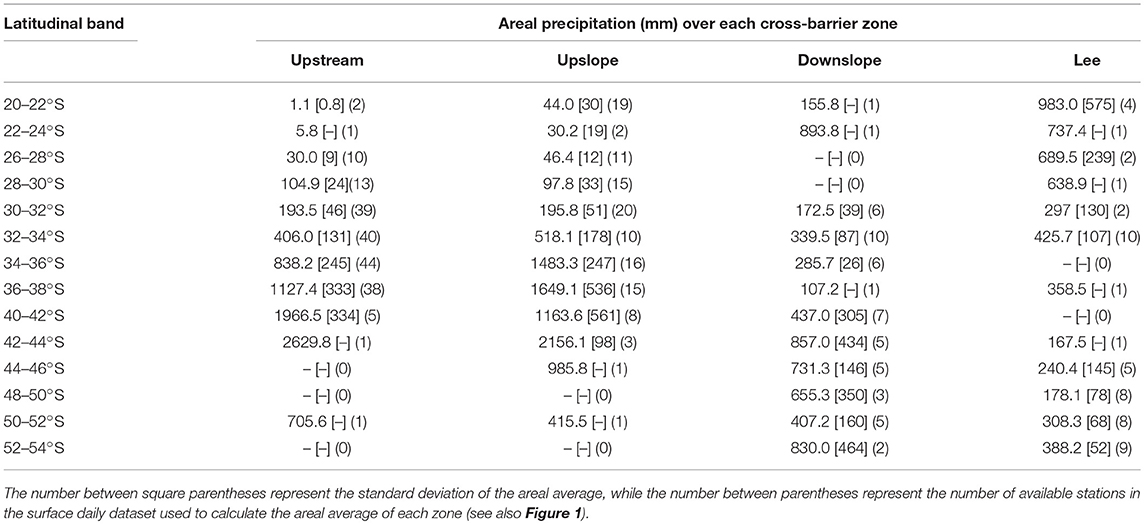
Table 1. Areal average of annual mean precipitation for the different cross-barrier zones and latitudinal bands shown in Figures 3, 4.
On the southernmost part of the Andean plateau (Figures 3A,B), the differences in Rm on each side are significant, with values ranging from only 1–10 mm per year on the extreme desert areas in northern Chile to >1,000 mm per year on the forests in the eastern foothills. We used a logarithmic y-scale to distinguish these large differences. The Wm metrics indicate that precipitation fall mostly during the warm semester on both sides of the plateau, except for a limited number of stations in the upstream sector (Chilean side) with nearly 50% of Wm; however, their Rm values are extremely low. Figures 3A,B show also that Rm over the upslope sector are slightly higher than those over the upstream sector, indicating that summer convective precipitation systems reach up to the western margin of the plateau but with a diminished intensity and/or reduced frequency. This is likely caused by the long distance to the moisture sources, the Amazon and the Atlantic Ocean, and by the proximity to the permanent subsidence from the southeast Pacific anticyclonic circulation.
In the transects between 26 and 34°S (Figures 3C,D), there is a gradual reduction of the differences in Rm values between both sides of the Andes, but an increase of the differences in Wm with a dominance of the cold-semester precipitation in the Chilean side and the opposite in the Argentinean side. This climatic feature in the subtropics denotes a transitional behavior between the climates in the tropics and extratropics, gradually decreasing the signal of the summer monsoon systems to the east the Andes, and increasing the influence of the midlatitude precipitation systems in winter to the west of the Andes.
In the transects between 34 and 38°S (Figures 4A,B), the Rm gradient reverses and shows larger values on the western than on the eastern side (this is also evident in Table 1). However, the dominance of cold-semester precipitation remains on the western side, while the warm-semester precipitation diminishes on the eastern side according to the Wm values. These two well-sampled transects show a well-defined orographic enhancement of midlatitude precipitation systems. Rm values are relatively larger on the upslope than on the upstream zones, followed by a marked reduction in Rm on the downslope zones (Figures 4A,B and Table 1). The orographic influence on precipitation in this part of the Andes has been already documented by Falvey and Garreaud (2007), Viale and Nuñez (2011), and Viale and Garreaud (2015).
Between 40 and 50°S (Figures 4C–F and Table 1), the extratropical precipitation systems prevail but the orographic enhancement of precipitation on upslope zones is not as evident as in the subtropics, likely due to the limited sampling of Rm. Nevertheless, large Rm values on both upstream and upslope zones contrast with low Rm values on the downslope and lee zones. A strong orographic enhancement of precipitation is suggested around the Patagonian icefields (46–50°S) by a few stations located just east of the crest of the icefields in the downslope zone (Figure 4F). This is in line with previous modeling studies for the region (Lenaerts et al., 2014; Schaefer et al., 2015). Farther to the south, precipitation is gradually more evenly distributed along the year as indicated by Wm values on both the western and eastern sides of the Andes (Figures 4C–F), which indicates that mid-latitude precipitation systems pass all year round over this Andean sector.
The methodology for grouping the surface station in cross-barrier zones does not work properly in the southern tip of the continent (Figures 4G–H) due to the lower elevation of the Andes and the change in mountain orientation from a north-south to a northeast-southwest direction. Indeed, Figure 4G shows a mix of stations from the upstream, downslope and lee zones in a short west-east distance. As a result, there are not major changes in Rm values in west-east direction, and the most noticeable feature here is the evenly distribution of precipitation throughout the year regardless the location of the stations.
Contrasting Cloudiness and Cloud Properties Across the Andes as Seen By Satellite Data
In this section, we focus on cross-barrier variations in cloudiness and cloud properties using the multi-year satellite data that covers entirely the Andes Cordillera. By quantifying the cross-barrier variations of cloudiness, cloud types and properties, including precipitating clouds, we expect to improve our understanding of orographic effects on both Andean slopes.
Cloudiness
Figures 5, 6 show large differences in cloudiness along the Andes barrier direction, ranging from < 30% over the subtropical to more than 60% over the extratropical Andes. The frequent cloudy skies over the extratropical Andes are composed of several cloud layers, which are not common in the subtropical Andes (Figure 5).
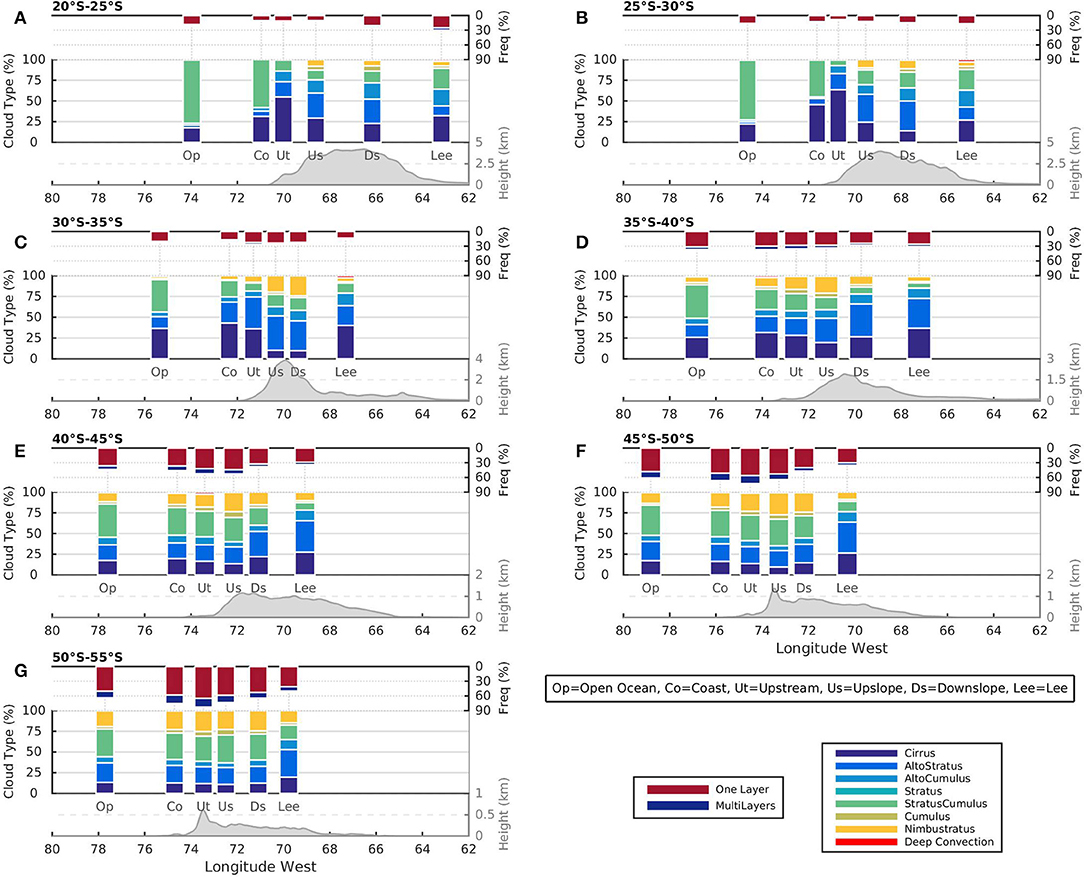
Figure 5. Frequencies (%) of cloudy profiles (top panels) and percentages of cloud types (%, middle panels) observed by the CloudSat satellite during the 2006–2016 period over different cross-barrier zones (open ocean, coast, upstream, upslope, downslope, and lee) and for different latitudinal bands: (A) 20–25°S, (B) 25–30°S, (C) 30–35°S, (D) 35–40°S, (E) 40–45°S, (F) 45–50°S, (G) 50–55°S. The mean cross-barrier altitude of the Andes is plotted in each transect for reference. The CloudSat 2B-CLOUDCLASS product is used which discriminates between one and multilayers in the cloudy profile and between 8 main cloud types: Cirrus, Altostratus, Altocumulus, Stratus, Stratucumulus, Cumulus, Nimbustratus, and Deep Convection.
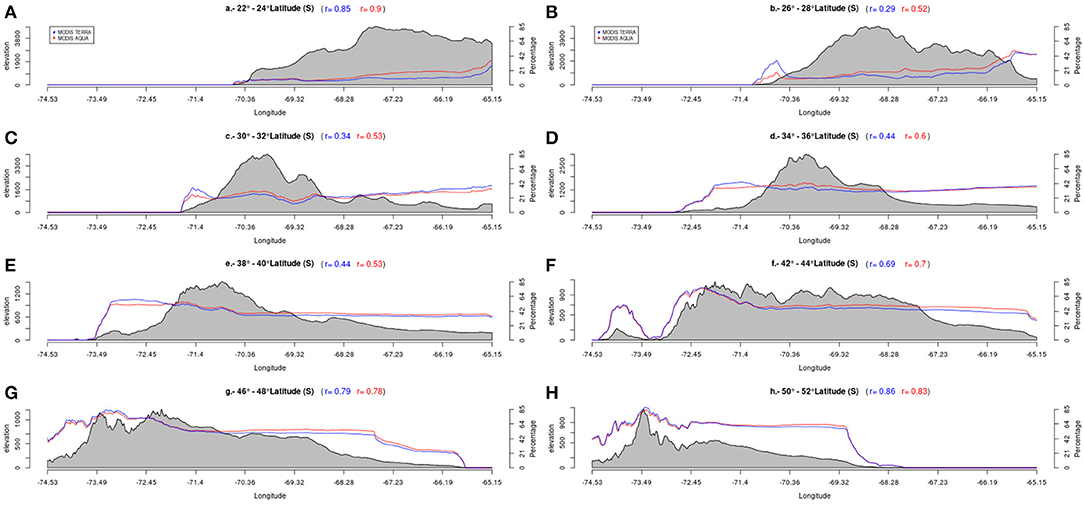
Figure 6. Cross-barrier plots of the meridionally averaged altitude of the Andes (shaded) and cloud fractions (lines) between (A) 22–24°S, (B) 26–28°S, (C) 30–32°S, (D) 34–36°S, (E) 38–40°S, (F) 42–44°S, (G) 46–48°S, and (H) 50–52°S. Cloud fraction is calculated using the MODIS product from onboard of polar-orbiting Terra (blue line) and Aqua (red line) satellites. Terra satellite overpass South America around 1500 UTC (1200 LT, noon time), while Aqua overpass around 1800 UTC (1600 LT afternoon time). The correlation coefficients between the topographic profile and the cloud fraction are also shown in blue and red for those derived Terra and Aqua times, respectively.
Despite the low cloud frequency over and around the Andean Plateau, a great contrast in cloud types exists on both sides of the Altiplano (Figures 5A,B). Low Sc are almost the only cloud type observed over the Pacific Ocean, except for some sporadic high Ci; whereas high Ci, As, and Ac are the most frequent cloud types observed over the continental subtropics. Specifically, over the upstream sector of the Plateau (Figures 5A,B), these three high and thin clouds (Ci, As, and Ac) are observed almost exclusively (>90%), since this extremely desert sector is limited from moisture sources by the Andes to the west, the dry continental soil below and the permanent subsidence aloft. We infer that these high clouds may be originated outside this sector and move into it at high altitudes, except for some sporadic low Sc that could penetrate into the continent from the coast. In the skies of the upslope, downslope and lee sectors of the Plateau (Figures 5A,B), these high and thin clouds (Ci, As, Ac) are still dominant but thicker clouds (Ns, Cu, DC, and Sc) are gradually most frequent as the moisture sources and precipitation increases eastward. It should be noted here that thicker clouds are more likely to produce precipitation on the surface.
Across the Andes between 30 and 35°S (Figure 5C), the frequency of total and thicker clouds decreases on the lee and increases over and west of the mountains (upstream, upslope, and downslope sectors) in comparison with their counterparts farther north. Over the Pacific Ocean, the dominance of the low Sc clouds still persists, although more high cloud types are observed.
Similar to the precipitation behavior south of 35°S (Figures 5D–G), the gradient of cloud frequency reverses, with the west side of the Andes being approximately twice as cloudy as the east side. Frequencies of total cloudiness and thicker cloud types (Ns, Cu, and Sc) on the upslope, upstream and coastal sectors are also higher than those over the open Ocean (Figures 5D–G), denoting an orographic enhancement of cloudiness within the Westerlies. In contrast, the frequencies of thick cloud types are the lowest (< 30%), while the frequency of the high and thin cloud types are the highest (>60%) over the lee sectors compared with the rest of cross-barrier sectors, denoting an orographic reduction of cloudiness. In the extratropics, the low Sc clouds are still the most frequent type observed over the Pacific Ocean, and even over the upwind sectors, but more diversity of cloud types exists in this sector than in their Oceanic counterparts in the subtropics.
Cross-barrier variations of cloud fraction derived from MODIS are depicted in Figure 6. The high correlation between cloud fractions and topographic lines, especially in the extratropical transects, highlight the strong control of the topography on cloudiness. Note that the cloud fraction lines follow closely the coastal topography and the succession of peaks and inner valleys within the extratropical Andes (Figures 6F,G). In the subtropical transects (Figures 6A–C), cloud fractions are higher during the morning passes of the Terra satellite close to Pacific coast, and are associated with low maritime Sc which tend to disappear in the afternoon. Conversely, cloud fractions are higher in the afternoon over the subtropical Andes (Figures 6A–D) and over the Patagonian plateau (Figures 6E–H). These sub-daily differences in cloud fractions are partially due to the diurnal cycle, which is forced by the solar radiation. This forcing naturally reduces poleward in the extratropics, i.e., indicated by lower sub-daily differences between cloud fractions and correlations of different daytimes. For example, higher correlations in the afternoon than in the morning within the subtropical Andes may be caused by thermally-driven mountain winds (Whiteman, 2000) ascending through mountain slopes and producing clouds (c.f. Figure 3 of Viale and Garreaud, 2014). In contrast, the minimal differences in the correlations of different daytimes in the extratropic denote that synoptic forcings may dominate there.
Precipitating Cloud Properties
Figure 7 highlights that a minimal fraction of cloudy profiles produce precipitation in the subtropics, whereas this fraction gradually increases in the extratropics. In line with previous analysis, the frequency of precipitating and non-precipitating profiles is nearly twice as high on eastern sides of the Andean plateau as on its western sides (Figures 7A,B), except over the open ocean where there is high frequency of low Sc. To the south of the Andean plateau (Figures 7C,D), the gradient of both frequencies reverse, being higher on the western than on the eastern side of the subtropical Andes. Additionally, the frequency of precipitating profiles may be twice as high on upstream and upslope zones as on the coast and open ocean zones, while it may be three to four times higher on upstream and upslope zones than on the downslope and lee zones. This denotes a strong orographic enhancement on the upslope zones, and a prominent rain shadow effect on the Patagonian steppe.
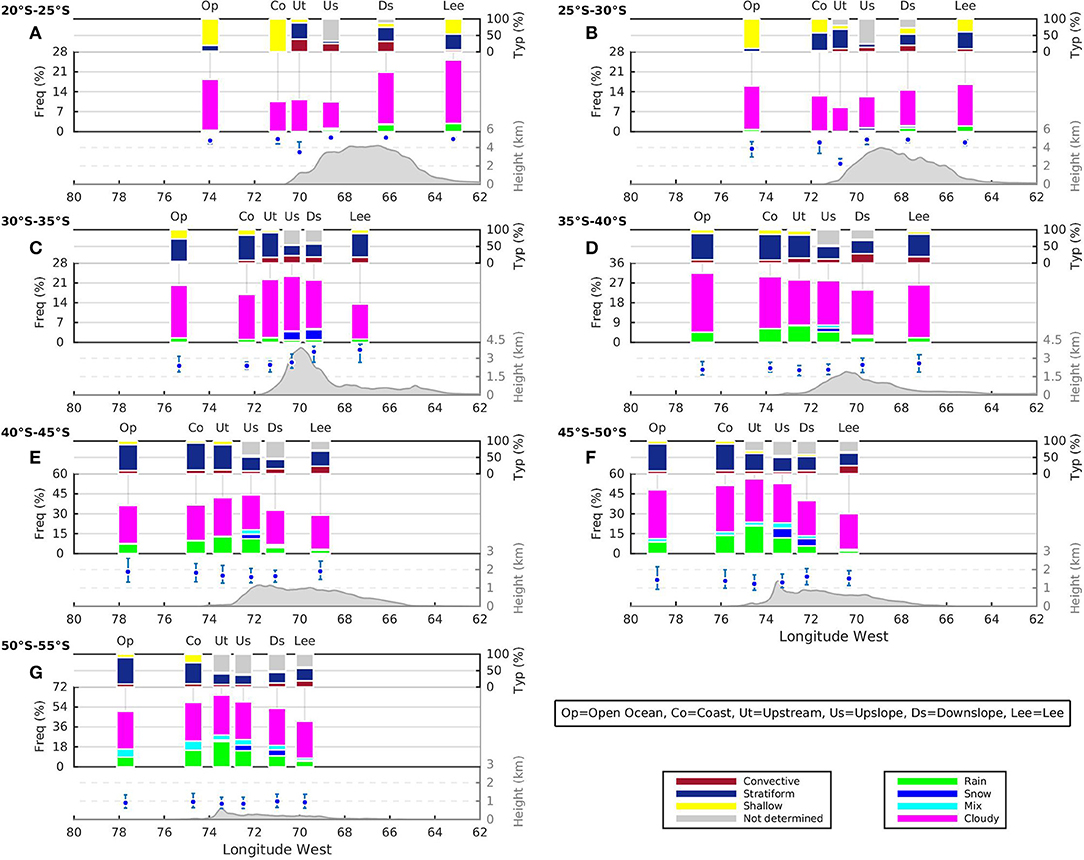
Figure 7. Frequencies (%) of precipitation type (top panels) and precipitating profiles (middle panels), and the elevation of the freezing level (median and interquartile values) in precipitating profiles observed by the CloudSat satellite over the 2006–2016 period in different cross-barrier zones (open ocean, coast, upstream, upslope, downslope, and lee) and for different latitudinal bands: (A) 20–25°S, (B) 25–30°S, (C) 30–35°S, (D) 35–40°S, (E) 40–45°S, (F) 45–50°S, (G) 50–55°S. The mean cross-barrier altitude of the Andes is plotted in each transect for reference. Note that the y-axis changes the scale in different panels to highlight variations in cross-barrier directions. CloudSat 2C-PRECIP-COLUMN product is used which discriminate between snow, liquid, and mixed phases of precipitating profile, as well as between different type of precipitation (convective, stratiform, and shallow).
CloudSat retrievals also discriminate between solid and liquid precipitation, and between different types of precipitation (convective, stratiform and shallow). Solid precipitation (snow and mixed) is largely predominant over the high Andes between 30 and 35°S (Figure 7C), and occurs about half of the time over the highest part of the Patagonian Andes, where extensive icefields are located (Figure 7F). Not surprisingly, solid precipitation has a minimal incidence over the low Patagonian Andes (Figures 7D,E,G). Regarding the precipitation types, stratiform precipitation dominates south of the Andean Plateau (Figures 7C–G), while convective precipitation has minor incidence but gradually more frequency on the mountains to the east side. Curiously, convective precipitation is not the dominant precipitation type on eastern sides of the Andean Plateau (Figures 7A,B), although this has the highest percentage for the whole Andean region analyzed here. This low percentage of convective precipitation around the Andean Plateau may be related to the small twice-daily footprints of the CloudSat CPR, which in many occasions may not overpass just over the small convective precipitation core that evolve rapidly from convective to stratiform precipitation (i.e., the nature of ordinary convection in the subtropical Andes, e.g., Romatschke and Houze, 2013; Rasmussen et al., 2016). In addition, the retrieval of precipitation type by the CPR measurements became difficult over the complex terrain (see % of not determined values).
Figure 7 also presents the freezing levels during precipitating profiles, which are interpolated from the ECMWF model to the CPR footprints (i.e., the CloudSat ECMWF-AUX product). Freezing levels are much higher in precipitating profiles downwind of the Andes north of 40°S than in their counterparts upwind of the Andes (Figures 7A–D). This is likely due to warmer environments during summertime monsoon precipitation systems than during wintertime frontal precipitation systems. In frontal precipitation systems, a lowering of the freezing level is observed from the Pacific Ocean to the upslope sector, which has been linked with pseudo adiabatic cooling produced by orographic lifting and with the latent cooling from the melting of orographically enhanced frozen precipitation (Minder et al., 2011; Minder and Kingsmill, 2013). Indeed, Figure 8 indicates that frozen particles precipitating on the surface as liquid or solid particles play an important role over the mountains and the lee of the southern Andes, but not over the Pacific Ocean. This interpretation arises from the analysis of the total mass fraction of liquid water contained in surface precipitation (Figure 8, top panels), whose values are one over most of the open ocean, coastal and upstream zones, but reduce to zero in some upslope and downslope zones.
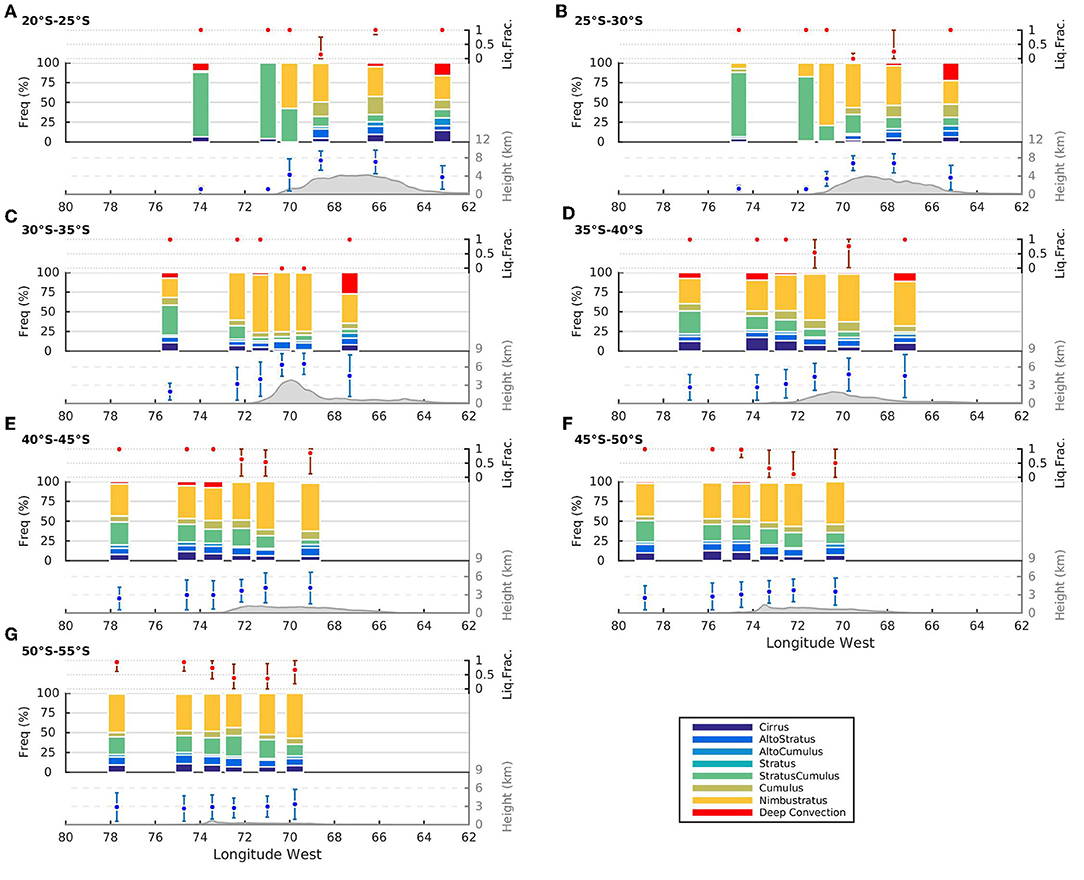
Figure 8. Total mass fraction of liquid water contained in surface precipitation (median and interquartile values in the top panels), percentage of cloud types (%, middle panels), and mean elevation of cloud deck and cloud depth (bottom panels) during precipitating profiles observed by the CloudSat satellite over the 2006–2016 period in different cross-barrier zones (open ocean, coast, upstream, upslope, downslope, and lee) and for different latitudinal bands: (A) 20–25°S, (B) 25–30°S, (C) 30–35°S, (D) 35–40°S, (E) 40–45°S, (F) 45–50°S, (G) 50–55°S. The mean cross-barrier altitude of the Andes is plotted in each transect for reference. Note that the y-axis changes the scale in different panels to highlight variations in cross-barrier directions. CloudSat 2B-CLOUDCLASS and 2C-PRECIP-COLUMN products are used.
The cloud types for precipitating profiles are presented in Figure 8, together with the cloud depth and the mean elevations of the lowest rainy cloud layers. Moderately deep (6–8 km) Ns clouds dominate everywhere producing precipitation, except for thin (< 1 km) Sc clouds that dominate and produces light rain over the subtropical Pacific Ocean (e.g., Hayden and Liu, 2018). Deep (>8 km) DC clouds also produce rain on the lee of the subtropical Andes while low and thin (< 1 km) Sc clouds over the extratropical Pacific Ocean (Figures 8A–C). The dominance of Ns cloud producing precipitation is coherent with the dominance of stratiform precipitation type shown in Figure 7. Rainy Ns clouds increase their relative frequencies and depths from the ocean to the mountains, except over the high Andes where cloud depth is limited by the elevated terrain. In contrast, rainy Sc clouds decreases their relative frequencies from the ocean to the mountains. The minimal presence of high, thin, and non-precipitating clouds (Ci, Ac, As) may be interpreted as several cloud layers coexisting when precipitation is occurring on the surface.
Discussion and Conclusion
This paper provides an up-to-date, detailed analysis of the contrasting climatic patterns on the western and eastern sides of the Andes south of 20°S by quantifying the cross-barrier variation in precipitation and cloud properties. Surface daily precipitation and satellite data over the 2006–2016 period were first grouped in transects, according to their latitude and location in relation to the crest of the Andes, and then used to explore the orographic effects on typical precipitation systems occurring in the tropics and extratropics. The polar-orbiting satellite data used here (CloudSata and MODIS) have the limitation of discontinuous measurements, which is partially solved by using a multiyear period (2006–2016) that includes hundreds to thousands passes over the Andes. The large number of observations consisting of one to two high-resolution profiles available per day allowed us to characterize main climatic differences in cloud properties in each sides of the Andes. Overall, the results of surface and satellite data indicate that the amount of annual precipitation is immensely dissimilar and that the nature of precipitating clouds is very different on each side of the southern sector of the Andean Altiplano (20–25°S), while south of 25°S, precipitating clouds are orographically enhanced on the western and strongly reduced on the eastern side of Andes.
The main features of precipitation and clouds are schematically synthesized in Figure 9 using cross-barrier sections at representative latitude bands showing distinctive climatic patterns. Across the southern sector of the Altiplano (20–25°S, Figure 9A), precipitation is concentrated in the warm semester, but annual mean precipitation is ~10–100 times lower on its western side than on its eastern side. This explains the contrasting landscapes on both sides of the elevated Altiplano. This drastic reduction of precipitation amounts can be partly attributed to the low frequency of precipitating clouds on the western slopes compared to that on the eastern slopes and on the lee side of the Altiplano. This reduction of precipitation intensity toward the western slopes has been documented in several studies (e.g., Espinoza et al., 2015; Junquas et al., 2018). Low Sc clouds dominate over the Pacific Ocean and high, thin, and non-precipitating clouds (Ci, As, Ac) dominate most of the time over the continent, whereas sporadic, thicker precipitating clouds (Ns, Cu, DC) increase in frequency from the western slopes to the east as the distance to moisture sources decreases. In this elevated Plateau, cloudy skies are usually composed by a cloud layer, and a minimal fraction of cloudy profiles produce precipitation on the surface. Thin low Sc are the predominant clouds producing light stratiform or shallow rain over the ocean, while moderate deep Ns and deep DC clouds produce stratiform and convective precipitation, respectively, over the plateau and the lee side. Frozen particles represent a minimal fraction of total precipitation over the mountains, but reach the surface mostly as rain. Permanent subsidence associated with the southeast Pacific subtropical anticyclone prevent strongly the occurrence of rain, humidity and midlevel clouds on the western flank of the Altiplano (Takahashi and Battisti, 2007a,b). In contrast, warm, humid and unstable continental air transported in summer to the eastern slopes of the Altiplano by synoptic eastern and diurnal mountain winds, favors the developing of frequent convective precipitation in this sector (e.g., Garreaud, 1999; Falvey and Garreaud, 2005)
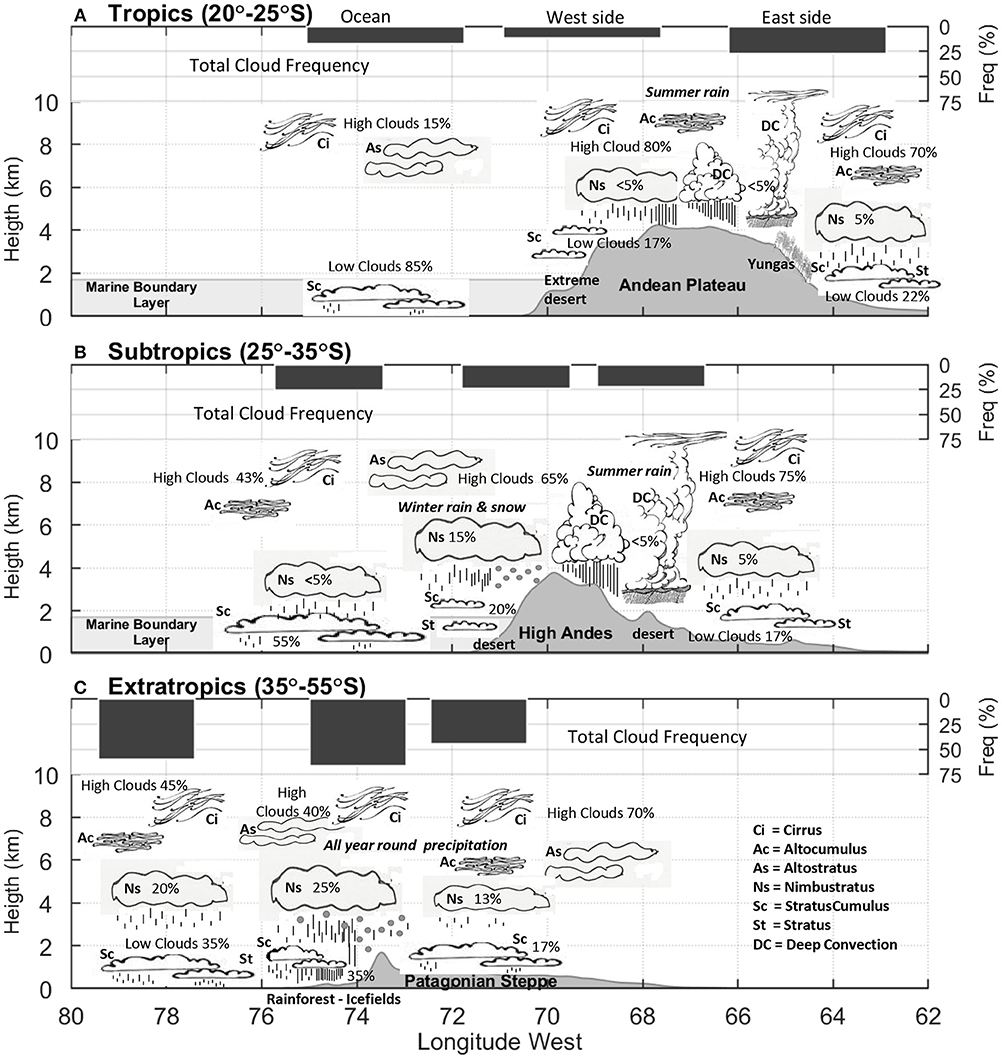
Figure 9. Cross-barrier schematic representation of total cloud frequency (top panels) and relative percentages of cloud types (bottom panels) for (A) the southern Andean plateau (20–25°S), (B) the subtropics (25–35°S), and (C) the extratropics (south of 35°S). Percentages of clouds represent approximately mean values in three main cross-barrier zones [ocean, east side (upstream and upslope), and west side (downslope and lee) of the Andes] estimated from Figures 5, 7, which in turn, were obtained from the CloudSat satellite during the 2006–2016 period. The principal cloud types are inferred by the 2B-CLASSCLOUD algorithm of CloudSat.
Across the high Andes between 25 and 35°S (Figure 9B), differences in annual total precipitation on each side are less evident. However, the precipitation seasonality markedly changes, becoming predominant in the cold semester on western side through frontal precipitation within the Westerlies (e.g., Falvey and Garreaud, 2007; Viale and Nuñez, 2011), and remains dominant in the warm semester on the eastern side through easterly flow and convective precipitation (e.g., Viale and Garreaud, 2014). The surface data indicates that an inflection point in the gradient of the annual total precipitation occurs around 30–32°S, where annual values are similar on both side of the Andes. This suggests a change in the direction of precipitation gradient, increasing from west-to-east to the north in the tropics and from east-to-west to the south in the extratropics. It should be noted, however, that limitations in surface data within the Andes still remain, and satellite estimates of accumulated precipitation on complex terrain are still in debate (e.g., Castro et al., 2015; Hobouchian et al., 2017; Zambrano-Bigiarini et al., 2017; Rivera et al., 2018). The climatic pattern observed in this region denotes a transitional behavior, with conditions resembling those in the extratropics in winter on the western side, but those of the tropics in summer on the eastern side. Thin low Sc clouds still dominate and produce light rain over the ocean, although high non-precipitating clouds (Ci, Ac, Ac) gradually increase as well as the precipitating Ns clouds. Over the high mountains, high non-precipitating clouds (Ci, Ac, Ac) are the predominant types, while Ns clouds produce most of dominant stratiform solid precipitation (snow). On the lee side, stratiform liquid precipitation from Ns clouds are predominant but convective precipitation from DC clouds play an important role as well.
South of 35°S (Figure 9C), the mean precipitation and the frequency of precipitating and non-precipitating clouds are substantially higher on the western side than on the eastern side of Andes. Nevertheless, the precipitation seasonality tends to be gradually similar and more evenly distributed throughout the year on both sides of the Andes. Orographic enhancement of midlatitude precipitation systems is clearly discernible in rainy, dense forest areas on upstream and upslope zones, with mean precipitation and frequency of clouds being roughly two times greater compared to those on the coastal and open ocean zones. These results closely agree with the satellite-based results of Falvey and Garreaud (2007), Barrett et al. (2011), and Viale and Garreaud (2015). The strong reductions of the precipitation and cloudiness on the downslope and lee zones are a prominent climatic feature on the Patagonian steppe, with values three or four times lower than in their upstream and upslope counterparts. From the Pacific Ocean to the upslope zones of the Andes, the low Sc and middle Ns clouds gradually become the most frequent cloud types poleward; whereas thin high non-precipitating clouds dominate on the downslope and lee zones of the Andes, likely due to the disruption of low clouds by orographic subsidence. Compared to what was observed further north in the subtropics, at these latitudes a higher fraction of multi-layer cloudy skies produces precipitation on the surface. Indeed, a large fraction of low Sc and middle Ns clouds produces stratiform precipitation upwind of the Andes, while mostly Ns clouds produce precipitation downwind of Andes. Also, frozen particles become important on precipitating clouds over the mountains and even on the lee, which reach the surface as snow or mixed precipitation roughly 50% of the time over the highest points of the south Patagonian Andes where extensive icefields are located, and as liquid precipitation most of the time over the lower adjacent areas.
Our findings provide new important information to improve the understanding of the contrasting precipitation patterns across a vast mountainous region in southern South America. This can be useful from a climatic point of view but also from an ecological, hydrological and/or glaciological perspective. In particular, the results obtained here using the active microwave measurements on board of the CloudSat satellite are promising and could encourage further studies which involve remote sensing data to complement the serious lack of in situ observations in elevated and remote areas of the Andes. Although this lack of basic in situ climate information can be partially overcome by the growing number and variety of satellite-based datasets, the maintenance of existing of surface climate networks and the implementation of new meteorological stations in the Andes must be considered a priority to better understand the climate in the most prominent mountainous region of the Southern Hemisphere.
Author Contributions
MV wrote the first draft and created most of the figures. LC created Figure 6 and revised/discussed the results. EB helped getting and analysis surface data and revised/discussed the results. LZ improved the quality of all the Figures and revised/discussed the results. LR, RV, PP, MM, and JR revised/discussed the results.
Conflict of Interest Statement
The authors declare that the research was conducted in the absence of any commercial or financial relationships that could be construed as a potential conflict of interest.
Acknowledgments
We thank the Dirección Meteorológica de Chile, Dirección General de Aguas de Chile, Secretaría de Infraestructura y Política Hídrica de Argentina and Servicio Meteorológico Nacional (Argentina) for providing the station data used in this study, which were accessed through www.cr2.cl and bdhi.hidricosargentina.gob.ar. MOD10A1 and MYD10A1 products of MODIS satellite and CloudSat satellite data were obtained freely at http://nsidc.org/data/mod10a1, http://nsidc.org/data/myd10a1, and http://www.cloudsat.cira.colostate.edu/, respectively. This research was supported by FONCYT PICT-2016-1666 and the BNP PARIBAS Foundation from France.
References
Barrett, B. S., Krieger, D. B., and and. Barlow, C. P. (2011). Multiday circulation and precipitation climatology during winter rain events of differing intensities in Central Chile. J. Hydrometeor. 12, 1071–1085. doi: 10.1175/2011JHM1377.1
Bianchi, E., Villalba, R., Viale, M., Couvreux, F., and Marticorena, R. (2016). New precipitation and temperature grids for northern Patagonia: Advances in relation to global climate grids. J. Meteorol. Res. 30, 38–52. doi: 10.1007/s13351-015-5058-y
Cara, L., Masiokas, M., Viale, M., and Villalba, R. (2016). Analysis of snow cover over the Mendoza river upper basin derived from MODIS imagery (in Spanish). Metorológica 41, 21–36.
Castro, L., Miranda, M., and Bonifacio, B. (2015). Evaluation of TRMM multi-satellite precipitation analysis (TMPA) in a mountainous region of the central Andes range with a Mediterranean climate. Hydrol. Res. 46, 89–105. doi: 10.2166/nh.2013.096
Ereño, C. E., and Hoffman, J. A. (1978). “The pluvial regime in the Central Cordillera (in Spanish),”in Geography Notebook Series, Vol. 5, Faculty of Philosophy and Letter–University of Buenos Aires (Buenos Aires: Library of the Faculty of Philosophy and Letter – Institute of Geography), 17p.
Espinoza, J. C., Chavez, S., Ronchail, J., Junquas, C., Takahashi, K., and Lavado, W. (2015). Rainfall hotspots over the southern tropical Andes: Spatial distribution, rainfall intensity, and relations with large-scale atmospheric circulation. Water Resour. Res. 51, 3459–3475. doi: 10.1002/2014WR016273
Falvey, M., and Garreaud, R. (2005). Moisture variability over the South American Altiplano during the South American Low Level Jet Experiment (SALLJEX) observing season. J. Geophys. Res. 110:D22105. doi: 10.1029/2005JD006152
Falvey, M., and Garreaud, R. (2007). Wintertime precipitation episodes in Central Chile: associated meteorological conditions and orographic influences. J. Hydrometeor. 8, 171–193. doi: 10.1175/JHM562.1
Frei, C., and Schär, C. (1998). A precipitation climatology of the Alps from high-resolution raingauge observations. Int. J. Climatol. 18, 873–900. doi: 10.1002/(SICI)1097-0088(19980630)18:8<873::AID-JOC255>3.0.CO;2-9
Garreaud, R. (1999). Multiscale analysis of the summertime precipitation over the central Andes. Mon. Wea. Rev. 127, 901–921. doi: 10.1175/1520-0493(1999)127<0901:MAOTSP>2.0.CO;2
Garreaud, R., Lopez, P., Minvielle, M., and Rojas, M. (2013). Large-scale control on the Patagonian climate. J. Climate 26, 215–230. doi: 10.1175/JCLI-D-12-00001.1
Hall, D., and Salomonson, V. (2006). MODIS/Aqua Daily L3 Global 500m Grid, Version 5. December to February 2002-2008. Boulder, CO: National Snow and Ice Data Center.
Hall, D. K., Riggs, G. A., and Salomonson, V. (2006). MODIS/Terra Daily L3 Global 500m Grid, Version 5. December to February 2002-2008. Boulder, CO: National Snow and Ice Data Center.
Hayden, L., and Liu, C. (2018). A multiyear analysis of global precipitation combining CloudSat and GPM precipitation retrievals. J. Hydrometeor. 19, 1935–1952. doi: 10.1175/JHM-D-18-0053.1
Haynes, J. M., L'Ecuyer, T. S., Stephens, G. L., Miller, S. D., Mitrescu, C., Wood, N. B., et al. (2009). Rainfall retrieval over the ocean with spaceborne W-band radar. J. Geophys. Res. 114:D00A22. doi: 10.1029/2008JD009973
Hobouchian, M. P., Salio, P, García Skabar, Y., Vila, D., and Garreaud, R. (2017). Assessment of satellite precipitation estimates over the slopes of the Subtropical Andes. Atmos. Res. 190, 43–54. doi: 10.1016/j.atmosres.2017.02.006
Hoffman, J. A. (1975) Climatic Atlas of South America. Part I: Maps of Mean Temperature and Precipitation. WMO.
Im, E., Wu, C. L., and and. Durden, S. L. (2005). Cloud profiling radar for CloudSat mission, IIEE Aerosp. Electron. Syst. Mag. 20, 15–18. doi: 10.1109/MAES.2005.1581095
Junquas, C., Takahashi, K., Condom, T., Espinoza, J.-C., Chavez, S., Sicart, J.-E., et al. (2018). Understanding the influence of orography on the precipitation diurnal cycle and the associated atmospheric processes in the central Andes. Clim. Dyn. 50, 3995–4017. doi: 10.1007/s00382-017-3858-8
Lenaerts, J. T., Van den Broeke, M. R., Van Wessem, J. M., Van de Berg, W. J., Van Meijgaard, E., Van Ulft, L. H., et al. (2014). Extreme precipitation and climate gradients in Patagonia revealed by high-resolution regional atmospheric climate modeling. J. Climate 27, 4607–4621. doi: 10.1175/JCLI-D-13-00579.1
Mace, G. G., Marchand, R., Zhang, Q., and Stephens, G. (2007). Global hydrometeor occurrence as observed by CloudSat: initial observations from summer 2006, Geophys. Res. Lett. 34:L09808. doi: 10.1029/2006GL029017
Marchand, R., Mace, G. G., Ackerman, T., and Stephens, G. (2008) Hydrometeor detection using Cloudsat—an earth-orbiting 94-GHz cloud radar. J. Atmos. Oceanic Technol. 25, 519–533. doi: 10.1175/2007JTECHA1006.1
Masiokas, M., Villalba, R., Luckman, B. H., Le Quesne, C., and Aravena, J. C. (2006). Snowpack variations in the Central Andes of Argentina and Chile, 1951-2005: large-scale atmospheric influences and implications for water resources in the region. J. Climate 19, 6334–6352. doi: 10.1175/JCLI3969.1
Miller, A. (1976). “The climate of Chile,” in World Survey of Climatology, Vol. 12, ed W. Schwerdtfeger (Amsterdam: Elsevier), 113–130.
Minder, J. R., Durran, D. L., and Roe, G. H. (2011). Mesoscale controls on the mountainside snow line. J. Atmos. Sci. 68, 2107–2127. doi: 10.1175/JAS-D-10-05006.1
Minder, J. R., and Kingsmill, D. E. (2013). Mesoscale variations of the atmospheric snow line over the Northern Sierra Nevada: multiyear statistics, case study, and mechanisms. J. Atmos. Sci. 70, 916–938. doi: 10.1175/JAS-D-12-0194.1
Prohaska, F. (1976). “The climate of Argentina, Paraguay and Uruguay,” in World Survey of Climatology, Vol. 12, ed W. Schwerdtfeger (Elsevier) 13–73.
Rasmussen, K. L., Chaplin, M. M., Zuluaga, M. D., and Houze, R. A. (2016). Contribution of extreme convective storms to rainfall in South America. J. Hydrometeor. 17, 353–367. doi: 10.1175/JHM-D-15-0067.1
Rasmussen, L. A., and Tangborn, W. V. (1976). Hydrology of the North Cascades region, Washington: 1. Runoff, precipitation, and storage characteristics. Water Resour. Res. 12, 187–202. doi: 10.1029/WR012i002p00187
Reboita, M. S., Gan, M. A., Da Rocha, R. P., and Ambrizi, T. (2010). Precipitation regimes in South America: a bibliographic review [in portuguese]. Rev. Brasil. Meteorol. 25, 185–204. doi: 10.1590/S0102-77862010000200004
Rivera, J. A., Marianetti, G., and Hinrichs, S. (2018). Validation of CHIRPS precipitation dataset along the Central Andes of Argentina. Atmos. Res. 213, 437–449. doi: 10.1016/j.atmosres.2018.06.023
Romatschke, U., and Houze, R.A. (2013). Characteristics of precipitating convective systems accounting for the summer rainfall of tropical and subtropical South America. J. Hydrometeor. 14, 25–46. doi: 10.1175/JHM-D-12-060.1
Sassen, K., and Wang, Z. (2008). Classifying clouds around the globe with the CloudSat radar: 1-year of results, Geophys. Res. Lett. 35:L04805. doi: 10.1029/2007GL032591
Schaefer, M., Machguth, H., Falvey, M., Casassa, G., and Rignot, E (2015). Quantifying mass balance processes on the Southern Patagonia Icefield. Cryosphere 9, 25–35. doi: 10.5194/tc-9-25-2015
Smith, R. B., and Evans, J. P. (2007). Orographic precipitation and isotope fraction over the southern Andes. J. Hydrometeor. 8, 3–14. doi: 10.1175/JHM555.1
Stephens, G. L., Vane, D. G., Boain, R. J., Mace, G. G., Rossow, W. B., Durden, S. L., et al. (2002). The CloudSat mission and the A-train. A new dimension of space-based observations of clouds and precipitation. Bull. Am. Meteorol. Soc. 83, 1771–1790. doi: 10.1175/BAMS-83-12-1771
Takahashi, K., and Battisti, D. S. (2007a). Processes controlling the mean tropical Pacific precipitation pattern. Part I: The Andes and the eastern Pacific ITCZ. J. Climate 20, 3434–3451. doi: 10.1175/JCLI4198.1
Takahashi, K., and Battisti, D. S. (2007b). Processes controlling the mean tropical Pacific precipitation pattern. Part II: the SPCZ and the southeast Pacific dry zone. J. Clim. 20, 5696–5706. doi: 10.1175/2007JCLI1656.1
Viale, M., and Garreaud, R. (2014). Summer precipitation events over the western slopes of the subtropical Andes. Mon. Wea. Rev. 142, 1074–1092. doi: 10.1175/MWR-D-13-00259.1
Viale, M., and Garreaud, R. (2015). Orographic effects of the subtropical and extratropical Andes on upwind precipitating clouds. J. Geophys. Res. Atmos. 120, 4962–4974. doi: 10.1002/2014JD023014
Viale, M., and Nuñez, M. N. (2011). Climatology of winter orographic precipitation over the Subtropical Central Andes and associated synoptic and regional characteristics. J. Hydrometeor. 12, 481–507. doi: 10.1175/2010JHM1284.1
Viale, M., Valenzuela, R., Garreaud, R., and Ralph, F. M. (2018). Impacts of atmospheric rivers on precipitation in Southern South America. J. Hydrometeor. 19, 1671–1687. doi: 10.1175/JHM-D-18-0006.1
Vuille, M. (1999). Atmospheric circulation over the Bolivian Altiplano during dry and wet periods and extreme phases of the Southern Oscillation. Int. J. Climatol. 19, 1579–1600. doi: 10.1002/(SICI)1097-0088(19991130)19:14<1579::AID-JOC441>3.0.CO;2-N
Whiteman, C. D. (2000). Mountain Meteorology: Fundamentals and Applications. New York, NY: Oxford University Press.
Keywords: Andes (Argentina and Chile), precipitation, clouds, CloudSat, MODIS, rain gauges
Citation: Viale M, Bianchi E, Cara L, Ruiz LE, Villalba R, Pitte P, Masiokas M, Rivera J and Zalazar L (2019) Contrasting Climates at Both Sides of the Andes in Argentina and Chile. Front. Environ. Sci. 7:69. doi: 10.3389/fenvs.2019.00069
Received: 18 January 2019; Accepted: 09 May 2019;
Published: 31 May 2019.
Edited by:
Yuh-Lang Lin, North Carolina Agricultural and Technical State University, United StatesReviewed by:
Michelle Simoes Reboita, Universidade Federal de Itajubá, BrazilBijoy Vengasseril Thampi, Science Systems and Applications, United States
Copyright © 2019 Viale, Bianchi, Cara, Ruiz, Villalba, Pitte, Masiokas, Rivera and Zalazar. This is an open-access article distributed under the terms of the Creative Commons Attribution License (CC BY). The use, distribution or reproduction in other forums is permitted, provided the original author(s) and the copyright owner(s) are credited and that the original publication in this journal is cited, in accordance with accepted academic practice. No use, distribution or reproduction is permitted which does not comply with these terms.
*Correspondence: Maximiliano Viale, bWF4aXZpYWxlJiN4MDAwNDA7bWVuZG96YS1jb25pY2V0LmdvYi5hcg==