 Wen-Ching Chuang
 Tarsha Eason
 Ahjond Garmestani
 Caleb Roberts5
95% of researchers rate our articles as excellent or good
Learn more about the work of our research integrity team to safeguard the quality of each article we publish.
Find out more
ORIGINAL RESEARCH article
Front. Environ. Sci. , 12 June 2019
Sec. Environmental Health and Exposome
Volume 7 - 2019 | https://doi.org/10.3389/fenvs.2019.00068
This article is part of the Research Topic Resilience to Natural Hazards – Concepts, Ecosystems and Communities View all 6 articles
Natural disasters, such as hurricanes and forest fires, could trigger collapse and reorganization of social-ecological systems. In the face of external perturbations, a resilient system would have capacity to absorb impacts, adapt to change, learn, and if needed, reorganize within the same regime. Within this context, we asked how human and natural systems in Louisiana responded to Hurricane Katrina, and how the natural disaster altered the status of these systems. This paper discusses community resilience to natural hazards and addresses the limitations for assessing disaster resilience. Furthermore, we assessed social and environmental change in New Orleans and southern Louisiana through both a spatial and temporal lens (i.e., pre- and post-Katrina). By analyzing changes in system condition using social, economic and environmental factors, we identified some of the characteristics of the system's reorganization trajectories. Our results suggest that although the ongoing population recovery may be a sign of revitalization, the city and metropolitan area continue to face socioeconomic inequalities and environmental vulnerability to natural disasters. Further, the spatial distribution of social-ecological condition over time reveals certain levels of change and reorganization after Katrina, but the reorganization did not translate into greater equity. This effort presents an enhanced approach to assessing social-ecological change pre and post disturbance and provides a way forward for characterizing pertinent aspects of disaster resilience.
Over the past several decades, the increase in intensity and frequency of natural hazards, such as hurricanes (Goldenberg et al., 2001; Webster et al., 2005), prolonged drought and heat waves (Meehl and Tebaldi, 2004) has brought significant impacts on social-ecological systems. In 2005, Hurricane Katrina impacted an estimated 2,331 square kilometers, flooded over 80% of the city of New Orleans, and displaced 400,000 people causing significant outmigration (Lewis et al., 2017). The scale and degree of devastation and population relocation from this natural hazard exceeded the impacts from previous events such as the 1900 Galveston Hurricane, the 1906 San Francisco earthquake and the 1927 Mississippi Flood (Elliott and Pais, 2006). It is well-documented that Hurricane Katrina's devastation was widespread, however, there has been less discussion and exploration on the equity of the impacts and recovery using a social-ecological resilience lens.
Hazard research has grown significantly in the past decades across various fields of study, with research questions primarily associated with vulnerability, recovery and resilience (Opdyke et al., 2017). Vulnerability is defined as the characteristics of an individual or a group that influence their capacity to anticipate, respond to, cope with, resist, and recover from an external disturbance (e.g., natural hazard) and the subsequent impact on their livelihood and well-being (Kelly and Adger, 2000; Wisner, 2004). It can also be defined as “the degree to which a system or system component is likely to experience harm due to exposure to a hazard, perturbation or stress” (Turner II et al., 2003). The assessment of vulnerability to natural hazards typically uses surrogate variables, representing sensitivity and adaptive capacities of an exposed entity, to construct a quantitative and comparable index among spatial units. The assessment can serve as a baseline or context for decision and action that facilitates and informs prevention, planning, mitigation, adaptation, and recovery from the impact of natural hazards (Kelly and Adger, 2000; Cutter and Finch, 2008). An example is the social vulnerability index (SoVI) to natural hazards developed by Cutter et al. (2003). The index aggregates demographic, housing, and neighborhood variables from the U.S. Census Bureau to examine the social vulnerability of U.S. counties to environmental hazards.
In recent years, the discourse on natural hazards in both research and policy domains, is shifting from vulnerability to resilience among U.S. federal agencies (Cutter et al., 2008, 2014; US Department of Housing Urban Development, 2014) and on the international stage (Fekete, 2009; World Bank, 2013). Part of the reason for this shift is that resilience is more proactive and dynamic (Cutter et al., 2008). A challenge of assessing disaster resilience emerges when there is neither a single definition for disaster resilience nor a widely accepted way to measure it. Though there have been attempts to assess some dimensions of community resilience to natural disasters, there is still a lack of consistent and standard metrics or surrogate variables to evaluate disaster resilience in communities. The concept of resilience (from ecology) is described as “a measure of the persistence of systems and of their ability to absorb change and disturbance and still maintain the same relationship between populations or state variables” (Holling, 1973). Ecological resilience focuses on the ability of a system to withstand change and retain its processes and structures without shifting to a new regime, or an alternative state. Thus, resilience can be measured by the magnitude of disturbance the system can tolerate and still persist (Carpenter et al., 2001). Ecological resilience was introduced to the social sciences in the context of vulnerability to climate effects (Timmerman, 1981; Cutter et al., 2003). Cutter et al. (2008) later presented a disaster resilience framework at the community level. Heavily influenced by the work of social vulnerability to environmental hazards, the research attempts to assess disaster resilience by applying an inductive method to explain susceptibility through select variables intended to characterize the exposed entity. Cutter et al. (2008) argued that the conceptual frameworks of disaster resilience and vulnerability to natural hazards are both dynamic; however, the assessment presented was still static (i.e., evaluated only one snapshot at a time), which is very different from the quantitative approaches for assessing ecological resilience (Angeler et al., 2016). In the context of natural hazards, resilience is sometimes defined from an engineering perspective. An example is the National Ocean Service at the National Oceanic and Atmospheric Administration (NOAA, 2018) defining coastal resilience as “building the ability of a community to bounce back after hazardous events such as hurricanes, coastal storms, and flooding, rather than simply reacting to impacts.” Within this context, many natural hazard studies focus on engineered and human systems, including loss prevention and post-disaster actions and planning to minimize disaster impacts (Bruneau et al., 2003; Cutter et al., 2008). An overemphasis upon engineering resilience (which assumes a single-state landscape) limits the understanding of a system's emergent capacities to withstand disruptions that are unforeseeable (Sikula et al., 2015) or the possibility that recovery to a previous state is impossible; hence, new regimes, processes and structures emerge (Chuang et al., 2018).
Vulnerability and resilience share some commonalities. For instance, the level of vulnerability can affect the degree of resilience in a coupled human and natural system (Turner II et al., 2003). There have been attempts to distinguish the two terms from various (and some contested) definitions (Turner II et al., 2003; Gallopín, 2006; Cutter et al., 2008). With the lens of sociology, Gotham and Campanella (2011) argue that resilience studies attempt to find “how and under what conditions ecological and human communities adapt and adjust, or transform and innovate in response to a shock or traumatic event,” and vulnerability studies investigate the root of hazards within coupled systems (e.g., Eakin et al., 2009), examine their varying capacities to respond to these hazards, and explore the “co-existence of adaptive and maladaptive couplings in vulnerable systems” (Gotham and Campanella, 2011). In the context of hazards and disasters, Cutter et al. (2008) differentiated the two concepts by the temporal period of the assessment. They described vulnerability as the “pre-event, inherent characteristics or qualities of social systems that create the potential for harm (Cutter et al., 2008),” while defining resilience as “the ability of a social system to respond and recover from disasters. Accordingly, the Cutter et al. (2008) definition of resilience includes those inherent conditions that allow the system to absorb impacts and cope with an event, as well as, post-event adaptive processes that facilitate the ability of the social system to re-organize, change, learn and respond to a threat.”
Disaster resilience studies often address a set of capacities and strategies for disaster readiness (Norris et al., 2008) which relates the ability of a community to prepare and plan for, absorb, recover from, and adapt to adverse events in a timely and efficient manner. Opdyke et al. (2017) documented the hazard studies from 1990 to 2015. Among the methods used for quantifying resilience to natural hazards, the top three approaches are (1) modeling or simulation (31% out of 241 studies), (2) literature review or theoretical framework (24%), and (3) GIS analysis (15%). Specifically, the majority of the first type of research focuses on economic aspects of resilience (i.e., economic modeling). The second type of research is largely narrative-based, conceptually developing a framework and indices to measure resilience to natural hazards or climate events. For example, Summers et al. (2017) presented a conceptual model that characterizes resilience to climate events from the natural environment, society, the built environment and risk domains. Such approaches use indicators (metrics) to establish a quantifiable baseline condition for comparing the degree of resilience to monitor progress. However, many of these disaster indicator studies are designed with generic goals, like community resilience, implying or attempting to characterize an entire community's resilience to all hazards without specifying a particular threat, disturbance or unique characteristics of the exposed system. Such a generalized assessment could limit the application and utility of the approaches for exploring particular cases. This is in contrast to the Carpenter et al. (2001) argument that the most important step is to identify resilience “of what to what” because different disturbances could impact a system in many ways and with different magnitudes and, building the capacity for resilience in one area may create vulnerabilities in other areas. Further, when evaluating resilience, one must be aware of the existence of multiple regimes and understand that returning to a particular regime (set of conditions) may be impossible (Carpenter et al., 2001).
There is extensive research on natural hazards but little has focused on the process of reconstruction (Kates et al., 2006), change and reorganization of social-ecological systems before and after a natural hazard. Although disturbances, such as natural hazards, often wreak havoc on human and natural systems, in the aftermath (reorganization phase), there is the potential opportunity for innovation, development and transformation (Folke, 2006, 2016). Panarchy describes the changing stages of complex adaptive systems as they continually organize and structure within and across scales of space and time, and is characterized by a set of interconnected adaptive cycles (Gunderson and Holling, 2002). The four phases of adaptive cycles are release (or collapse), reorganization, exploitation, and conservation (Gunderson and Holling, 2002). The release/collapse phase is triggered by a disturbance that is large enough to change the state of a system. Reorganization describes the period after a disturbance where the system goes into an unstable period and has relatively low resistance to new innovations. Exploitation refers to a rapid growth (van der Leeuw, 2013) and exploitation of resources by system components (Gunderson and Holling, 2002). Lastly, conservation is the phase where system components gradually become more established and connected (van der Leeuw, 2013). In this state, the system becomes rigid and increasingly sensitive to disturbances (Allen et al., 2014). Disturbances have the potential to create opportunities for innovation, development (Folke, 2006), improvement, and beneficial transformation.
The City of New Orleans has rebuilt after previous natural disasters with the hope of emerging in a safer and more equitable way (Kates et al., 2006). This research aims to examine if this goal was reached by studying how social and ecological condition changed over time, while viewing Hurricane Katrina as a perturbation of the system. The effort focuses on the process of change and reorganization after a natural hazard and applies the concept of ecological resilience in the analyses. It takes an integrated approach that includes assessments from socio-demographic, economic, and environmental dimensions, to understand the changes in this coastal city, before and after Hurricane Katrina. Specifically, we asked the following questions: What are the impacts on human and natural systems in New Orleans, several years after Hurricane Katrina? Further, Hurricane Katrina offered a window of opportunity to transform the system. How has the system changed over time? Extending the traditional approaches, we used indicators to characterize the condition of the system. Also, rather than a snapshot, we introduce a dynamic component by assessing the status of New Orleans and southern Louisiana pre- and post-disaster using multiple time steps. We also incorporated ecological components by assessing land cover changes over time and incorporated breeding bird survey data as a proxy for evaluating ecosystem variation. Further, we evaluated these social-ecological changes using principal component analysis (PCA) and rather than simply quantifying and comparing indicator variables, we used GIS to capture spatial patterns and observed the quality of change by examining specific traits of the system. Finally, we discussed the limitations of our work and offer guidance on improving disaster resilience research in the future.
New Orleans is an archetype for coastal ecosystems under immediate threat by natural hazards and environmental change, specifically due to sea level rise and hurricanes (Gotham et al., 2014). The City is about 169 kilometers north of the Gulf of Mexico, located between the Mississippi River and Lake Pontchartrain. A large part of the city is below sea level (lowest topography reaches 3–5 meters below sea level) (Dixon et al., 2006) and flooding of levees and floodwalls is expected when a storm reaches Category 3 or above (Carter, 2005). Prior to Katrina, the city's population declined from a peak at 627,000 in 1960 to about 484,000 people in 2000 (US Census Bureau, 2017). In 2005, Hurricane Katrina resulted in more than 1500 deaths and 76.8% of the population suffered from flooding. Right after Hurricane Katrina, the population size of the city sharply decreased to 208,000 people in 2006, resulting in more than a 57% reduction in population in the city when compared with the population of the city in 2000. In the post-Katrina era, the city has revived and is experiencing increased wages and higher median household income, population growth (391,000 in 2016) and growing entrepreneurship (Liu and Plyer, 2010). Along with economic and population growth, there are also spikes in housing costs and crime rates, resulting in neighborhood instability and social conflicts (Gotham and Campanella, 2011). Our aim is to study the changes in this social-ecological system over time.
To better understand a system's capacity to withstand and adapt to natural hazards, the evaluation should examine the degree of pre-disturbance vulnerability or risk to the system, and level of post-disturbance renewal, reorganization, and innovation (Gotham and Campanella, 2011). Thus, we assessed and compared the conditions before and after Hurricane Katrina through an integrated approach to interpret our findings in a disaster resilience context. Our assessment comprises the three core dimensions of coupled human and natural systems: (1) economic; (2) social; and (3) environmental. We examined the characteristics of the system temporally and spatially using representative variables from economic and social-demographic dimensions. In the environmental dimension, we examined the restoration and alteration of the natural system by evaluating land-cover change and bird diversity over time.
Since continuous data were not available for all the social and economic variables, the assessment of before and after conditions comprises three-time steps, year 2000 (pre-Katrina), 2009 (post-Katrina), and 2014 (post-reorganization). We selected these years based on the availability of Census data. The 2009 Census data were from the American Community Survey (ACS) 5-year estimate, based on the data collected between 2005 and 2009. The ACS 2014 is the estimation based on the survey between 2010 and 2014. ACS uses the same measurement as the decennial Census but takes the average over a longer period. Thus, the ACS data is more reliable than the single-year survey due to its larger sample size and temporal coverage.
Bird data were acquired from the USGS North American Breeding Bird Survey (BBS), a long-term and large-scale avian monitoring program. In this paper, we used the total number of species and the total bird population to calculate a Shannon Index of Diversity (Equation 1) for each BBS route from 2000 to 2015. Since there is no BBS route in the City of New Orleans, we selected the closest routes which are 33–136 km from the city center.
where,
pi = proportion of the population made up of species i
s = number of species in sample
The land cover and land cover change data were gathered from the Coastal Change Analysis Program (C-CAP) of NOAA's Office of Coastal Management. The C-CAP regional land cover and change products are nationally standardized, raster-based inventories of land cover for the coastal areas, from the analysis of multiple dates of remote-sensing imagery with 30 meters/pixel resolution. The thematic land-cover land-change raster files were input and processed using ArcGIS 10.3 to calculate area of change for the land type of interest given C-CAP's 24 land-cover classes. We specifically examined the following data: (1) developed area which is covered by concrete, asphalt, and other constructed materials; (2) vegetation that includes forest, scrub land, and grassland; and (3) wetlands (NOAA, 2017). Table 1 shows the data, their sources, and temporal coverage available for this study. We used land-cover change over time at the city scale and beyond (southern Louisiana) as a surrogate of environmental degradation at different spatial scales. Zonal statistics were applied in ArcGIS to measure land-cover change and calculate percentage of change outside of the political boundary including open water.
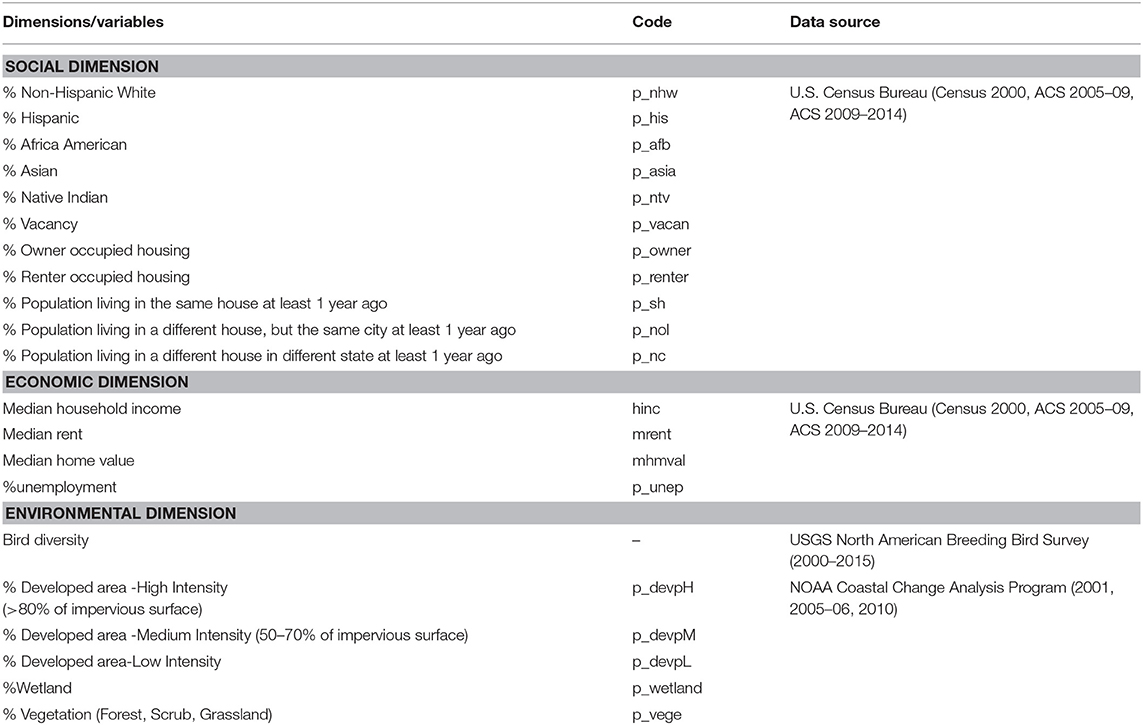
Table 1. Variables and data sources.
Level of heterogeneity or diversity is a critical indicator of resilience. It reflects the options and a system's capacity to respond to change and disturbance in various ways (Walker and Salt, 2006). Inequality among income and ethnic/racial groups has been an issue in New Orleans. In general, the lower-income population lives in the areas with higher risk to flooding (Kates et al., 2006). We used spatial autocorrelation to quantify the pattern of change and test the following hypotheses:
H1: The spatial distribution of some social and economic variables became less clustered (exhibited more heterogeneity) than pre-Katrina condition.
H2: Disproportional risk to flooding decreased over time.
To test the first hypothesis, we used a spatial autocorrelation index, Moran's I (Equation 2), to measure the correlation of targeted variables and determine its spatial pattern (cluster, random, or discrete). Moran's I values range between −1 and 1, indicating that attribute values at adjacent geographic sites are more dissimilar (−1) or more similar (1).
For an observation Z at location i ( , where is the mean of variable X): Wij is the element of the spatial weights matrix, S0 = ∑i∑jWij is the sum of all the weights, and n is the number of observations. All the spatial autocorrelation analyses were performed in the Geoda 1.8.16.4 spatial data analysis software.
For the second hypothesis, we mapped the area flooded during Hurricane Katrina in ArcGIS and superimposed temporal Census data on the GIS map to calculate the population of each ethnicity in the area over time. The flood-damaged information comes from a report (Logan, 2006), which used FEMA and high-resolution images from the Dartmouth Flood Observatory to estimate flood-impacted area right after Hurricane Katrina.
Lastly, we synthesized the social-ecological conditions and monitored change over time using a deductive statistical approach, principal component analysis, to characterize this coastal system, and observe how the social-environmental system of New Orleans changed and restructured over time.
An assessment of land-cover changes pre- and post-Katrina (2005–2006) showed that the primary land conversion in both southern Louisiana and New Orleans was from wetland loss. Deforestation and destruction of man-made infrastructure was also critical (Tables 2, 3). Over the longer term (2001 to 2010), southern Louisiana experienced deforestation reflected in more vegetation changing from forest and grassland to shrubs (Table 4). At a finer scale, the major land change in New Orleans resulted from wetland loss and new development (Table 5).
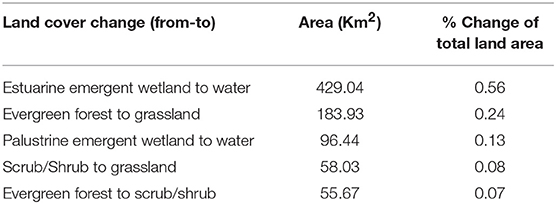
Table 2. Land-cover change between 2005 and 2006 in Southern Louisiana.
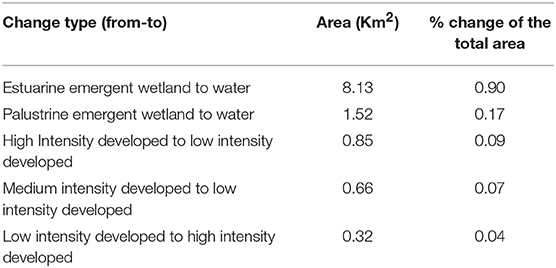
Table 3. Land-cover change between 2005 and 2006 in New Orleans.
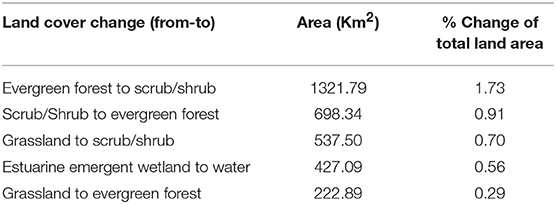
Table 4. Land-cover change between 2001 and 2010 in Southern Louisiana.
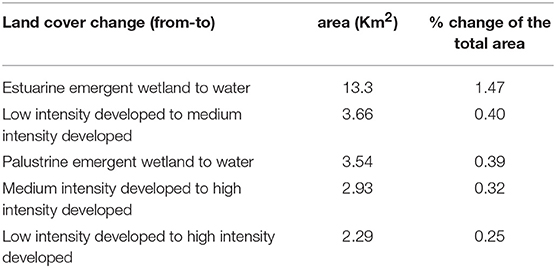
Table 5. Land-cover change between 2001 and 2010 in New Orleans.
We selected five BBS routes close to New Orleans. Three routes are in northeast, south, and southwest of Louisiana, and two routes are in neighboring Mississippi with the distances ranging from 33 to 136 km away from the city center. A plot of the Shannon diversity index displays the index value for each route from 2000 to 2015 and the mean for the two LA routes (A and B) closest to New Orleans (Figure 1). (Note that the discontinuities relate to missing data (2004 for route B; 2010 for route E; 2001–2004, 2016 for route C). There was a slight drop for these two routes after 2006, in 2008, but both tended to vary around the 15-year average level and by 2010, they decreased again until 2014.
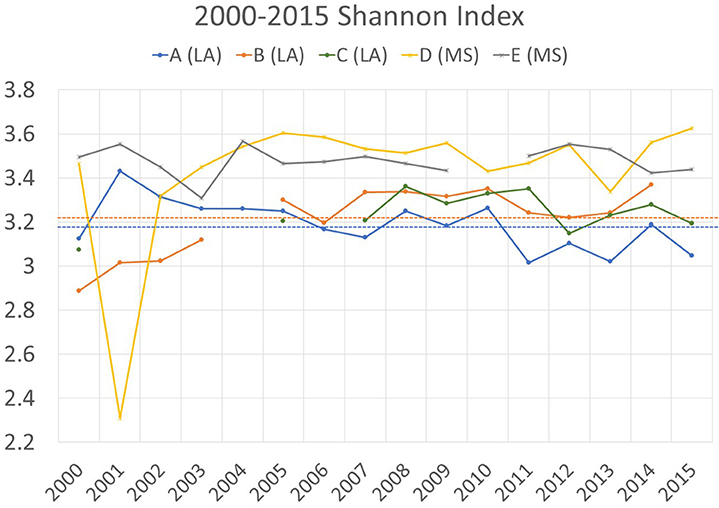
Figure 1. Bird diversity represented by Shannon Index between 2000 and 2015. LA-Louisiana; MS-Mississippi; Dot lines are 15-year average of the two sites in Louisiana.
Income is an indicator associated with socio-economic status and may serve as a surrogate measure of a group's ability to cope with change. We calculated z-scores of incomes at Census-tract level between 2000 and 2014 to monitor changes in wealth status. The z-score is the standard deviation from the mean of all tracts for a specific time step. A positive z-score meant the income level was above the mean (of 0) and a negative z-score meant the observation was below the average. Using z-score to examine the income distribution yielded a relative indication of how each tract's income status compared to the other tracts in New Orleans over the period. The data yielded four wealth categories. For example, in Figure 2:
1. Remained relatively low income: Neighborhoods with z-scores below 0 between 2000 and 2014.
2. Decreasing wealth: Neighborhoods with a z-score above 0 in 2000 and below 0 in 2014.
3. Remained wealthy: Neighborhoods with z-scores above 0 in both 2000 and 2014.
4. Increasing wealth: Neighborhoods with a z-score below 0 in 2000 and above 0 in 2014.
Figure 3 reveals the geographical location of these four types of neighborhoods with different time steps: (1) between 1990 and 2000; and (2) between 2000 and 2014.
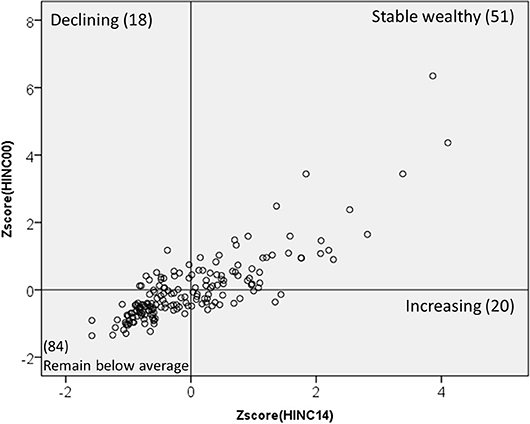
Figure 2. Z scores on distribution of income between 2000 and 2014.
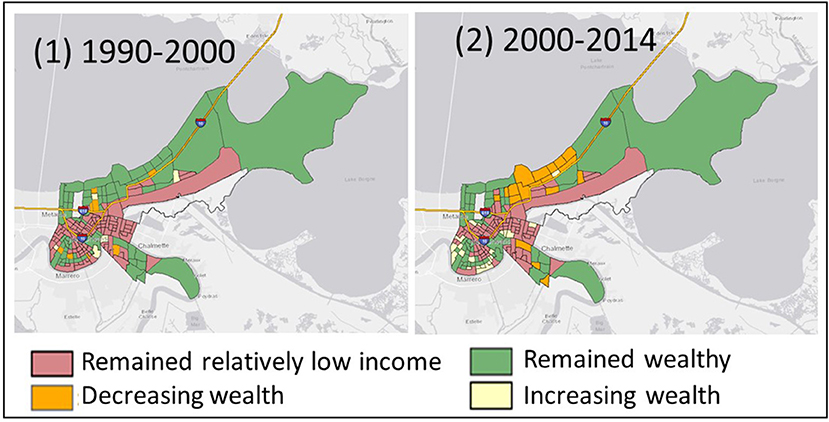
Figure 3. Spatial distribution of income change between (1) 1990 and 2000; and (2) 2000 and 2010.
Since some tract boundaries were modified by the US Census Bureau over time, we made the census data comparable by aligning historical census information to year 2010 Census boundaries, using the Longitudinal Tract Data Base program developed by Brown University. The program applies proportional area weighting to assign census variable values to the consistent spatial unit (Logan et al., 2016). Figure 3 maps the neighborhoods that remained wealthy, relatively low income, and those with increasing or decreasing wealth in two-time segments: 1990–2000 and 2000–2014).
Spatial autocorrelation of income, unemployment, vacancy rates, renters, and owners. The spatial analysis reveals that while occupied housing (renter and owner) and vacancy rate dispersed (Moran's I declined), income became more clustered over time (Moran's I increased), the unemployment rate exhibited more variability: declined from pre-storm rates (2005–2009) and by 2014 spatial autocorrelation had increased (Figure 4). Specifically, the spatial analysis reveals that income patterns became more clustered over time, meaning wealthy and low-income neighborhoods were spatially autocorrelated, instead of randomly distributed across the city. Moreover, while high-income clusters grew slightly between 2005 and 2009, low-income clusters contracted (relatively concentrated), but both became more aggregated, respectively, in 2014. Accordingly, the aggregation pattern measured by Moran's I suggests that income inequality enlarged spatially over time.
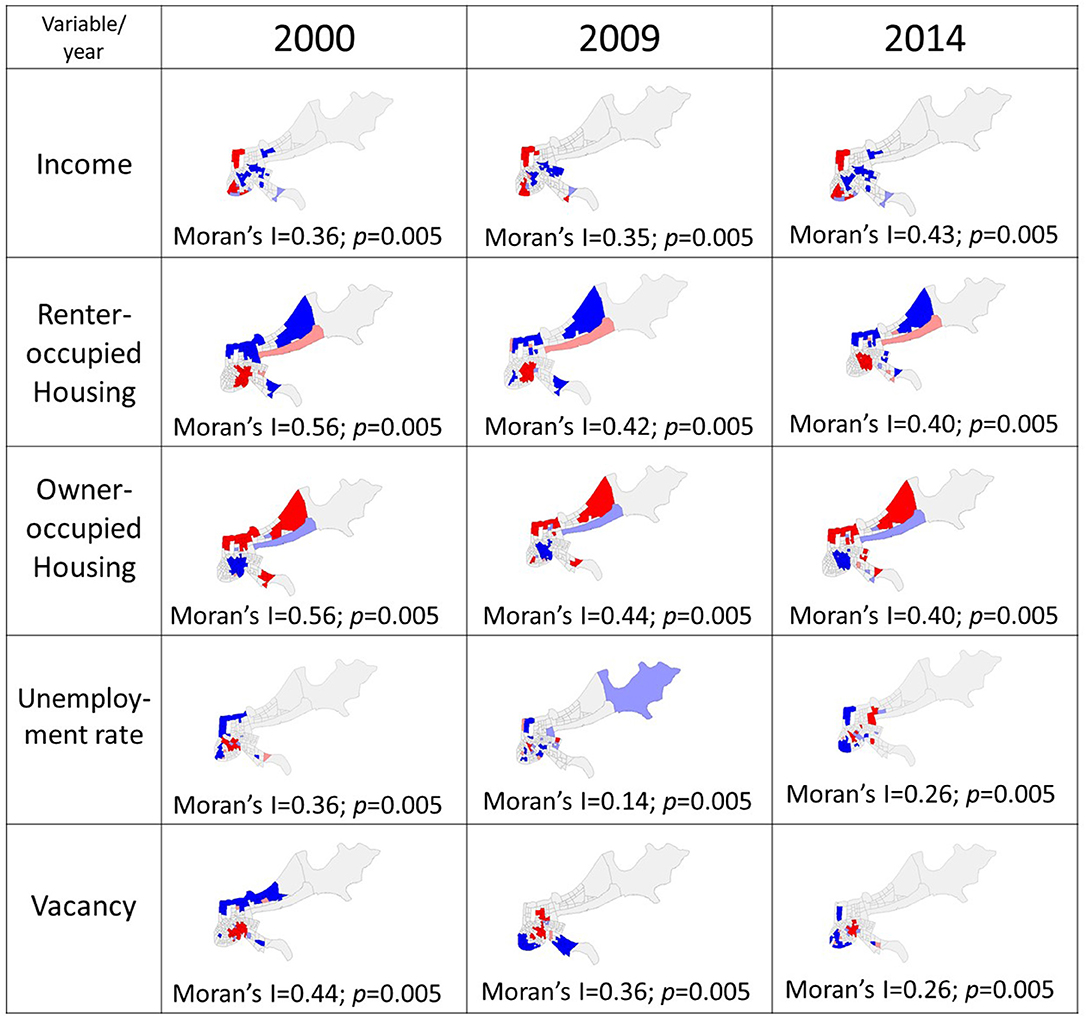
Figure 4. Cluster maps and Moran's Index of income, housing characteristics, unemployment, and vacancy. Areas in dark blue are the clusters of low value, and areas in red are the clusters of high value. The values relate to high or low income, unemployment rate, etc.
The average unemployment rate at Census-tract scale in New Orleans was 10.96%, higher than the national level in 2000 (4.00%). After Hurricane Katrina, the average unemployment rate reached 13.92%, and then dropped to 12.74% in 2014. Further, there was variation in unemployment rate at a fine scale within the city. In 2014, almost 20% of neighborhoods had unemployment rates below 5%, yet nearly as many (16%) neighborhoods had unemployment rates above 20%. The degree of spatial autocorrelation decreased after Hurricane Katrina but increased again in 2014. Hot spots of high unemployment were less aggregated, but a new cluster appeared on the east side of the city in 2014.
The vacancy rate during 2005-09 was about 26.71%, more than twice the level in 2000 (12.68%). The rate decreased to 21.29% in 2014, suggesting that even 9 years after Katrina, there are still neighborhoods with limited capacity for reorganization. Meanwhile, the spatial patterns of vacant units become less aggregated over time but remained spatially autocorrelated. As Figure 4 shows, the hot spot of vacant units clustered in the urban core. Specifically, the geographical location of highly vacant areas changed and became more discrete after Katrina, yet the spatial cluster returned to a pattern similar to pre-Katrina status by 2014.
The spatial distribution of renter and owner-occupied housing units was highly clustered. Though the degree of spatial autocorrelation has decreased since 2000, the hot spot of owner-occupied and renter-occupied units remained segregated.
Principal component analysis (PCA) is a multivariate statistical approach used to identify the pattern of similarity among observations (Abdi and Williams, 2010). We input all variables from Table 1, except for bird diversity data (because it only showed small variation) and performed PCA in IBM SPSS 24. Varimax rotation was applied to the dataset.
Five principal components were identified for the year 2000 with 73.14% of variance explained. Figure 5 shows the spatial distribution of the first three components. Component 1 accounts for 31.34% of the variance in the data. Results indicate a strong positive loading (values ≥ |0.50|) for median household income, median home value, median rent, non-Hispanic white, Hispanic, and Native Indian populations, and population living in a different state within the past 5 years. The component had negative loading for African Americans, unemployment rate, and population living in the same house within 5 years. Component 2 accounts for 20.46% of the variance with heavy loading on vacancy rate, unemployment rate, renter, and medium to high intensity of urbanization and negative loading on income, owner-occupied housing, and low developed areas. The third component explains 9.84% of the variance, with only two heavy and positive loadings for Asian population and wetland area. Component 4 accounts for 6.34% of the variance with strong positive loading for population living in different houses but the same city within 5 years. Lastly, Component 5 has 5.16% variance, with strong loading in income and vegetation cover (Table 6).
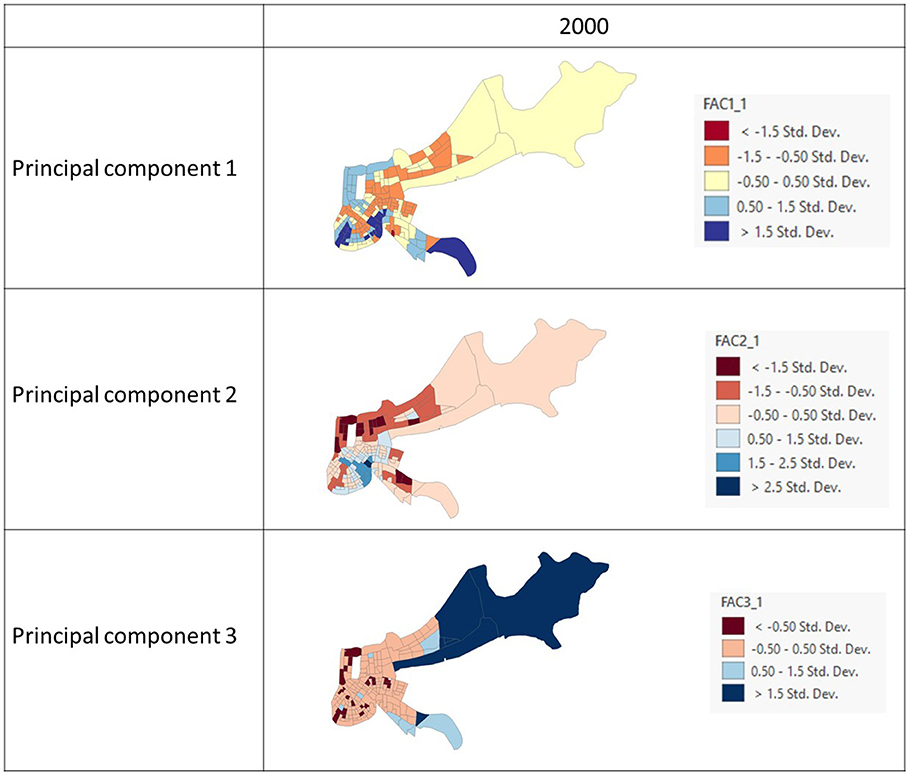
Figure 5. First three principal components for 2000. Classified by standard deviation.
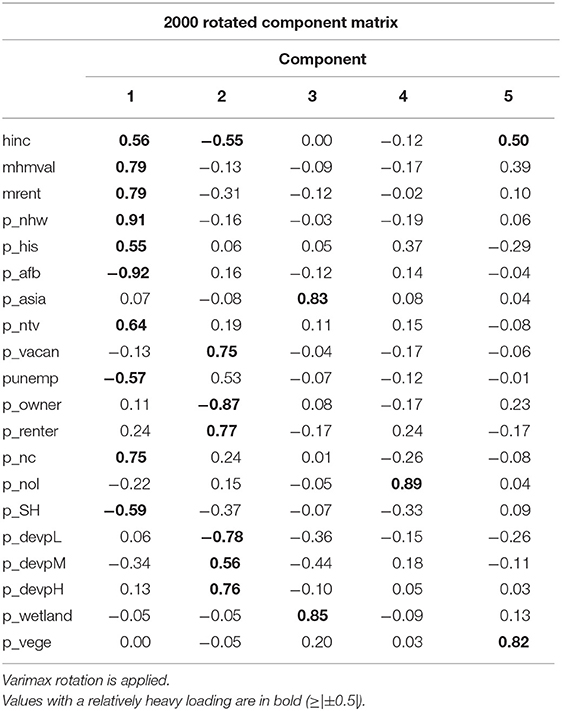
Table 6. Results of principal component analysis using data from year 2000.
The PCA after Hurricane Katrina reveals changes in the social-ecological system of New Orleans in 2009, with 71.64% of the variance explained through six components. Figure 6 shows the spatial distribution of the first three components. Component 1 accounts for 26.55% of the variance, with strong positive loading in income, home value, rent, non-Hispanic white population and negative loading in percentage of African American population and unemployment rate. Component 2 explains 15.10% of the variance and has heavy loading on renters, and medium to highly urbanized area along with negative loading on owner-occupied housing and low developed area. Component 3 accounts for 10.55% of the variance with heavy loading in Asian population and wetland area. Component 4 explains 7.56% of the variance and reflects strong positive loading in population living in the same house 1 year before and negative loading in population living in a different house in the same city 1 year before. Component 5 accounts for 5.99% of the variance with strong positive loading in Hispanic population and vacancy rate. Lastly, Component 6 accounts for 5.89%, and has heavy negative loading in newcomers and strong positive loading in population living in the same house 1 year before (Table 7).
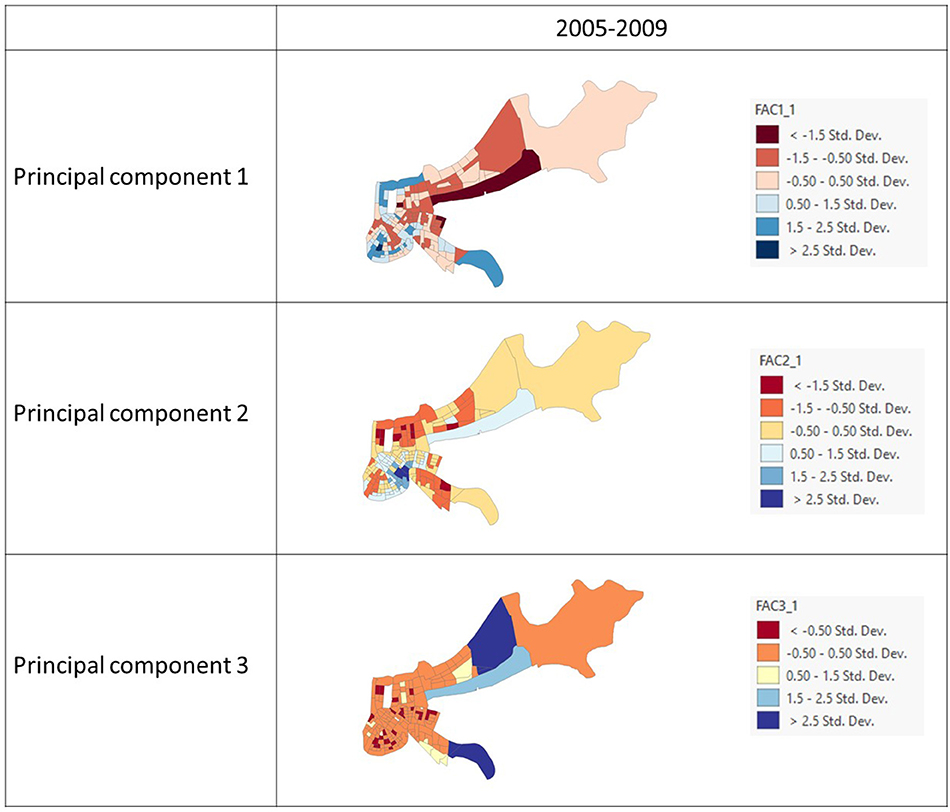
Figure 6. First three principal components for 2005–2009. Classified by standard deviation.
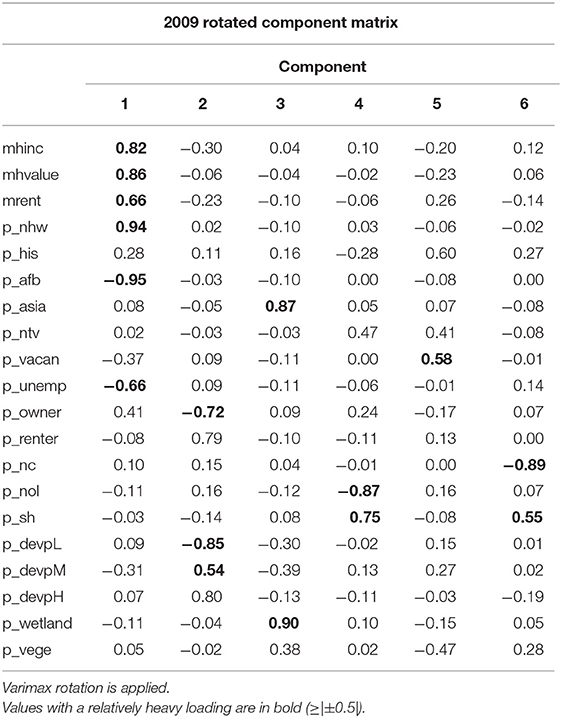
Table 7. Results of principal component analysis using data from year 2009.
In 2014, five components explained 74.05% of the variance. The spatial distribution of the first three components were mapped in Figure 7. Component 1 accounted for 29.6% of the variance, and a heavy positive loading in income, home value, rent, non-Hispanic white population, and strong negative loading in African American population, unemployment rate, and new comers. Component 2 accounts for 20.93% of the variance with strong positive loading in renter, population living in different house but the same city within 1 year and negative loading in owner-occupied housing and population living in the same house 1 year before. Component 3 explains 11.52% of the variance, and has strong positive loading in vacant rate, renter, and highly urbanized area, and strong negative loading in owner-occupied housing. Component 4 accounts for 6.14% of the variance and has heavy positive loading in percentage of Asian population and wetland area. Lastly, Component 5 that accounts for 5.87% of the variance, and has strong positive loading in percentage of Native Indian population and vegetation cover (Table 8).
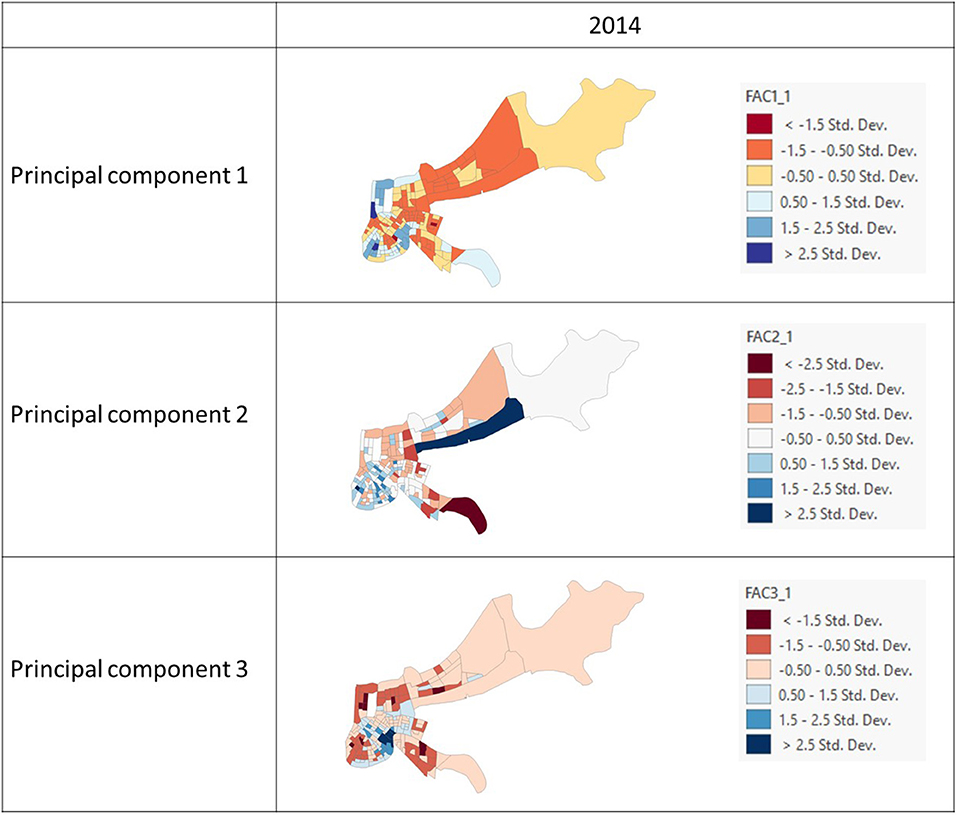
Figure 7. First three principal components for 2014. Classified by standard deviation.
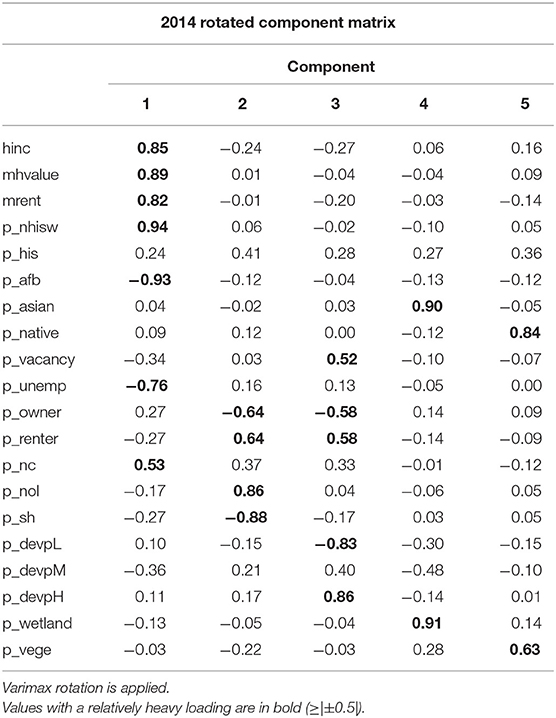
Table 8. Results of principal component analysis using data from year 2014.
Figure 8 shows the demographic change in flooded areas over time. A large proportion of African Americans live in the city and consequently, reside in flooded areas. The portion of African Americans living in the flooded areas decreased slightly after Hurricane Katrina, but they remain the largest population living in the flooded areas.
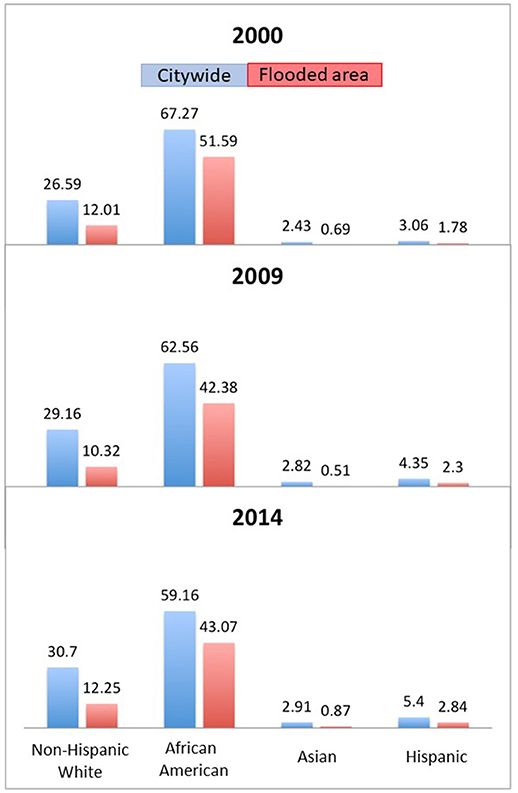
Figure 8. Demographic change in flooded areas over time.
Through investigating social, economic and environmental data temporally and spatially, we sought to better understand how the human and natural environment responded to Hurricane Katrina and how these systems reorganized and recovered from the devastating event. Hurricane Katrina decimated the City of New Orleans, and after several years of reconstruction, the city is growing with some innovations. Liu and Plyer (2010, p. 6) claim the city “has become more resilient, with increased civic capacity and new systematic reforms, better positioning the metro area to adapt and transform its future” using certain economic indicators (e. g., increase in wage and income, growing entrepreneurship). However, there was still an outstanding question as to whether all residents benefit from this? Are the environmental concerns well-understood and managed? Accordingly, there was a need for a systematic and integrated approach to evaluate changes in the social and environmental condition of New Orleans.
Income status was more stagnant between 1990 and 2000 than between 2000 and 2014. During the initial period, most of the census tracts (96 out of 173 tracts; 55.50%) were below the city's average, 64 tracts were relatively stable and wealthy and little change was evident given that only 8 neighborhoods were considered declining and 5 tracts were growing in income. Between 2000 and 2014 (encompassing the effects of Hurricane Katrina) income status became more dynamic. There were 18 neighborhoods that experienced decreasing income, 20 tracts with growing income, 48.5% (84 tracts) were below the city's average and the remaining 51 tracts were in stable wealthy status. From a paired sample t-test, the income status was significantly different after Hurricane Katrina than before (p <0.05). The increase in average income can be viewed as a sign of growth. However, when looking at the spatial distribution of neighborhoods that remained below the city's average, inner city residents were not better off after the system reorganized.
Carpenter and Brock (2008) use the term “poverty trap” as a metaphor to describe a social-ecological system's adaptive capacity. In a social-ecological poverty trap, the system has low or loose connectedness and resilience. The potential for change is not realized because the system lacks resources to reorganize and move forward (Gunderson and Holling, 2002; Westley, 2006; Carpenter and Brock, 2008). The situation in New Orleans before 2000 and before Hurricane Katrina could be described as in a “poverty trap,” such that while more than half of the neighborhoods were in a relatively low-income situation and only five Census tracts had increased income between 1990 and 2000. In the aftermath of Katrina, the dynamics of income status changed. From 2000 to 2010, there were 20 neighborhoods experiencing increased income as the average income increased in the post-Katrina era.
While bird diversity was relatively stable, land-use patterns along with economic growth in New Orleans put pressure on natural systems and potentially damaged the area's long-term sustainability (Gotham et al., 2014). After Hurricane Katrina, these environmental concerns remain and potentially undermine the social-ecological resilience of New Orleans to natural disasters. These concerns include the continuous loss of wetlands at both the city and southern Louisiana scale, high intensity of urbanization inside the city without addressing storm water and flooding issues, and loss of forests in southern Louisiana.
In 2000, social-ecological conditions were diverse (Figure 5). Wealthy populations co-existed with non-rich urban dwellers in the center of the city. Component 1 which accounts for 31.34% of variance of the data revealed that the groups/areas with high-income were non-Hispanic whites with high-property and rental value and contained a high percentage of newcomers (population who moved from other states at least 1 year prior to the survey). The areas with very high component 1 scores (> 2.5 standard deviation) were Central Business District, Lower Garden District, French Quarter, Marigny, Audubon, and New Aurora. Some of these neighborhoods (e.g., French Quarter), also contained pockets of low-income renters, living in the highly urbanized places that are positively associated with unemployment and vacancy rates. Regarding ecological characteristics, we found that income-level was positively associated with high vegetation cover. This relationship is consistent with social stratification theory, which presumes high socioeconomic status population is very likely to have more (or better access to) environmental amenities including green spaces (Grove et al., 2006; Roy Chowdhury et al., 2011).
After Hurricane Katrina, the first principal that explained the most variance across the city was primarily linked to wealthy Caucasians. Newcomers were no longer associated with Component 1 and the geography and variability in Component 1 changed (Figure 6). Central Business District, Lower Garden District, and French Quarter no longer received the highest scores (but their scores were still relatively high, compared with the rest of the city). We did not observe the highest scores in the city center but instead, the neighborhoods with the highest Component 1 scores were found in Audubon, followed by Lakeshore, Lake View, Terrace & Oaks, and New Aurora. Component 2 accounts for 15% of the variance and is characterized by renters with relatively low income in highly developed areas and in the aftermath of Katrina, high vacancy and unemployment rates were no longer key characteristics under Component 2. With regard to the spatial distribution of Component 2, the neighborhoods with highest scores were still found in the city center, suggesting that low-income and lack of ownership of housing in highly urbanized areas remains an inner-city problem. In the post-Katrina era, vacancy rate became positively associated with Hispanic population (Component 5).
After several years of recovery, the characteristics of Component 1 (wealthy Non-Hispanic White population, high percentage of newcomers, high home values and rent) became similar to pre-disaster conditions. The high scores of Component 1 were observed in Lakewood, Lakeshore, Audubon, Central Business District, and French Quarter (Figure 7). Relatively low-income renters were divided into two components—one group (Component 2) with a positive relationship with the population who did not live in the same house in the city 1 year prior to the survey, and the other (Component 3) holds positive relationships with vacancy rate and percentage of highly developed area. Interestingly, vegetation cover was no longer associated with income and instead was linked with native Indian population in 2014. Studies have shown that land abandonment or unmanaged vacant lots are the driver of emergent vegetation in New Orleans (Lewis et al., 2017) and in a shrinking city context (Schwarz et al., 2018).
Green infrastructure (natural and human made) is considered an important ecosystem service as well as an environmental amenity in many environmental studies (Green et al., 2016). Typically, quantitatively assessing the level of greenness and identifying the spatial unevenness of vegetation cover are the major approaches to evaluating provision of ecosystem services and equality. In the city of New Orleans, the amount of vegetation cover was once positively associated with household income. However, after the system reorganized, maintaining vegetation in good condition turned into a challenge in minority, low-income neighborhoods which have abandoned land. Within this context, evaluating the amount of vegetation does not provide enough information to characterize ecosystem service provision and the impact on environmental justice (Lewis et al., 2017). Moreover, the assessment of equity, which is determined by the quality of outcomes, will be more critical to better understand ecosystem services in the post-disaster era.
Natural hazards can trigger collapse but also create opportunities for systems to learn, restructure, and reorganize to manage disaster resilience. Our study examines the social and ecological condition of New Orleans (and surrounding areas) before and after Hurricane Katrina. By analyzing the change in system condition using social, economic and environmental factors, we identified some of the characteristics of the system's regrowth and reorganization trajectories. Although the ongoing population recovery may be a sign of revitalization, the city and metropolitan area continue to face socioeconomic inequalities and vulnerability to natural disasters. Our findings suggest that high poverty rates in some areas, and environmental concerns such as loss of bird diversity and wetlands, create challenges to the sustainability of the city. The spatial distribution of social-ecological conditions over time reveals certain levels of change and reorganization after Katrina, but the reorganization did not translate into greater equity.
Resilience is not static. Assessing disaster resilience requires the measurement of changing conditions and the reorganization process. Our analyses comprised three-time steps, including before and after the system was disturbed, and demonstrate an advanced approach for assessing disaster resilience. In addition to temporal aspects, we examined spatial dimensions of disaster resilience to include capturing patterns in social, economic and environmental conditions. We suggest that as high-resolution time-series data becomes available, future research should include monitoring long-term spatial heterogeneity of other environmental variables (e.g., terrestrial biodiversity, land use zoning, green space, vacant lots, and flood depth).
Disaster resilience cannot be fully understood by collecting only one-time-step data or using data that insufficiently capture the area and period of study. Accordingly, in addition to larger and finer temporal coverage, the spatial resolution is important. For instance, to address the inter-scalar interactions, it is critical to have data at both local and regional scales. In our analysis, Breeding Bird Survey data has excellent temporal resolution, however, its spatial resolution is limited. For assessment of disaster resilience, it would be useful to have ecological variables from a very fine scale (such as high-resolution Lidar data) with continuous temporal coverage. Regarding the social and economic variables, before 2009, the Census data was only available every 10 years, which reduces a researcher's ability to measure dynamics of socio-economic change. More recently, the American Community Survey began offering continuous data collections with finer temporal resolution and multiple spatial scales; hence, we were able to incorporate this data. Although the lack of available data limited our ability to perform a more complete ecosystem assessment, this work provides key advances in research for disaster resilience. In particular, introducing the dynamic, time-step analysis, employing a social-ecological resilience lens and incorporating ecological variables (where available) were significant improvements for research in disaster resilience. Lastly, we highlight the need to not only examine system conditions quantitatively, but also qualitatively (e.g., governance, or quality of the green space/green infrastructure) to link with management options.
While, this research mainly focuses on Hurricane Katrina's impact on New Orleans, our assessment of human and natural systems is not limited to the municipal scale and provides a modular framework for assessing impacts at multiple geographic scales (i.e., other variables may be added and it is possible to expand the scale and scope). Human and natural activities may occur at a particular location but impacts are not constrained by municipal boundaries; hence, understanding the cross-scale implications of social-ecological change is critically important for disaster resilience (Green et al., 2015).
W-CC conceived the original idea, designed the research, and performed the analyses. W-CC, TE, CR, and AG developed the manuscript. CR gathered and processed the Breeding Bird Survey Data from USGS.
The authors declare that the research was conducted in the absence of any commercial or financial relationships that could be construed as a potential conflict of interest.
The findings and conclusions in this manuscript have not been formally disseminated by the U.S. Environmental Protection Agency and should not be construed to represent any agency determination or policy. We thank the two reviewers for their constructive feedback that helped improve this manuscript.
Abdi, H., and Williams, L. J. (2010). Principal component analysis. Wiley Interdisc. Rev. Comput. Stat. 2, 433–459. doi: 10.1002/wics.101
Allen, C. R., Angeler, D. G., Garmestani, A. S., Gunderson, L. H., and Holling, C. S. (2014). Panarchy: theory and application. Ecosystems 17, 578–589. doi: 10.1007/s10021-013-9744-2
Angeler, D. G., Allen, C. R., Garmestani, A. S., Gunderson, L. H., and Linkov, I. (2016). Panarchy use in environmental science for risk and resilience planning. Environ. Syst. Decis. 36, 225–228. doi: 10.1007/s10669-016-9605-6
Bruneau, M., Chang, S. E., Eguchi, R. T., Lee, G. C., O'Rourke, T. D., Reinhorn, A. M., et al. (2003). A framework to quantitatively assess and enhance the seismic resilience of communities. Earthquake Spectra 19, 733–752. doi: 10.1193/1.1623497
Carpenter, S., and Brock, W. (2008). Adaptive capacity and traps. Ecol. Soc. 13, 2. doi: 10.5751/ES-02716-130240
Carpenter, S., Walker, B., Anderies, J. M., and Abel, N. (2001). From metaphor to measurement: resilience of what to what? Ecosystems 4, 765–781. doi: 10.1007/s10021-001-0045-9
Carter, N. (2005). New Orleans, Levees, and Floodwalls: Hurricane Damage Protection. Washington, DC: Congressional Research, Service.
Chuang, W. C., Garmestani, A., Eason, T. N., Spanbauer, T. L., Fried-Petersen, H. B., Roberts, C. P., et al. (2018). Enhancing quantitative approaches for assessing community resilience. J. Environ. Manage. 213, 353–362. doi: 10.1016/j.jenvman.2018.01.083
Cutter, S. L., Ash, K. D., and Emrich, C. T. (2014). The geographies of community disaster resilience. Global Environ. Change 29, 65–77. doi: 10.1016/j.gloenvcha.2014.08.005
Cutter, S. L., Barnes, L., Berry, M., Burton, C., Evans, E., Tate, E., et al. (2008). A place-based model for understanding community resilience to natural disasters. Global Environ. Change 18, 598–606. doi: 10.1016/j.gloenvcha.2008.07.013
Cutter, S. L., Boruff, B. J., and Shirley, W. L. (2003). Social vulnerability to environmental hazards. Soc. Sci. Quart. 84, 242–261. doi: 10.1111/1540-6237.8402002
Cutter, S. L., and Finch, C. (2008). Temporal and spatial changes in social vulnerability to natural hazards. Proc. Natl. Acad. Sci. U.S.A. 105, 2301–2306. doi: 10.1073/pnas.0710375105
Dixon, T. H., Amelung, F., Ferretti, A., Novali, F., Rocca, F., Dokka, R., et al. (2006). Subsidence and flooding in New Orleans. Nature 441:587. doi: 10.1038/441587a
Eakin, H., Winkels, A., and Sendzimir, J. (2009). Nested vulnerability: exploring cross-scale linkages and vulnerability teleconnections in Mexican and Vietnamese coffee systems. Environ. Sci. Policy 12, 398–412. doi: 10.1016/j.envsci.2008.09.003
Elliott, J. R., and Pais, J. (2006). Race, class, and Hurricane Katrina: social differences in human responses to disaster. Soc. Sci. Res. 35, 295–321. doi: 10.1016/j.ssresearch.2006.02.003
Fekete, A. (2009). Validation of a social vulnerability index in context to river-floods in Germany. Nat. Hazards Earth Syst. Sci. 92, 393–403. doi: 10.5194/nhess-9-393-2009
Folke, C. (2006). Resilience: the emergence of a perspective for social–ecological systems analyses. Global Environ. Change 16, 253–267. doi: 10.1016/j.gloenvcha.2006.04.002
Gallopín, G. C. (2006). Linkages between vulnerability, resilience, and adaptive capacity. Global Environ. Change 16:293–303. doi: 10.1016/j.gloenvcha.2006.02.004
Goldenberg, S. B., Landsea, C. W., Mestas-Nuñez, A. M., and Gray, W. M. (2001). The recent increase in Atlantic hurricane activity: causes and implications. Science 293, 474–479. doi: 10.1126/science.1060040
Gotham, K., and Campanella, R. (2011). Coupled vulnerability and resilience: the dynamics of cross-scale interactions in post-Katrina New Orleans. Ecol. Soc. 16:1. doi: 10.5751/ES-04292-160312
Gotham, K. F., Blum, M., and Campanella, R. (2014). Toward a new normal: trauma, diversity, and the New Orleans Urban Long-Term Research Area Exploratory (ULTRA-Ex) Project. Cities the Environ. 7:4.
Green, O.O., Garmestani, A. S., Allen, C. R., Gunderson, L. H., Ruhl, J. B., Arnold, C. A., Chaffin, B. C., et al. (2015). Barriers and bridges to the integration of social-ecological resilience and law. Front. Ecol. Environ. 13, 332–337. doi: 10.1890/140294
Green, O. O., Garmestani, A. S., Albro, S., Ban, N. C., Berland, A., Burkman, C. E., et al. (2016). Adaptive governance to promote ecosystem services in urban green spaces. Urban Ecosyst. 19, 77–93. doi: 10.1007/s11252-015-0476-2
Grove, J. M., Cadenasso, M. L., Burch, W. R., Pickett, S. T. A., Schwarz, K., O'Neil-Dunne, J., et al. (2006). Data and methods comparing social Structure and vegetation structure of urban neighborhoods in Baltimore, Maryland. Soci. Nat. Resour. 19, 117–136. doi: 10.1080/08941920500394501
Gunderson, L. H., and Holling, C. S. (2002). Panarchy : Understanding Transformations in Human and Natural Systems. Washington, DC: Island Press.
Holling, C. S. (1973). Resilience and stability of ecological systems. Ann. Rev. Ecol. Systemat. 4, 1–23. doi: 10.1146/annurev.es.04.110173.000245
Kates, R. W., Colten, C. E., Laska, S., and Leatherman, S. P. (2006). Reconstruction of New Orleans after Hurricane Katrina: a research perspective. Proc. Natl. Acad. Sci. U.S.A. 103, 14653–14660. doi: 10.1073/pnas.0605726103
Kelly, P. M., and Adger, W. N. (2000). Theory and practice in assessing vulnerability to climate change and facilitating adaptation. Clim. Change 47, 325–352. doi: 10.1023/A:1005627828199
Lewis, J. A., Zipperer, W. C., Ernstson, H., Bernik, B., Hazen, R., Elmqvist, T., et al. (2017). Socioecological disparities in New Orleans following Hurricane Katrina. Ecosphere 8, 1–24. doi: 10.1002/ecs2.1922
Liu, A., and Plyer, A. (2010). An Overview of Greater New Orleans: From Recovery to Transformation. New Orleans Index at Five. Washington, DC: Brookings Institution and Greater New Orleans Community Data Center.
Logan, J. (2006). The Impact of Katrina: Race and Class in Storm-Damaged Neighborhoods: Spatial Structures in the Social Science, Providence: Brown University.
Logan, J. R., Issar, S., and Xu, Z. (2016). Trapped in Place? Segmented resilience to hurricanes in the Gulf coast, 1970-2005. Demography 53, 1511–1534. doi: 10.1007/s13524-016-0496-4
Meehl, G. A., and Tebaldi, C. (2004). More Intense, more frequent, and longer lasting heat waves in the 21st Century. Science 305, 994–997. doi: 10.1126/science.1098704
NOAA. (2017). Regional Land Cover Classification Scheme. NOAA.Available online at: https://coast.noaa.gov/data/digitalcoast/pdf/ccap-class-scheme-regional.pdf (accessed May 22, 2017).
NOAA. (2018). What is Resilience?” National Ocean Service, NOAA.Available online at: https://oceanservice.noaa.gov/facts/resilience.html (accessed April 25, 2018).
Norris, F. H., Stevens, S. P., Pfefferbaum, B., Wyche, K. F., and Pfefferbaum, R. L. (2008). Community resilience as a metaphor, theory, set of capacities, and strategy for disaster readiness. Am. J. Community Psychol. 411–412, 127–150. doi: 10.1007/s10464-007-9156-6
Opdyke, A., Javernick-Will, A., and Koschmann, M. (2017). Infrastructure hazard resilience trends: an analysis of 25 years of research. Nat. Hazards 872, 773–789. doi: 10.1007/s11069-017-2792-8
Roy Chowdhury, R., Larson, K., Grove, M., Polsky, C., Cook, E., Onsted, J., et al. (2011). A Multi-scalar approach to theorizing socio-ecological dynamics of urban residential landscapes. Cities Environ. 4, 6–19. doi: 10.15365/cate.4162011
Schwarz, K., Berland, A., and Herrmann, D. L. (2018). Green, but not just? Rethinking environmental justice indicators in shrinking cities. Sustain. Cities Soc. 41, 816–821. doi: 10.1016/j.scs.2018.06.026
Sikula, N. R., Mancillas, J. W., Linkov, I., and McDonagh, J. A. (2015). Risk management is not enough: a conceptual model for resilience and adaptation-based vulnerability assessments. Environ. Syst. Decisions 35, 219–228. doi: 10.1007/s10669-015-9552-7
Summers, J. K., Smith, L. M., Harwell, L. C., and Buck, K. D. (2017). Conceptualizing holistic community resilience to climate events: foundation for a climate resilience screening index. GeoHealth 1, 151–164. doi: 10.1002/2016GH000047
Timmerman, P. (1981). Vulnerability, Resilience and the Collapse of Society. Toronto, ON: Institute for Environmental Studies, University of Toronto.
Turner II, B. L., Kasperson, R. E., Matson, P. A., McCarthy, J. J., Corell, R. W., Christensen, L., et al. (2003). A framework for vulnerability analysis in sustainability science. Proc. Natl. Acad. Sci. U.S.A. 100:8074. doi: 10.1073/pnas.1231335100
US Census Bureau (2017). Community Facts-New Orleans City, Louisiana. Available online at: https://factfinder.census.gov/faces/nav/jsf/pages/community_facts.xhtml?src=bkmk (accessed Jume 23, 2017).
US Department of Housing Urban Development (2014). HUD Launches $1 Billion national Disaster Resilience Competition. US Department of Housing and Urban Development. Available online at: https://archives.hud.gov/news/2014/pr14-109.cfm (accessed August 25, 2018).
van der Leeuw, S. (2013). “Resilience and patterns of change,” in Sustainable World, ed. S. Remington-Doucette (Dubuque, IA: Kendall Hunt).
Walker, B., and Salt, D. (2006). Resilience Thinking: Sustaining Ecosystems and People in a Changing World. Washington, DC: Washington: Island Press.
Webster, P. J., Holland, G. J., Curry, J. A., and Chang, H. (2005). Changes in tropical cyclone number, duration, and intensity in a warming environment. Science 309, 1844–1846. doi: 10.1126/science.1116448
Wisner, B. (2004). “Assessment of capability and vulnerability,” in Mapping Vulnerability : Disasters, Development, and People, eds. G. Bankoff, G. Frerks, and D. Hilhorst (London: Earthscan).
Keywords: Hurricane Katrina, New Orleans, disaster resilience, natural hazards, social-ecological systems
Citation: Chuang W-C, Eason T, Garmestani A and Roberts C (2019) Impact of Hurricane Katrina on the Coastal Systems of Southern Louisiana. Front. Environ. Sci. 7:68. doi: 10.3389/fenvs.2019.00068
Received: 25 October 2018; Accepted: 06 May 2019;
Published: 12 June 2019.
Edited by:
Antarpreet Jutla, West Virginia University, United StatesReviewed by:
Gulnihal Ozbay, Delaware State University, United StatesCopyright © 2019 Chuang, Eason, Garmestani and Roberts. This is an open-access article distributed under the terms of the Creative Commons Attribution License (CC BY). The use, distribution or reproduction in other forums is permitted, provided the original author(s) and the copyright owner(s) are credited and that the original publication in this journal is cited, in accordance with accepted academic practice. No use, distribution or reproduction is permitted which does not comply with these terms.
*Correspondence: Ahjond Garmestani, Z2FybWVzdGFuaS5haGpvbmRAZXBhLmdvdg==
Disclaimer: All claims expressed in this article are solely those of the authors and do not necessarily represent those of their affiliated organizations, or those of the publisher, the editors and the reviewers. Any product that may be evaluated in this article or claim that may be made by its manufacturer is not guaranteed or endorsed by the publisher.
Research integrity at Frontiers
Learn more about the work of our research integrity team to safeguard the quality of each article we publish.