 Johan Neirynck
 Arne Verstraeten
- Research Institute for Nature and Forest, Geraardsbergen, Belgium
A 10-year long dataset of half-hourly ozone (O3) fluxes was used to study the variability in deposition velocity (υd) over a mixed temperate suburban forest. Average (median) υd amounted to 0.70 (0.46) cm s−1, with day- and night-time average (median) of 0.98 (0.73) cm s−1 and 0.46 (0.30) cm s−1, respectively. It was found that the precipitation form had a marked impact on υd and the deposition efficiency (υd/υdmax), with highest values measured when the canopy was dew-wetted or covered with snow. The analysis further evidenced that traffic volume led to increased deposition due to the presence of chemical reactions between O3 and nitric oxide (NO) above the canopy surface. During the working week, daytime values of υd, υd/υdmax and the O3 fluxes (F) were found to be significantly higher than the weekend values, especially during the winter half-year. In a next step, half hourly deposition data were aggregated into day- and night-time monthly values, for a correlative study with measured environmental variables. Monthly average night-time/daytime υd and υd/υdmax were positively correlated with the relative humidity at the canopy surface (RH(z0′)) and negatively correlated with the water levels below the ground surface. During the daytime, monthly υd and υd/υdmax were additionally increased during the working-week when traffic volume was high. There existed, however, substantially different weather conditions, in which unaccounted covariates with a totally different meteorological signature controlled the υd and F. It was speculated that, among other, biogenic volatile compounds (BVOCs) could have contributed to O3 quenching in some (spring) months with severe drought stress.
Introduction
Tropospheric ozone (O3) is a major secondary air pollutant, whose formation occurs when its precursor gases, nitrogen oxides (NOx) and volatile organic compounds (VOCs) react in the atmosphere in the presence of sunlight (Ashmore, 2005). Tropospheric O3 is also considered as the third most important contributor to positive greenhouse radiative forcing (IPCC, 2007). Exposure of tropospheric O3 has been shown to have a direct adverse impact on human health (WHO, 2008) and to be harmful for crop production and forest vitality in many regions of the Northern Hemisphere (Fowler et al., 2009).
Dry deposition by terrestrial landforms is an important removal process of O3, but dry deposition rates strongly vary among land cover classes (Hardacre et al., 2015). Due to higher turbulence intensity above forest canopies, pollutants can be more readily trapped compared to smooth vegetation (Fowler et al., 1999). There is a paucity of long-term measurements of O3 deposition over forest vegetation (Mikkelsen et al., 2004; Fares et al., 2010; Rannik et al., 2012) but long-term series are important to study the O3 dry deposition processes in different climatic and environmental conditions. In addition, new findings regarding O3 dry deposition schemes must be incorporated in climate models, to assess effects of future climate scenarios on O3 removal and to predict future vegetative exposure to O3 under climate change and projected precursor emission reductions (Klingberg et al., 2014; Mills et al., 2016; Zhang et al., 2016; Franz et al., 2017; Sicard et al., 2017). Ozone induced damage may disrupt the hydrological cycle and key biogeochemical cycles, including those of carbon and nitrogen (Schreuder et al., 2001; Paoletti and Grulke, 2010; de Vries et al., 2014; Hoshika et al., 2015; Franz et al., 2017). Overall adverse effects of O3 exposure might threat the global terrestrial biodiversity (Fuhrer et al., 2016).
Non-stomatal dry deposition is increasingly been recognized to be crucial for removal of O3 from the atmosphere (Altimir et al., 2006; Fares et al., 2010; Clifton et al., 2017). There exist, however, multiple pathways of non-stomatal deposition (Cape et al., 2009; Fowler et al., 2009) and this knowledge is required for inclusion in current model parameterizations. A previous analysis of O3 dry deposition at our site confirmed the importance of non-stomatal deposition (Neirynck et al., 2012). It was found that canopy wetness enhanced the deposition on external surfaces. It was evident, however, that also other unaccounted environmental variables contributed to the large variability in dry deposition velocity and the way environmental variables interacted was still a matter of conjecture.
In this study, we analyzed a long-term dataset of O3 fluxes over a suburban temperate mixed forest, acquired from profile measurements. The study aimed especially to elucidate the high variability in dry deposition rates. Attention was paid to the impact of canopy wetness and the traffic volume on the O3 deposition velocity across the seasons and years. A correlative data-analysis on monthly basis was performed to explore new site-specific relations between the O3 deposition and measured environmental variables.
Materials and Methods
Site Characteristics
The study was conducted in a mixed coniferous/deciduous forest (51°18′ N, 4°31′ E) near the town of Antwerp, located 10 km to the W from the study site. The forest has a cover of about 300 ha and is nearly uniform in height. It is bordered to the North and West by a residential area within a radius of ca. 500 m (Neirynck et al., 2007). To the South and East, the forested fetch extends over 2 km, before the landscape turns into an agricultural area. The landscape is flat, with a gentle (0.3%) slope at a mean elevation of 16 m. The climate is temperate maritime with a mean annual temperature of 10.8 ± 0.8°C recorded over the period 1996–2015. Annual precipitation averaged 833 ± 112 mm. South-westerly winds are prevailing (>30%).
A 40m high welded scaffold tower is situated in a 2 ha Scots pine (Pinus sylvestris L.) stand, planted on former heathland in 1929. Other Scots pine stands can be found in the close vicinity of the measurement tower. More distant from the tower (>300 m), forest patches consist of deciduous [mainly pedunculate oak (Quercus robur L.) planted in 1936] as well as coniferous species (mainly Scots pine). The tower is located next to a Level II monitoring plot of the pan-European UNECE ICP Forests network and also featured in the CARBOEUROPE and NITROEUROPE research networks. The stand has an open canopy and a mean height of 21 m. Height growth is negligible (±1 m over 2 decades). The soils supporting the pine trees are Aeolian Coversand layers (Dryas III) with a high sand content >95% (Arenosol). These sandy layers are overlying a substratum of Clay of the Campine (Early Pleistocene Tiglian stage, >40 % clay content), which depth varies between 0.6 and 2 m. A perched water table is present at a variable depth ranging between 0.5 and 3.0 m.
The forest is exposed to different emission sources (Neirynck et al., 2005, 2007). Westerly winds bring sulfur dioxide (SO2), anthropogenic VOCs and soot bearing air masses, coming either from the petrochemical industry, power plants or other industrial companies situated at the port of Antwerp (15 km to the W). Road traffic and (petro)chemical companies at Antwerp port are also contributing to the high NOx load at the site. Closer to the site, vehicle exhaust emissions from traffic in the adjacent residential areas and the southerly situated E19 highway (2 km) are the main NOx emitters. North-easterly winds transport ammonia(NH3)-bearing air masses, originating from agricultural activities, over the forest. The forest area is also considered to be a source of biogenic VOCs as emitter of monoterpenes from pine trees and isoprenes from oak trees.
Meteorological and O3 Measurements
Measurements of atmospheric chemistry and meteorology have been conducted at the tower since mid-1995. Air temperature and humidity (HMP 230 dew point transmitter and PT100, Vaisala, Finland) have been measured in aspirated radiation shields at a height of 2, 24, and 40 m. Wind speed has been measured using cup anemometers (LISA cup anemometer, Siggelkow GMBH, Germany) at 24, 32, and 40 m. At the top of the tower, ingoing and outgoing shortwave and long wave radiation measurements are made by a radiometer (CNR1, pyranometer/pyrgeometer, Kipp and Zonen, the Netherlands). Rainfall is registered by a tipping bucket rain gauge (NINA precipitation pulse transmitter, Siggelkow GMBH, Germany). The leaf wetness is judged by a combination of uncoated leaf wetness grid sensors (Model 237F, Campbell Scientific, Logan, UK) and dielectric Leaf Wetness Sensor (LWS, Decagon devices, USA), which are mounted on a 3-m long boom at the 18 m platform and directed into the canopy. Soil temperature was measured at 2 and 9 cm below soil surface with temperature probes (Didcot DPS-404, UK). Ground water table depth was measured using a PDCR11830 Pressure Transducer (Campbell Scientific, UK).
A fast response infrared gas analyzer (model LI-6262, LI-COR Inc., Lincoln, NE, USA) and a three-dimensional sonic anemometer (model SOLENT, 1012R2, Gill Instruments, Lymington, UK) were installed and operational within the scope of FLUXNET network (http://fluxnet.fluxdata.org/). For a detailed description of the Eddy Covariance set-up see Carrara et al. (2003).
Ambient air is drawn from two inlets above the canopy (24 and 40 m) through 53.5-m Teflon sampling tubes with a flow rate of 60 L min−1. Prior to transport, air is filtered through 0.5 mm teflon filter housings, which are covered with a rain shield and mounted at the end of a 1.5-m long boom. The Teflon tubings (external diameter 9.5 mm) are wrapped with 47 mm-isolated housings and heated to 35°C using an electric heating wire. Each inlet is sampled for 5 min before switching to the next inlet using a PLC controlled valve system. Readings of the first minute from every inlet are discarded as sample tubes need to be flushed. Air samples are led toward a manifold in the air conditioned instrument shelter perched on the concrete base of the scaffolding. From the manifold, air is sampled by the monitor, after passing a 0.5 μm filter placed before the sample inlet, removing the smaller dust and soot particles. Ozone concentrations have been measured using a UV Photometric Analyser (period 2000–2007: model TEI 49C, Thermo Environmental Instruments, USA (detection limit: 1 ppb, precision: 0.5 ppb); later replaced by model TEI 49I, Thermo Environmental Instruments, USA (detection limit: 1 ppb, precision: 0.25 ppb). Gaseous NOx (NO + NO2 (nitric oxide and nitrogen dioxide, respectively)) concentrations have been analyzed with a chemiluminescence monitor (CLD700 AL, Ecophysics, Switzerland).
Calculation of Fluxes and Resistances
Fluxes (F) are calculated from the Businger-Dyer flux-profile relationships (Businger et al., 1970; Dyer and Hicks, 1970):
where F is the flux (deposition is defined as negative flux) obtained by multiplying the O3 gradient from the 24 and 40 m height interval and K, the turbulent diffusivity, which is calculated as:
In this formula κ (the von Karman constant) is 0.41, z is the geometric mean of the measurement heights (29.7 m), d is the zero plane displacement (17.1 m = 0.8 times the average tree height) and u* is the friction velocity determined as the square root of the kinematic momentum flux measured by eddy covariance (measuring height 41 m). In order to account for stability effects, the universal flux-profile relationships for heat transfer (Øh) are applied (Dyer and Hicks, 1970). Because the concentration measurements are made in the roughness sublayer, turbulent diffusivities estimated by Equation (2) are corrected by a factor α (= 0.86) to allow for wake turbulence generated above the canopy (Bosveld, 1991):
where L is the Obukhov length (Monin and Obukhov, 1954) and (z-d)/L is the dimensionless stability parameter.
The deposition velocity (υd) is obtained from the measured flux (F) by dividing F by difference in the concentration C(z-d) of the measured gradient at z-d (geometric mean of the gradient) and the O3 concentration inside the leaves C0.
Since O3 doesn't leave behind any residue in the substomate according to the current knowledge, C0 is assumed to be zero. The reciprocal of υd is called the total resistance (Rt) and is defined as the sum of the aerodynamic resistance (Ra), the quasi-laminar boundary layer resistance (Rb) and the canopy resistance (Rc).
The aerodynamic resistance (Ra) is calculated according to Garland (1978):
where z0 = roughness length (1.5 m), and Ψh is the integrated stability correction for heat, estimated following (Beljaars and Holtslag, 1990):
The quasi-laminar sublayer resistance Rb is species-dependent and estimated using semi-empirical relationships presented by Hicks et al. (1987):
Where Sc and Pr are the Schmidt and Prandtl numbers, respectively.
The efficiency of the canopy surface for pollutant uptake is generally approximated by calculating the canopy resistance (Rc) as inverse of υd(z-d) minus the atmospheric resistances Ra(z-d) and Rb:
The application of this equation fails when emission fluxes are measured. Instead of using the Rc, the deposition efficiency was used as metric for the canopy sink strength. The latter is defined as the ratio of the υd to the maximum deposition allowed by turbulence, υdmax, which was calculated as follows:
The “surface” temperature (T(z0′)) and water vapor pressure (e(z0′)) were computed from measured micrometeorological fluxes of both sensible (H, W m−2) and latent heat (λE, J m−2 s−1), following Monteith and Unsworth (1990):
And
where T is ambient temperature (°C), e is water vapor pressure (kPa), p is atmospheric pressure (kPa), E is the water vapor flux (kPa m s−1), Cp is specific heat of moist air (kJ kg−1 °C−1), ε is the ratio of the molecular weight of water to the mean molecular weight of dry air (18/29) and ρ is the air density (g m−3). The surface relative humidity (RH(z0′)) is given by:
where esat(T(z0′)) is the saturation water vapor pressure at T(z0′).
Data Handling, Analysis and Statistics
Prior to data analysis, data were checked to allow a proper use of flux-gradient theory. In order to reduce the relative errors in the concentration gradients, concentrations below 1 ppb were excluded. Friction velocities below 0.1 m s−1 were rejected as flux-profile relationships might probably be invalid. To avoid non-stationarity problems, data were excluded for which half-hour changes in concentrations led to changes in υd exceeding 0.01 m s−1 (|(z-d)/c*(dc/dt)| > 0.01 m s−1). Outliers in the data were removed, rejecting any υd exceeding υdmax, by more than a factor of two.
The flux triad NO-NO2-O3 is subjected to (photo-)chemical reactions, which might lead to chemical sources and sinks of these gases within the layer represented by the measurements. In order to judge possible vertical flux divergence between the surface and the measuring height due to the presence of chemical reactions, the Damköhler number (DA) (Damköhler, 1940) is applied. DA is calculated as the ratio of the transport time (τtrans) and the characteristic chemical timescale (τchem):
The formula for transport time (τtrans) above the canopy was adopted from Garland (1978)
The chemical reaction time for the NO-O3-NO2 triad (τchem) was estimated according Lenschow (1982):
where kr (= 44.4 exp(−1370/(T + 273.15)) in ppm−1 s−1 is the reaction rate of the titration reaction of O3 with NO and jNO2 is the photolysis frequency.
A DA number above unity implies that chemical reactions occur significantly faster than the turbulent transport (flux divergence), whereas DA smaller than 0.1 indicates that the chemistry is too slow to affect the gradients. The range in between is considered as a critical range, where an impact of chemistry cannot be excluded (Stella et al., 2012). In addition, τdeplO3, the characteristic chemical depletion time for O3 was calculated according to Vilà-Guerau de Arellano and Duynkerke (1992) as:
Data on fluxes and deposition velocities were binned according to time of the day, traffic volume (working week with high NOx levels vs. weekend) and canopy wetness. The differentiation between day and night was based on solar radiation using a threshold of 50 W m−2. Winter half-year (dormant season) was defined as the period running from October till March. Data were further subdivided into five broad macroscopic wetness classes representing differences in the nature of precipitation:
- Dry canopy: reading leaf wetness sensor = 0; absence of visible (macroscopic) wetness but thin moisture films or deliquescent particles might still occur;
- Dew-wetted canopy: reading leaf wetness sensor > 0 but no important preceding rainfall;
- Rain-wetted canopy: contained following cases: rainfall recorded by rain gauge reading leaf wetness sensor > 0 due to precipitation in preceding 4 h (> 1 mm)
- Frost: in case temperatures dropped below 0°C
- Snow: freezing conditions accompanied by a significant change in albedo index (from 9% till 20% and higher), indicating the presence of a (shallow) snow cover on the canopy or the forest soil.
Statistical analyses were performed with R 3.2.2 (R Development Core Team, 2015). Data were aggregated on monthly basis for daytime and night-time conditions. An analysis of covariance (ANCOVA) was conducted with one nominal variable (traffic volume) and continuous predictor variables (maximum amount of allowed turbulence (υdmax), vapor pressure deficit (VPD), relative humidity and temperature at the canopy surface (RH(z0′) and T(z0′), resp.), level of water below ground surface (gwt), soil temperature (Ts), solar radiation (Sun), precipitation amount and interactions between them. Prior to the ANCOVA, collinearity was detected using pairwise scatterplots and variance inflation factors (VIF). Variables with VIF values above 3 were rejected for further analysis. The final model was obtained using a backward elimination procedure starting from a full (linear or GAM) model. Differences among wetness categories or traffic volume were verified using a Kruskal–Wallis test.
Results
Impact of Traffic Volume and Canopy Wetness on Half Hourly Deposition Velocity
A dataset of 125,097 half-hourly fluxes was retained for statistical analysis for the period April 2005–December 2015, implying a data coverage of 67%. The long-term average (median) O3 flux (F) from the selected dataset was −0.142 (−0.088) ppb m s−1, corresponding to an average (median) O3 concentration of 24.8 (23.4) ppb and υd of 0.70 (0.46) cm s−1. Eleven per cent of the F were upward and they occurred especially during the winter nights (Table 1).
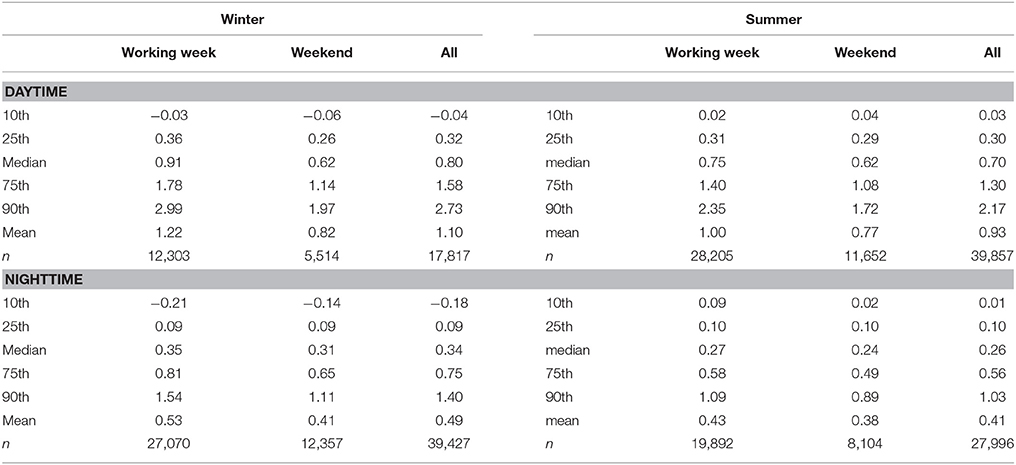
Table 1. Percentile distribution of half-hourly deposition velocities (υd) during the period April 2005 till December 2015 (in cm s−1).
Average υd during the summer half-year was 0.93 and 0.41 cm s−1 for daytime and night-time, respectively. During the winter half-year, measured average υd were found to be slightly higher (1.1 and 0.49 cm s−1, for daytime and night-time respectively). During the daytime, high traffic volume significantly (p < 0.0001) increased υd, with larger values especially being measured during the winter working-days (1.22 cm s−1), when a larger chemical sink of NO was present (Figure 1). The lower daytime winter υds during the weekend (0.82 cm s−1) were partly outweighed by higher weekend O3 concentrations (3–4 ppbv) (Figure 1). Daytime differences in υd due to traffic volume were less marked during the summer half-year but still significant (1.0 vs. 0.77 cm s−1 for working-days and weekends, respectively, p < 0.0001). Impact of traffic volume on night-time υd was smaller and only significant during the winter half-year (p < 0.0001).
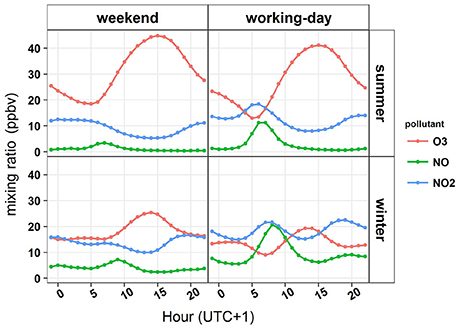
Figure 1. Mean diurnal cycles of NO, NO2, and O3 hourly mixing ratios during the summer and winter half year depending on traffic volume, averaged over the period 2005–2015 (in ppbv).
The impact of traffic volume became also evident when data were further binned into five canopy wetness categories, for which a dry (52% of all cases) and dew-wetted canopy (33% of all cases) were the most prominent (Figure 2, Table 2). During the weekend, when the chemical sink was low, largest daytime υd values (± 1 cm s−1) were observed when the canopy was dew-wetted or when soil/canopy was covered with snow. During the working-week, υds substantially rose as a consequence of the enhanced traffic volume in the neighborhood and/or the increased NOx load originating for Antwerp port (Figures 1, 2). The enhancement was especially evident during the winter working-days (Table 2), with average υds for all canopy wetness classes being increased by 50% (compared to 30 % during the summer working-days). The shape of the diurnal patterns strongly depended on season and canopy wetness. During the summer half-year, it was found that the daily course of υd was skewed toward the morning hours for a dry and dew-wetted canopy (Figure 2). There was a steep rise in υd from 4:00 ‘o clock onwards with a peak at 8:00, followed by a gentle linear decline toward a nocturnal level, coinciding with stomatal closure. During the winter half-year, the curve of υd was rather bell-shaped with a broad peak at 10:00 (dry or dew wetted) or at noon (rain, frost, snow), rather following the course of mechanical turbulence.
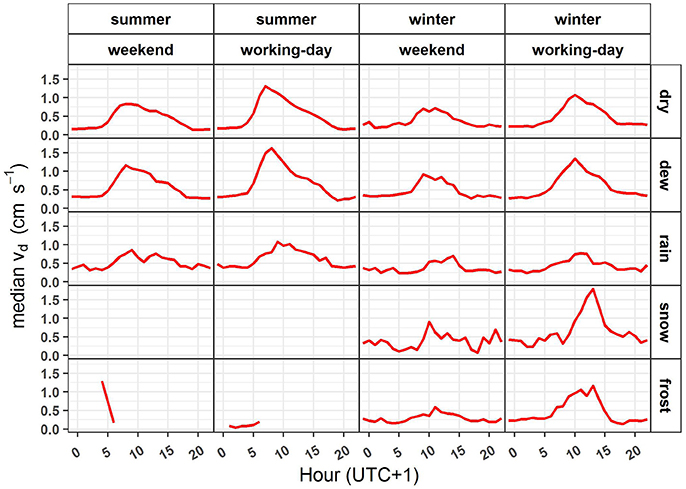
Figure 2. Hourly median diurnal cycle in ozone deposition velocity (υd) for 5 different canopy wetness categories/ surface classes (dry, dew, rain, snow and frost) during different seasons subdivided into weekend and working-weeks (in cm s−1).
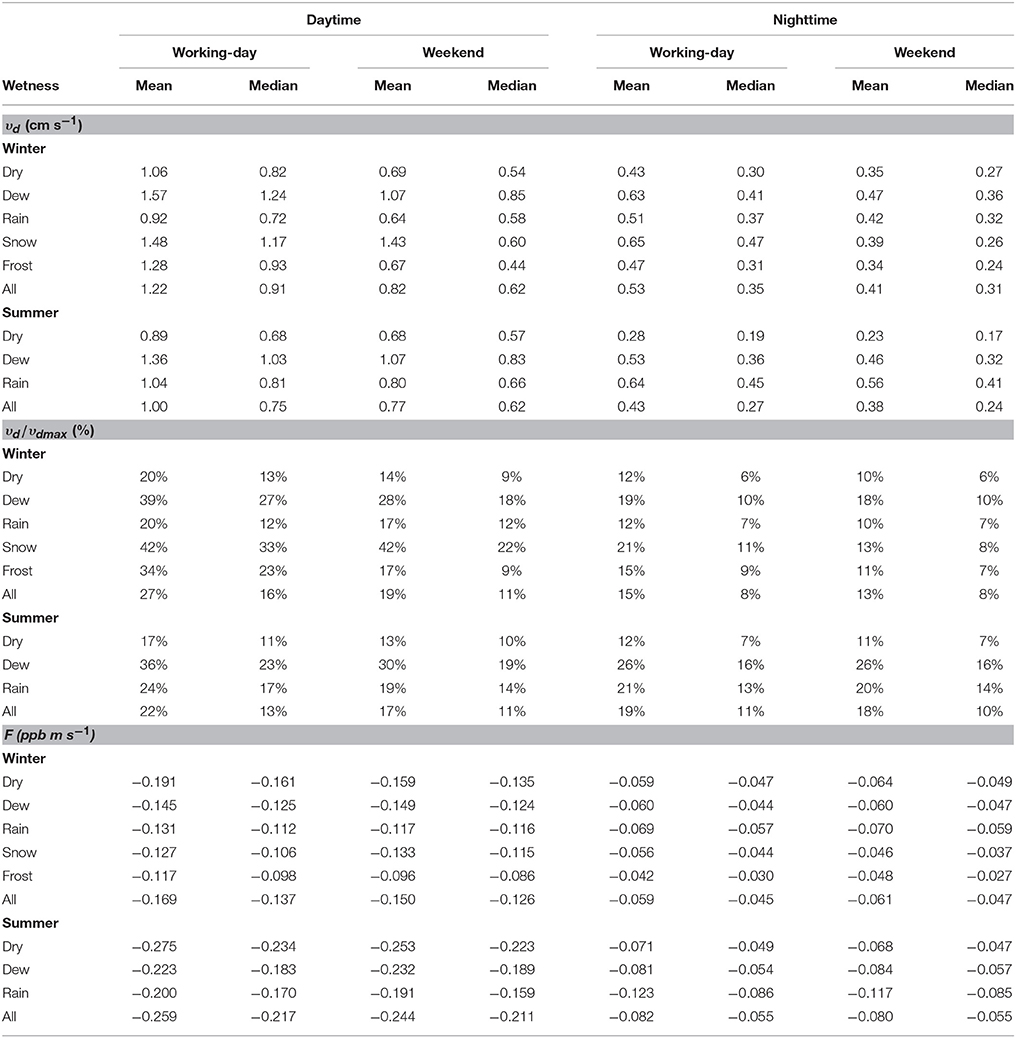
Table 2. Mean and median values for half-hourly deposition velocity υd (cm s−1), deposition efficiency (υd/υdmax, %) and flux F (ppb m s−1) binned into different classes of canopy wetness, traffic volume, season and time of day.
The findings about υd were further corroborated by expressing υd as proportion of the maximum amount available for deposition (υdmax), which might differ among wetness classes or seasons (Table 2). Average deposition efficiency (υd/υdmax), increased from 19% till 27%, due to increased traffic volume during the winter daytime. The enhancement of υd/υdmax during the summer daytime hours was less marked but still significant (p < 0.0001). The night-time υd/υdmax was only affected during the winter working-weeks because of more elevated NO values during the evening commuting hours (Figure 1). The υd/υdmax increased for all canopy wetness categories, except for snow conditions for which available data were scarce (<1%). Due to differences in turbulent regime, differences in υd/υdmax among dew-wetted, dry or rain-wetted canopy wetness categories were more explicit than when only υd was considered. During the daytime, υd/υdmax for a dew-wetted canopy was found to be almost twice as high compared to a dry or rain wetted canopy. A rain-wetted canopy became a more efficient sink during the summer nights compared to the winter nights.
Average daytime fluxes (F) were 13 and 6% higher during winter and summer working-weeks, respectively (Table 2). Nocturnal F were not affected by traffic volume, as lower υds during the weekend were outweighed by concomitant higher O3 concentrations. The 10-year hourly median DA numbers varied between 0.4 and 0.8, implying that chemical reactions between O3 and NO between the canopy surface and the measuring height might have occurred, especially during the daytime (Figure 3). The third quartile values and 90 percentile values from the DA numbers exceeded 1, especially during the night-time (due to low turbulence, high τtrans) and the commuting hours, indicating that a flux divergence for the NO–NO2-O3 triad was evident above the canopy. The long-term median timescale for O3 depletion (τdeplO3) amounted to 3753 s (63 min) and 1665 s (28 min) for weekends and working-days, respectively. This implied that half-hourly gradients were especially affected when traffic volume was high (higher NO concentrations). The lowest long-term median τdeplO3 was calculated for nocturnal winter working-days [956 s (16 min)], daytime winter working-days [1014 s (17 min)] and daytime summer working-days [2356 s (39 min)]. In these conditions, the highest enhancement of the deposition metrics occurred (Table 2).
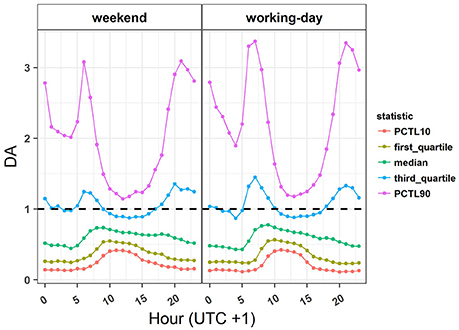
Figure 3. Mean diurnal cycles of 10, 25, 50, 75, and 90th percentile Damköhler numbers depending on traffic volume, averaged over the period 2005–2015.
With regard to the flux magnitude, dry and dew-wetted canopies trapped most of the O3 during the daytime. At night, the dry deposition flux was still found to be substantial and be the highest for rain-wetted canopies.
Monthly Variability in υd
A high monthly variability in daytime υds was observed throughout the year, with higher υds measured during the months September, October, November and January (Figure 4). The impact of traffic volume was pronounced during the daytime and especially during the winter half-year. The annual pattern during the night-time was less marked compared to daytime conditions, but also increased daily υds were measured during the months September, October and November. Impact of traffic volume on monthly variability was less pronounced during the night-time and confined to the winter half-year. The increased υds toward autumnal months cannot be explained by increased turbulence, since υdmax tended to reach minimum values during these months, especially during the daytime (Figure 4).
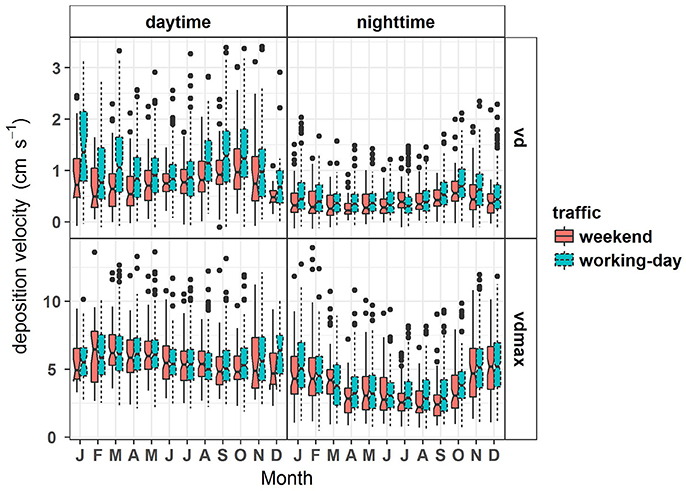
Figure 4. Annual pattern of daily deposition velocity (υd) and daily maximum deposition velocity allowed by turbulence (υdmax) for weekends and working-days during daytime/nighttime from April 2005 till December 2015 (in cm s−1). The box shows the interquartile range (IQR) of the daily υd or υdmax for a given month. The whiskers add 1.5 times the IQR to the 75 percentile and subtract 1.5 times the IQR from the 25 percentile. The “Notch” displays the confidence interval around the median which is normally based on the median ± 1.57 × IQR/√n. If two boxes' notches do not overlap there is “strong evidence” (95% confidence) their medians differ.
The υd was also subjected to a large interannual variability, with higher υds reached in 2010 and 2011 (Figure 5A). Measured annual mean υd in the latter years amounted to 1.06 and 0.84 cm s−1, respectively, which is considerably higher than the long-term mean of 0.7 cm s−1. Lowest annual mean υd was measured during 2006 and 2014 (resp. 0.52 and 0.55 cm s−1).
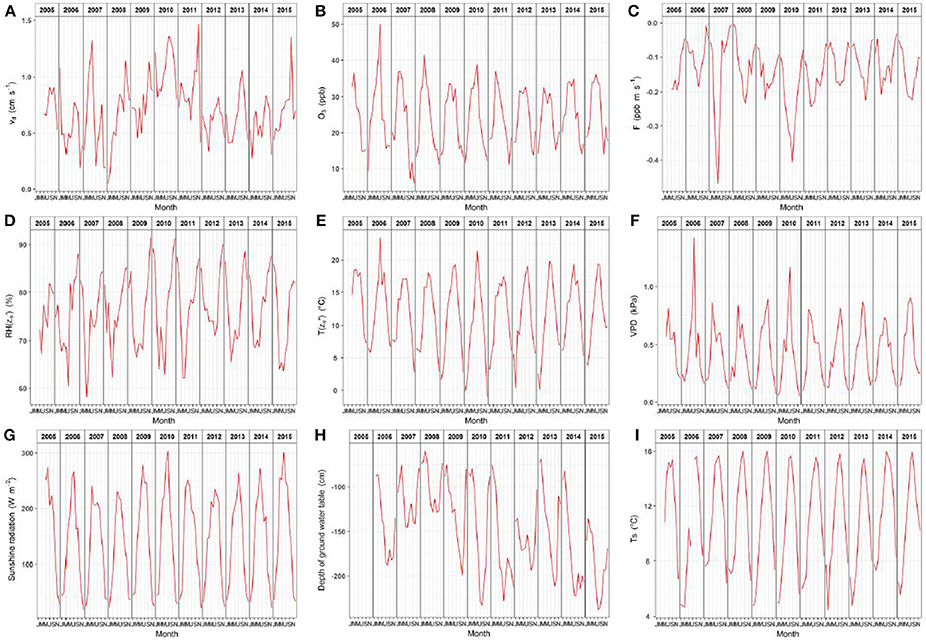
Figure 5. Time series of the monthly (A) deposition velocity (υd), (B) ozone mixing ratio (O3), (C) ozone flux (F), (D) relative humidity at the leaf surface (RH(z0′)), (E) temperature at the leaf surface (T(z0′), (F) vapor pressure deficit (VPD), (G) solar radiation, (H) depth of ground water table, (I) soil temperature (Ts) over the entire period April 2005 to December 2015.
Results of the analysis of covariance revealed the significant impact of traffic volume, relative humidity and level of ground water table on υd and υd/υdmax without interactions implying that effects were probably mainly acting in an additive way (Figures 6A,B, 7A,B, Table 3). Impact of traffic was more explicit during the daytime analysis, where traffic volume increased the υd by 0.296 cm s−1 (p < 0.0001). The analysis further revealed a positive correlation with RH(z0′) (p < 0.0001) and a negative correlation with ground water table depth (p = 0.0016) during the daytime. There was also a slight negative relation with υdmax, which was also obvious from Figure 4. With regard to υd/υdmax, an enhancement by 5.2% was found during working-days (p < 0.0001), along with a positive correlation with RH(z0′) (p < 0.0001) and a negative correlation with the depth of the ground water table (p < 0.0001). During the night-time, traffic volume slightly enhanced υd by 0.08 cm s−1 (p = 0.0016). The ANCOVA revealed a positive contribution from RH(z0′) to υd/υdmax (p < 0.0001) but not from the ground water table depth (p = 0.35). When analyzing night-time υd/υdmax as response variable, no significant impact of traffic volume could be substantiated (p = 0.44). There was, however, again a positive correlation with RH(z0′) (p = 0.02) and a negative correlation with the ground water table depth p < 0.0001).
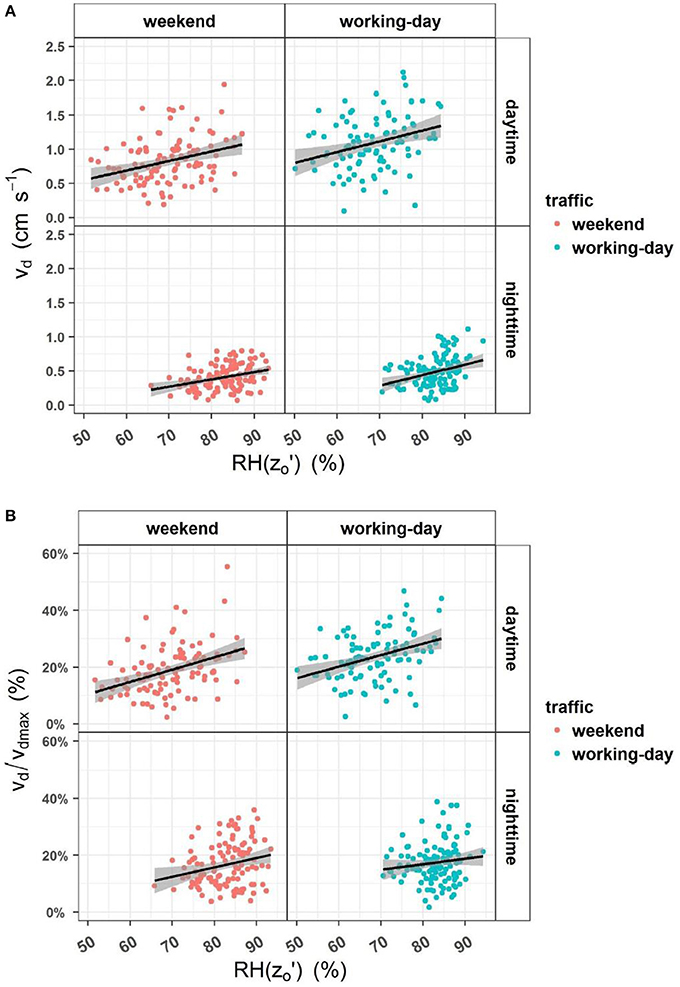
Figure 6. Dependence of monthly (A) deposition velocity (cm s−1) and (B) deposition efficiency (%) on relative humidity at the canopy surface (%), subdivided into day/nighttime and traffic volume.
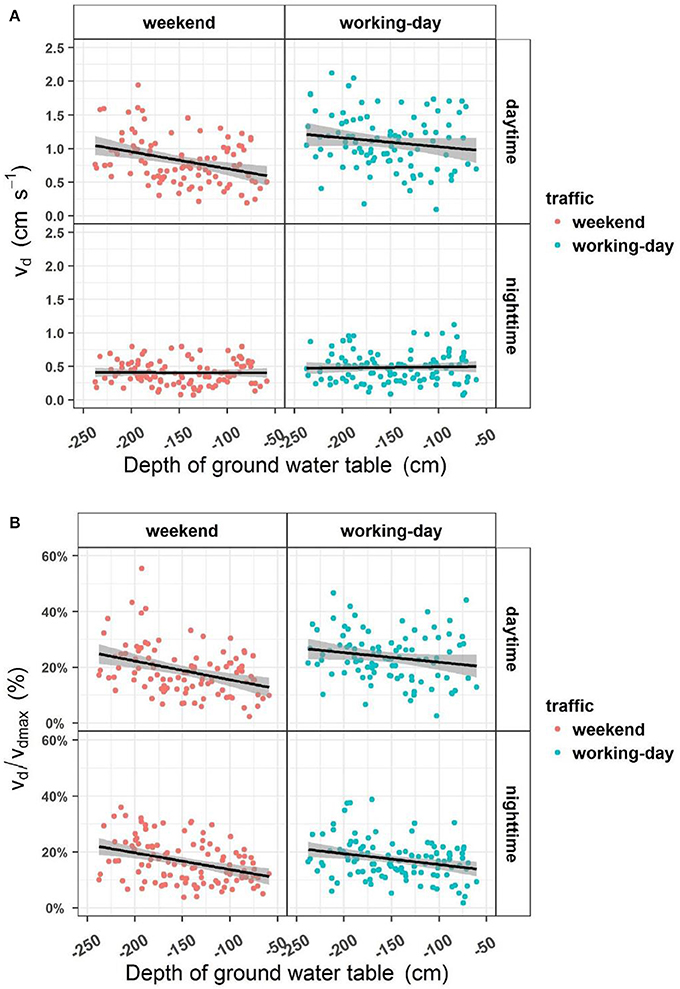
Figure 7. Dependence of monthly (A) deposition velocity (cm s−1) and (B) deposition efficiency (%) on ground water table depth (cm), subdivided into day/nighttime and traffic volume.
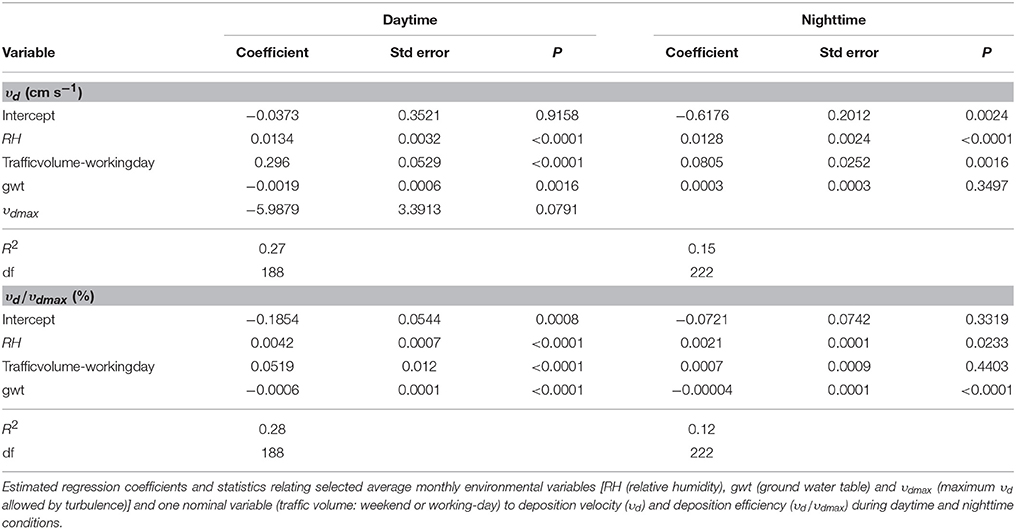
Table 3. Results from the analysis of covariance.
Although explained variability from the ANCOVA was low (varying between 12 and 28%), deposition on external wet surfaces and especially soil uptake could be useful to understand the annual pattern with increased υd during the autumnal months, especially during the daytime (Figure 8). The found relationships could, however, not be generalized, especially when data were analyzed on a shorter time-scale. It was clear that in some (spring) months other unaccounted variables (e.g., monoterpene emission) controlled the deposition at the site. In April 2007 e.g., the site was struck by a 40-day lasting drought period, which led to excessively high F (< −0.5 ppb m s−1) and high υd (> 2 cm s−1), which were rarely encountered during the 10-year monitoring period (Figures 5, 9). The drought stress was accompanied by a rapidly decreasing ground water level, low RH(z0′), high VPD, high T(z0′) and high solar radiation compared to the long-term monthly average. A high correlation between υd and the solar radiation was found (p < 0.0001) (Figure 10). For relative humidity, the negative correlation contrasted with findings from previous monthly analysis. The level of ground water was uncorrelated with υd. The fluxes were positively correlated with RH(z0′) (r = 0.7), VPD (r = −0.7), T(z0′) (r = −0.6) and solar radiation (r = −0.8) (Figure 11).
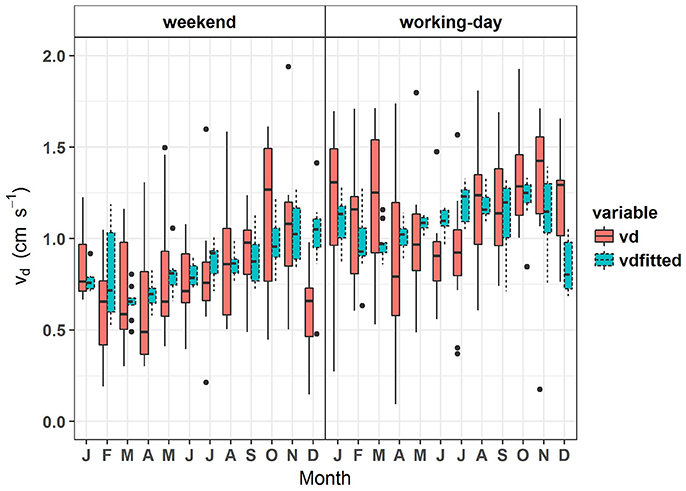
Figure 8. Annual pattern of monthly measured and modeled deposition velocity (υd,cm s−1) for daytime weekends and working-days over the entire period April 2005 till December 2015.
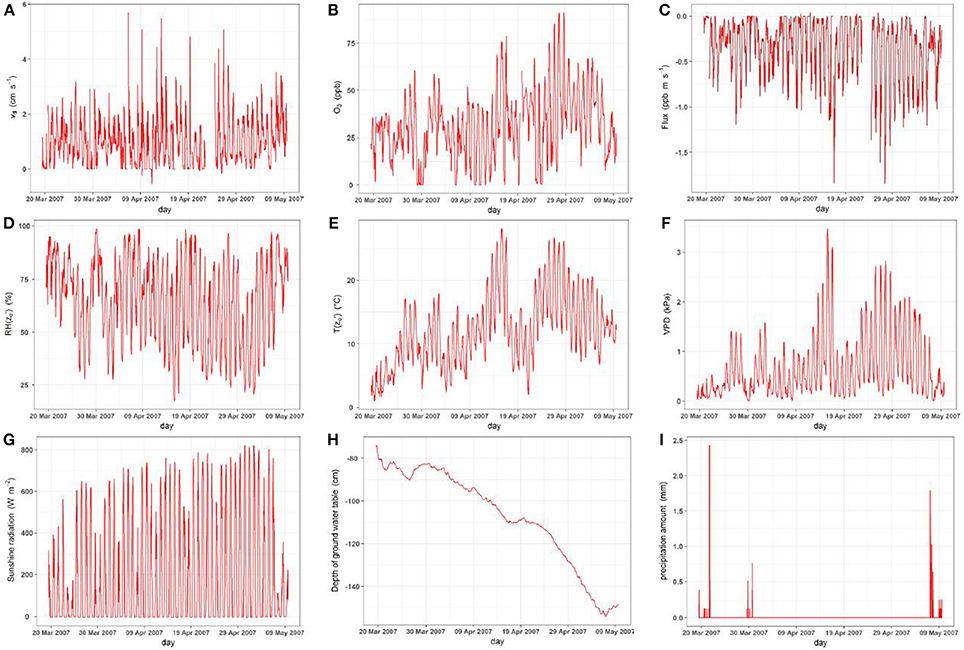
Figure 9. Time series of half-hourly (A) deposition velocity (υd), (B) ozone mixing ratio, (C) ozone flux (F), (D) relative humidity at the leaf surface (RH(z0′)), (E) temperature at the leaf surface (T(z0′), (F) vapor pressure deficit (VPD), (G) solar radiation, (H) depth of ground water table, (I) precipitation sum over the period 20 March to 9 May 2007.
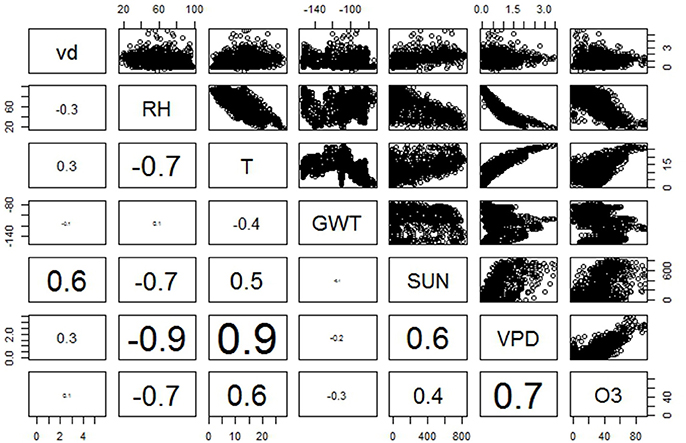
Figure 10. Pairplot of half-hourly deposition velocity (υd,cm s−1) and covariates measured over the period 20 March to 9 May 2007. The upper panel contains scatterplots while the lower panel depicts the estimated pair-wise Pearson correlations using a font size which is proportional to the absolute value of the estimated correlation coefficient.
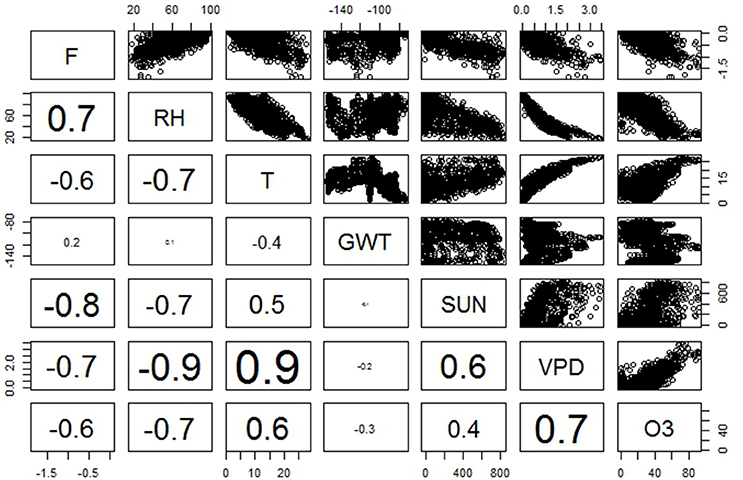
Figure 11. Pairplot of half-hourly ozone flux (F, ppb m s−1) and covariates measured over the period 20 March to 9 May 2007. The upper panel contains scatterplots while the lower panel depicts the estimated pair-wise Pearson correlations using a font size which is proportional to the absolute value of the estimated correlation coefficient.
Discussion
Impact of Traffic Volume
The analysis showed that daytime υd, υd/υdmax and F were substantially higher during the working-weeks (Table 2). The presence of large amounts of NO, advected from neighboring vehicle emissions and the more remote port activities in Antwerp led to an increased destruction of O3 by NO between the canopy surface and the measuring height. Average daytime fluxes during the working-weeks were 13 and 6% higher during winter and summer, respectively. Median DA numbers varied between 0.4 and 0.8 indicating that photochemical reactions between O3, NO, and NO2 could not be excluded. The lowest long-term median depletion time for O3 was recorded for nocturnal winter working-days (16 min), daytime winter working-days (17 min) and daytime summer working-days (39 min). In these conditions, the half-hourly O3 gradients (and the derived deposition metrics) were increasingly influenced by chemical reactions with NO. The resulting flux divergence recorded at our site (13 and 6% during winter and summer working-weeks compared to weekend as reference) is within the 0 and 25% deviance range from the surface fluxes for the critical zone of Damköhler number (0.1 < DA < 1), as demonstrated by Stella et al. (2012).
The chemical climate during the weekend, characterized by lower NO values, increased ratio of NO2/NOx leading to higher presence of O3, has been amply described by several authors (Fujita et al., 2003; Wolff et al., 2013). Due to a lower chemical sink during the weekends, flux measurements were less affected by flux divergence and hence, they could better represent the intrinsic O3 deposition to the ecosystem. The average annual daytime and night-time υd of 0.8 and 0.4 cm s−1, respectively, should therefore preferably be retained as ecosystem υd for O3 at our site. The same holds for the dry deposition fluxes, for which the daytime fluxes of −0.150 and −0.244 ppb m s−1 could be considered to be the representative average dry deposition for winter and summer half-year, respectively.
Drivers of Non-stomatal Deposition
Non-stomatal deposition comprises O3 deposition to the soil surface, woody tree parts, foliage along with gas-phase chemical losses involving reactions between O3 and BVOCs (biogenic volatile organic compounds) or biogenic NO, which can be either emitted by leaves or soils (Cape et al., 2009). Non-stomatal deposition was considered to be the main deposition pathway at the site (Neirynck et al., 2012). An analysis of covariance showed that increased relative humidity at the leaf surface and lowered ground water tables enhanced both υd and υd/υdmax. The nature of the precipitation also controlled the overall uptake of O3 at the canopy surface during both summer and winter. An intercomparison among canopy wetness classes revealed that υd and υd/υdmax was the highest when the canopy was dew-wetted or in case a shallow snow cover was present on the foliage or soil. Wetness effects also impacted the magnitude of the nocturnal O3 fluxes, which still comprised one third of the daytime O3 flux. The foliage of this suburban forest is exposed to the corrugating and erosive impact of air pollution, which consists of a mixture of reactive gases (O3, NH3, SO2, and NOx) and particles (soot, diesel particulate matter, particulate ammonium and nitrate), emitted from different sources (Neirynck et al., 2007, 2011). This results in erosion of the epicuticular waxes of the needles (Crossley and Fowler, 1986) and increased (microscopic) leaf wettability (Burkhardt and Eiden, 1994; Burkhardt and Hunsche, 2013). It was suggested by many authors that polluted leaves retain water better. The formation of liquid water films and the enhanced scavenging of O3 at wetted surfaces could be modulated by the presence of specific (deliquescent) particles deposited on the leaf cuticle, altering the cuticle uptake rates of the wetted leaves (Burkhardt and Eiden, 1994; Sun et al., 2016). It was evident from our analysis that occurrence of dewfall favored the O3 deposition velocity, which was in agreement with other studies (Fuentes et al., 1992; Lamaud et al., 2002). It is generally postulated that wetting of the foliage by rain or dew leads to stomatal blocking during the summer daytime (Finkelstein et al., 2000). In case of a dew-wetted canopy, it was observed that the skewed diurnal cycle of υd in summer closely resembled that of a dry canopy, which follows the asymmetrical cycle of stomatal conductance (Fowler et al., 2009; Wu et al., 2016). This suggested that stomata weren't fully blocked and stomatal uptake could still proceed at a higher rate compared to a rain-wetted canopy. The high υd recorded for a snow covered surface was in disagreement with the literature (Hardacre et al., 2015) but it must be emphasized that the snow cover on soil and canopy was very shallow and also included sleet.
Low levels of ground water table were also conducive to O3 uptake. Mechanisms behind the chemical quenching at the soil surface are not completely understood but findings from several flux partitioning studies emphasized the soil as an important sink for O3 in forests (Lamaud et al., 2002; Dorsey et al., 2004; Fares et al., 2014; Zhou et al., 2017) as well in ecosystems with smooth surfaces (Sanchez et al., 1997; Meszaros et al., 2009; Stella et al., 2013). The fact that low ground water levels favored O3 uptake suggested that the depth or soil volume available for O3 to diffuse in the soil pores constituted a limiting factor for uptake in the soil (Personne et al., 2015; Vuolo et al., 2017). A laboratory study, conducted by Sorimachi and Sakamoto (2007) on Chinese soil samples revealed that there was only a small impact of geometric surface area or soil weight on υd. There was, however, a positive correlation with the relative humidity or the moisture content of the soil surface, which was in agreement with the literature (Hicks et al., 1987; Erisman et al., 1994; Stella et al., 2011). This was interpreted by the latter authors that wetter soils limited the rate of O3 deposition in the soil because of decreased soil porosity and hence, reduced availability of reaction sites for O3. Based on Massman (2004), Meszaros et al. (2009) used a relatively greater soil resistance for O3 deposition for wet soils than for dry soils, although low soil moisture content could also induce soil moisture stress limiting stomatal uptake (Emberson et al., 2001). Low levels of ground water table, entail a low water filled porosity, which could additionally enhance biogenic NO emission on sandy textured soils, supporting coniferous forest (Pilegaard et al., 2006). Gas flux measurements from incubated soil and forest floor samples at our nitrogen-saturated site demonstrated the presence of NO-emission (Wagner, 2009). Emission of NO from the forest floor averaged ± 300 μg N m−2 h−1. Highest rates of NO emission from the mineral top soil occurred at a water filled porosity of 50–60%.
A multivariate analysis was conducted to explain the annual deposition pattern of O3 during the day and nighttime and to elucidate possible differences in υd among the years over the period 2005–2015. Especially environmental variables, driving non-stomatal processes (chemical reactions, canopy wetness, soil uptake) contributed to explaining the annual pattern in υd. Although the presence of NOx led to enhanced daytime values of υd during the entire winter period, there was a conspicuous tendency toward higher υds during autumn. The increased υds recorded during autumnal months at our site coincided with a seasonally dependent increased frequency of canopy wetness events, occurrence of needle senescence and the reaching of a minimum water table depth at the end of the growing season. Potier et al. (2015) concluded that enhanced deposition of O3 on wet senescing leaves of wheat was due to leaching of apoplastic antioxidants toward the leaf surface. Besides an altered chemical proclivity of wet senescent foliage for trapping O3, it is also conceivable that the decrease of LAI during the leaf-fall period, could allow for a better turbulent transfer of O3 in the trunk space, enabling a better transport toward the forest soil. The overall effect of these mechanisms could be the reason for unexpected decreases in autumnal Rc, noticed at other forest sites (Klemm and Mangold, 2001).
The explained variability by the set of environmental variables was, however, rather low, even during the daytime (<30%). The model was not adequate enough to explain higher υds in substantially different weather conditions or explain the high inter-annual variability. This indicated that other unaccounted variables or drivers with a different meteorological signature, thwarted a thorough analysis of the controlling mechanisms behind the O3 uptake at our site. During spring 2007, a serious drought impacted the forest, which entailed extremely low RH (high vapor pressure deficit and temperature). We surmise that these stress conditions, which were assumed to suppress O3 uptake by limiting reactions onto wet surfaces or inducing stomatal closure, conversely triggered BVOC emissions, leading to O3 quenching. Information about emission of storage or non-storage monoterpenes from the pine foliage, branches, stem or forest floor is, however, lacking at our site but BVOC measurements could have casted a light on the overly high O3 fluxes, measured during spring 2007 or in other years with high O3 dry deposition rates (e.g., 2010). Excessive springtime monoterpene emissions or standard emission rates were measured in Pinus stands as a consequence of drought stress (Bäck et al., 2005), springtime phase change in stem water transport capacity (Vanhatalo et al., 2015), bud break (Kim, 2001), general stress to the plant (Komenda and Koppmann, 2002) or disturbed tree-herbivore relations (Phillips and Croteau, 1999; Trowbridge et al., 2014). Emission of BVOCs from intact Scots pine branches can be very high in early spring, often much higher than the emission occurring later in the growing season (Tarvainen et al., 2005; Hakola et al., 2006). Especially solar radiation explained the largest part in the variability in F and υd during the drought period (Figures 10, 11). The high reactivity of O3 cannot solely be explained by stomatal uptake, because values of υd were too high for the stomatal pathway (>2 cm s−1). It is possible that light-depended emissions of BVOCs mimicked the stomatal conductance dynamics, which are also driven by light and heat (Hogg et al., 2007). BVOCs released from the foliage could have dissolved in the epicuticular wax layers, where they play a role in chemical reactions with oxidizing agents as O3 (Joensuu et al., 2016) or they take part in the formation of water layers, which enhance in turn the deposition of O3 (Sumner et al., 2004). The strong dependence of υd on light (solar radiation or photosynthetic photon flux density) can also be due to ozone photolysis (Rondon et al., 1993; Fowler et al., 2001; Hogg et al., 2007; Cape et al., 2009). Coyle et al. (2009) suggested that ozone could be removed at a (very) dry potato crop surface by thermal decomposition, possibly enhanced by photo-chemical reactions in the daytime.
Conclusions
The study casts some light on the high deposition velocity of O3, measured at our suburban forest. There is evidence that the presence of a chemical sink during the working-weeks led to increased gas-phase reactions between O3 and NO between the measuring height and the canopy surface. Average daytime fluxes were 13 and 6% higher during winter and summer working-weeks compared to the respective weekend values. NO emissions didn't solely originate from vehicle exhaust by diesel-powered engine cars in close proximity of the forest but also from the more remote intense traffic, chemical industries and petrochemical refineries, located at Antwerp port.
The O3 deposition was further especially controlled by non-stomatal processes, such as deposition onto external wet surfaces. Especially a dew-wetted canopy was found to be a perfect O3 sink. The study also showed that deposition was favored at the end of the growing season when ground water table reached its lowest level and in-canopy transfer was faster due to the drop in LAI. This lends support to the fact that soil uptake might also have been overlooked at our site for other pollutants (e.g., NH3) and at other forest sites. Further flux partitioning research must scrutinize the transport of O3 in the trunk space and the final deposition in the soil compartment. Direct flux measurements of O3 to the forest floor would be very convenient to ascertain which soil conditions (water content, organic matter, amount of fresh litter …) enhance the removal at the soil surface.
The lacking information of monoterpenes at our site prevents a thorough analysis of the environmental control of O3 removal at our site. The meteorological signature of BVOC triggers might be different than the ones controlling other non-stomatal or stomatal mechanisms behind O3 removal. The convolution of those different effects in the total O3 uptake renders a thorough analysis of controlling environmental variables increasingly intricate.
Author Contributions
The corresponding author, JN is an atmospheric scientist and the manager of the research site. He validated the 10-year long dataset and performed the final analysis. He already published a paper about the ozone deposition at the site (Journal of Environmental Monitoring). He was assisted by his colleague AV, head of the ICP Forest Deposition panel. He is an R-wizzard and was helpful during the statistical analysis. He is also skilled in the deposition of nitrogen compounds, especially nitrogen oxides.
Conflict of Interest Statement
The authors declare that the research was conducted in the absence of any commercial or financial relationships that could be construed as a potential conflict of interest.
Acknowledgments
This project was performed under the authority of the Flemish minister of Environment. We gratefully acknowledge Eddy Smesman (INBO) and the Flemish Environmental Agency (VMM) for the calibration and maintenance of the monitors.
References
Altimir, N., Kolari, P., Tuovinen, J. P., Vesala, T., Back, J., Suni, T., et al. (2006). Foliage surface ozone deposition: a role for surface moisture? Biogeosciences 3, 209–228. doi: 10.5194/bg-3-209-2006
Ashmore, M. R. (2005). Assessing the future global impacts of ozone on vegetation. Plant Cell Environ. 28, 949–964. doi: 10.1111/j.1365-3040.2005.01341.x
Bäck, J., Hari, P., Hakola, H., Juurola, E., and Kulmala, M. (2005). Dynamics of monoterpene emissions in Pinus sylvestris during early spring. Boreal Env. Res. 10, 409–424.
Beljaars, A. C. L., and Holtslag, A. A. M. (1990). Description of a software library for the calculation of surface fluxes Environ. Softw. 5, 60–68. doi: 10.1016/0266-9838(90)90002-N
Bosveld, F. C. (1991). Exchange Coefficients over a Douglas Fir Forest Dutch Priority Programme on Acidification, Project 1901 Royal Netherlands Meteorological Institute (KNMI) (De Bilt).
Burkhardt, J., and Eiden, R. (1994). Thin water films on coniferous needles. Atmos. Environ. 28, 2001–2017. doi: 10.1016/1352-2310(94)90469-3
Burkhardt, J., and Hunsche, M. (2013). “Breath figures” on leaf surfaces-formation and effects of microscopic leaf wetness. Front. Plant Sci. 4:422. doi: 10.3389/fpls.2013.00422
Businger, J. A., Wyngaard, J. C., Izumi, Y., and Bradley, E. F. (1970). Flux-profile relationships in the atmospheric surface layer. J. Atmos. Sci. 28, 181–189. doi: 10.1175/1520-0469(1971)028<0181:FPRITA>2.0.CO;2
Cape, J. N., Hamilton, R., and Heal, M. R. (2009). Reactive uptake of ozone at simulated leaf surfaces: implications for ‘non-stomatal’ ozone flux. Atmos. Environ. 43, 1116–1123. doi: 10.1016/j.atmosenv.2008.11.007
Carrara, A., Kowalski, A. S., Neirynck, J., Janssens, I. A., Yuste, J. C., and Ceulemans, R. (2003). Net ecosystem CO2 exchange of mixed forest in belgium over 5 years. Agric. For. Meteorol. 119, 209–227. doi: 10.1016/S0168-1923(03)00120-5
Clifton, O. E., Fiore, A. M., Munger, J. W., Malyshev, S., Horowitz, L. W., Shevliakova, E., et al. (2017). Interannual variability in ozone removal by a temperate deciduous forest. Geophys. Res. Lett. 44, 542–552. doi: 10.1002/2016GL070923
Coyle, M., Nemitz, E., Storeton-West, R., Fowler, D., and Cape, J. N. (2009). Measurements of ozone deposition to a potato canopy. Agric. For. Meteorol. 149, 655–666. doi: 10.1016/j.agrformet.2008.10.020
Crossley, A., and Fowler, D. (1986). The weathering of scots pine epicuticular wax in polluted and clean-air. N. Phytol. 103, 207–218. doi: 10.1111/j.1469-8137.1986.tb00609.x
Damköhler, G. (1940). Der Einfluss der Turbulenz auf die Flammengeschwindigkeit in Gasgemischen, Z. Elektrochem. Angew. 46, 601–652. doi: 10.1002/bbpc.19400461102
de Vries, W., Dobbertin, M. H., Solberg, S., van Dobben, H. F., and Schaub, M. (2014). Impacts of acid deposition, ozone exposure and weather conditions on forest ecosystems in Europe: an overview. Plant Soil 380, 1–45. doi: 10.1007/s11104-014-2056-2
Dorsey, J. R., Duyzer, J. H., Gallagher, M. W., Coe, H., Pilegaard, K., Weststrate, J. H., et al. (2004). Oxidized nitrogen and ozone interaction with forests. I: experimental observations and analysis of exchange with douglas fir. Q. J. R. Meteorol. Soc. 130, 1941–1955. doi: 10.1256/qj.03.124
Dyer, A. J., and Hicks, B. B. (1970). Flux-gradient relationships in the constant flux layer. Q. J. R. Meteorol. Soc. 96, 715–721. doi: 10.1002/qj.49709641012
Emberson, L. D., Ashmore, M. R., Simpson, D., Tuovinen, J. P., and Cambridge, H. M. (2001). Modelling and mapping ozone deposition in Europe. Water Air Soil Pollut. 130, 577–582. doi: 10.1023/A:1013851116524
Erisman, J. W., Vanpul, A., and Wyers, P. (1994). Parametrization of surface-resistance for the quantification of atmospheric deposition of acidifying pollutants and ozone. Atmos. Environ. 28, 2595–2607. doi: 10.1016/1352-2310(94)90433-2
Fares, S., McKay, M., Holzinger, R., and Goldstein, A. H. (2010). Ozone fluxes in a Pinus ponderosa ecosystem are dominated by non-stomatal processes: evidence from long-term continuous measurements. Agric. For. Meteorol. 150, 420–431. doi: 10.1016/j.agrformet.2010.01.007
Fares, S., Savi, F., Muller, J., Matteucci, G., and Paoletti, E. (2014). Simultaneous measurements of above and below canopy ozone fluxes help partitioning ozone deposition between its various sinks in a Mediterranean Oak forest. Agric. For. Meteorol. 198, 181–191. doi: 10.1016/j.agrformet.2014.08.014
Finkelstein, P. L., Ellestad, T. G., Clarke, J. F., Meyers, T. P., Schwede, D. B., Hebert, E. O., et al. (2000). Ozone and sulfur dioxide dry deposition to forests: observations and model evaluation. J. Geophys. Res.-Atmos. 105, 15365–15377. doi: 10.1029/2000JD900185
Fowler, D., Cape, J. N., Coyle, M., Flechard, C., Kuylenstierna, J., Hicks, K., et al. (1999). The global exposure of forests to air pollutants. Water Air Soil Pollut. 116, 5–32. doi: 10.1023/A:1005249231882
Fowler, D., Flechard, C., Cape, J. N., Storeton-West, R. L., and Coyle, M. (2001). Measurements of ozone deposition to vegetation quantifying the flux, the stomatal and non-stomatal components. Water Air Soil Pollut. 130, 63–74. doi: 10.1023/A:1012243317471
Fowler, D., Pilegaard, K., Sutton, M. A., Ambus, P., Raivonen, M., Duyzer, J., et al. (2009). Atmospheric composition change: ecosystems-atmosphere interactions. Atmos. Environ. 43, 5193–5267. doi: 10.1016/j.atmosenv.2009.07.068
Franz, M., Simpson, D., Arneth, A., and Zaehle, S. (2017). Development and evaluation of an ozone deposition scheme for coupling to a terrestrial biosphere model. Biogeosciences 14, 45–71. doi: 10.5194/bg-14-45-2017
Fuentes, J. D., Gillespie, T. J., Denhartog, G., and Neumann, H. H. (1992). Ozone deposition onto a deciduous forest during dry and wet conditions. Agric. For. Meteorol. 62, 1–18. doi: 10.1016/0168-1923(92)90002-L
Fuhrer, J., Val Martin, M. V., Mills, G., Heald, C. L., Harmens, H., Hayes, F., et al. (2016). Current and future ozone risks to global terrestrial biodiversity and ecosystem processes. Ecol. Evol. 6, 8785–8799. doi: 10.1002/ece3.2568
Fujita, E. M., Stockwell, W. R., Campbell, D. E., Keislar, R. E., and Lawson, D. R. (2003). Evolution of the magnitude and spatial extent of the weekend ozone effect in California's South Coast Air Basin, 1981-2000. J. Air Waste Manage. Assoc. 53, 802–815. doi: 10.1080/10473289.2003.10466225
Garland, J. A. (1978). Dry and wet removal of sulfur from atmosphere. Atmos. Environ. 12, 349–362. doi: 10.1016/0004-6981(78)90217-2
Hakola, H., Tarvainen, V., Back, J., Ranta, H., Bonn, B., Rinne, J., et al. (2006). Seasonal variation of mono- and sesquiterpene emission rates of Scots pine. Biogeosciences 3, 93–101. doi: 10.5194/bg-3-93-2006
Hardacre, C., Wild, O., and Emberson, L. (2015). An evaluation of ozone dry deposition in global scale chemistry climate models. Atmos. Chem. Phys. 15, 6419–6436. doi: 10.5194/acp-15-6419-2015
Hicks, B. B., Baldocchi, D. D., Meyers, T. P., Hosker, R. P., and Matt, D. R. (1987). A preliminary multiple resistance routine for deriving dry deposition velocities from measured quantities. Water Air Soil Pollut. 36, 311–330. doi: 10.1007/BF00229675
Hogg, A., Uddling, J., Ellsworth, D., Carroll, M. A., Pressley, S., Lamb, B., et al. (2007). Stomatal and non-stomatal fluxes of ozone to a northern mixed hardwood forest. Tellus Ser. B Chem. Phys. Meteorol. 59, 514–525. doi: 10.1111/j.1600-0889.2007.00269.x
Hoshika, Y., Katata, G., Deushi, M., Watanabe, M., Koike, T., and Paoletti, E. (2015). Ozone-induced stomatal sluggishness changes carbon and water balance of temperate deciduous forests. Sci. Rep. 5:9871. doi: 10.1038/srep09871
IPCC (2007). Climate Change 2007: Synthesis Report. Contribution of Working Groups I, II and III to the Fourth Assessment Report of the Intergovernmental Panel on Climate Change, eds Core Writing Team, R. K. Pachauri, and A. Reisinger (Geneva: IPCC).
Joensuu, J., Altimir, N., Hakola, H., Rostas, M., Raivonen, M., Vestenius, M., et al. (2016). Role of needle surface waxes in dynamic exchange of mono- and sesquiterpenes. Atmos. Chem. Phys. 16, 7813–7823. doi: 10.5194/acp-16-7813-2016
Kim, J. C. (2001). Factors controlling natural VOC emissions in a southeastern US pine forest. Atmos. Environ. 35, 3279–3292. doi: 10.1016/S1352-2310(00)00522-7
Klemm, O., and Mangold, A. (2001). Ozone deposition at a forest site in NE Bavaria. Water Air Soil Pollut.: Focus 1, 223–232. doi: 10.1023/A:1013167408114
Klingberg, J., Engardt, M., Karlsson, P. E., Langner, J., and Pleijel, H. (2014). Declining ozone exposure of European vegetation under climate change and reduced precursor emissions. Biogeosciences 11, 5269–5283. doi: 10.5194/bg-11-5269-2014
Komenda, M., and Koppmann, R. (2002). Monoterpene emissions from scots pine (Pinus sylvestris): field studies of emission rate variabilities. J. Geophys. Res. Atmos. 107, ACH 1-1–ACH 1-13. doi: 10.1029/2001JD000691
Lamaud, E., Carrara, A., Brunet, Y., Lopez, A., and Druilhet, A. (2002). Ozone fluxes above and within a pine forest canopy in dry and wet conditions. Atmos. Environ. 36, 77–88. doi: 10.1016/S1352-2310(01)00468-X
Lenschow, D. H. (1982). Reactive trace species in the boundary-layer from a micrometeorological perspective. J. Meteorol. Soc. Japan 60, 472–480. doi: 10.2151/jmsj1965.60.1_472
Massman, W. J. (2004). Toward an ozone standard to protect vegetation based on effective dose: a review of deposition resistances and a possible metric. Atmos. Environ. 38, 2323–2337. doi: 10.1016/j.atmosenv.2003.09.079
Meszaros, R., Horvath, L., Weidinger, T., Neftel, A., Nemitz, E., Dammgen, U., et al. (2009). Measurement and modelling ozone fluxes over a cut and fertilized grassland. Biogeosciences 6, 1987–1999. doi: 10.5194/bg-6-1987-2009
Mikkelsen, T. N., Ro-Poulsen, H., Hovmand, M. F., Jensen, N. O., Pilegaard, K., and Egelov, A. H. (2004). Five-year measurements of ozone fluxes to a Danish Norway spruce canopy. Atmos. Environ. 38, 2361–2371. doi: 10.1016/j.atmosenv.2003.12.036
Mills, G., Harmens, H., Wagg, S., Sharps, K., Hayes, F., Fowler, D., et al. (2016). Ozone impacts on vegetation in a nitrogen enriched and changing climate. Environ. Pollut. 208, 898–908. doi: 10.1016/j.envpol.2015.09.038
Monteith, J. L. and Unsworth, M. H. (1990). Principles of Environmental Physics. 2nd edn. London: Edward Arnold.
Monin, A. S., and Obukhov, A.M. (1954). Basic laws of turbulence mixing in the ground layer of the atmosphere Acad. NaukSSRTrudGeofizInst. 24, 163–187.
Neirynck, J., Flechard, C. R., and Fowler, D. (2011). Long-term (13 years) measurements of SO2 fluxes over a forest and their control by surface chemistry. Agric. For. Meteorol. 151, 1768–1780. doi: 10.1016/j.agrformet.2011.07.013
Neirynck, J., Gielen, B., Janssens, I. A., and Ceulemans, R. (2012). Insights into ozone deposition patterns from decade-long ozone flux measurements over a mixed temperate forest. J. Environ. Monit. 14, 1684–1695. doi: 10.1039/c2em10937a
Neirynck, J., Kowalski, A. S., Carrara, A., and Ceulemans, R. (2005). Driving forces for ammonia fluxes over mixed forest subjected to high deposition loads. Atmos. Environ. 39, 5013–5024. doi: 10.1016/j.atmosenv.2005.05.027
Neirynck, J., Kowalski, A. S., Carrara, A., Genouw, G., Berghmans, P., and Ceulemans, R. (2007). Fluxes of oxidised and reduced nitrogen above a mixed coniferous forest exposed to various nitrogen emission sources. Environ. Pollut. 149, 31–43. doi: 10.1016/j.envpol.2006.12.029
Paoletti, E., and Grulke, N. E. (2010). Ozone exposure and stomatal sluggishness in different plant physiognomic classes. Environ. Pollut. 158, 2664–2671. doi: 10.1016/j.envpol.2010.04.024
Personne, E., Tardy, F., Genermont, S., Decuq, C., Gueudet, J. C., Mascher, N., et al. (2015). Investigating sources and sinks for ammonia exchanges between the atmosphere and a wheat canopy following slurry application with trailing hose. Agric. For. Meteorol. 207, 11–23. doi: 10.1016/j.agrformet.2015.03.002
Phillips, M. A., and Croteau, R. B. (1999). Resin-based defenses in conifers. Trends Plant Sci. 4, 184–190. doi: 10.1016/S1360-1385(99)01401-6
Pilegaard, K., Skiba, U., Ambus, P., Beier, C., Bruggemann, N., Butterbach-Bahl, K., et al. (2006). Factors controlling regional differences in forest soil emission of nitrogen oxides (NO and N2O). Biogeosciences 3, 651–661. doi: 10.5194/bg-3-651-2006
Potier, E., Ogee, J., Jouanguy, J., Lamaud, E., Stella, P., Personne, E., et al. (2015). Multi layer modelling of ozone fluxes on winter wheat reveals large deposition on wet senescing leaves. Agricul. For. Meteorol. 211, 58–71. doi: 10.1016/j.agrformet.2015.05.006
Rannik, U., Altimir, N., Mammarella, I., Back, J., Rinne, J., Ruuskanen, T. M., et al. (2012). Ozone deposition into a boreal forest over a decade of observations: evaluating deposition partitioning and driving variables. Atmos. Chem. Phys. 12, 12165–12182. doi: 10.5194/acp-12-12165-2012
R Development Core Team (2015). A Language and Environment for Statistical Computing. Vienna: R Foundation for Statistical Computing. Available online at: www.R-project.org/ (Accessed July 23, 2015).
Rondon, A., Johansson, C., and Granat, L. (1993). Dry deposition of nitrogen-dioxide and ozone to coniferous forests. J. Geophys. Res. Atmos. 98, 5159–5172. doi: 10.1029/92J.D.02335
Sanchez, M. L., Rodriguez, R., and Lopez, A. (1997). Ozone dry deposition in a semi-arid steppe and in a coniferous forest in southern Europe. J. Air Waste Manage. Assoc. 47, 792–799. doi: 10.1080/10473289.1997.10463939
Schreuder, M. D. J., van Hove, L. W. A., and Brewer, C. A. (2001). Ozone exposure affects leaf wettability and tree water balance. N. Phytologist 152, 443–454. doi: 10.1046/j.0028-646X.2001.00272.x
Sicard, P., Anav, A., De Marco, A., and Paoletti, E. (2017). Projected global ground-level ozone impacts on vegetation under different emission and climate scenarios. Atmos. Chem. Phys. 17, 12177–12196. doi: 10.5194/acp-17-12177-2017
Sorimachi, A., and Sakamoto, K. (2007). Laboratory measurement of dry deposition of ozone onto northern chinese soil samples. Water Air Soil Pollut. Focus 7, 181–186. doi: 10.1007/s11267-006-9098-2
Stella, P., Loubet, B., Lamaud, E., Laville, P., and Cellier, P. (2011). Ozone deposition onto bare soil: a new parameterisation. Agric. For. Meteorol. 151, 669–681. doi: 10.1016/j.agrformet.2011.01.015
Stella, P., Loubet, B., Laville, P., Lamaud, E., Cazaunau, M., Laufs, S., et al. (2012). Comparison of methods for the determination of NO-O-3-NO2 fluxes and chemical interactions over a bare soil. Atmos. Meas. Tech. 5, 1241–1257. doi: 10.5194/amt-5-1241-2012
Stella, P., Personne, E., Lamaud, E., Loubet, B., Trebs, I., and Cellier, P. (2013). Assessment of the total, stomatal, cuticular, and soil 2 year ozone budgets of an agricultural field with winter wheat and maize crops. J. Geophys. Res. Biogeosci. 118, 1120–1132. doi: 10.1002/jgrg.20094
Sumner, A. L., Menke, E. J., Dubowski, Y., Newberg, J. T., Penner, R. M., Hemminger, J. C., et al. (2004). The nature of water on surfaces of laboratory systems and implications for heterogeneous chemistry in the troposphere. Phys. Chem. Chem. Phys. 6, 604–613. doi: 10.1039/b308125g
Sun, S., Moravek, A., Trebs, I., Kesselmeier, J., and Sorgel, M. (2016). Investigation of the influence of liquid surface films on O3 and PAN deposition to plant leaves coated with organic/inorganic solution. J. Geophys. Res.-Atmos. 121, 14239–14256. doi: 10.1002/2016JD025519
Tarvainen, V., Hakola, H., Hellen, H., Back, J., Hari, P., and Kulmala, M. (2005). Temperature and light dependence of the VOC emissions of Scots pine. Atmos. Chem. Phys. 5, 989–998. doi: 10.5194/acp-5-989-2005
Trowbridge, A. M., Daly, R. W., Helmig, D., Stoy, P. C., and Monson, R. K. (2014). Herbivory and climate interact serially to control monoterpene emissions from pinyon pine forests. Ecology 95, 1591–1603. doi: 10.1890/13-0989.1
Vanhatalo, A., Chan, T., Aalto, J., Korhonen, J. F., Kolari, P., Holtta, T., et al. (2015). Tree water relations can trigger monoterpene emissions from Scots pine stems during spring recovery. Biogeosciences 12, 5353–5363. doi: 10.5194/bg-12-5353-2015
Vilà-Guerau de Arellano, J., and Duynkerke, P. G. (1992). Influence of chemistry on the flux-gradient relationships for the NO-O3-NO2 system. Boundary-Layer Meteorol. 61, 375–387. doi: 10.1007/BF00119098
Vuolo, R. M., Loubet, B., Mascher, N., Gueudet, J. C., Durand, B., Laville, P., et al. (2017). Nitrogen oxides and ozone fluxes from an oilseed-rape management cycle: the influence of cattle slurry application. Biogeosciences 14, 2225–2244. doi: 10.5194/bg-14-2225-2017
Wagner, D. (2009). Climate change effects on greenhouse gas emissions from Northern European, Soils. Vienna: Diplomstudium Theoret./Angewandte Geographie, University of Wien.
World Health Organization (WHO) (2008). The World Health Report 2008: Primary Health Care – Now More Than Ever (Geneva).
Wolff, G. T., Kahlbaum, D. F., and Heuss, J. M. (2013). The vanishing ozone weekday/weekend effect. J. Air Waste Manage. Assoc. 63, 292–299. doi: 10.1080/10962247.2012.749312
Wu, Z. Y., Staebler, R., Vet, R., and Zhang, L. M. (2016). Dry deposition of O3 and SO2 estimated from gradient measurements above a temperate mixed forest. Environ. Pollut. 210, 202–210. doi: 10.1016/j.envpol.2015.11.052
Zhang, L., Wang, T., Zhang, Q., Zheng, J. Y., Xu, Z., and Lv, M. Y. (2016). Potential sources of nitrous acid (HONO) and their impacts on ozone: a WRF-chem study in a polluted subtropical region. J. Geophys. Res. Atmos. 121, 3645–3662. doi: 10.1002/2015JD024468
Keywords: canopy wetness, deposition velocity, ozone, traffic volume, precipitation form, biogenic volatile organic compounds, flux divergence, nitrogen oxides
Citation: Neirynck J and Verstraeten A (2018) Variability of Ozone Deposition Velocity Over a Mixed Suburban Temperate Forest. Front. Environ. Sci. 6:82. doi: 10.3389/fenvs.2018.00082
Received: 25 April 2018; Accepted: 04 July 2018;
Published: 06 August 2018.
Edited by:
Patrick Stella, UMR1048 Sciences Pour l'Action et le Développement Activités, Produits, Territoires (SADAPT), FranceReviewed by:
Silvano Fares, Consiglio per la Ricerca in Agricoltura e l'Analisi dell'Economia Agraria (CREA), ItalyMhairi Coyle, Centre for Ecology & Hydrology, United Kingdom
Copyright © 2018 Neirynck and Verstraeten. This is an open-access article distributed under the terms of the Creative Commons Attribution License (CC BY). The use, distribution or reproduction in other forums is permitted, provided the original author(s) and the copyright owner(s) are credited and that the original publication in this journal is cited, in accordance with accepted academic practice. No use, distribution or reproduction is permitted which does not comply with these terms.
*Correspondence: Johan Neirynck, johan.neirynck@inbo.be