 Aparna Shukla
 Purushottam K. Garg
 Smriti Srivastava
94% of researchers rate our articles as excellent or good
Learn more about the work of our research integrity team to safeguard the quality of each article we publish.
Find out more
ORIGINAL RESEARCH article
Front. Environ. Sci. , 19 July 2018
Sec. Interdisciplinary Climate Studies
Volume 6 - 2018 | https://doi.org/10.3389/fenvs.2018.00081
This article is part of the Research Topic Himalayan Climate Interactions View all 7 articles
Global climate change is significantly triggering the dynamic evolution of high-mountain lakes which may pose a serious threat to downstream areas, warranting their systematic and regular monitoring. This study presents the first temporal inventory of glacial and high-altitude lakes in the Sikkim, Eastern Himalaya for four points in time i.e., 1975, 1991, 2000, and 2017 using Hexagon, TM, ETM+, and OLI images, respectively. First, a baseline data was generated for the year 2000 and then the multi-temporal lake changes were assessed. The annual mapping of SGLs was also performed for four consecutive years (2014–2017) to analyze their nature and occurrence pattern. The results show an existence of 463 glacial and high-altitude lakes (> 0.003 km2) in 2000 which were grouped into four classes: supraglacial (SGL; 50) pro/peri glacial lake in contact with glacier (PGLC; 35), pro/peri glacial lake away from glacier (PGLA; 112) and other lakes (OL; 266). The mean size of lakes is 0.06 km2 and about 87% lakes have area < 0.1 km2. The number of lakes increased (by 9%) from 425 in 1975 to 466 in 2017, accompanied by a rapid areal expansion from 25.17 ± 1.90 to 31.24 ± 2.36 km2 (24%). The maximum expansion in number (106%) and area (138%) was observed in SGLs, followed by PGLCs (number: 34%; area: 90%). Contrarily no significant change was found in other lakes. The annual SGL mapping reveals that their number (area) increased from 81 (543,153 m2) to 96 (840,973 m2) between 2014 and 2017. Occurrence pattern of SGLs shows that maximum number of lakes (> 80%) are persistent in nature, followed by drain-out (15–20%) and recurring type lakes (7–8%). The new-formed lakes (9–17%) were consistently noticed in all the years (2014–2017). The results of this study underline that regional climate is accelerating the cryosphere thawing and if the current trend continues, further glacier melting will likely occur. Therefore, formation of new lakes and expansion of existing lakes is expected in the study area leading to increase in potential of glacial lake outburst floods. Thereby, persistent attention should be paid to the influences of climatic change in the region.
The global climate changed at an accelerated rate and by an unprecedented magnitude in the last century which significantly influenced the cryosphere (IPCC, 2007; Bolch et al., 2012). Studies and observations made on a global scale have shown that glaciers in various mountain ranges across the world, being particularly sensitive to climatic perturbations, have been retreating and losing mass (Dyurgerov and Meier, 1997; Paul et al., 2007; Bolch et al., 2012) since the beginning of last century except for the Karakoram and western Kunlun (Bolch et al., 2012; Gardelle et al., 2013; Brun et al., 2017). There have been credible reports that this melting of glaciers has led to a dramatic increase in dimension and frequency of the lakes associated with the glaciated and high-mountain regions across the world, such as in the Andes (Lliboutry, 1977; Emmer and Vilímek, 2013; Cook et al., 2016), the Alps (Huggel et al., 2002; Emmer et al., 2015), the Himalaya-Karakoram-Tibet (HKT) region (Komori, 2008; Bajracharya and Mool, 2009; Gardelle et al., 2011; Wang et al., 2011, 2013; Song et al., 2014; Aggarwal et al., 2017; Debnath et al., 2018), the central Asia (Janský et al., 2010; Mergili et al., 2013) and western Cordillera of North America (Clague and Evans, 2000; Emmer et al., 2016).
Owing to the sizable impacts of glacial lake development, expansion and outburst, this field of cryospheric sciences has seen tremendous upsurge in research, which in turn has led to much better understanding of the controlling factors and mechanisms involved in evolution of the glacial lakes (Reynolds, 2000; Benn et al., 2012; Westoby et al., 2014; Thompson et al., 2016; Miles et al., 2017). Moraine-dammed lakes typically develop in overdeepened glacier bed behind the lateral and terminal moraine that were formed during the Little Ice Age (Benn et al., 2012; Westoby et al., 2014). The supraglacial lakes occur on low sloping glacier tongues, where active downwasting had led to decrease in driving stresses and glacier velocity causing stagnation (Benn et al., 2001, 2012; Westoby et al., 2014). These lakes have severe implications related to the glacier health and human well-being because- (i) proglacial lakes may instigate the calving process leading to an increased terminus disintegration and higher retreat (Warren and Kirkbride, 1998; Benn et al., 2001, 2012; Sakai, 2012), (ii) supraglacial lakes (SGL), have a lower albedo than that of the surrounding snow and ice, and hence, become hotspot of enhanced melting. Consequently, absorption of more radiation facilitates further melting (Reynolds, 2000; Benn et al., 2012; Thompson et al., 2016). Additionally, lake-shore ice cliffs are important for the mass balance of glaciers (Thompson et al., 2016; Miles et al., 2017), (iii) given an appropriate trigger (ice and rock avalanches, landslides, seismic activity etc.), the moraine/ice dammed proglacial lakes may produce catastrophic Glacial Lake Outburst Floods (GLOFs). GLOFs pose a serious hazard in many high mountain regions around the world and have sought growing attention in recent years due to the associated catastrophic damages and fatalities (Mool et al., 2001; Nie et al., 2013; Westoby et al., 2014). For instance, in Peru alone, ~32,000 people were killed because of GLOFs during the last century. These floods caused at least 7 deaths in Iceland, 393 deaths in the European Alps, 5,745 deaths in South America and 6,300 deaths in central Asia (Carrivick and Tweed, 2016). The Himalaya experienced fewer floods (may be due to poor data record) yet higher levels of damage (Carrivick and Tweed, 2016). At least 20 GLOF events have been recorded in Himalaya in the last 7 decades causing heavy loss of human lives and property, destruction of infrastructure besides damages to agriculture land and forests (Mool et al., 2001).
With ~15% of its area covered by glaciers, Himalaya is the storehouse of world's largest ice mass outside poles (Bolch et al., 2012; Brun et al., 2017). Recent findings indicate that Himalaya is one of the worse affected regions by the climate warming (Fujita et al., 2001; Dyurgerov and Meier, 2005; Bolch et al., 2012), which has given rise to development of many glacial and high-altitude lakes (Kargel et al., 2005; Gardelle et al., 2011; Zhang et al., 2015). Recent expansion of glacial lakes in the Himalaya has mainly been studied in north Bhutan (Fujita et al., 2008; Komori, 2008) and in the Everest region (Yamada and Sharma, 1993; Sakai et al., 2000; Benn et al., 2001; Wessels et al., 2002). Gardelle et al. (2011) selected seven study sites along the east-west wide-spread mountain range from the Bhutan to the Hindu Kush and mapped glacial lakes between 1990 and 2010. They found that glacial lake in the eastern part were bigger and more numerous than in the west, and have continuously grown, while glacial lakes have shrunk during that period in the Hindu Kush and in the Karakoram. The Himalayan glaciers have shown variable response to climate change with glacier wastage being slightly higher in the eastern Himalaya (Kargel et al., 2005; Scherler et al., 2011; Brun et al., 2017). The population of debris-covered glaciers with relatively stagnant fronts also increases from west to east along the Himalayan arc (Scherler et al., 2011). These favorable conditions have probably been responsible for large concentration of glacial lake (and resultant lake outburst floods) in the eastern Himalaya (Mool et al., 2001; Gardelle et al., 2011). Considering this sensitivity, the present study aims at glacial and high-altitude lake mapping in the Indian state of Sikkim, Eastern Himalaya.
Better knowledge about the distribution and evolutionary patterns of glacial and high-altitude lakes and an understanding of the associated processes hold great scientific importance and have the potential to help in (i) retroactively understanding of ongoing environmental change, (ii) hazard analysis and risk management of outburst floods and (iii) effective water management (Westoby et al., 2014; Emmer et al., 2015, 2016). This makes the regular and accurate monitoring of these lakes vital. However, there have been limited studies which have assessed the distribution and occurrence pattern of glacial and high-altitude lakes in the Sikkim Himalaya (Raj et al., 2013; Aggarwal et al., 2017; Debnath et al., 2018). The trend and magnitude of lake changes for various types of lakes in the state remains largely unknown. Further, despite large concentration of SGLs in the Sikkim Himalaya (Aggarwal et al., 2017; Debnath et al., 2018), these lakes have also never been mapped separately to understand their nature and occurrence pattern. The remote location of high mountain lakes and extremely harsh weather conditions restrict their regular and repeat monitoring on field. In this context, analysis of recent and historical satellite data provides unique opportunities for complete and long-term glacial lake monitoring. Hence, this paper utilizes time series remote sensing data to address the above discussed research gaps and thus, the purpose of this paper is to generate comprehensive temporal (decadal) inventory for the last four decades (i.e., 1975–2017) to assess the lake changes. Also, the SGLs have been mapped annually from 2014 to 2017 to give an overview of their distribution and occurrence pattern.
The glaciers in the Sikkim have been, in general, receding with highly variable rates during the recent decades. While large number of glaciers exhibit rapid recession, others have also shown slight advancement. Analyzing the 26 glaciers of Sikkim, Raina (2009) reported that majority of the glaciers (25) retreated with an average rate of ~13 m a−1 and the retreat rate varied from some ~2 to 40 a−1 during 1976–2005, except for one glacier which showed a slight advance of ~1.3 m. The Zemu glacier retreated by ~863 m between 1909 and 2005 (Raina, 2009). A retreat rate of 6 m a−1 between 1976 and 1981 was observed in Changme Khangpu glacier (Shukla et al., 1983). Use of 32Si, 137Cs, and 210Pb chronology revealed a uniform ice accumulation rate of 0.7 m a−1 and a surface ice velocity of 40 m a−1 compared to the basal flow of 0.01 m a−1 for this glacier between 1969 and 1981 (Shukla et al., 1983). The monitoring of snout position of East Rathong glacier in west Sikkim revealed a retreat of 460 m (13.9 a−1) from 1980 to 2012 (Luitel et al., 2012). South Lhonak glacier receded remarkably by 1.9 km during 1962–2008, leading to the development of a consolidated moraine dammed lake in the deglaciated proglacial region (Raj et al., 2013). A recent study by Basnett et al. (2013) mapped 39 glaciers (covering ~75% of the total ice reserve) in the state and found that glaciers in Sikkim lost an area of ~3.3 ± 0.08% between 1989/90 and 2010. They also report an increase in the debris-covered area by 6.5 ±1.4 km2 during this period.
This pronounced glacier depletion has primarily been responsible for the large concentration of lakes in the Sikkim Himalaya. The lake inventory by International Centre for Integrated Mountain Development (ICIMOD) serves as a baseline data in the study area (Campbell, 2005). Using Landsat ETM+ images, they identified 266 lakes (>0.1 km2) in 2003, out of which 14 lakes were found to be potentially dangerous. The 3 lakes (out of 14) were reported to have evidence of past GLOF supported by reduction of area of lake (Raj et al., 2013). Raj et al. (2013) used Indian Remote Sensing (IRS) Resourcesat-1 Linear Imaging Self Scanning (LISS)—III images (23.5 m) acquired between 2005 and 2010 to make a systematic lake inventory in the Sikkim Himalaya. Their final database shows a total number of 320 glacial lakes in 2010. However, they did not apply any minimum threshold for lake area mapping. Moreover, Raj et al. (2013) also investigated the temporal change of 14 potentially hazardous lakes suggested by ICIMOD and found that 12 lakes showed clear increase in area from 2003 to 2010. Recently, Aggarwal et al. (2017) used IRS Resourcesat-2 LISS-IV data (5.8 m) to generate glacial and high altitude lake inventory and also assessed the GLOF susceptibility in the Sikkim. Due to high resolution base data they have been able to map relatively smaller lakes, thus, they identified a total of 1,104 lakes situated above 3,500 m above sea level (asl), out of which only 472 have area >0.01 km2. By assessing the GLOF susceptibility of these 472 lakes using pre-defined criteria, they found 21 lakes to be potentially hazardous. Based on analytic hierarchy processes (AHP), they further classified that out of 21, 5 of these glacial lakes have low, 14 have medium and 2 have high GLOF susceptibility. Also, a study by Debnath et al. (2018) has reported the glacial lake dynamics and lake surface temperature in Kangchengayo-Pauhunri Massif, a part of Sikkim Himalaya, using Landsat images acquired between 1988 and 2014. There results indicate an expansion in lake area by 8.38% during 1988–2014 with larger increase found at high altitudinal zones between 5,000 and 5,400 m asl. The surface temperature of lakes has also increased substantially from −0.27°C (1988) to 4.54°C (2014) (Debnath et al., 2018). They concluded that proglacial lakes on the northern slope are expanding rapidly due to warming of air temperature which induces a high rate of snowmelt. Also, proglacial lakes of northern side (>5,000 m, a.s.l.) and SGLs of Kangchengayo-Pauhunri Massif were reported to have the potential for causing GLOF. This brief literature review highlights following gap areas in the glacial lake research in the Sikkim Himalayan region: (i) most of the studies till date have focused on only one time inventorying of the lakes, (ii) temporal inventories exist for less than one decade (i.e., 2003–2010) and need upgradation, (iii) decadal (1988–2014) variation in lakes has been carried out only for a part of Sikkim Himalaya, (iv) understanding about distribution pattern of lakes in the Sikkim Himalaya is still limited and (v) SGLs have never been separately mapped to assess their occurrence pattern in the region.
Based on the above mentioned research gaps, the first objective of present study is to prepare a comprehensive temporal (decadal) inventory of glacial and high-altitude lakes in the Sikkim Himalaya for 1975, 1991, 2000, and 2017. SGLs, though not directly prone to catastrophic outbursts, may coalesce and form proglacial lakes. Considering the high variability of SGLs on spatio-temporal scale, the second objective of this paper is to assess the temporal variations in number and area of SGLs by their annual mapping from 2014 to 2017. Further, together with frequency and dimensional changes in SGLs, their activity and occurrence pattern were also monitored annually from 2014 to 2017 in order to better understand their genesis and dynamics.
The study area pertains to the Sikkim, eastern Himalaya extending from 27° 00′ 46′′ N to 28° 07′ 48′′ N latitude and 88° 00′ 58′′ E to 88° 55′ 25′′ E longitude (Figure 1). The state covers an area of about 7,096 km2, more than 43% of which consists of steep slopes with a rugged terrain. The world's third highest mountain peak, Mt. Khangchendzonga with an elevation of 8,586 m above sea level (asl) is located here whereas the minimum elevation is about ~300 m asl, resulting in very high relief range (Basnett et al., 2013). The Tista and Rangit are the two important rivers originating from the state and are characterized by highly glaciated upper reaches. As per the Glacier Atlas of India, there are 449 glaciers covering an area of 705.54 km2 (based on Survey of India Topographic maps) distributed in four 5th order basins viz. East Rathong (n = 36; 58.44 km2), Talung (n = 61; 142.90 km2), Changme Khangpu (n = 102; 144.35 km2) and Zemu (n = 250; 359.85 km2) (Raina and Srivastava, 2014). As per ICIMOD inventory, there are 285 glaciers in Tista basin covering and area of 576.51 km2. Many glaciers in Sikkim are covered by debris (Scherler et al., 2011). The Zemu glacier is the largest glacier in eastern Himalaya having a total surface area about 42 km2 with 20 km length and originates from the eastern slope of Khangchendzonga mountain peak (Debnath et al., 2018). The average snowline of glaciers in Sikkim was observed to be ~6,000 m asl in January 1990 (Basnett et al., 2013). As per most recent estimates, there are 472 glacial and high-altitude lakes (>0.01 km2) in the state (Aggarwal et al., 2017). Figure 2 shows the example of two lakes in the study area that were identified in the recent OLI image and Google Earth as well as in field.
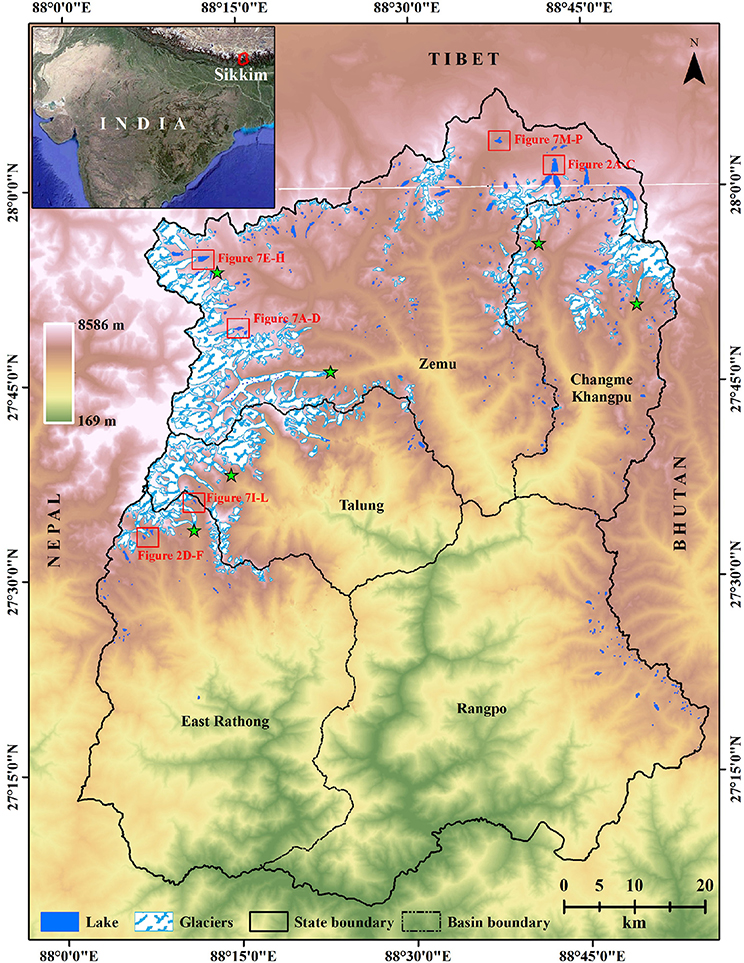
Figure 1. Location map of study area. The glacier polygons overlain on image are derived from GLIMS inventory. The lake polygons shown in the map are of the year 2000, mapped using Landsat ETM+ image. The red rectangles display the location of lakes shown in Figures 2, 7. The star marks show the location of glaciers included in annual mapping of supraglacial lakes (SGLs).
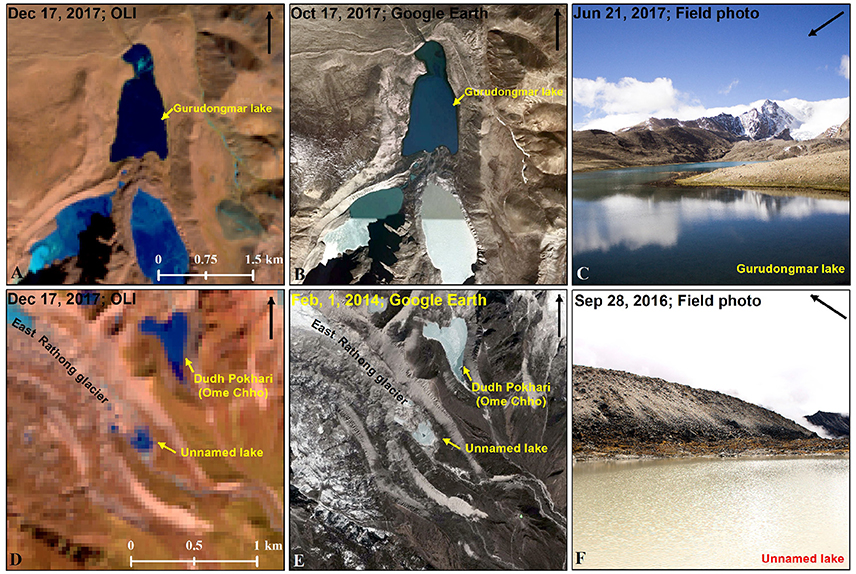
Figure 2. Map showing the satellite image and field photograph of two lakes in the study area. Panels (A–C) display the appearance of Gurudongmar lake on OLI, Google Earth and field, respectively. Panels (D–F) shows the appearance of an unnamed lake developed near the snout of East Rathong glacier on OLI, Google Earth and field, respectively. Black arrows shown in all the panels show the north direction. For location of lakes please refer Figure 1.
Though the state has small spatial extent (extending ~114 km from north to south and ~64 km from east to west), various ecozones from subtropical, temperate, subalpine to alpine can be found in the state due to the large elevation gradient (Krishna, 2005). The state has an annual precipitation range of 2,000–4,000 mm (http://www.sikkimipr.org) mainly due to Asian monsoon (>80%; Bookhagen and Burbank, 2010). Figure 3 shows the mean monthly temperature and precipitation in highly glacierized North Sikkim from 1901 to 2016 [acquired from Climate Research Unit (CRU) Time Series (TS) Version 4.01; (Harris et al., 2014)]. Unlike western Himalaya, snow accumulation and ablation patterns are different in Sikkim Himalaya as snow covers about 35–40% of state even in the summer months (Luitel et al., 2012; Basnett et al., 2013; Figure 3). There is also evidence of a regional trend of temperature rise in the state during the last three decades. The meterorological station at Gangtok (~1,800 m asl) showed an increase of 1.03°C between 1987 and 2011 in mean annual air temperature (Basnett et al., 2013).
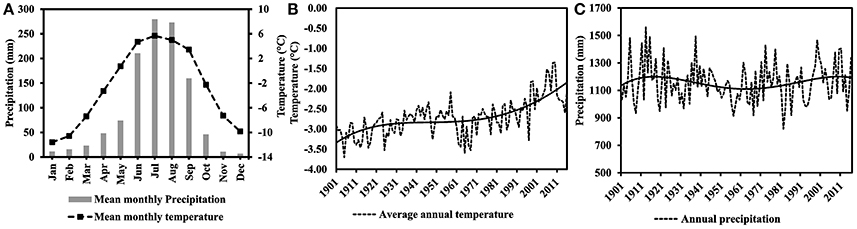
Figure 3. Climate data for Sikkim Himalaya. Mean monthly temperature and precipitation from 1901 to 2016 (A). Panels (B,C) show the average annual temperature and annual precipitation form 1901 to 2016, respectively [Date source: Climate Research Unit (CRU) Time Series (TS) Volume 4.01].
This study utilized data from multiple platforms and sensors acquired between 1975 and 2017. To avoid snow and cloud cover, we selected satellite images between October to December as the study area receives minimum precipitation in these months (Basnett et al., 2013). Declassified Hexagon KH-9, Landsat (orthorectified L1T)- Thematic Mapper (TM), Enhanced Thematic Mapper Plus (ETM+), Operational Land Imager (OLI) and Sentinel-2 (orthorectified L1C) Multi-Spectral Instrument (MSI) data were obtained from the US Geological Survey (USGS; https://earthexplorer.usgs.gov/). Shuttle Radar Topographic Mission (SRTM) Global Digital Elevation Model version-3 (GDEM-v3) was also downloaded from https://earthexplorer.usgs.gov/ and used here as an elevation reference. The Landsat images are already radiometrically corrected and projected in UTM coordinate system (Zone 43 N) with WGS 84 datum (https://earth.esa.int/documents). The Hexagon images were acquired using a non-metric panoramic camera which makes their geometry difficult. Hence, a projective transformation was performed based on suitable reference points and SRTM GDEM-v3 to rectify the Hexagon image taking 2000 ETM+ image as a base. This provides results within an acceptable error (< 1 pixel). Table 1 lists the salient features of satellite data used in this study. The meteorological data (1901–2016) was acquired from the Climate Research Unit (CRU) website https://crudata.uea.ac.uk/cru/data/hrg/.
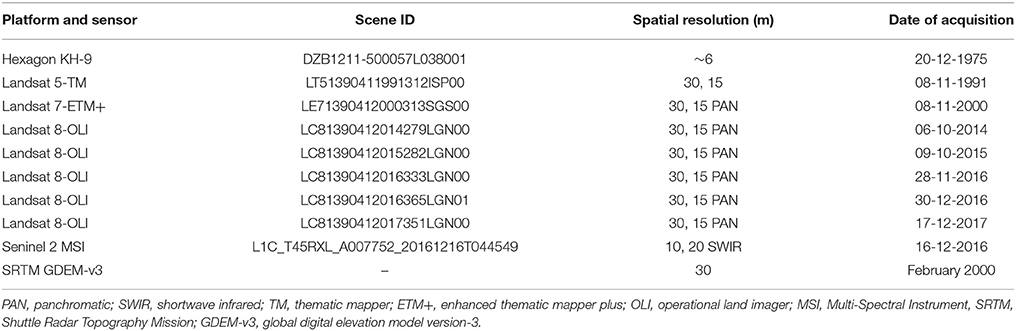
Table 1. List of satellite data used in the study area (i.e., Sikkim).
Based on our objectives, the adopted methodology can be grouped into two parts: (1) decadal mapping of glacial and high-altitude lakes for the years 1975, 1991, 2000, and 2017 and (2) annual mapping of supraglacial lakes from 2013 to 2017. In the subsequent paragraphs we discuss the methodology adopted for each part separately.
Automatic lake mapping methods from optical or radar satellite imagery are well introduced (e.g., Huggel et al., 2002; Mergili et al., 2013; Nie et al., 2013; Raj et al., 2013) and advantageous in the way that they are mostly based on spectral segregation of entities which considerably reduces the interpretational biases. However, in the case of small features such as glacial lakes, chances of misclassification grossly increase owing to spectral mixing due to moderate resolution of the data used. Presence of mountains shadows, cloud cover and seasonal snow may also introduce sizable errors (Zhang et al., 2015). Therefore, manual post-editing is almost required and recommended in all the automatic lake mapping methods (Mergili et al., 2013). In view of these facts we chose to adopt a hybrid methodology for delineation of the lake boundaries here. The hybrid methodology comprises of firstly, automatically delineating all the lakes using normalized difference water index (NDWI = BNIR−Bblue/BNIR+Bblue) and band ratio (Bgreen/BNIR) following the method outlined in Gardelle et al. (2011) (Figure 4). In order to map the glacial lakes in entirety, we purposely selected an initial low threshold for NDWI and band ratio which expectedly resulted in overestimation of area. Subsequently, all polygons with area < 0.003 km2 were omitted (Gardelle et al., 2011; Zhang et al., 2015) and manual editing was carried out wherever required to account for misclassifications owing to threshold value, shadows and clouds (Gardelle et al., 2011; Mergili et al., 2013; Nie et al., 2013; Aggarwal et al., 2017) (Figure 4). While correcting the lake shape we tried to digitize the lake boundary line along the pixel boundaries. This hybrid methodology was applied on year 2000 imagery for creation of the baseline data. Then the 2,000 lake outlines were adjusted to the situation in 1975, 1991, and 2017 based on the Hexagon, TM and OLI data, respectively (Bolch et al., 2010). Finally, we followed the classification schema of Mergili et al. (2013) and Gardelle et al. (2011) for categorization of lakes and the lakes were grouped into four main classes- supraglacial lakes (SGL), pro/peri glacial lakes in contact with glacier (PGLC), pro/peri glacial lake away from glacier (PGLA; based on proximity to glacier) and other lakes (OL). For PGLA category we considered a buffer of 2.5 km from the glacier boundaries. Lake within this buffer distance of glacier boundaries are assumed to have formed through glacial action. Previously Wang et al. (2013) and Zhang et al. (2015) used a buffer distance of 10 km to determine glacier fed lakes in the Himalaya. Our considered buffer is conservative and based on the understanding that nearly all the glaciers in the Himalaya have retreated by approximately a kilometer since the Little Ice Age (AD 1550–1850; Mool et al., 2001). The OL denote here all the other high altitude lakes in the study area that do not qualify for the first three categories.
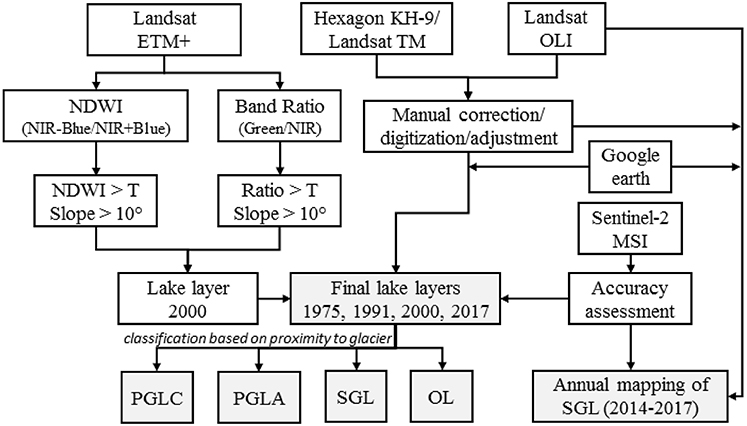
Figure 4. Flowchart of lake mapping in glacial and high-altitude lakes based on Landsat images. The threshold (T) is determined empirically by visual inspection. SGL, supraglacial lakes; PGLC, peri/proglacial lakes in contact with glaciers; PGLA, peri/proglacial lakes away from glacier; OL, other lakes.
The annual mapping of supraglacial lakes was performed from 2014 to 2017 by on-screen digitization on pan-sharpened OLI and MSI images. Since, majority of supraglacial lakes in the study area are smaller than the threshold applied in decadal mapping (< 0.003 km2), use of medium-resolution imagery (e.g., 30 m) is likely to lead to large classification omissions of supraglacial lakes (Watson et al., 2016). Hence, we used pan-sharpened OLI images with aim to identify and map relatively smaller SGLs. The increased resolution of pan-sharpened images (15 m) and Sentinel-2 MSI (10 m) allowed successful delineation and assessment of dynamics of all the SGLs with area >900 m2. Finally, on the basis of their activity and occurrence pattern the SGLs were categorized into four types: persistent, recurring, drain-out and new-formed. Here, persistent term has been used for the lakes that sustained for at least one consecutive year. Recurring type refers to the lakes that reappear at approximately the same location at a later point in time after the drain-out event. Drain-out type denotes the lakes that get emptied once and do not reappear. New-formed are newly developed lakes compared to the previous year.
Quantification of uncertainty is essential to substantiate the significance of results which in turn aids proper interpretation. The accuracy of extracted lake information depends on pixel resolution, image quality, radiometric and geometric corrections, classification algorithms, threshold value selection and expert experience (Gardelle et al., 2011; Wang et al., 2013). Given the lack of ground truth and field measurements, it is difficult to describe accuracies precisely. In the present study, the error in image co-registration does not play a key role, because the comparison of the glacial lake areas was not made pixel by pixel but rather entity by entity (Gardelle et al., 2011; Wang et al., 2013). Here, we estimate the image resolution induced uncertainty associated with lake measurements on the basis of methods suggested by previous studies (Fujita et al., 2008; Gardelle et al., 2011; Salerno et al., 2012; Wang et al., 2013). Most of these studies used a linear resolution error (LRE) of 0.5 pixels assuming that shoreline of the glacial lake passes through the center of the pixel. Following formula has been used to quantify the uncertainty in lake. (Ul)-
where N in number of pixels along the boundary and A is area of pixel. This yielded uncertainty ranging from 7.55% for larger lakes to 100% for smaller lakes. This overestimation of uncertainty in case of smaller lakes arises from the fact that for small lakes all the pixels are considered as boundary pixels which contribute in the error estimation. However, this large error is theoretical and may be considered indicative only because we applied manual corrections to make sure that mapped boundaries exactly follow the actual lake boundaries specifically in case of small lakes. To interpret the uncertainty meaningfully, we classified the lakes in three different classes based on their size viz. < 0.01 km2, 0.01–1 km2 and >1 km2. The average uncertainty for these classes is calculated to be 60.14, 21.05, and 9.09%, respectively. Previously, taking 1 pixel as LRE, Gardelle et al. (2011) estimated an uncertainty of 28.82% in area estimation of Imja lake. For the area estimation of same lake, Fujita et al. (2008) reported an error of 4.27%, taking LRE of 0.5 pixel. Wang et al. (2013) reported an uncertainty of 10.8% in lake area mapping considering the LRE of 0.5 pixels. A recent study by Debnath et al. (2018) in the Sikkim Himalaya reported an uncertainty of 5.22% in total lake area. Since previous studies report errors in lake area estimations ranging from 4.27 to 28.82%, our uncertainties, though on a higher side but are comparable with them for larger lakes (i.e., 9.09%).
We also validated our decadal lake mapping results by comparing lake outlines mapped from 30 m Landsat OLI (2017) with those mapped from 10 m Sentinel-2 MSI image (2016). A spatially representative sample of 40 lakes (10 lakes from each category of lakes) were randomly selected for this comparison. The average area variation was found to be about 7.55% between OLI and MSI images. This comparison gives a relatively reasonable estimate of the image resolution based mapping uncertainty as compared to the earlier method. This proves that the error involved is comparable with past studies and results can be used with confidence. Therefore, a constant error of 7.55% may be assumed for each result figure mentioned in the manuscript.
There are a total of 463 glacial and high-altitude lakes (>0.003 km2) in the Sikkim Himalaya based on 2,000 ETM+ image, covering an area of 29.30 ± 2.21 km2 (Figure 5A). The size of lakes varies from 0.003 to 1.75 km2 with a mean of 0.06 km2 (Figure 5A). The Shapiro-Wilk distribution test statistics at 95% confidence interval reveals that the distribution of lake area is not normal but skewed with a factor of 6.38 (Figure 5B). Out of 463, about 87% (n = 401; 10.24 km2) lakes have an area < 0.1 km2 but contribute only ~35% to the total area, whereas only ~13% (n = 62; 19.06 km2) lake have an area >0.01 km2 but comprise ~65% of the total area (Figure 5A). There are only 1% (n = 4; 5.15 km2) lakes larger than 1 km2 (Figure 5A). The median area of lake in the study area is 0.02 km2, which is smaller than the mean (0.06 km2) because of presence of few large lakes (Figure 5A). Nevertheless, the median lake area indicates the dominance of small-sized lakes with a positively skewed distribution.
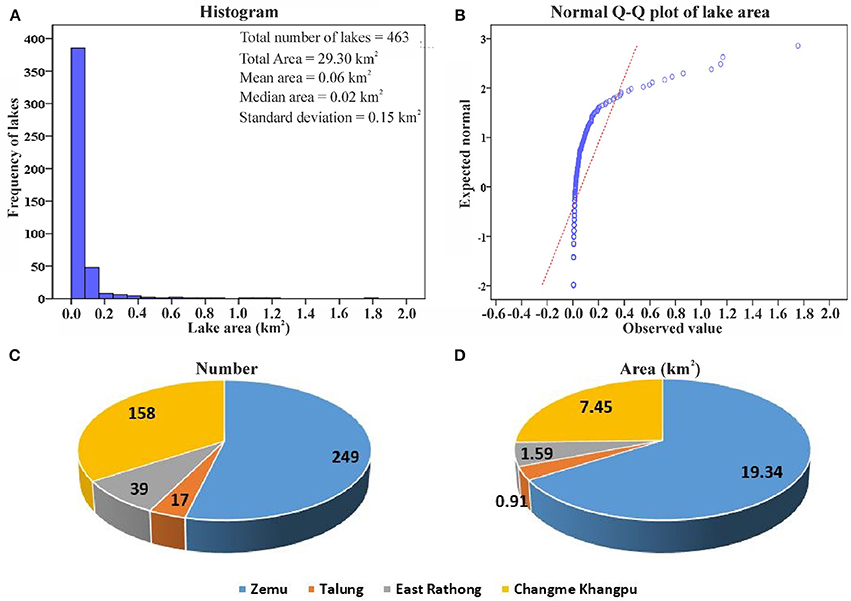
Figure 5. Distribution of lake area (2000) in different basins. (A) Frequency distribution table. Note the maximum proportion of small lakes having area < 0.01 km2. (B) Normal Q-Q plot of lake area using Shapiro-Wilk distribution test. Panels (C,D) show the distribution of number and area of lakes in different basin of the Sikkim Himalaya, respectively.
The basin-wise distribution of the lakes shows their maximum concentration in the Zemu basin (53.78%), followed by Changme Khangpu (34.13%), East Rathong (8.42%), and Talung basin (3.67%) (Figures 5C,D). Here Changme Khangpu basin also includes the lakes of Rangpo basin. Further, the classification of lakes shows that OL constitutes maximum proportion of total lakes number (57.45%) and area (36.59%) (Table 2). Interestingly, the PGLC though comprises of only 7.56% of lake number but shares 35.90% of total area (Table 2). The mean size of PGLC is also higher (0.30 km2) than all other type of lakes (Table 2). The SGLs amount to 10.80% of total number but contribute only 2.46% to the total area (Table 2).
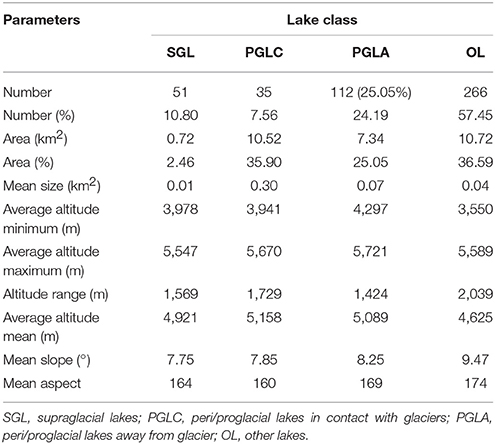
Table 2. Lake characteristics for 2000 in the Sikkim.
The mean altitude of the lakes in the study area is 4,811 m asl. Figure 6A reveals that maximum number of lakes (n = 178; 17.32 km2) occur between an elevation range of 5,000–5,500 m asl, followed by 4,500–5,000 (n = 150; 6.43 km2) and 4,000–4,500 m asl (n = 111; 3.80 km2). Only 13 (1.20 km2) and 11 (0.41 km2) lakes have been found below 4,000 and above 5,000 m asl, respectively (Figure 6A).
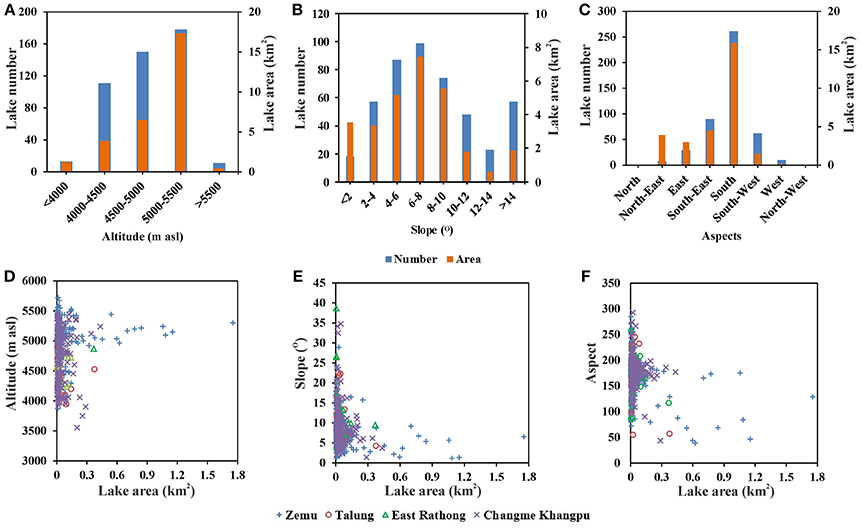
Figure 6. Characteristics of lakes in 2000. Lake distribution in various altitudinal ranges (A), Slope (B), and aspect classes (C). Panels (D–F) displays the altitude-wise, slope-wise and aspect-wise distributed of all the lakes located in four different basins of Sikkim Himalaya, respectively. Notice the concentration of most of the lakes in 5,000–5,500 m altitude class. It can also be seen from figure that mean slope of most of the lakes is < 10°. The Southern aspect comprises of maximum number of lakes.
The basin-wise altitude distribution also confirms that most of the lakes cluster between 4,000 and 5,500 m asl (Figure 6D). The class-wise altitude distribution shows the maximum altitude range of OLs and PGLCs (Table 2). The SGLs are limited to the altitude range between 3,978 and 5,547 m asl with a mean altitude of 4,921 m asl (Table 2). The mean altitude of all other lakes is >5,000 m asl (Table 2).
The slope analysis demonstrates that maximum number of lakes (n = 99; 7.44 km2) are located in slope class of 8–10° followed by 6–8° class (n = 87; 5.16 km2) (Figure 6B). Overall, a total of 72% lakes were situated on slope < 10°, 83% on slope < 12° and 88% lakes on slope < 14° (Figures 6B,E). Only few lakes (~12%) are located in slope >14° and most of them are OL. The mean slope of all types of lakes is below 10° (Table 2). The SGLs have lowest (7.45°) whereas the OLs have the maximum mean slope (Table 2). The mean slope of PGLCs is also slightly lower than the critical slope of 8° (Table 2).
An assessment of orientation reveals that about 56% of the lakes are located in southern aspect (Figure 6C). The south-east and south-west aspects contain about 19 and 13% of total lakes, respectively. Only 12% lakes are distributed in all other aspects ((Figure 6C). Interestingly, north-west aspect though comprises only < 1% (n = 8), but contributes about 13% to the total lake area. The mean aspect of various types of lakes varies from 164 to 174 (Table 2).
The temporal change in lakes has been estimated for the past four decades, i.e., from 1975 to 2017. We observed a continuous increase in number and area of the lakes since 1975. The number of lakes increased from 425 in 1975 to 466 in 2017 showing an increase of about 9% (Table 3). The total area of lakes showed rather significant increase of ~24%, increasing from 25.17 ± 1.90 km2 to 31.24 ± 2.36 km2 between 1975 and 2017. This shows that the lake area expanded at a rate of 0.15 km2 a−1. Examining basin-wise, all the basins experienced increase in number and area of lakes (Table 3). The maximum and minimum increase in lake number occurred in Zemu (~15%) and East Rathong basin (~2%), respectively. Contrarily, maximum and minimum increase in lake area was observed in East Rathong (~41%) and Zemu basin (~21%), respectively. Interestingly, only one lake increased in the East Rathong basin during the study period (Table 3). The Talung and Changme Khangpu basin experienced an increase in lake number (area) of 14% (32%) and 3% (26%), respectively (Table 3).
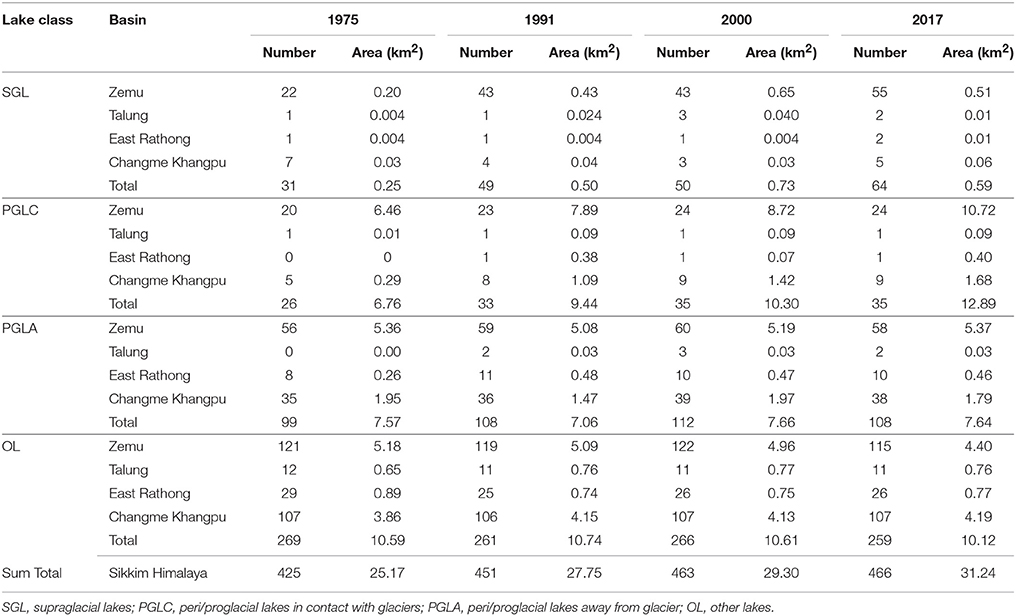
Table 3. Temporal change in various lake types from 1975 to 2017 in the Sikkim Himalaya.
Considering the various lake classes separately, maximum variation in lake number was observed in SGL category which showed an increase of ~106% during the considered period of 42 years (Table 3; Figures 7A–D). The area of SGL increased by ~138% during this period. The number and area of PGLC also increased by ~34 and 90%, respectively (Table 3; Figures 7E–H). Contrarily, no significant variation occurred in the PGLA and OL. The PGLA showed an increase of only ~9% in number and only ~1% in area. A decrease of ~3 and ~4% in number and area of OL, respectively, was apparent in OL category (Table 3; Figures 7I–L,M–P).
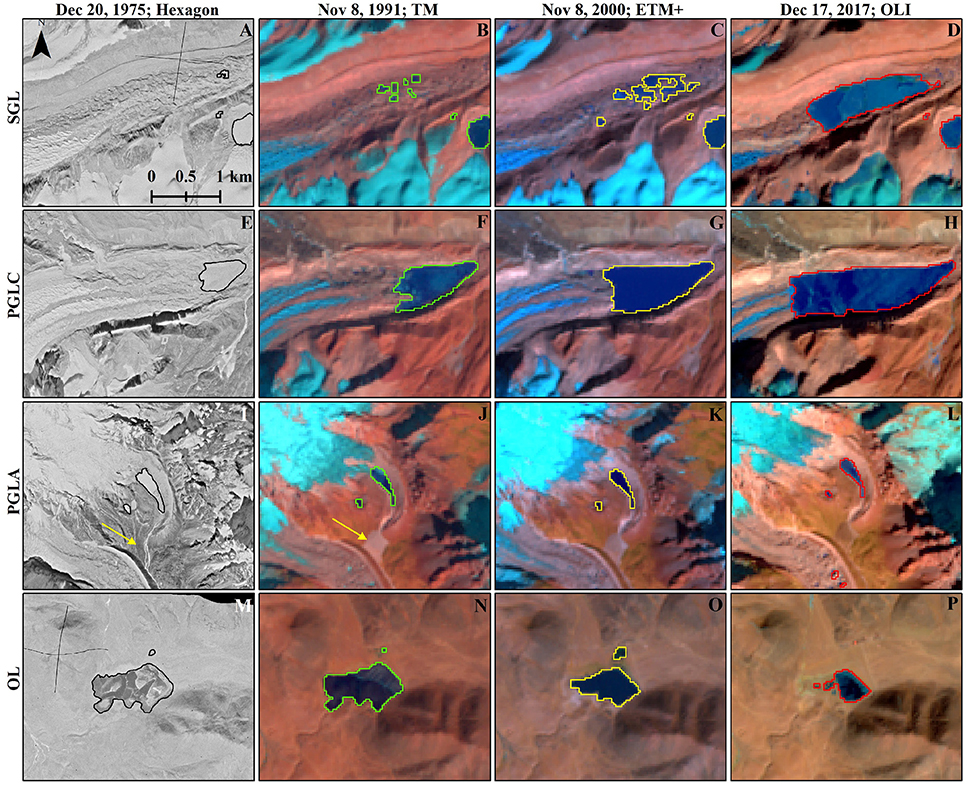
Figure 7. Change in supraglacial lakes (SGL; A–D), pro/peri glacial lakes in contact with glacier (PGLC; E–H), pro/peri glacial lakes away from glacier (PGLA; I–L) and other lakes (OL; M–P) between 1975 and 2017. The yellow arrow shown in panels (I,J) shows the traces of possible lake breach sometimes between 1975 and 1991. For location of lakes please refer Figure 1.
To assess the variability of lake changes, the 42-year time frame was further subdivided into nearly decadal time scale of 16 (1975–1991), 9 (1991–2000), 17 (2000–2017) years (Table 3; Figure 7). Considering period-wise, 1975–1991 was the period of highest increase in lake number (~6%) and lake area (~10%) (Table 3). During 1991–2000, the number and area of lakes increased by ~2 and ~5%, respectively. Only ~1% increase in lake number and about ~6% increase in areas was evident between 2000 and 2017 (Table 3).
Despite a clear overall increase in total number and area of lakes in the study region, period-wise assessment revealed a fluctuating trend of lake number and area variation at basin level (Table 3). Zemu basin experienced a steady increase in lake number and area during the study period with maximum increase in number between 1975 and 1991 (11%), and area between 2000 and 2017 (8%). The lake number in Talung basin increased up to 2000 (with maximum increase of 13% during 1991–2000), but decreased in 2017. The lake area in Talung basin increased by a maximum of ~34% during 1975–1991 and decreased by ~3% during 2000–2017. East Rathong basin showed minimum variation in lake number among all other basins with only one lake increase during 1991–2000 (Table 3). The maximum expansion in lake area of ~36% occurred during 1975–1991 in East Rathong basin. Maximum growth in lake number and area of ~2% and ~10%, respectively took place during 1991–2000 in Changme Khangpu basin (Table 3).
The decadal variation in various types of lakes is summarized in Table 3. While PGLA and OL showed minimum and negligible variation, a significant variation in number and area of SGL and PGLC category can be observed (Table 3). The period 1975–1991 experienced highest growth in number (~58%) and area (~102%) of SGL. Though, during 1991–2000, number increased by only ~2%, but the area of SGLs grew by ~44%. Surprisingly, despite an increase in lake number of ~28%, the area of SGL shrunk by ~18% between 2000 and 2017 (Table 3). The PGLC also experienced maximum progression in number (~26%) and area (~90%) during 1975–1991, followed by 1991–2000 during which the number and area of PGLC expanded by ~6 and ~39%, respectively. After 2000 no new PGLC developed in the study area, however, the area of existing lakes (PGLC) increased by from 2000 to 2017.
The annual mapping of SGLs has been carried out for four consecutive years viz. 2014, 2015, 2016, and 2017 to analyze their nature and occurrence pattern. Here, we did not include the SGLs that have eventually transformed into PGLCs. Also, considering the small size of SGLs, we prefer to present their area statistics in square meter (m2). Results show presence of 81 SGLs in 2014 with a total area of 543,153 m2 (Table 4). In 2015, the total number of SGLs reduced to 78 as ~20% lakes drained out. However, the total area increased by ~30%. Compared to 2014, ~82% lakes were found to be persistent type in 2015 whereas ~17% lakes were newly formed. No, recurring lakes were observed in 2015.
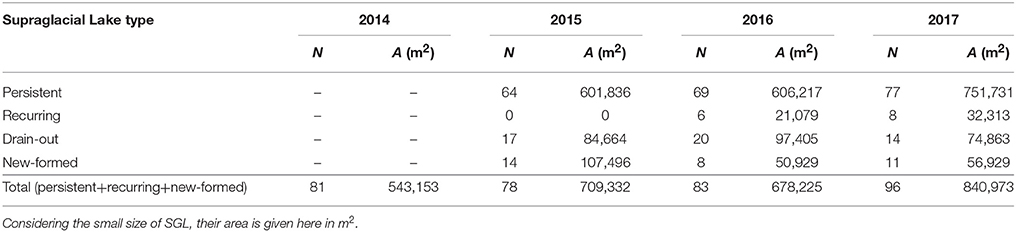
Table 4. Statistics (N = number, A = area) of supraglacial lakes (SGL) during 2014, 2015, 2016, and 2017 in the study area (i.e., Sikkim Himalaya).
In 2016, though the total number of SGLs increased to 83 but the total area was slightly reduced (by ~4%) as compared to 2015 because about ~25% lakes were observed to have drained out (Table 4). Moreover, the lakes in drain-out category were compensated by ~7% recurring and ~9% new-formed lakes. About ~88% of lakes remained persistent during 2015–2016 (Table 4). In the subsequent year (2017), the lake number further increased to 96 along with a rapid areal expansion of ~24% (Table 4). Interestingly, about ~80% lakes remained persistent as compared to previous year (2016) while 8% recurring lakes were observed. Also, while 16% lakes were found to be drained-out, about 11% new-formed lakes were noticed.
Thus, the results indicate abundance of persistent types of lakes in the study region which comprises >80% of total lakes in all the studied years. Further, though the number of lakes has been fluctuating, an increase in total area clearly suggests that the persistent lakes have been continuously expanding. Presence of recurring types lakes reveal that drain-out type lakes have tendency to reappear. Therefore, despite of considerable number of drain-out type lakes which ranges from 15 to 25%, total number of lakes increased between 2014 and 2017 because taken together, recurring and new-formed lakes (ranging 17–20%) compensate them.
Investigating glacial and high-altitude lakes over a large area and monitoring glacial lake dynamics (temporal and spatial changes) are of high priority for the mitigation of GLOF hazards (Nie et al., 2013). Our study presents the first temporal inventory of glacial lakes in the Sikkim Himalaya for four points in time i.e., 1975, 1991, 2000, and 2017 using Hexagon, TM, ETM+ and OLI images, respectively. The present inventory will provide important input for glaciological and hydrological studies (i.e., modeling). We identified 463 glacial and high-altitude lakes (>0.003 km2) in the year 2000 covering an area of 29.30 ± 2.21 km2.
As per the recent estimates, there are 466 lakes (>0.003 km2) in 2017 with a total area of 31.24 ± 2.36 km2. The total number (area) of lakes was 425 (25.17 ± 1.90 km2) in 1975 and 451 (27.75 ± 2.10 km2) in 1991. Campbell (2005), Raj et al. (2013), and Aggarwal et al. (2017) have carried out significant work on a glacial lake inventorying in the Sikkim Himalaya. Table 5 compares the results of these inventories. Campbell (2005) and Raj et al. (2013) reported relatively less number of lakes (Table 5). This may be because they have mapped only glacial lakes and did not consider other high-altitude lakes. Another reason for possibly less number of lakes in the inventory by Campbell (2005) is higher threshold of 0.1 km2 which led to exclusion of several small lakes like SGLs. For instance, Zemu glacier is the largest glacier in the study region and ablation portion of this glacier is studded with numerous SGLs that are clearly identifiable using Landsat and on Google Earth images. Contrarily, only three SGL were mapped on Zemu glacier by Campbell (2005) [see Figure 3 in Raj et al. (2013)]. Nevertheless, our results show an excellent match with Aggarwal et al. (2017) who used high resolution image to map the lakes with a variation of only 1.29% in number and < 1% in area (Table 5). This small variation may be attributed to the difference in resolution of data used (Table 5).
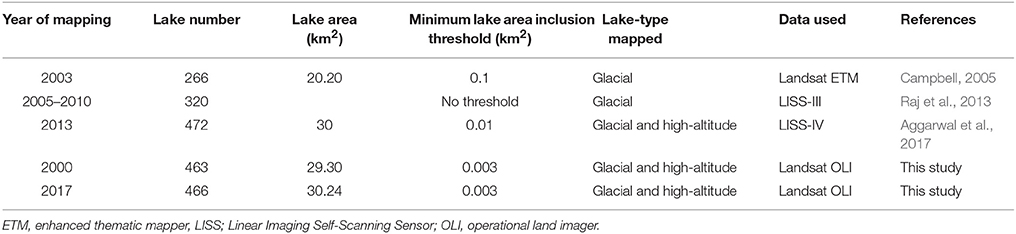
Table 5. Comparison of lake inventories in the Sikkim Himalaya.
The study area is dominated by the small sized lakes. The mean size of the lakes in the Sikkim Himalaya is 0.06 km2 but the median size is quite lower (0.02 km2). Recently, Debnath et al. (2018) carried out lake mapping in Kangchengayo- Pauhunri Massif and found that about 70% of lakes have the size < 0.1 km2. Not only in eastern Himalaya but the small lakes dominate in the entire third pole region (Zhang et al., 2015). Zhang et al. (2015) found that about 68% lakes in Himalaya-Karakoram-Tibet region area fall in the size class of < 0.1 km2 (see Figure 3 in Zhang et al., 2015).
Altitudinal distribution of lakes in the study area clearly shows that all the lakes are located above 3,500 m asl. Maximum concentration of lakes is limited to elevation range of 5,000–5,500 m asl (Figure 6A). This is in accordance with the Zhang et al. (2015) and Debnath et al. (2018). The mean elevation of all types of lakes is >5,000 m asl except for SGL (Table 2). Slight lower mean altitude of SGL indicated their concentration on lower-middle ablation zone of the glaciers (Benn et al., 2012). This also indicates that the relative elevation of debris-covered glacier (over which supraglacial lakes have formed) extends up to much lesser altitude than other types of glaciers (Thompson et al., 2016; Debnath et al., 2018). The average altitude of the snowline is reported to be ~6,000 m asl (in 1990; Basnett et al., 2013) in the Sikkim Himalaya. Thus it may be assumed that most of the SGL are located in the lower ablation zones of the glaciers.
The high elevation of many lakes, particularly PGLA and OL, leads to the assumption of a certain influence of permafrost, possibly affecting the stability of the dams themselves as well as the stability of adjacent slopes and rock walls (Mergili et al., 2013). Since, no detailed and up-to-date permafrost investigations are available for the study area, here we have utilized global datasets of the potential permafrost distribution (Gruber, 2012) to assess the relationship if any between the occurrence of PGLA and OL and permafrost concentration. Figure 8 shows the probability of occurrence of permafrost as well as distribution of PGLA and OL in the study area. For quantitative analysis we classified the Permafrost Zonation Index (PZI) range of 0–1 into five sub-classes (see Table 6), where the lowest value shows the permafrost occurrence only in very favorable conditions and highest values shows the permafrost occurrence in nearly all conditions (Figure 8). Table 6 shows the percent of PGLAs and OLs that occur in each PZI class. Here, we incorporate the lakes that intersect with the PZI class boundaries instead of accounting lakes that are completely within the class because in latter case large number of lakes remain unclassified. However, this resulted in slight exaggeration (~25–30%) but can be interpreted meaningfully. The results show large concentration of PGLA where the occurrence of permafrost is quite certain (Table 6; Figure 8). The distribution of OL, though does not exactly correspond with the permafrost occurrence but it can be inferred from the results that most of these lakes are located in proximity of PZI zones (Table 6; Figure 8).
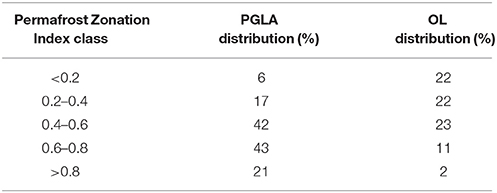
Table 6. Distribution of peri/pro glacial lakes away from glaciers (PGLA) and other lakes (OL) in different sub-classes of Permafrost Zonation Index (PZI) in the Sikkim Himalaya.
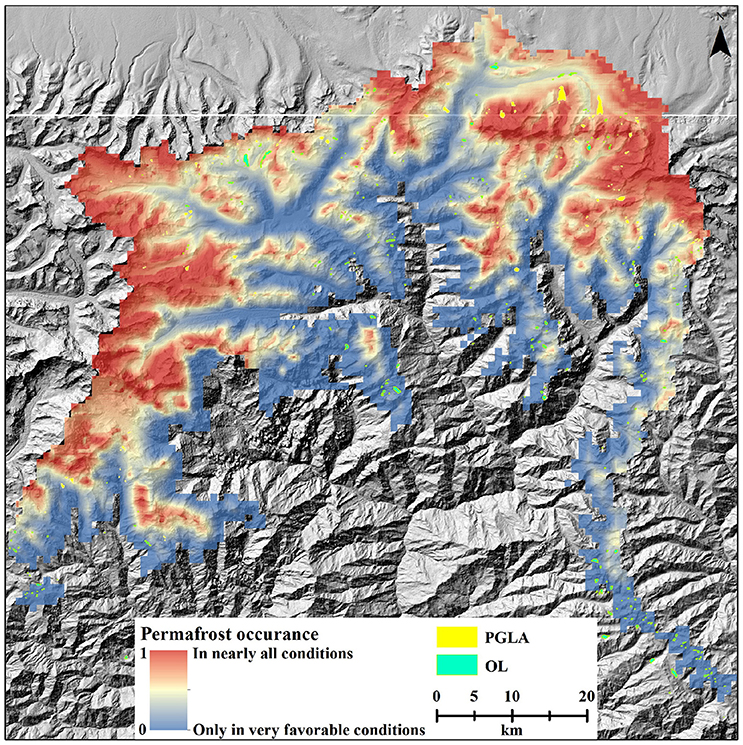
Figure 8. Occurrence of permafrost in the state as shown by Permafrost Zonation Index (PZI) and distribution of peri/pro glacial lakes away from glaciers (PGLA) and other lakes (OLs) (Data source of PZI: Gruber, 2012).
The higher mean elevation of lakes in the study area makes them vulnerable to change (Zhang et al., 2015). In his study, covering entire third pole region, Zhang et al. (2015) found that mean area changes were greater (>40%) among glacial lakes at elevations exceeding 5,200 m than among those at elevations of 3,400–5,200 m from ~1990 (2000) to 2010. This elevation dependence of lake area change confirms a dominant role of glacier melt in most lake expansion (Reynolds, 2000; Gardelle et al., 2011; Salerno et al., 2012; Zhang et al., 2015).
Our results show that most of the lakes in the study area have a slope < 10° (Table 2). We found that mean slope of SGL category is the lowest among all other types of lakes (Table 2). The slope is one of the important factors controlling the development and expansion of lakes which is discussed in detail in the next section. Lake orientation analysis reveals that most of the lakes in the study area have a southern aspect (Figures 6C,F). It is a well-known fact that west and southern slopes receive more solar radiation among other aspects (DeBeer and Sharp, 2009; Garg et al., 2017). Higher insolation leads to enhanced melting of snow/ice which may get impounded behind the natural barriers or accumulate in already existing topographic depressions giving rise to development of different kinds of lakes. This assumption may explain the abundance of lakes in southern aspect in the region.
The change in lake number and lake area have been studied for the past four decades (1975–2017) and for three time periods, i.e., 1975–1991, 1991–2000, and 2000–2017 (Table 3; Figure 7). Our results show that, considering the total time period of 42 years, the lake number has increased by ~9% whereas the lake area expanded by about 2.5 time of lake number (24%) (Table 3). This finding is in accordance with the previous work done by Nie et al. (2013) in the Nepal Himalaya. They reported that pre-existing, glacial lakes contributed the most to areal expansion rather than the newly formed lakes. Though no temporal inventory exists dedicatedly for the Sikkim Himalaya, Raj et al. (2013) compared there inventory with that of (Campbell, 2005) and reported a total number of lake to be 320 in 2010, as compared to the 266 lake mapped by Campbell (2005) in 2003, showing an increase of ~20%. They attributed this difference largely to the difference in the threshold adopted by the two studies. Debnath et al. (2018) estimated the temporal change in 68 glacial lakes between 1988 and 2014 in part of Sikkim Himalaya. They found that the lake area increased with a rate of 0.033 km2 a−1 during 1988–2014. Their reported change is slightly lower than the present study (0.15 km2 a−1). This difference can be explained by the fact that only few SGLs and PGLCs fall in the study area considered by them. For instance, maximum numbers of SGLs are concentrated in Zemu glacier of the Sikkim Himalaya which is outside their study area. Our results reveal that maximum variation has occurred in SGLs and PGLCs categories only which contribute to higher average change rate as observed in our study (Table 3; Figure 7). Nevertheless, the change rates are consistent with the previously published estimates for the Himalaya-Tibet region (Table 7). Table 7 compares the area change reported by various researchers in the Himalaya and Tibetan region which ranges from 8 to 123%.
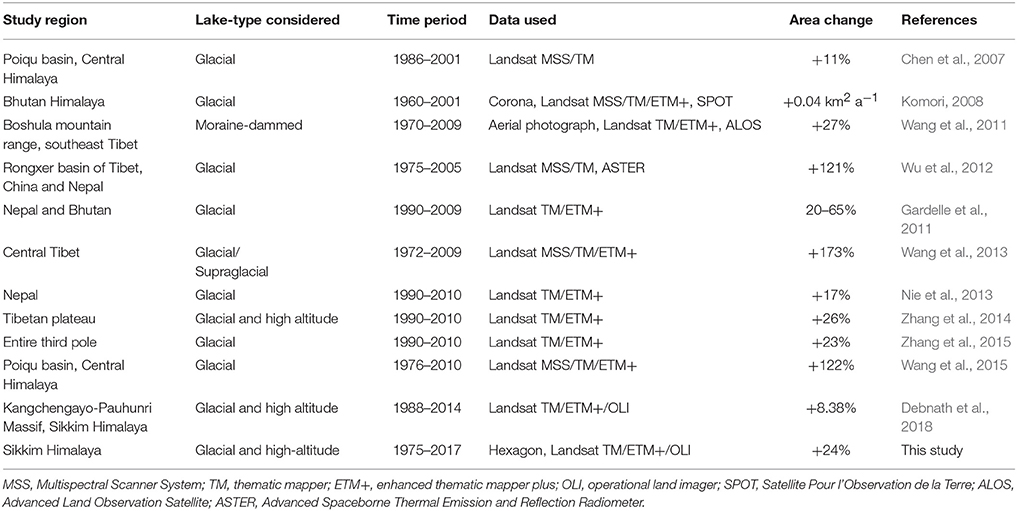
Table 7. Lake growth rate reported in Tibet and Himalayan region.
Our results show the maximum variation in SGLs and PGLCs category only (Table 3). The Sikkim has large concentration of these categories which also exhibit a dramatic enlargement during the study period (Tables 2, 3). Reynolds (2000) reported that glacial lakes form in those parts of glaciers where the slope in < 2°. However, it may be noted that gentle slope angles in themselves are not sufficient for the formation of supraglacial ponds. There must be appropriate mass balance conditions to permit the formation of sufficient meltwater. Additionally, the flow speed of < 10 m a−1 also supports the development of supraglacial ponds (Benn et al., 2012; Sakai, 2012). Thus, the combination of appropriate configuration of surface inclination, surface velocity and surface lowering of glaciers are significant indicators of glacial lake expansion. As per Scherler et al. (2011) southern-central Himalaya (an aerial classification in their study which also includes the Sikkim Himalaya) has the largest concentration of stagnant glaciers. The surface lowering in the eastern Himalaya (particularly in Nepal and Bhutan) also ranges from −0.34 to −0.38 m a−1 (Kääb et al., 2012; Brun et al., 2017). These conditions coupled with debris-covered gentle sloping tongues (Basnett et al., 2013) are probably responsible for larger concentration of SGLs in the study area.
SGL once formed, tend to become hotspot of enhanced melting. Water temperature plays a vital role in the expansion of glacial lakes (ice-contact) and melting of subaqueous ice or ice cliffs (Sakai et al., 2009; Benn et al., 2012). Sakai et al. (2000) found that heat absorbed at the surface of pond is about 7 time higher than the average for the whole debris-covered zone. The warm water in the pond enlarges the englacial conduit that drains water from the pond and produces internal ablation. The sub-aqueous calving occurred in supraglacial lakes could also lead to collapse of roof of englacial conduit which would accelerate the ablation process (Sakai et al., 2000; Benn et al., 2012). The backwasting of exposed ice-cliffs bordering the SGL also contribute significantly in the ablation process (Thompson et al., 2016; Miles et al., 2017). Thompson et al. (2016) found that despite of small total area (5% of total ablation area), backwasting of ice-cliffs contributed to 40% in total mass loss in Nojumpa glacier. This feedback mechanism may also be responsible for expansion of SGLs in Sikkim Himalaya.
The annual mapping of SGL reveals existence of 96 lakes in 2017 with a total area of 840,973 m2 as compared to 64 lakes mapped in decadal scale with a total area of 589,887 m2. This large difference in number (~33%) and area (~29%) shows the efficiency of large resolution pan-sharpened images that allowed for extraction of relatively smaller supraglacial ponds. The total number of SGLs reported in annual mapping may not be exhaustive and likely to increase (though marginally) as availability of snow and cloud free images restrict the extraction of all the SGL on all the glaciers. For instance, we observed 3 SGL on Talung glacier (Talung basin) but their dynamics could not be assessed for 2014–2017 period because of frequent presence of cloud on this glacier. Nevertheless, the five main glaciers that have SGLs on their ablation zones are- Khangkyang Khangse, Changme Khangpu, Jonsang, Zemu, and Ongiankthang. Figure 1 shows the location of these glaciers. We found that given the appropriate conditions (as discussed earlier in this section) the SGLs have expanded by 54% within a short span of time (2014–2017) (Table 4). Further, the results of annual mapping reveal that the nature and occurrence patterns of SGLs are highly dynamic. The maximum proportion of SGL (>~80%) are persistent in nature. Persistent lakes are essentially important as they may grow in size and may release large amount of water if their temporary damming structure fails and hence need special attention. Moreover, Reynolds (2000) suggested that on debris-covered glaciers with slope < 2°, large SGLs may form, while slope between 2° and 6° facilitated development of supraglacial ponds on a sufficiently large area. However, these may be transient in nature. Our slope analysis reveals that, taken together, about 67% of ablation area of SGL-bearing glaciers have a mean slope of < 10°. About 6, 31, and 29% area fall under the slope category of < 2°, 2–6°, and 6–10°, respectively. These slope configurations are possibly responsible for persistent nature of large number of SGLs in the area. Moreover, we found about 7 and 8% recurring type lakes in 2016 and 2017, respectively (Table 4). These results are significant as presence of recurring lakes suggests that the glacier has been practically inactive as it continues to preserve the surface conditions which were conducive for formation of SGLs. The drain-out type lakes though have low hazard potential as they do not attain large size, but their considerable proportion (15–25%) clearly shows that formation of small lakes on glaciers is frequent which in turn is indicative of rapid glacier wastage in the study area. We also found that new SGLs are consistently developing on the glacier tongues, which further confirms the prevailing negative mass balance conditions.
Komori (2008) explained the different stages of proglacial lake formation: initially few suprgalcial ponds appears in the lower ablation zone which coalesce later to form a single lake which grows coherently afterwards. The lake water of PGLC remains in contact with glacier ice. With increasing waterline length (lake-ice contact), it induces the thermal erosion along the waterline (Kirkbride and Warren, 1997; Sakai et al., 2009; Sakai, 2012; Basnett et al., 2013). This process instigates the lacustrine calving which in turns causes a greater disintegration of glacier termini and results in dramatic lake growth. We found similar process in Changsang glacier, where only one small SGL appeared in the lower ablation zone during 1975 with a total area of 0.012 km2 (Figure 7A). During 1991 the lake number increase to 6 with a total area of 0.065 km2 (Figure 7B). In 2000, all the SGL enlarged and few of them merged, therefore, though the number of lakes reduced (5) but the area increased to 0.224 km2 (Figure 7C). During 2017, all the SGLs coalesced to form single PGLC with a considerably large size (0.763 km2) (Figure 7D). This PGLC is in contact with the glacier terminus with a waterline length of > 500 m and hence expected to expand rapidly in coming years. Therefore, the higher expansion of PGLC (90%) (Table 3) indicates the active calving in the study region. Detailed investigations of Imja Glacier in the Mount Everest area also show a significant larger retreat and volume loss, where a lake developed after the 1960s (Gardelle et al., 2011).
We observed only little variation in the lakes that are not in contact with glacier (i.e., PGLA and OL). This may be because of occurrence of permafrost in the high reaches of study region (see section Implications of Lake Characteristics; Figure 8) which has facilitated the sustenance of these lakes by providing meltwater also by maintaining lower temperatures which possibly restricts the intense evaporation. Previously, Debnath et al. (2018) have also reported that apart from proglacial and supraglacial lakes, none of the other types of lake area have changed considerably during 1988–2014. Moreover, we found that the area of Tikuchia Pokhari lake (Figures 7E,F), which is classified as a PGLA, reduced from 0.09 km2 to 0.07 km2 during 1975–1991, showing a significant loss of ~21%. We also noticed the traces of possible lake breach sometime in between 1975 and1991 (see yellow arrow in Figures 7I,J). This indicates that apart from lakes that are in contact with glacier, PGLA may also be hazardous. Interestingly, we found a slight decrease in total number and area of OL (Table 3; Figures 7M–P). For instance, the area of an OL shown in Figures 7M–P has decreased from 0.543 to 0.179 km2 between 1975 and 2017. This may be because of decline of precipitation in the study area which constitutes the important recharge source for most of the OLs (Basnett et al., 2013). Salerno et al. (2016) also observed that the disconnected lake ice ponds decreased significantly over the period (1963–2013) due to a reduction in overall precipitation on the southern slopes of Mt Everest in Sagarmatha National Park (SNP). The similar shrinkage of disconnected lakes has also been reported in western Himalaya (Shukla and Qadir, 2016).
Previous studies have shown that along with rapid lake area expansion in the Himalaya and Tibetan region (Table 5), the lake level has also increased significantly at a rate of 0.21 m a−1 during 2003–2009 (Nie et al., 2013; Song et al., 2014; Zhang et al., 2014, 2015). Change in climatic variables is useful parameter for explaining lake evolution. Previous studies have attributed the expansion of lakes in alpine environment to the climatic variations (Gardelle et al., 2011; Wu et al., 2012; Song et al., 2014; Zhang et al., 2015). As per the data record from 95 China Meteorological Administration (CMA) stations, the mean warming rate of annual air temperatures in the Tibet region was 0.04 °C a−1 from 1960 to 2013. In this study we have utilized the CRU TS 4.01 data from 1901 to 2016 to assess the climate trend in the region (Figure 3). A nonparametric Mann–Kendall test was used to determine statistical significance, and magnitudes of the trend were obtained by linear regression analysis (Racoviteanu et al., 2008). Though the precipitation does not exhibit any notable trend (statistically insignificant at 95% confidence interval; p > 0.05; Figure 3C) but a clear increase of about ~0.01 °C a−1 (significant at 95% confidence interval; p < 0.05) was apparent in the temperature from 1901 to 2016 (Figure 3B). We also correlated the absolute lake area changes with precipitation and temperature data. The lake area changes, however, do not show any correlation with the precipitation possibly because of large variability in precipitation patterns but a good correlation (r = 0.77) with temperature was found. This shows the clear sensitivity of lake changes to the temperature rise. Further, the long-term meteorological records from Gangtok station located at 1,812 m asl in Sikkim, showed an increase of 1.03°C in mean annual air temperature while the increase in winter (November–March) mean and maximum temperature was 2.04°C and 1.13°C, respectively between 1987 and 2011 (Basnett et al., 2013). The summer (April–October) minimum and maximum temperature recorded a rise of 1 and 0.17°C, respectively, during this period. A decrease in the average precipitation was also found in the Sikkim (Basnett et al., 2013). Moreover, the warming in the higher elevations (>5,500 m asl) was reported to be more prominent in the Himalayas (Zhang et al., 2015). These results are consistent with the negative trend in the mean glacier mass budget from the 1960s to 2000s in the Himalayas (Bolch et al., 2012; Zhang et al., 2015). High rates of glacier melt can augment stream flow and expand lakes (Wang et al., 2013). Particularly, the Sikkim Himalayan glaciers are predominantly monsoon-affected and hence are more sensitive to temperature changes than winter-accumulation-type glaciers (Basnett et al., 2013). This is because temperature rise directly reduces solid precipitation (Fujita, 2008). The precipitation in the form of rain on higher elevations reduce the accumulation area by upward shift in the 0°C isotherm line, leading to high rate of retreat at lower elevations (Bolch et al., 2012). Thus, one reason for the loss in glacier area and the development of lakes on the Sikkim Himalaya can be explained by significant climatic perturbations in the region.
This study provides a comprehensive lake inventory and multi-temporal lake changes for the Sikkim Himalaya from 1975 to 2017. The major findings and conclusions drawn from the present study are as follows:
• As per recent estimates (2017) there are 466 glacial and high-altitude lakes (>0.003 km2) in the Sikkim Himalaya covering a total area of 31.24 ±2.36 km2. Classification of lakes reveals existence of 64 SGLs, 35 PGLCs, 108 PGLAs and 259 OLs in the state. The mean size of lakes is 0.06 km2 and about 87% lakes have area < 0.1 km2. The lake distribution in various sub-basin of Sikkim shows maximum concentration of lakes in the Zemu basin (85.78%), followed by Changme Khangpu (34.13%), East Rathong (8.42%) and Talung basin (3.67%).
• The number of lakes increased from 425 in 1975 to 466 in 2017, showing an increase of 9% accompanied with rapid expansion of lake area from 25.17 ± 1.90 km2 to 31.24 km2 during this period, amounting to be 24% (i.e., 0.15 km2 a−1). The maximum increase in lake number occurred in Zemu (15%) while the maximum areal expansion was observed in East Rathong basin (41%).
• The maximum expansion in number and area of ~106 and ~138%, respectively was observed in SGL, followed by PGLC categories which showed a growth of ~34% in number and ~90% in area. Contrarily no significant change was found in other lakes. The PGLAs showed an increase of only ~9% in number and only ~1% in area. A decrease of ~3% and ~4%, respectively, in number and area was apparent in the OL category.
• The decadal analysis reveals that 1975–1991 was the period of highest increase in lake number (~6%) and lake area (~10%). During 1991–2000, the number and area of lakes increased by ~2 and ~5%, respectively. Only ~1% increase in lake number and about ~6% increase in areas was evident between 2000 and 2017.
• The annual mapping of SGLs shows that their number (area) increased from 81 (543,153 m2) to 96 (840,973 m2) between 2014 and 2017. However, the increase in number of SGLs was not steady during this period.
• Analysis of occurrence pattern of SGLs shows that maximum number of lakes (>80%) are persistent in nature while recurring (7–8%) and drain-out type lakes (15–25%) are also found in the region. The new-formed lakes (9–17%) were consistently noticed in all the years.
• Sikkim glaciers are monsoon-fed and are more particularly susceptible to temperature rise. The continuous temperature increase has brought more liquid precipitation in the state causing significant ice loss. Thus, rapid expansion of lakes in the state can be largely attributed to these climatic conditions.
• Our reported uncertainties in lake area estimations are large specifically for smaller lakes mainly arises from the fact that for small lakes all the boundary pixels contribute in the error estimation leading to an increased or rather higher uncertainty. However, this large error is theoretical and may be considered indicative only because we applied manual corrections to make sure that mapped boundaries exactly follow the actual lake boundaries specifically in case of small lakes. Nevertheless, comparison of Landsat-derived lake boundaries with that of high-resolution MSI data revealed a variation of 7.55% only which is comparable with that of previous studies.
The results of this study reiterate the potentially adverse influence of regional warming on the hydrology of Sikkim Himalaya due to accelerated cryosphere thawing. If the current trend climate warming continues, further glacier melting is likely to occur. Therefore, formation of new lakes and expansion of existing ones is expected in the study area leading to increase in potential of glacial lake outburst floods. We thereby recommend regular monitoring of glacial and high altitude lakes in this region for tenable assessment of climatic change impacts.
AS and PG designed the study, collected and processed most data, and wrote the paper. SS conducted data collection and processing. PG analyzed the results and generated the figures. All three authors discussed the results and contributed to the final form of the article.
The authors declare that the research was conducted in the absence of any commercial or financial relationships that could be construed as a potential conflict of interest.
Authors are grateful to Dr. Meera Tiwari, Director, Wadia Institute of Himalayan Geology (WIHG), Dehradun, India, for providing requisite facilities to carry out this work. Thanks is also due to the U.S. Geological survey and NASA Land Processes Distributed Active Archive Centre (LP DAAC) for providing Landsat data. We acknowledge Mr. Aniruddha Mahagaonkar for providing field photographs. We also acknowledge Dr. Stephan Gruber, for making available the global permafrost data.
Aggarwal, S., Rai, S. C., Thakur, P. K., and Emmer, A. (2017). Inventory and recently increasing GLOF susceptibility of glacial lakes in Sikkim, Eastern Himalaya. Geomorphology 295, 39–54. doi: 10.1016/j.geomorph.2017.06.014
Bajracharya, S. R., and Mool, P. (2009). Glaciers, glacial lakes and glacial lake outburst floods in the Mount Everest region, Nepal. Annals Glaciol. 50, 81–86. doi: 10.3189/172756410790595895
Basnett, S., Kulkarni, A. V., and Bolch, T. (2013). The influence of debris cover and glacial lakes on the recession of glaciers in Sikkim Himalaya, India. J. Glaciol. 59, 1035–1046. doi: 10.3189/2013JoG12J184
Benn, D. I., Bolch, T., Hands, K., Gulley, J., Luckman, A., Nicholson, L. I., et al. (2012). Response of debris-covered glaciers in the Mount Everest region to recent warming, and implications for outburst flood hazards. Earth Sci. Rev. 114, 156–174. doi: 10.1016/j.earscirev.2012.03.008
Benn, D. I., Wiseman, S., and Hands, K. A. (2001). Growth and drainage of supraglacial lakes on debris-mantled Ngozumpa Glacier, Khumbu Himal, Nepal. J. Glaciol. 47, 626–638. doi: 10.3189/172756501781831729
Bolch, T., Kulkarni, A., Kääb, A., Huggel, C., Paul, F., Cogley, J. G., et al. (2012). The state and glaciers. fate of Himalayan Science 336, 310–314. doi: 10.1126/science.1215828
Bolch, T., Yao, T., Kang, S., Buchroithner, M. F., Scherer, D., Maussion, F., et al. (2010). A glacier inventory for the western Nyainqentanglha range and the Nam Co Basin, Tibet, and glacier changes 1976 −2009. Cryosphere 4, 419–433. doi: 10.5194/tc-4-419-2010
Bookhagen, B., and Burbank, D. W. (2010). Toward a complete Himalayan hydrological budget: Spatiotemporal distribution of snowmelt and rainfall and their impact on river discharge. J. Geophys. Res. Earth Surf. 115, 1–25. doi: 10.1029/2009JF001426
Brun, F., Berthier, E., Wagnon, P., Kääb, A., and Treichler, D. (2017). A spatially resolved estimate of High Mountain Asia glacier mass balances from 2000 to 2016. Nat. Geosci. 10, 668–673. doi: 10.1038/NGEO2999
Campbell, J. G. (2005). Inventory of Glaciers, Glacial Lakes and the Identification of Potential Glacial lake Outburst Floods (GLOFs) Affected by Global Warming in the Mountains of India, Pakistan and China/Tibet Autonomous Region. International Centre for Integrated Mountain Development.
Carrivick, J. L., and Tweed, F. S. (2016). A global assessment of the societal impacts of glacier outburst floods. Glob. Planet. Change 144, 1–16. doi: 10.1016/j.gloplacha.2016.07.001
Chen, X. Q., Cui, P., Li, Y., Yang, Z., and Qi, Y. Q. (2007). Changes in glacial lakes and glaciers of post-1986 in the Poiqu River basin, Nyalam, Xizang (Tibet). Geomorphology 88, 298–311. doi: 10.1016/j.geomorph.2006.11.012
Clague, J. J., and Evans, S. G. (2000). A review of catastrophic drainage of moraine-dammed lakes in British Columbia. Quat. Sci. Rev. 19, 1763–1783. doi: 10.1016/S0277-3791(00)00090-1
Cook, S. J., Kougkoulos, I., Edwards, L. A., Dortch, J., and Dirk, H. (2016). Glacier change and glacial lake outburst flood risk in the Bolivian Andes. Cryosphere Discuss. 10, 2399–2413. doi: 10.5194/tc-10-2399-2016
DeBeer, C. M., and Sharp, M. J. (2009). Topographic influences on recent changes of very small glaciers in the Monashee Mountains, British Columbia, Canada. J. Glaciol. 55, 691–700. doi: 10.3189/002214309789470851
Debnath, M., Syiemlieh, H. J., Sharma, M. C., Kumar, R., Chowdhury, A., and Lal, U. (2018). Glacial lake dynamics and lake surface temperature assessment along the Kangchengayo-Pauhunri Massif, Sikkim Himalaya, 1988–2014. Remote Sens. Appl. Soc. Environ. 9, 26–41. doi: 10.1016/j.rsase.2017.11.002
Dyurgerov, M. B., and Meier, M. F. (1997). Year-to-year fluctuations of global mass balance of small glaciers and their contribution to sea-level changes. Arctic Alpine Res. 392–402.
Dyurgerov, M. B., and Meier, M. F. (2005). Glaciers and the Changing Earth System: a 2004 Snapshot, Vol. 58. Boulder: Institute of Arctic and Alpine Research, University of Colorado.
Emmer, A., Klimeš, J., Mergili, M., Vilímek, V., and Cochachin, A. (2016). 882 lakes of the Cordillera Blanca: an inventory, classification, evolution and assessment of susceptibility to outburst floods. Catena 147, 269–279. doi: 10.1016/j.catena.2016.07.032
Emmer, A., Loarte, E. C., Klimeš, J., and Vilímek, V. (2015). Recent evolution and degradation of the bent Jatunraju glacier (Cordillera Blanca, Peru). Geomorphology 228, 345–355. doi: 10.1016/j.geomorph.2014.09.018
Emmer, A., and Vilímek, V. (2013). Lake and breach hazard assessment for moraine-dammed lakes: an example from the Cordillera Blanca (Peru). Nat. Hazards Earth Sys. Sci. 13:1551. doi: 10.5194/nhess-13-1551-2013
Fujita, K. (2008). Effect of precipitation seasonality on climatic sensitivity of glacier mass balance. Earth Planetary Sci. Lett. 276, 14–19. doi: 10.1016/j.epsl.2008.08.028
Fujita, K., Kadota, T., Rana, B., Kayastha, R. B., and Ageta, Y. (2001). Shrinkage of Glacier AX010 in Shorong region, NepalHimalayas in the 1990s Bull. Glaciol. Res., 18, 51–54.
Fujita, K., Suzuki, R., Nuimura, T., and Sakai, A. (2008). Performance of ASTER and SRTM DEMs, and their potential for assessing glacial lakes in the Lunana region, Bhutan Himalaya. J. Glaciol. 54, 220–228. doi: 10.3189/002214308784886162
Gardelle, J., Arnaud, Y., and Berthier, E. (2011). Contrasted evolution of glacial lakes along the Hindu Kush Himalaya mountain range between 1990 and 2009. Glob. Planet. Change 75, 47–55. doi: 10.1016/j.gloplacha.2010.10.003
Gardelle, J., Berthier, E., Arnaud, Y., and Kaab, A. (2013). Region-wide glacier mass balances over the Pamir-Karakoram-Himalaya during 1999-2011. Cryosphere 7, 1263–1286. doi: 10.5194/tc-7-1263-2013
Garg, P. K., Shukla, A., and Jasrotia, A. S. (2017). Influence of topography on glacier changes in the central Himalaya, India. Glob. Planet. Change 155, 196–212. doi: 10.1016/j.gloplacha.2017.07.007
Gruber, S. (2012). Derivation and analysis of a high-resolution estimate of global permafrost zonation. Cryosphere 6, 221–233. doi: 10.5194/tc-6-221-2012
Harris, I. P. D. J., Jones, P. D., Osborn, T. J., and Lister, D. H. (2014). Updated high-resolution grids of monthly climatic observations–the CRU TS3. 10 Dataset. Intel. J. Climatol. 34, 623–642. doi: 10.1002/joc.3711
Huggel, C., Kääb, A., Haeberli, W., Teysseire, P., and Paul, F. (2002). Remote sensing based assessment of hazards from glacier lake outbursts: a case study in the Swiss Alps. Can. Geotech. J. 39, 316–330. doi: 10.1139/t01-099
IPCC (2007). “Climate change 2007: the physical science basis,” in Contribution of Working Group I to the Fourth Assessment Report of the Intergovernmental Panel on Climate Change, eds. S., Solomon, D. Qin, M. Manning, Z. Chen, M. Marquis, K. B. Averyt, M. Tignor, and H. L. Miller (Cambridge, UK; New York, NY: Cambridge University Press).
Janský, B., Šobr, M., and Engel, Z. (2010). Outburst flood hazard: case studies from the Tien-Shan Mountains, Kyrgyzstan. Limnologica 40, 358–364. doi: 10.1016/j.limno.2009.11.013
Kääb, A., Berthier, E., Nuth, C., Gardelle, J., and Arnaud, Y. (2012). Contrasting patterns of early twenty-first-century glacier mass change in the Himalayas. Nature 488:495. doi: 10.1038/nature11324
Kargel, J. S., Abrams, M. J., Bishop, M. P., Bush, A., Hamilton, G., Jiskoot, H., et al. (2005). Multispectral imaging contributions to global land ice measurements from space. Remote Sens. Environ. 99, 187–219. doi: 10.1016/j.rse.2005.07.004
Kirkbride, M. P., and Warren, C. R. (1997). Calving processes at a grounded ice cliff. Annals Glaciol. 24, 116–121.
Komori, J. (2008). Recent expansions of glacial lakes in the Bhutan Himalayas. Q. Int. 184, 177–186. doi: 10.1016/j.quaint.2007.09.012
Krishna, A. P. (2005). Snow and glacier cover assessment in the high mountains of Sikkim Himalaya. Hydrol. Processes 19, 2375–2383. doi: 10.1002/hyp.5890
Lliboutry, L. (1977). Glaciological problems set by the control of dangerous lakes in Cordillera Blanca, Peru. II. Movement of a covered glacier embedded within a rock glacier. J. Glaciol. 18, 255–273. doi: 10.3189/S0022143000021341
Luitel, K. K., Shrestha, D. G., Sharma, N. P., and Sharma, R. K. (2012). Impact of Climate Change on East-Rathong Glacier In Rangit Basin, West Sikkim. Climate Change in Sikkim Patterns, Impacts and Initiatives. Information and Public Relations Department, Government of Sikkim, Gangtok.
Mergili, M., Müller, J. P., and Schneider, J. F. (2013). Spatio-temporal development of high-mountain lakes in the headwaters of the Amu Darya River (Central Asia). Glob. Planet. Change 107, 13–24. doi: 10.1016/j.gloplacha.2013.04.001
Miles, E. S., Steiner, J., Willis, I., Buri, P., Immerzeel, W. W., Chesnokova, A., et al. (2017). Pond dynamics and supraglacial-englacial connectivity on debris-covered Lirung Glacier, Nepal. Front. Earth Sci. 5:69. doi: 10.3389/feart.2017.00069
Mool, P. K., Wangda, D., Bajracharya, S. R., Kunzang, K. A. R. M. A., Gurung, D. R., and Joshi, S. P. (2001). Inventory of Glaciers, Glacial Lakes and Glacial Lake Outburst Floods. Monitoring and Early Warning Systems in the Hindu Kush-Himalayan Region. Bhutan: International Centre for Integrated Mountain Development.
Nie, Y., Liu, Q., and Liu, S. (2013). Glacial lake expansion in the Central Himalayas by Landsat images, 1990–2010. PLoS ONE 8:e83973. doi: 10.1371/journal.pone.0083973
Paul, F., and Kääb, A. (2007). Recent glacier changes in the Alps observed by satellite: consequences for future monitoring strategies. Glob. Planet. Change 56, 111–122. doi: 10.1016/j.gloplacha.2006.07.007
Racoviteanu, A. E., Arnaud, Y., Williams, M. W., and Ordonez, J. (2008). Decadal changes in glacier parameters in the Cordillera Blanca, Peru, derived from remote sensing. J. Glaciol. 54, 499–510. doi: 10.3189/002214308785836922
Raina, V. K. (2009). Himalayan Glaciers: A State-of-Art Review of Glacial Studies, Glacial Retreat and Climate Change. Almora: G. B. Pant Institute of Himalayan Environment and Development Kosi-Katarmal.
Raj, G., Babu, K., Kumar, V. K., and SN, R. (2013). Remote sensing-based inventory of glacial lakes in Sikkim Himalaya: semi-automated approach using satellite data. Geomatics Nat. Hazards Risk 4, 241–253. doi: 10.1080/19475705.2012.707153
Reynolds, J. M. (2000). “On the formation of supraglacial lakes on Debris-Covered Glaciers,” in Proceedings of a workshop Debris-Covered Glaciers (Seattle, WA), 153–164.
Sakai, A. (2012). Glacial lakes in the Himalayas: a review on formation and expansion processes. Glob. Environ. Res. 16, 23–30.
Sakai, A., Chikita, K., and Yamada, T. (2000). Expansion of a moraine-dammed glacial lake, Tsho Rolpa, in Rolwaling Himal, Nepal Himalaya. Limnol. Oceanogr. 45, 1401–1408. doi: 10.4319/lo.2000.45.6.1401
Sakai, A., Nishimura, K., Kadota, T., and Takeuchi, N. (2009). Onset of calving at supraglacial lakes on debris-covered glaciers of the Nepal Himalaya. J. Glaciology 55, 909–917. doi: 10.3189/002214309790152555
Salerno, F., Thakuri, S., D'Agata, C., Smiraglia, C., Manfredi, E. C., Viviano, G., et al. (2012). Glacial lake distribution in the Mount Everest region:uncertainty of measurement and conditions of formation. Glob. Planet.Change 92–93, 30–39. doi: 10.1016/j.gloplacha.2012.04.001
Salerno, F., Thakuri, S., Guyennon, N., Viviano, G., and Tartari, G. (2016). Glacier melting and precipitation trends detected by surface area changes in Himalayan ponds. Cryosphere 10, 1433–1448. doi: 10.5194/tc-10-1433-2016
Scherler, D., Bookhagen, B., and Strecker, M. R. (2011). Spatially variable response of Himalayan glaciers to climate change affected by debris cover. Nat. Geosci. 4:156. doi: 10.1038/ngeo1068
Shukla, A., and Qadir, J. (2016). Differential response of glaciers with varying debris cover extent: evidence from changing glacier parameters. Int. J. Remote Sens. 37, 2453–2479. doi: 10.1080/01431161.2016.1176272
Shukla, P. N., Bhandari, N., Nijampurkar, V. N., Rao, D. K., Puri, V. M. K., and Sharma, S. (1983). “Ice accumulation rate in Changme-Khangpu glacier, Sikkim,” in Proceedings of the Indian Academy of Sciences-Earth and Planetary Sciences, 255–260.
Song, C., Huang, B., Ke, L., and Richards, K. S. (2014). Remote sensing of alpine lake water environment changes on the Tibetan Plateau and surroundings: a review. ISPRS J. Photogram. Remote Sens. 92, 26–37. doi: 10.1016/j.isprsjprs.2014.03.001
Thompson, S., Benn, D. I., Mertes, J., and Luckman, A. (2016). Stagnation and mass loss on a Himalayan debris-covered glacier: processes, patterns and rates. J. Glaciol. 62, 467–485. doi: 10.1017/jog.2016.37
Wang, W., Xiang, Y., Gao, Y., Lu, A., and Yao, T. (2015). Rapid expansion of glacial lakes caused by climate and glacier retreat in the Central Himalayas. Hydrol. Process. 29, 859–874. doi: 10.1002/hyp.10199
Wang, W., Yao, T., and Yang, X. (2011). Variations of glacial lakes and glaciers in the Boshula mountain range, southeast Tibet, from the 1970s to 2009. Annals Glaciol. 52, 9–17. doi: 10.3189/172756411797252347
Wang, X., Ding, Y., Liu, S., Jiang, L., Wu, K., Jiang, Z., et al. (2013). Changes of glacial lakes and implications in Tian Shan, central Asia, based on remote sensing data from 1990 to 2010. Environ. Res. Lett 8:044052. doi: 10.1088/1748-9326/8/4/044052
Warren, C. R., and Kirkbride, M. P. (1998). Temperature and bathymetry of ice-contact lakes in Mount Cook National Park, New Zealand. N. Z. J. Geol. Geophys. 41, 133–143. doi: 10.1080/00288306.1998.9514797
Watson, C. S., Quincey, D. J., Carrivick, J. L., and Smith, M. W. (2016). The dynamics of supraglacial ponds in the Everest region, central Himalaya. Glob. Planet. Change 142, 14–27. doi: 10.1016/j.gloplacha.2016.04.008
Wessels, R. L., Kargel, J. S., and Kieffer, H. H. (2002). ASTER measurement of supraglacial lakes in the Mount Everest region of the Himalaya. Ann. Glaciol. 34, 399–408. doi: 10.3189/172756402781817545
Westoby, M. J., Glasser, N. F., Brasington, J., Hambrey, M. J., Quincey, D. J., and Reynolds, J. M. (2014). Modelling outburst floods from moraine-dammed glacial lakes. Earth Sci. Rev. 134, 137–159. doi: 10.1016/j.earscirev.2014.03.009
Wu, S. S., Yao, Z. J., Huang, H. Q., Liu, Z. F., and Liu, G. H. (2012). Responses of glaciers and glacial lakes to climate variation between 1975 and 2005 in the Rongxer basin of Tibet, China and Nepal. Reg. Environ. Change 12, 887–898. doi: 10.1007/s10113-012-0302-9
Yamada, T., and Sharma, C. K. (1993). “Glacier lakes and outburst floods in the Nepal Himalaya,” in Proceedings of the Kathmandu Symposium (Kathmandu), 319–330.
Zhang, G., Yao, T., Xie, H., Qin, J., Ye, Q., Dai, Y., et al. (2014). Estimating surface temperature changes of lakes in the Tibetan Plateau using MODIS LST data. J. Geophys. Res. Atmos. 119, 8552–8567. doi: 10.1002/2014JD021615
Keywords: high mountain lakes, lake inventory, remote sensing, climate change, Eastern Himalaya
Citation: Shukla A, Garg PK and Srivastava S (2018) Evolution of Glacial and High-Altitude Lakes in the Sikkim, Eastern Himalaya Over the Past Four Decades (1975�2017). Front. Environ. Sci. 6:81. doi: 10.3389/fenvs.2018.00081
Received: 28 February 2018; Accepted: 29 June 2018;
Published: 19 July 2018.
Edited by:
A. P. Dimri, Jawaharlal Nehru University, IndiaReviewed by:
Nathaniel K. Newlands, Agriculture and Agri-Food Canada (AAFC), CanadaCopyright © 2018 Shukla, Garg and Srivastava. This is an open-access article distributed under the terms of the Creative Commons Attribution License (CC BY). The use, distribution or reproduction in other forums is permitted, provided the original author(s) and the copyright owner(s) are credited and that the original publication in this journal is cited, in accordance with accepted academic practice. No use, distribution or reproduction is permitted which does not comply with these terms.
*Correspondence: Aparna Shukla, YXBhcm5hLnNodWtsYTIyQGdtYWlsLmNvbQ==
Purushottam K. Garg, Z2FyZy5nbGFjaW9AZ21haWwuY29t
Disclaimer: All claims expressed in this article are solely those of the authors and do not necessarily represent those of their affiliated organizations, or those of the publisher, the editors and the reviewers. Any product that may be evaluated in this article or claim that may be made by its manufacturer is not guaranteed or endorsed by the publisher.
Research integrity at Frontiers
Learn more about the work of our research integrity team to safeguard the quality of each article we publish.