- 1Water Resource Science Program, University of Minnesota, St. Paul, MN, United States
- 2Department of Ecology, Evolution and Behavior, University of Minnesota, St. Paul, MN, United States
Freshwater aquatic systems are biogeochemical hotspots, with heterotrophic bacteria rapidly cycling the compounds that pass through them. P is a key nutrient that controls primary production in many freshwater ecosystems and is important for understanding eutrophication in lakes. Previous work has often focused on the dynamics of inorganic phosphorus and its impact on primary production, however, the role of nutrients bound in more complex organic forms (such as dissolved organic phosphorus, DOP) in supporting primary production and harmful algal blooms has been neglected. Here, we quantify the bioavailability of dissolved organic carbon (DOC) and DOP in 27 aquatic systems across the Upper Midwest United States. Using exponential decay models, long-term nutrient degradation assays revealed that decay constants for DOP ranged from −0.001 per day to −0.12 per day with a median value of −0.01 per day. These rates were geographically variable and were as high or higher than DOC decay constants, which ranged from −0.003 per day to −0.024 per day with a median value of −0.01 per day. Additionally, total bioavailability of DOP ranged from 0 to 100% with a median value of 78% of the DOP pool, demonstrating that DOP bioavailability was highly variable across systems. In contrast, bioavailable DOC was more tightly constrained with values ranging from 4.37 to 53.81% of the total DOC pool with a median value of 24.95%. DOP bioavailability was negatively correlated with the DOC:DOP of the organic matter pool, suggesting that bioavailable DOP is drawn down in systems that are more likely to be P limited. Finally, we show that including estimates of DOC and DOP bioavailability reduces estimates of elemental imbalance experienced by aquatic bacteria.
Introduction
Freshwater systems are incredibly active biogeochemical hot spots, particularly with regards to the processing of organic matter (Cole et al., 2007; Tranvik et al., 2009). Heterotrophic bacteria are major biogeochemical players in aquatic systems (Cotner and Biddanda, 2002) and understanding how these microbes interact with organic matter is fundamental to predicting the flow of energy and nutrients through freshwaters. Dissolved organic matter (DOM) is a major resource pool for aquatic bacteria and has been the focus of numerous studies over the last 20 years. The vast majority of this work has focused on understanding how microbial modifications of DOM influence global carbon cycle processes, but it is important to remember that DOM is not solely composed of carbon. Microbial interactions with DOM are also likely important for understanding other biogeochemical cycles in freshwater such as the phosphorus (P) cycle, but our understanding of the role DOM plays in these other nutrient cycles remains limited (Maranger et al., 2018).
Humans have had profound impacts on the global P cycle by increasing the annual flux of P through ecosystems by a factor of 4–8 (Falkowski, 2000; Schlesinger and Bernhardt, 2013). This has important biogeochemical implications and has resulted in the eutrophication of freshwater systems worldwide leading to degraded water quality on a global scale. Fundamentally, eutrophication is a biogeochemical imbalance, where excess nutrients, often P in freshwater (Schindler et al., 2008), result in excessive accumulation of carbon (C) in the form of increased algal biomass. This continued anthropogenic modification of freshwater nutrient and organic matter pools, together with observations of shifts in planktonic community composition and organic nutrient pools (Teubner et al., 2003) suggest that the bioavailability of organic nutrient pools could an important factor affecting auto-heterotrophic coupling as well as harmful algal blooms.
Previous work has often explored the role of a single inorganic nutrient controlling primary production, but our rapidly evolving understanding suggests more complex scenarios are likely involved. Specifically, there is a growing appreciation for the role of nutrients bound in complex organic forms (such as dissolved organic phosphorus, DOP) in acting as important resources for aquatic organisms (Jackson and Williams, 1985; Cotner and Wetzel, 1992; Björkman and Karl, 2003; Nausch and Nausch, 2007; Soares et al., 2017). Therefore, it is imperative to understand the bioavailability of DOP in natural systems in order to better predict its capacity to serve as a resource in the absence of (or supplementary to) inorganic phosphorus. Furthermore, understanding the composition and bioavailability of nutrients and organic matter, not just the total quantities in a system have been shown to have important impacts on the formation and toxicity of harmful algal blooms (Anderson et al., 2002; Donald et al., 2011) providing another compelling reason to further study DOP bioavailability in freshwater systems.
Organic P is the dominant form of P in most freshwater systems with DOP typically comprising 25–50% of the total P pool (Wetzel, 2001). Many studies have clearly demonstrated that at least some forms of DOP can serve as a P source for primary and secondary producers (Cotner and Wetzel, 1992; Björkman and Karl, 2003; Nausch and Nausch, 2007; Li and Brett, 2013) and DOP is therefore likely an important source of P when inorganic P is limited. While there have been some studies on DOP bioavailability specific to freshwater systems (Sonzogni et al., 1982; Boström et al., 1988; Cotner and Wetzel, 1992; Li and Brett, 2013), more studies have examined this topic in marine systems (Björkman and Karl, 1994; Ruttenberg and Sonya, 2005; Dyhrman and Ruttenberg, 2006; Nausch and Nausch, 2006, 2007). Nonetheless, in both marine and freshwaters, a portion of the DOP pool is readily available for assimilation into planktonic organisms. The relative bioavailability of specific DOP compounds can range from almost 0% to over 90% (Li and Brett, 2013). While these studies have clearly suggested that DOP may be an important source of P for aquatic microorganisms, few studies have quantified bioavailable DOP in freshwater systems or examined how organic matter stoichiometry may affect the bioavailability of DOP compounds. In this paper, we present results from DOM bioavailability assays from 27 aquatic systems in the Upper Midwest of the USA. Our goal was to quantify the bioavailability of DOC and DOP from a diverse set of aquatic ecosystems and explore the potential environmental drivers of DOM bioavailability.
Materials and Methods
Study Sites and Sample Collection
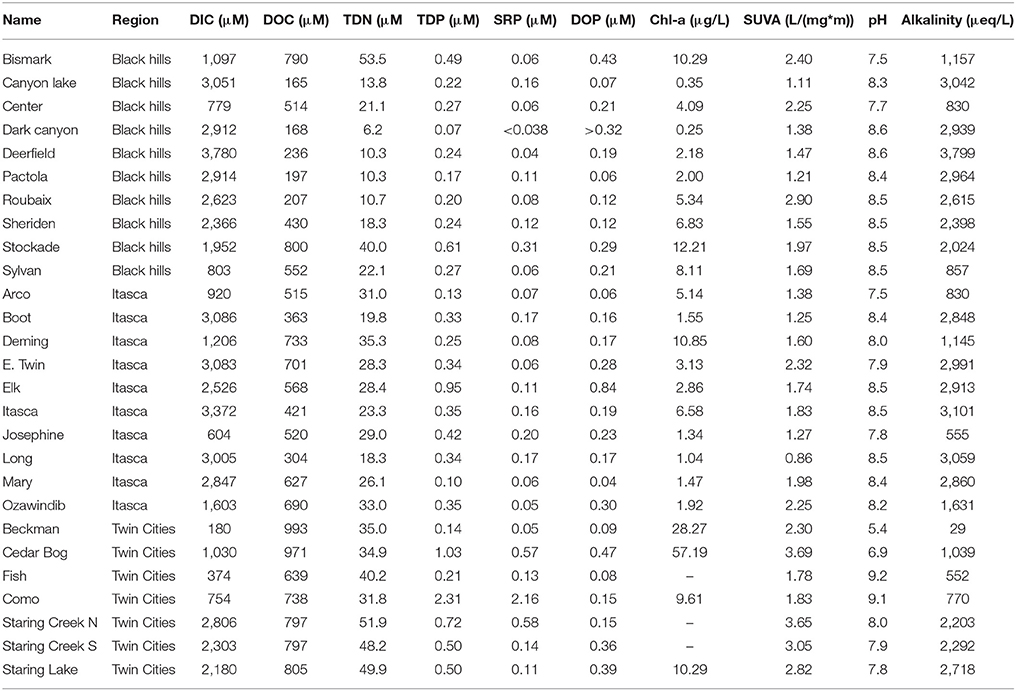
During the summer season (June–September) water was collected from 27 freshwater systems (24 lakes and 3 streams) in Minnesota and South Dakota (Supplementary Figure 1) from the upper mixed layer (0–2 m of depth) using a Van Dorn water sampler. The 27 systems covered three different Level III ecoregions as defined by the United States Environmental Protection Agency: The Black Hills in Western South Dakota (Middle Rockies), Itasca State Park in North Minnesota (Northern Lakes and Forests), and the Twin Cities greater metropolitan area (North Central Hardwood Forests). The Black Hills and Itasca State Park systems are relatively pristine systems with watersheds primarily dominated by coniferous forest whereas the Twin Cities greater metropolitan area is highly human impacted with watersheds dominated by hardwoods with urban land use or small-scale agriculture. General characteristics of each lake system can be found in Table 1.
Samples were collected in acid-washed HDPE amber bottles after pre-rinsing them with ~100 ml of sample water. Samples were stored on ice until they could be returned to the lab (always less than 4 h), where they were stored at 4°C until processed (< 72 h). For processing, ~100 ml of water was filtered through pre-combusted 0.7 μm nominal pore-size glass-fiber filters (Whatman, GF/F) and collected in pre-combusted borosilicate vials. Twenty milliliters of this sample was acidified with 10% HCL and used to measure total dissolved organic carbon (DOC) and total dissolved nitrogen (TDN) on a Shimadzu TOC-L auto-analyzer with a TNM-L module (CSH/CSN model, Shimadzu Corp). Another 20 ml of filtrate was reserved for absorbance scans (wavelengths from 200 to 800 nm) using a Cary 50 spectrophotometer, which was used to calculate the specific UV absorbance at a wavelength of 254 nm (SUVA). The remaining 60 ml of sample was used to measure total dissolved phosphorus (TDP), and soluble reactive phosphorus (SRP) using a molybdenum blue reaction with and without acid-persulfate digestion (Murphy and Riley, 1962). DOP was calculated as the difference between TDP and SRP. Additionally, the GF/F filters were collected for fluorometric quantification of chlorophyll-a after being extracted in 90% acetone (Standard Methods, 2005).
DOM Degradation Assays
DOM degradation assays were performed as long-term dark bottle incubations. Within 72 h of collecting each sample, 900 ml of lake water was filter-sterilized using a 0.22 μm pore-size filter (EMD Millipore Steritop Filters) and collected in a pre-combusted 1 L amber glass bottle. Each bottle was inoculated with 100 ml of water from the same lake that had been filtered through a 1.6 μm pore-size glass fiber filter (Whatman, GF/A). While this approach did not standardize for the absolute inoculum size (i.e., number of bacterial cells), it did provided a consistent relative inoculum source for each assay of 10% by volume, similar to previous work (Wiegner et al., 2006; Lønborg et al., 2009; Vonk et al., 2015). Furthermore, the relative size of the inoculum has been shown to have little to no effect on the overall degradation of DOC (Vonk et al., 2015). These bottles were incubated in the dark at 20°C for a minimum of 230 days. Periodically throughout the incubation period (approximately monthly for the first 6 months and less often subsequently), 100 ml samples were removed from the incubations. These samples were filtered using pre-combusted GF/F filters and DOC, TDN, DOP, SRP, and absorbance scans were measured as described above.
Data Analysis
To calculate DOM degradation rates, data were fitted to 3 unique models (linear, 2 component exponential, and 3 component exponential) and the model fit was compared using Akaike information criterion (AIC) scores. Because model fits were variable for different portions of the DOM pool, relative bioavailability of DOC and DOP was calculated by dividing the maximum nutrient loss (initial concentration minus the minimum measured concentration during the incubation period) by the starting concentration to obtain the percentage of the total pool that was degraded. This approach allowed for the direct comparison of relative lability between the DOP and DOC pools. The relationships between bioavailability and environmental parameters (such as SUVA, nutrients, etc.) were examined using simple linear regression. All analysis was performed using JMP® version 13 (SAS Institute Inc., Cary, NC, 1989–2007).
Results
Bulk Nutrient Analysis
The 27 systems studied covered a trophic gradient with chlorophyll-a values ranging from 0.25 μg/L to 57.19 μg/L and total dissolved phosphorus concentrations ranging from 0.07 μM to 2.31 μM (Table 1). Mean chlorophyll levels were much higher the Twin Cities region compared to the two less human-impacted regions and chlorophyll values were also more variable in the Twin Cities compared to the other two regions. SUVA values were calculated for each system by dividing the specific UV absorbance at 254 nm by the DOC concentration of the system. SUVA can be used as an index of the terrestrial contribution to the DOM pool, with higher SUVA values indicating more terrestrial influence. We sampled systems that exhibited a range of SUVA values (from 0.86 to 3.69) to cover a gradient of terrestrial influence on the DOM pool. Across the three regions sampled, chlorophyll and the relative contribution of DOC to the total dissolved carbon pool (DOC:TDC) showed strong differences, but DOP concentration and the relative contribution of DOP to TDP did not (Figure 1). Also, our study sites showed no regional differences in TDP or SRP concentrations, despite the fact that others have shown strong differences in P concentrations across these ecoregions (Heiskary et al., 1987). Furthermore, DOP concentration was not significantly correlated with any of the measured lake characteristics (pH, alkalinity, chlorophyll, or SUVA), but was weakly positively correlated with DOC concentration and TDN concentration (Figure 2). Additionally, the Twin Cities dissolved carbon pool had a much higher fractional total organic carbon signature (with a median value of approximately 40% DOC) compared to the Black Hills and Itasca where DOC contributed less (11 and 18.5% respectively) to the dissolved carbon pool (Figure 1).
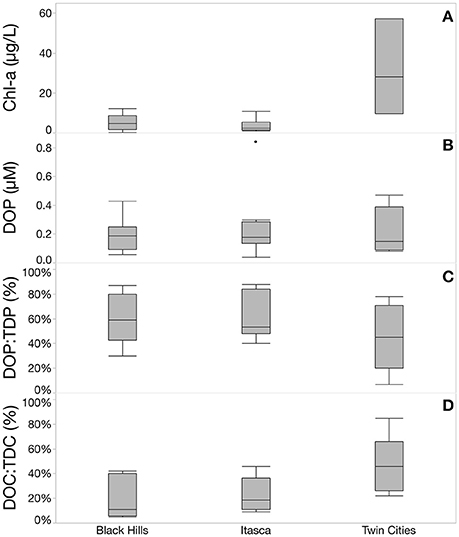
Figure 1. Regional variability in measured lake characteristics. (A) Shows that chlorophyll concentrations were highest and most variable in the Twin Cities (urban) region. (B) Shows no significant differences in total DOP concentration across the three study regions and (C) shows no significant differences in the relative contribution of DOP to the total dissolved P pool, however the Twin Cities does show the largest range of relative DOP contribution. (D) Shows the contribution of DOC to the total dissolved carbon pool with the Twin Cities showing a much higher contribution of DOC compared to the other two regions, in other words, inorganic carbon dominates the dissolved carbon pool in the Black Hills and Itasca regions.
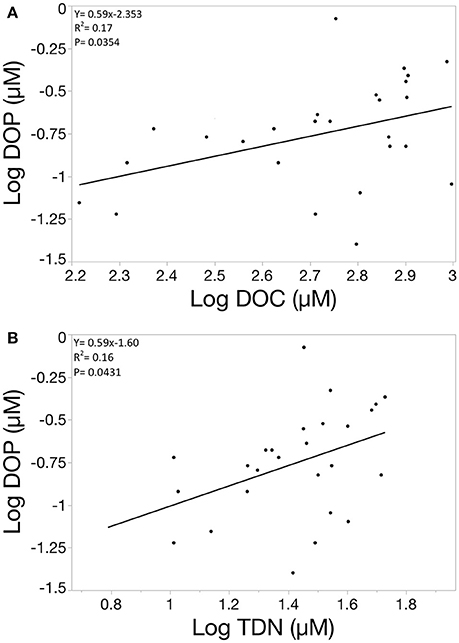
Figure 2. Scatterplots showing the relationship between DOP and DOC (A) and between DOP and TDN (B). All values are log transformed. DOP shows a significant positive correlation to both DOC and TDN, but the relationship is weak in both cases with R2 values below 0.2 for both regressions.
Degradation Rates of DOC and DOP
DOC degradation was best fit by an exponential decay model with a non-zero asymptote (Equation 1, model resulted in an R2 value of 0.998 across all lakes; Supplementary Figure 2). Two lakes, Canyon Lake and Roubaix (both from the Black Hills region), resulted in model fits that had positive k values, despite both having lost DOC over the course of the incubation so they were excluded from analysis of DOC decay rates. In the remaining 25 lakes, k values ranged from −0.003 to −0.024 per day with a median value of −0.009 and quartiles of −0.006 and −0.013 or median turnover time of 111 days (Figure 3). DOC degradation rates were not significantly correlated to measured elemental pools (DOC, TDN, TDP, SRP) or lake characteristics (pH, chlorophyll, SUVA) and there were no significant differences in DOC decay rates across region.
Three parameter exponential decay model that was the best fit for long term DOC incubations where DOCt is the concentration of DOC at time t, BDOC is the total pool of bioavailable DOC, k is the degradation rate, t is the time of incubation in days, and DOCR is the size of the recalcitrant DOC pool.
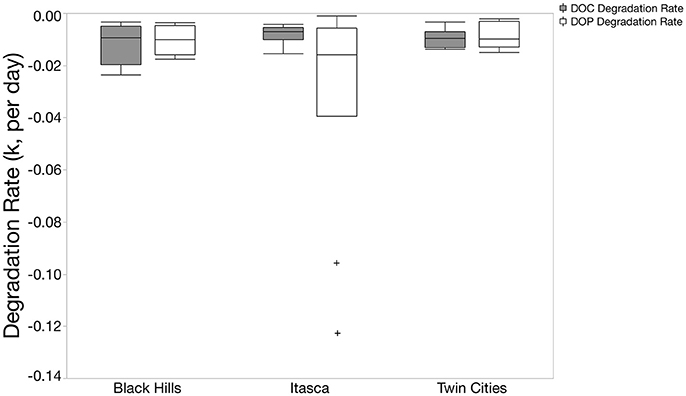
Figure 3. Box and whisker plots of DOC and DOP degradation constants (k) from exponential decay models. Only lakes that had negative k values are included in this figure. In the Black Hills and Twin Cities regions, k values are very similar for DOC and DOP. However, DOP k values are more negative (meaning faster degradation) than DOC k values in the Itasca region. For figure including positive k values, see Supplementary Figure 1.
TDP, SRP, and DOP incubations revealed turnover times of approximately 150 days. After this period, DOP concentrations tended to increase in the incubations suggesting internal cycling of DOP (see Supplementary Figure 3). Given that there were no external sources of P to these incubations, this increasing concentration of dissolved P likely resulted from the degradation of particulate P that had accumulated over the early portion of the incubation. To examine the degradation of DOP over the course of the incubation, we excluded all data points after 150 days of incubation and excluded points when the calculated DOP concentration was below zero (this only occurred in 6 of the 230 total measurements). A 2-parameter exponential fit model best described the DOP data [the same model as Equation (1), omitting the recalcitrant pool] resulting in a model with an overall r2 value of 0.77.
DOP degradation rates (k) across the 27 lakes largely fell between 0 and −0.025 per day (22 of the 27 lakes). Three lakes had positive modeled k values with two of these systems in the Twin Cities metro area (Fish and Staring North) and one was in the Black Hills (Pactola, see supplementary data file). Because the model estimated k values were positive despite the fact that concentrations of DOP decreased in the incubations, these lakes were excluded from other analysis of DOP degradation rates. Additionally, two lakes form the Itasca region (Boot and Elk) had extreme negative k values of −0.096 and −0.123 respectively (Figure 3). The median value for all 27 systems was −0.010 corresponding to a median turnover time of 100 days. DOP degradation rates were not significantly correlated to measured elemental pools (DOC, TDN, TDP, SRP) or lake characteristics (pH, chlorophyll, SUVA).
To compare the relative rate of DOP turnover to DOC turnover, we calculated a kDOC:kDOP value for the 22 systems that had negative k values for both DOC and DOP. Overall, turnover rates of the two nutrients were remarkably similar with a median kDOC:kDOP of 0.98, upper quartile of 1.83, and lower quartile of 0.50. However, there were several lakes with more extreme values with the most extreme system having a DOP turnover rate nearly 20 times faster than DOC (Elk Lake in Itasca State Park). The Itasca region did have significantly lower kDOC:kDOP values than the other two regions (Figure 4, Chi Square Median test, p = 0.0297). The Itasca region also had a typical kDOC:kDOP value less than 1 (Wilcoxon signed-rank, p = 0.014), indicating that for this region DOP degradation constants were significantly higher than DOC degradation constants.
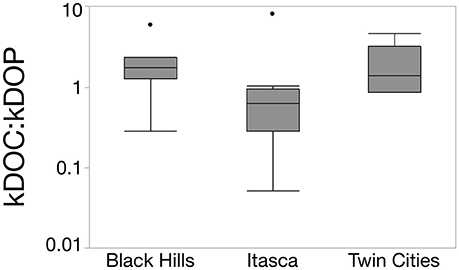
Figure 4. Box and whisker plot showing the variability in kDOC:kDOP values across the three study regions. The Itasca region had a significantly lower value than the other two regions (Chi Square Median test, p = 0.0297) meaning DOP turnover was faster relative to DOC turnover in the Itasca region compared to the Black Hills and Twin Cities. The majority of samples form the Itasca region also had values less than 1, indicating that DOP was typically turning over faster than DOC in this region.
Estimates of DOC and DOP Bioavailability
It took approximately 9 months for degradation models to give reasonable predictions for the total size of the recalcitrant DOC pool (i.e., the 3 parameter fit models outperformed the 2 parameter fit models). Prior to 9 months, 2 parameter fit models outperformed the 3 parameter models so a clear asymptote was not indefinable. In contrast, for DOP, the 2-parameter fit model was always a better fit than 3 parameter fit model, so a modeled estimate of the recalcitrant DOP concentration was not possible. Therefore, in order to estimate and compare the relative sizes of the bioavailable pools of DOC and DOP, we calculated these values using the lowest measured value of DOC and DOP over the course of the incubation. By subtracting this lowest value from the starting concentration, we estimated the amount of DOC or DOP that had been degraded during the incubation period and used this as an estimator of the size of the BDOC and BDOP pools. BDOC values in these lakes ranged from ~19 μM to ~397 μM with a median value of 118 μM, and relative BDOC values ranged from 4.4 to 53.8% of the total DOC pool with a median value of 25.0% with no regional differences in BDOC. In contrast, a much larger portion of the DOP pool tended to be bioavailable. Eight systems had BDOP values over 95% of the total DOP pool and the median value for all the lakes was 78%. Relative BDOP was also more variable than BDOC and had an interquartile range of 40.8 to 97.5% compared to 21.0 to 30.6% for BDOC (Figure 5). Absolute values for BDOP concentrations ranged from 0.01 μM to 0.82 μM and three-quarters of the samples had BDOP concentrations below 0.26 μM. As with BDOC, there were no significant regional difference in BDOP.
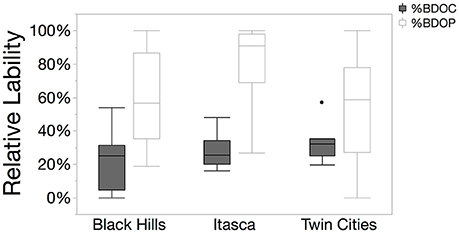
Figure 5. Box and whisker plots showing the relative lability of DOC and DOP in the three regions studied. Relative %BDOP was higher than relative %BDOC in all three regions (pairwise t-tests, p < 0.01). Relative % BDOP also showed a much larger range of values compared to relative %BDOC.
In these systems, relative %BDOP was positively correlated to the initial concentration of DOP in the system, suggesting that systems with a larger DOP pools not only had more BDOP, but also had a larger fraction of the DOP pool that was bioavailable (Figure 6, p = 0.0043). Additionally, relative BDOP was negatively correlated to the initial DOC: DOP ratio, indicating that DOP was relatively less bioavailable when it was scarce relative to DOC (Figure 7, p = 0.0002). However, relative BDOP was not significantly correlated to other individual element pools (DOC, TDN, DIC) nor was it significantly correlated to any of the lake characteristics measured (pH, alkalinity, chlorophyll or SUVA). Temperature data were only available for the 10 lakes in the Itasca region, but within this subset of the data temperature was not a significant predictor of BDOP concentration or relative BDOP percentage. Absolute concentrations of BDOP also showed a strong negative correlation with the DOC:DOP ratio, suggesting that BDOP was being drawn down at high DOC:DOP ratios (Figure 8), but absolute BDOP was not significantly correlated to other elemental or lake characteristic measurements.
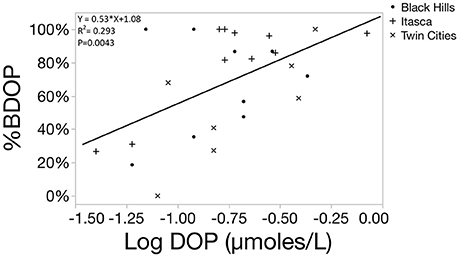
Figure 6. Scatterplot showing the linear regression between the %BDOP and the original concentration of DOP in the sample (log transformed) for 26 lakes. One lake had to be excluded because the initial SRP concentration was below the method detection limit, so a DOP concentration could not be calculated. A positive relationship shows that as DOP concentration increased among systems, the relative lability of DOP increased.
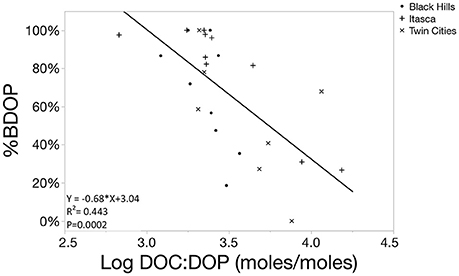
Figure 7. Scatterplot showing the linear regression function comparing the percentage of BDOP to the DOC:DOP ratio of the initial sample (log transformed). The significant negative relationship demonstrates that the relative bioavailability of the DOP pool decreases as DOP becomes scarce relative to DOC.
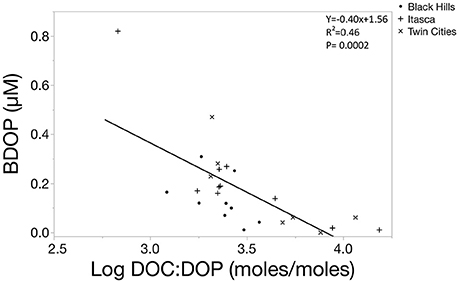
Figure 8. Scatterplot showing the linear regression function comparing the concentration of BDOP to the DOC:DOP ratio of the initial sample (log transformed). The significant negative relationship demonstrates BDOP is drawn down as DOP becomes scarce relative to DOC.
Relative %BDOC was not significantly correlated with any of the measured elemental parameters (initial DOC, TDN, TDP, SRP, DOP or DOC:TDN, DOC:TDP, DOC:SRP, or DOC:DOP). Interestingly, relative %BDOC was also not significantly correlated to SUVA but the absolute size of the BDOC pool did show a significant positive correlation with SUVA (Figure 9; p = 0.0217). This positive trend with SUVA is likely partially explained by the fact that high SUVA systems tend to be high in DOC (and the absolute amount of BDOC was strongly positively correlated to DOC concentration), but in combination with the fact that relative BDOC did not change with SUVA, this suggests that even systems dominated by more terrestrial-like organic matter contain large amounts of bioavailable DOC. Furthermore, absolute BDOC concentration was strongly positively correlated to TDN, TDP, and chlorophyll (Figure 10, p < 0.0001), consistent with the accumulation of labile DOC under high nutrient conditions and high productivity.
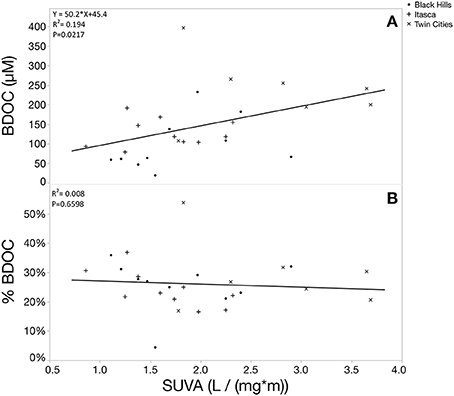
Figure 9. Scatterplots showing the relationship between BDOC and SUVA. Panel (A) shows the absolute size of the BDOC pool and (B) shows the relative size of the BDOC pool. The absolute amount of BDOC showed a significant positive association with SUVA whereas the relative BDOC percentage was not significantly related to SUVA. This could be at least partially driven by the fact that high SUVA systems tend to have larger total DOC pools, but it also suggests that systems dominated by more aromatic carbon compounds (high SUVA) still have large pools of BDOC.
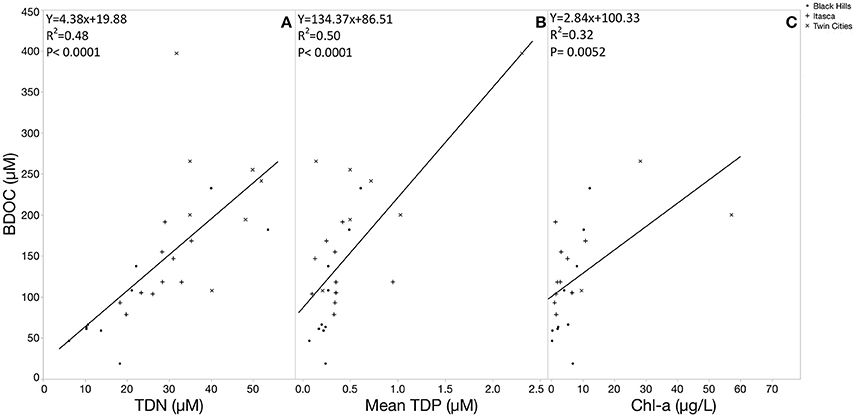
Figure 10. Linear regression functions showing the relationship between BDOC concentration and trophic status indicators. Strong positive relationships between BDOC and TDN (A) and TDP (B) suggest BDOC accumulation in high nutrient conditions. BDOC is also positively correlated with productivity, measured as chlorophyll-a concentration (C).
Stoichiometry of Bioavailable Nutrients
Overall, ratios of bioavailable C and P were much lower than the bulk chemistry pools. DOC:TDP ratios ranged from 319 to 7122:1 with a median of 1595:1 while DOC:DOP ratios ranged from 679 to 15360:1 with a median of 2449:1 in the systems we examined. In comparison, BDOC:BTDP ranged from 133 to 8848:1 (this high point was an outlier with the next highest value being 2943) and median value of 746:1. BDOC:BDOP ranged from 144 to 9719:1 with a median value of 843:1. Previous work showed that assemblages of aquatic heterotrophic bacteria in lakes have mean biomass C:P ratios around 102:1 (Cotner et al., 2010), while individual strains can have highly variable biomass composition with values well over 1000:1 (Godwin and James, 2015). Therefore, the stoichiometry of the bioavailable nutrients measured in this study more closely match typical bacterial biomass stoichiometry than measures of bulk nutrient chemistry. Bioavailable nutrient stoichiometry was also positively correlated with bulk nutrient stoichiometry (Figure 11, p < 0.0001).
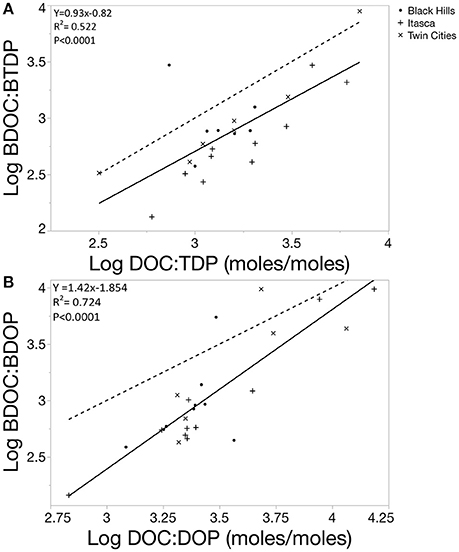
Figure 11. (A) Linear regression fit (solid line) comparing the log transformed values for BDOC:BTDP ratio to the bulk DOC:TDP ratio for 24 lakes, 3 samples had to be removed from the data set because estimated BTDP was 0. Dotted line represents a 1:1 for comparison. The regression line falls below the 1:1 reference indicating that the C:P ratio of the bioavailable pool is lower than the measured C:P of the system. In other words, bulk resource ratios measured using whole water DOC:TDP would overestimate the experienced resource ratio of the microbial community (BDOC:BTDP). (B) Linear regression fit (solid line) comparing the log transformed values for BDOC:BDOP ratio to the bulk DOC:DOP ratio for 24 lakes, 3 samples had to be removed from the data set because estimated BTDP was 0. Dotted line represents a 1:1 for comparison. The regression line falls below the 1:1 reference indicating that the C:P ratio of the bioavailable pool is lower than the measured C:P of the system. Additionally, the slope of the regression fit is greater than 1 meaning that BDOC:BDOP ratios more closely match bulk DOC:DOP ratios when they are higher (in systems that are DOP poor relative to DOC).
Discussion
The data on degradation and bioavailability of DOC and DOP provide insights into three important areas. First, across all lakes, median BDOC and BDOP turnover times were similar equal for BDOC and BDOP (~100 days), but in Itasca State Park lakes, BDOP turnover was significantly faster than BDOC (in some cases by as much as 20 times). This spatial variability highlights the need for more empirical measurements of DOP degradation rates from a variety of systems to better understand potential spatial patterns. In our study, degradation rates of DOC and DOP could not be explained by the other elemental pool sizes or environmental characteristics, further emphasizing the need for more work in this area. Second, we show that the portion of the DOP pool that is bioavailable was extremely variable across systems, but often exceeded 50% and was strongly related to the DOC:DOP ratio of the system. BDOP was drawn down in systems with high DOC:DOP ratios (where P was more likely limiting) and therefore it is likely that in many systems, DOP represents a high-quality P resource to supplement inorganic P availability. Thirdly, the bioavailability of the DOM pool suggests that the nutrient stoichiometry of available resources in aquatic systems may be more similar to the biomass demands of aquatic microbes than previously thought. This has important implications for understanding the experienced nutrient imbalance by heterotrophic bacteria and in turn, understanding how bacteria couple multiple elemental cycles in aquatic systems.
Degradation Rates of DOC and DOP
Degradation rates of DOC in freshwater systems have been the topic a numerous papers and a recently published meta-analysis showed that DOC decay rates can vary by several orders of magnitude across different systems (Catalán et al., 2016). Their dataset included 33 bioassay measurements from lakes in a similar climatic region to our study and these 33 lakes had a median kDOC value of 0.0021, the same order of magnitude as our median value of 0.0077. Estimates of DOP degradation rates are scarcer in the literature and are dominated by estimates from marine systems. One study in the Baltic Sea estimated DOP turnover times to be between 3 to 4 days, about twice as fast as the shortest turnover time in our data set (Nausch and Nausch, 2006). In contrast, DOP turnover times from the North and South Atlantic Ocean subtropical gyres were 5.5 months and 10.5 years respectively (Mather et al., 2008). Another study from Station ALOHA, in the North Pacific Subtropical Gyre found that DOP turnover time increased with depth and ranged from 12 to 268 days at a single sampling site (Björkman and Karl, 2003). One major difference between these systems that could explain the differences in turnover times is productivity, with the Baltic being highly productive compared to Station ALOHA. However, DOP degradation rates were not significantly correlated to chlorophyll levels in our study, so within our systems, productivity was not a good predictor of DOP turnover. The variability of literature measurements, along with the variability in DOP turnover times in this study, highlight the need for more direct measurements of DOP degradation across a variety of systems to better constrain typical DOP degradation dynamics and to better understand the factors controlling them.
Here, it is also important to consider the difference in model fits between the DOC and DOP degradation curves. DOC degradation was incredible, consistent across system, allowing for the degradation models to accurately estimate the recalcitrant portion of the DOC pool and degradation rate (Supplementary Figure 2). However, in the case of DOP there was more variation in degradation pattern across systems and the proximity of many of the DOP measurements to a non-zero asymptote made it difficult to use the degradation model to accurately estimate a refractory DOP pool (Supplementary Figure 3). Nonetheless, we elected to use a two parameter decay model to estimate DOP degradation rates because the model provided a reasonable overall fit (R2-0.77, Supplementary Figure 3) and gave rates that could be directly compared to the DOC estimates. This approach does by definition infer that a refractory DOP is not present (i.e., 100% bioavailability) and tends to homogenize the overall DOP degradation patterns. A closer view of the DOP degradation plots (Supplementary Figure 3) revealed at least three different general patterns for DOP degradation: (1) DOP was rapidly degraded to a zero intercept, (2) DOP was slowly degraded to a zero intercept, or (3) DOP degraded slowly to a non-zero intercept but a zero intercept is inferred by the fit model. This third case would suggest that there is in fact a refractory DOP pool in these systems and this observation further supports our use of measured concentrations differences rather than DOP degradation models to calculate the size of the bioavailable DOP pool in these systems.
Bioavailability of DOC and DOP
Our measurements of the relative bioavailability of DOC are well within the range measured in other aquatic systems (Sondergaard and Middelboe, 1995; Stets and Cotner, 2008; Catalán et al., 2015; Helton et al., 2015; Frey et al., 2016). All but one of the systems we measured had BDOC values less than 50% of the total DOC pool, further supporting the idea that the bulk portion of DOC in freshwater is recalcitrant. However, these relative BDOC measures are quite high compared to marine systems, suggesting that exports to freshwater represent a younger, more labile carbon source than those found in marine systems. Furthermore, absolute BDOC concentrations were strongly related to TDN, TDP, and chlorophyll concentrations suggesting that nutrient availability is an important control on the accumulation of BDOC. This finding contrasts previous work that showed no significant correlation between BDOC and nutrient conditions (Stets and Cotner, 2008); however, it should be noted that Stets and Cotner also measured positive correlations between BDOC and both TDP and chlorophyll concentrations but the relationships were not statistically significant in the 12 lakes they studied. Nonetheless, our data also suggest that stoichiometry may be an additional constraint to BDOC accumulation. The fact that the slope in Figure 11B was more than 1 suggested that BDOC was accumulating disproportionately when DOC:DOP ratios were highest.
It was interesting to note that while the amount of BDOC was positively correlated to SUVA, the relative lability was not (Figure 9). SUVA has been shown to be highly correlated with the aromaticity of the DOM pool (Weishaar et al., 2003), so this pattern suggests that increasing aromaticity of the DOM pool does not significantly decrease its bioavailability. Furthermore, SUVA is considered a useful proxy for terrigenous organic matter with higher SUVA systems receiving large terrigenous inputs. SUVA was not strongly correlated to relative or absolute concentrations of BDOP, so we suggest that terrigenous inputs in our study systems represent a labile source of organic carbon but not organic phosphorus.
As with DOP degradation kinetics, estimates of the relative pool size of BDOP are sparse. However, the values reported in the literature are in good agreement with the values we measured here. In a Baltic Sea study, the DOP pool was 75% bioavailable (Stepanauskas et al., 2002) and a similar value (33.2–60%) was reported for 3 stations in the central Baltic as part of a different study (Nausch and Nausch, 2007). A more recent analysis suggested that ~40% of the DOP in four boreal lakes was bioavailable (Soares et al., 2017). Our study of 27 unique systems supports the idea of very labile BDOP with a median value of ~78%, but also highlights the large amount of variability in BDOP across systems. It should be mentioned, however, that our incubations lasted much longer than these other studies (150 days compared to ~7 days), which should have resulted in higher estimates of BDOP as our incubations would capture both rapidly degrading and slowly degrading DOP compounds. The fact that many of our incubations continued to show DOP losses up until 150 days into the incubations (Supplementary Figure 3) demonstrates the need for longer term incubations to fully describe the BDOP pool. On the other hand, our first sampling period occurred after ~30 days of incubation, which limited our ability to describe the degradation rates of the fastest degrading DOP pool. Given the rates of degradation documented in the literature and also the fact than many of our incubations showed major losses of DOP within the first 30 days, a stratified sampling method with high frequency measurements over the first few weeks and then less frequent measurements over several months may provide the best overall picture of DOP degradation.
Our findings also suggest that organic matter stoichiometry is an important control on the bioavailability of DOP. We found that the DOC:DOP ratio was a significant predictor of both absolute and relative BDOP (Figures 7, 8), with higher DOC:DOP ratios correlated to lower BDOP concentrations and percentages and a higher BDOC:BDOP ratio relative to the DOC:DOP pool (Figure 11). These patterns suggest that relative size of the BDOP pool decreased when the DOP was small relative to DOC. Presumably when the DOC pool size was large relative to DOP, microbes were more likely to be P-limited and consumed any bioavailable P. In lakes with lower DOC:DOP ratios, the organic matter pool would more closely resemble the biomass requirements of aquatic bacteria and/or the microbes are more likely to be limited by organic C rather than P.
Stoichiometry of Bioavailable Nutrients
Ecological stoichiometry provides a guide for predicting the cycling of multiple nutrients by examining the elemental balance between organisms and their resources. However, a fundamental problem associated with understanding these imbalances is our capacity to know what the resource availability is that organisms actually experience. Our ability to accurately describe the resource imbalance experienced by bacterial communities in situ is hindered by our lack of simultaneous measurements of the bioavailability of multiple elements (Berggren et al., 2014; Soares et al., 2017). Here, we observed that the experienced BDOC:BDOP resource ratios of aquatic bacterial communities were typically less than measured DOC:DOP pools (Figure 11). Therefore, bulk chemical measurements likely overestimate the size of the labile DOC pool or underestimate the size of the DOP pool. The fact that our measurements of BDOP indicated that large fractions of the DOP pool could be bioavailable while there clearly was a non-labile pool of DOC suggests that DOC measurements overestimate the BDOC pool, which many other studies have observed. Nonetheless, previous measurements of imbalance using bulk chemistry data likely overestimate the actual imbalance experienced by these communities particularly in more carbon-limited systems. Furthermore, our results suggest that it is at lower C:P ratios, i.e., more eutrophic systems, where chemical measurements of DOC:DOP are likely to overestimate the bioavailable pool of DOC (Figure 11). Although there is more BDOC being produced in these systems, the microbial biomass is more likely to be limited by the availability of organic carbon, resulting in more drawdown and an increased proportion of the DOC pool being recalcitrant. This has important implications for understanding how bacteria couple C and P cycles in freshwater because the experienced imbalance between consumer and resources governs the differential recycling of those nutrients. If heterotrophic bacteria in aquatic systems experience a more balanced resource pool in terms of the C:P ratio than previously thought, this should result in more efficient C cycling as compared to predictions based on bulk chemistry ratios.
Conclusions
The 27 aquatic systems examined in this study demonstrate that DOP bioavailability was quite variable across systems but was strongly predicted by the DOC:DOP ratio of the system. The bioavailability of DOC was more tightly constrained due to an increased proportion of recalcitrant material relative to DOP and it was not predicted by organic pool stoichiometry but rather was strongly related to nutrient conditions (both TDN and TDP concentration). Exponential decay models fit the loss of DOC tightly, but were not as strong of a fit for DOP. Given that DOP turnover times were calculated using an exponential model with no asymptote (and therefore assuming 100% bioavailable DOP in all samples) our estimates for turnover times are likely skewed high, particularly for systems with sizeable recalcitrant DOP pools. Despite these potential limitations, our data suggest that DOP turnover time was significantly faster than DOC turnover in the Itasca region (in one case, ~20 times faster), but DOC and DOP had similar rates of turnover in the other two regions. This suggests that overall DOP in freshwater systems is turning over as quickly or more quickly than DOC. More measurements are needed in order to properly assess this spatial variability and determine if there are any broader geographic patterns in the relative turnover rates of DOC and DOP in freshwaters, particularly because variability in DOC and DOP degradation rates could not be explained by inorganic nutrient pool sizes or lake characteristics measured in this study.
Furthermore, we have shown that organic matter stoichiometry is an important control on the accumulation of bioavailable DOP in aquatic systems. Relative bioavailability of DOP was positively related to the concentration of DOP in the sample and negatively correlated to the initial DOC:DOP ratio, suggesting that DOP accumulates in systems that are less P-limited. In contrast, the initial organic matter stoichiometry was not predictive of relative or absolute BDOC. Instead, BDOC accumulation was associated with high nutrients (TDN and TDP) and high production (chlorophyll). Absolute BDOC was also strongly correlated to SUVA values, providing evidence that terrestrial subsidies represent a labile source of DOC in the systems studied. Finally, incorporating measures of nutrient bioavailability decreased the predicted nutrient imbalance experienced by heterotrophic bacteria in aquatic systems, which has important implications for understanding the coupling of C and P biogeochemical cycles.
Author Contributions
ST performed the field work and data collection. JC and ST jointly contributed to the research design, data analysis, and manuscript writing.
Funding
This work was funded by the Itasca Graduate Student Fellowship and Moos Graduate Fellowship in the aquatic science awarded to ST by the College of Biological Sciences at the University of Minnesota and NSF award 1257571 to JC.
Conflict of Interest Statement
The authors declare that the research was conducted in the absence of any commercial or financial relationships that could be construed as a potential conflict of interest.
Acknowledgments
The authors would like to thank Bri Loeks-Johnson and Dr. Lesley Knoll for their help in the field collecting samples and Andrea Little for her technical support on the project.
Supplementary Material
The Supplementary Material for this article can be found online at: https://www.frontiersin.org/articles/10.3389/fenvs.2018.00062/full#supplementary-material
References
Anderson, D. M., Patricia, M. G., Joann, M. B., Donald, M. A., Patricia, M. G., Joann, M., et al. (2002). Harmful algal blooms and eutrophication: nutrient sources, composition, and consequences coastal waters : global patterns of cause and effect. Estuaries 25, 704–726. doi: 10.1007/BF02804901
Berggren, M., Ryan, A., Sponseller, A. R., Alves, S., and Ann, K. B. (2014). Toward an ecologically meaningful view of resource stoichiometry in DOM-dominated aquatic systems. J. Plank. Res. 37, 489–499. doi: 10.1093/plankt/fbv018
Björkman, K. M., and Karl, M. D. (1994). Bioavailability of inorganic and organic phosphorus compounds to natural assemblages of microorganisms in Hawaiian coastal waters. Mar. Ecol. Process Ser. 111, 265–273. doi: 10.3354/meps111265
Björkman, K. M., and Karl, M. D. (2003). Bioavailability of dissolved organic phosphorus in the euphotic zone at station ALOHA, north pacific subtropical gyre. Limnol. Oceanogr. 48, 1049–1057. doi: 10.4319/lo.2003.48.3.1049
Boström, B., Gunnar, P., and Brita, B. (1988). Bioavailability of different phosphorus forms in freshwater systems. Hydrobiologia 170, 133–155. doi: 10.1007/BF00024902
Catalán, N., Anne, M. K., Hannes, P., Francesc, C., and Lars, J. T. (2015). Absence of a priming effect on dissolved organic carbon degradation in lake water. Limnol. Oceanogr. 60, 159–168. doi: 10.1002/lno.10016
Catalán, N., Rafael, M., Dolly, N. K., and Lars, J. T. (2016). Organic carbon decomposition rates controlled by water retention time across inland waters. Nat. Geosci. 9, 501–504. doi: 10.1038/ngeo2720
Cole, J. J., Yves, P., Caraco, N. F., McDowell, W. H., Tranvik, L. J., Robert, G. S., et al. (2007). Plumbing the global carbon cycle: integrating inland waters into the terrestrial carbon budget. Ecosystems 10, 171–184. doi: 10.1007/s10021-006-9013-8
Cotner, J. B., and Biddanda, A. B. (2002). Small players, large role: microbial influence on biogeochemical processes in pelagic aquatic ecosystems. Ecosystems 5, 105–121. doi: 10.1007/s10021-001-0059-3
Cotner, J. B., Edward, K. H., Thad, S. J., and Mikal, H. (2010). Freshwater bacteria are stoichiometrically flexible with a nutrient composition similar to seston. Front. Microbiol. 1:132. doi: 10.3389/fmicb.2010.00132
Cotner, J. B., and Wetzel, R. G. (1992). Uptake of dissolved inorganic and organic phosphorus compounds by phytoplankton and bacterioplankton. Limnol. Oceanogr. 37, 232–243. doi: 10.4319/lo.1992.37.2.0232
Donald, D. B., Matthew, J. B., Kerri, F., and Peter, R. L. (2011). Comparative effects of urea, ammonium, and nitrate on phytoplankton abundance, community composition, and toxicity in hypereutrophic freshwaters. Limnol. Oceanogr. 56, 2161–2175. doi: 10.4319/lo.2011.56.6.2161
Dyhrman, S. T., and Ruttenberg, C. K. (2006). Presence and regulation of alkaline phosphatase activity in eukaryotic phytoplankton from the coastal ocean: implications for dissolved organic phosphorus remineralization. Limnol. Oceanogr. 51, 1381–1390. doi: 10.4319/lo.2006.51.3.1381
Falkowski, P. (2000). The global carbon cycle: a test of our knowledge of earth as a system. Science 290, 291–296. doi: 10.1126/science.290.5490.291
Frey, K. E., William, V. S., Paul, J. M., and Robert, M. H. (2016). Optical properties and bioavailability of dissolved organic matter along a flow-path continuum from soil pore waters to the Kolyma river mainstem, East Siberia. Biogeosciences 13, 2279–2290. doi: 10.5194/bg-13-2279-2016
Godwin, C. M., and James, B. C. (2015). Aquatic heterotrophic bacteria have highly flexible phosphorus content and biomass stoichiometry. ISME J. 9, 2324–2327. doi: 10.1038/ismej.2015.34
Heiskary, S. A., Bruce, W. C., and David, P. L. (1987). Analysis of regional patterns in lake water quality: using ecoregions for lake management in Minnesota. Lake Reserv. Manage. 3, 337–344. doi: 10.1080/07438148709354789
Helton, A., Meredith, W., Emily, S. B., Geoffrey, P., Rose, M. C., and Jack, S. A. (2015). Dissolved organic carbon lability increases with water residence time in the alluvial aquifer of a river floodplain ecosystem. J. Geophys. Res. 120, 693–706. doi: 10.1002/2014JG002832
Jackson, G. A., and Williams, M. P. (1985). Importance of dissolved organic nitrogen and phosphorus to biological nutrient cycling. Deep Sea Res. Oceanogr. Res. Papers 32, 223–235. doi: 10.1016/0198-0149(85)90030-5
Li, B., and Brett, M. T. (2013). The influence of dissolved phosphorus molecular form on recalcitrance and bioavailability. Environ. Pollut. 182, 37–44. doi: 10.1016/j.envpol.2013.06.024
Lønborg, C., Keith, D., Xosé, A., Álvarez-Salgado, and Axel, E. J. M. (2009). Bioavailability and bacterial degradation rates of dissolved organic matter in a temperate coastal area during an annual cycle. Mar. Chem. 113, 219–226. doi: 10.1016/j.marchem.2009.02.003
Maranger, R., Jones, S., and James, C. (2018). Stoichiometry of carbon, nitrogen, and phosphorus through the freshwater pipe. Limnol. Oceanogr. Lett. 3, 89–101. doi: 10.1002/lol2.10080
Mather, R. L., Reynolds, S. E., Wolff, G. A., Williams, R. G., Torres-Valdes, S., Woodward, E. M. S., et al. (2008). Phosphorus cycling in the north and south Atlantic ocean subtropical gyres. Nat. Geosci. 1, 439–443. doi: 10.1038/ngeo232
Murphy, J., and Riley, J. P. (1962). Determrnation single solution method for the in natural. Anal. Chim. Acta 27, 31–36. doi: 10.1016/S0003-2670(00)88444-5
Nausch, M., and Nausch, G. (2006). Bioavailability of dissolved organic phosphorus in the Baltic sea. Mar. Ecol. Prog. Ser. 321, 9–17. doi: 10.3354/meps321009
Nausch, M., and Nausch, G. (2007). Bioavailable dissolved organic phosphorus and phosphorus use by heterotrophic bacteria. Aquat. Biol. 1, 151–160. doi: 10.3354/ab00012
Ruttenberg, K. C., and Sonya, T. D. (2005). Temporal and spatial variability of dissolved organic and inorganic phosphorus, and metrics of phosphorus bioavailability in an upwelling-dominated coastal system. J. Geophys. Res. 110, 1–22. doi: 10.1029/2004JC002837
Schindler, D. W., Hecky, R. E., Findlay, D. L., Stainton, M. P., Parker, B. R., Paterson, M. J., et al. (2008). Eutrophication of lakes cannot be controlled by reducing nitrogen input: results of a 37-year whole-ecosystem experiment. Proc. Natl. Acad. Sci. U.S.A. 105, 11254–11258. doi: 10.1073/pnas.0805108105
Schlesinger, W. H., and Bernhardt, E. S. (2013). “The global cycles of nitrogen and phosphorus,” in Biogeochemistry: An Analysis of Global Change, 3rd Edn (Waltham MA: Academic Press), 445–467.
Soares, A. R. A., Ann, K. B., Ryan, A. S., Joanna, M. M., Reiner, G., and Emma, S. K. (2017). New insights on resource stoichiometry: assessing availability of carbon, nitrogen, and phosphorus to bacterioplankton. Biogeosciences 14, 1527–1539. doi: 10.5194/bg-14-1527-2017
Sondergaard, M., and Middelboe, M. (1995). A cross-system analysis of labile dissolved organic carbon. Mar. Ecol. Prog. Ser. 118, 283–294. doi: 10.3354/meps118283
Sonzogni, W. C., Chapra, S. C., Armstrong, D. E., and Logan, T. J. (1982). Bioavailability of phosphorus inputs to lakes1. J. Environ. Qual. 11, 555. doi: 10.2134/jeq1982.00472425001100040001x
Standard Methods (2005). Standard Methods For the Examination of Water and Wastewater, 11th Edn. Washington, DC: Standard Methods.
Stepanauskas, R., Niels, O. G., Ørgensen, J., Eigaard, O. R., Audrius, Ž., Lars, J. T., et al. (2002). Summer inputs of riverine nutrients to the Baltic sea: bioavailability and eutrophication relevance. Ecol. Monogr. 72, 579–597. doi: 10.2307/3100058
Stets, E. G., and Cotner, J. B. (2008). Littoral zones as sources of biodegradable dissolved organic carbon in lakes. Can. J. Fish. Aquat. Sci. 65, 2454–2460. doi: 10.1139/F08-142
Teubner, K., Crosbie, N. D., Donabaum, K., Kabas, W., Kirschner, A. K., Pfister, M., et al. (2003). Enhanced phosphorus accumulation efficiency by the pelagic community at reduced phosphorus supply: a lake experiment from bacteria to metazoan zooplankton. Limnol. Oceanogr. 48, 1141–1149. doi: 10.4319/lo.2003.48.3.1141
Tranvik, L. J., John, A. D., James, B. C., Steven, A. L., Robert, G. S., Thomas, J. B., et al. (2009). Lakes and reservoirs as regulators of carbon cycling and climate. Limnol. Oceanogr. 54, 2298–2314. doi: 10.4319/lo.2009.54.6_part_2.2298
Vonk, J. E., Tank, S. E., Mann, P. J., Spencer, R. G. M., Treat, C. C., Striegl, R. G., et al. (2015). Biodegradability of dissolved organic carbon in permafrost soils and aquatic systems: a meta-analysis. Biogeosciences 12, 6915–6930. doi: 10.5194/bg-12-6915-2015
Weishaar, J., George, A., Brian, B., Miranda, F., Roger, F., and Kenneth, M. (2003). Evaluation of specific ultra-violet absorbance as an indicator of the chemical content of dissolved organic carbon. Environ. Sci. Technol. 37, 4702–4708. doi: 10.1021/es030360x
Wetzel, R. G. (2001). Limnology: Lake and River Ecosystems. 3rd Edn. San Diego, CA: Gulf Professional Publishing.
Keywords: phosphorus, carbon, bioavailability, dissolved organic matter, degradation
Citation: Thompson SK and Cotner JB (2018) Bioavailability of Dissolved Organic Phosphorus in Temperate Lakes. Front. Environ. Sci. 6:62. doi: 10.3389/fenvs.2018.00062
Received: 24 March 2018; Accepted: 07 June 2018;
Published: 28 June 2018.
Edited by:
Solange Duhamel, Lamont Doherty Earth Observatory (LDEO), United StatesReviewed by:
Monika Nausch, Leibniz Institute for Baltic Sea Research (LG), GermanyMartin Tucker Auer, Michigan Technological University, United States
Copyright © 2018 Thompson and Cotner. This is an open-access article distributed under the terms of the Creative Commons Attribution License (CC BY). The use, distribution or reproduction in other forums is permitted, provided the original author(s) and the copyright owner are credited and that the original publication in this journal is cited, in accordance with accepted academic practice. No use, distribution or reproduction is permitted which does not comply with these terms.
*Correspondence: Seth K. Thompson, dGhvbTI1ODdAdW1uLmVkdQ==
 Seth K. Thompson
 James B. Cotner