 Chiara M. Bertelli
 Richard K. F. Unsworth
95% of researchers rate our articles as excellent or good
Learn more about the work of our research integrity team to safeguard the quality of each article we publish.
Find out more
ORIGINAL RESEARCH article
Front. Environ. Sci. , 06 June 2018
Sec. Conservation and Restoration Ecology
Volume 6 - 2018 | https://doi.org/10.3389/fenvs.2018.00039
This article is part of the Research Topic Structure, Functioning and Conservation of Coastal Vegetated Wetlands View all 14 articles
Zostera marina is the dominant seagrass species in the Northern Hemisphere where it grows in sheltered bays and estuaries. As a consequence of its distribution its conservation is commonly threatened by poor coastal water quality. The high minimum light requirements of seagrasses results in water quality degradation (high turbidity and eutrophication) being a significant risk. Bioindicators of light stress can be used to interpret seagrass responses to light limitation and therefore act as sentinels for conservation management. However, there exists limited experimental inter-comparison of the effectiveness of multiple individual bioindicator responses. Meta-analysis suggests that rhizome sugars, shoot C:N, shoot growth, and number of leaves per shoot provide the most consistent response variables to increasing light limitation in seagrass, but this premise remains largely untested at the plant level as a direct comparison of multiple bioindicators. The present study aimed to test the morphological, physiological, and photo-physiological bioindicator responses of Z. marina to light stress applied within controlled laboratory conditions. These bioindicators were used to assign minimum light thresholds. Growth rate and photophysiological parameters (alpha, Ek, and ETRmax) were rapidly (1st week) and drastically affected by low light shade treatments (20.12 μmol photons m−2s−1 and lower). After 3 weeks at low light, significant reductions in maximum leaf length and leaf width were observed. Principal Component Analysis identified leaf length, shoot growth, shoot surface area, ETRmax, Ek, and alpha as having the strongest responses to reduced light. Shoot growth, ETRmax, Ek, and alpha were found to provide the best early warning of light limitation after 5–8 days. These results provide evidence for bioindicators of light stress in Z. marina and highlights the importance of understanding these responses for the successful management and conservation of this species.
Chronic and temporary light reductions caused by reduced water quality are the biggest threat to seagrasses globally (Hemminga, 1998; Biber et al., 2009; Jiang et al., 2013). The sensitivity to light reduction and high nutrient levels defines seagrasses as sentinels of coastal degradation (Orth et al., 2006; McMahon et al., 2013) and in many cases seagrasses are integrated into management plans to assess the ecological status of coastal waters (Dennison et al., 1993; Krause-jensen et al., 2005; Foden and Brazier, 2007). However, poor water quality has resulted in a steady decline in seagrass meadows for decades worldwide and we are at risk of losing the very sentinels of coastal health we have defined (Dennison et al., 1993; Short and Wyllie-Echeverria, 1996; Orth et al., 2006; McMahon et al., 2013).
Seagrasses have been found to exhibit various changes in morphology and physiology in response to light limitation. These responses can be used as bioindicators of reduced light levels attributed to anthropogenic disturbance or other causes for decline in water quality. Light limitation generally causes a decrease in above ground biomass, enabling plants to reduce the respiratory demand of the shoots, but resulting in a decrease in photosynthetic capacity (Campbell and Miller, 2002; Ralph et al., 2007; Collier et al., 2012b). This is shown in morphological responses exhibited during shading experiments such as decreases in leaf length, leaf width, shoot growth, and fewer leaves per shoot reducing overall plant surface area (Olesen and Sand-jensen, 1993; Biber et al., 2009; Ochieng et al., 2010; Collier et al., 2012b; Yaakub et al., 2013). The photosynthetic performance of seagrasses, measured using chlorophyll fluorescence, has been found to be affected by light stress within a relatively short time-frame from within days to just seconds (Ralph and Gademann, 2005; Bité et al., 2007). The reduction in light availability results in an increase in the light capture efficiency of the photosystems, but an overall decrease in electron transport rates and carbon fixation (Ralph and Gademann, 2005; Bité et al., 2007). Light reduction can also result in an increase in chlorophyll content, with the chlorophyll a:b ratio lowering to increase photosynthetic efficiency (Collier et al., 2008, 2012b; Sharon et al., 2009; Silva et al., 2013). However, some studies have found the opposite effect under very low light conditions (Biber et al., 2009; Collier et al., 2012b). These responses in morphology and physiology indicate that seagrasses are able to acclimate to a changing light environment. However, the ability to adapt and maintain a positive carbon balance will depend upon the stores within the rhizomes which will have been built up in higher light conditions, as well as the strength and length of light attenuating events (Dennison and Alberte, 1985; Yaakub et al., 2013). This can be shown by a reduction in rhizome sugars and reduced carbon uptake indicated by the carbon nitrogen ratio (C:N) in the shoots (Alcoverro et al., 1999; McMahon et al., 2013). If light levels drop below the minimum light requirement (MLR) threshold, plants are unable to maintain this carbon balance and plant mortality follows.
The range of responses and adaptations of seagrasses to changing light environments could be a reason for the variety of methods used in monitoring. In Europe, 49 seagrass indicators and a total of 51 metrics have been identified in a review of monitoring strategies (Marbà et al., 2013). A more consistent approach would prove useful for managers in determining the status of seagrass meadows aided by identifying the best metrics to measure. A detailed meta-analysis by McMahon et al. (2013) revealed a number of consistent and robust bioindicators to light stress from an array of tropical and temperate seagrass species across a geographical range. In particular, rhizome sugars, shoot C:N, shoot growth, and number of leaves per shoot were found to exhibit early responses, with shoot density and above-ground biomass as meadow-scale, long-term responses. However, it should be taken into consideration that response thresholds to light reduction are species-specific and dependent on morphological plasticity, storage products, and growth rates (Olesen et al., 2002; Ralph et al., 2007; Collier et al., 2012b). Although there exists a number of reviews and meta-analyses of bioindicators (Biber et al., 2005; Lee et al., 2007; Ralph et al., 2007; McMahon et al., 2013), there are limited case study examples that simultaneously compare a plethora of morphological, photophysiological, and biochemical indicators of seagrass response to light availability.
Zostera marina (eelgrass) is a prolific temperate seagrass found growing from the intertidal to depths of around 10 m depending on water clarity (Dennison and Alberte, 1982; Jackson et al., 2013). Its distribution in temperate and subpolar regions makes Z. marina particularly vulnerable to light limitation, with significant reductions in light during winter months (Backman and Barilotti, 1976; Zimmerman et al., 1995; Moore et al., 1997; Alcoverro et al., 1999). The MLR of seagrass is relatively high in comparison to other marine primary producers (Kenworthy and Fonseca, 1996), due in part to the large proportion of non-photosynthetic tissue that makes up the roots and rhizomes. By using maximal depth limits, the MLR for Z. marina is estimated to be 17.6 ± 5.3% SI (Dennison et al., 1993; Erftemeijer and Lewis, 2006; Lee et al., 2007). Surface irradiance (SI) levels vary spatially and temporally with photo-acclimation to local light regimes thought to be responsible for the large within-species variation (Lee et al., 2007). Other studies suggest that eelgrass requires 5–6 h of irradiance-saturated photosynthesis per day to maintain a positive carbon balance (Zimmerman et al., 1995, 1996; Alcoverro et al., 1999). Nonetheless, the understanding of the MLR threshold of survival has been highlighted as an important component which needs to be integrated into management and monitoring plans (Dennison et al., 1993; Erftemeijer and Lewis, 2006; McMahon et al., 2013; Yaakub et al., 2013; Collier et al., 2016).
The aim of the present study was to test a range of light stress bioindicators simultaneously by systematically monitoring the morphological and physiological responses of Z. marina to varying degrees of light stress treatment under experimental conditions. Plants under low and extremely low light treatments were expected to show a rapid change in photosynthetic performance and shoot growth followed by morphological responses as plants become constrained by low light, leading to mortality. Plants under medium light (close to MLRs) were expected to show less extreme responses and better adaptation to lower light conditions to allow survival. By monitoring the rate of numerous responses to light stress over time, this study aimed to identify the most robust bioindicators of light stress specific to Z. marina and provide a quantitative estimate for the MLR threshold for this seagrass species.
Thirty independent Z. marina cores (10 × 10 cm, 15–20 cm deep) were collected on a low spring tide from across a shallow subtidal seagrass meadow at Durgan, Helford River, UK (50°06′27.19″N; 5°06′54.70″W). Care was taken to ensure the plants were extracted with as little damage as possible and that the shoots had substantial rhizome sections and sediment for re-planting. The cores of seagrass were put into separate large plastic bags and then transferred to pots and placed in a cool box for transportation to Swansea University, with ice packs and fresh seawater. Extra samples of rhizomes and shoots were taken as site control samples for carbohydrate analysis (n = 4), chlorophyll content (n = 4) and C:N ratios (n = 5) to compare with plants at the end of the experiment. These samples were stored in a freezer at −20°C. The individual cores were replanted into tubs (n = 5 per treatment). Extra sediment collected from the field site was used to ensure natural presence of benthic fauna.
In the laboratory, the plants were left to acclimatize for 10 days before the experiment started in a flow-through system providing fresh filtered seawater. At the start of the experiment, the plants were placed under four different light treatments in a flow-through seawater micrososym providing continuous fresh seawater. Pumps and air stones were provided to ensure circulation and the shade treatments were created using shade cloths. The flow-through system was connected to a cooling unit to ensure maintenance of a temperature of 14 ± 1°C, simulating the sea temperature at time of collection. The temperature was monitored in each tank with a Tiny Tag (Aquatic 2, Gemini data loggers, Chester, UK) temperature logger. Frames with LED aquatic lights (AquaBeam 2000HD) were fitted and shades of varying weave put in place above and between the tubs to create independent shade treatments (and high light with no shade). A light meter (ULM-500, with spherical micro quantum Sensor US-SQS/L, Waltz GmbH, Effeltrich, Germany) was used to set up the light treatments by measuring the average PAR (Photosynthetic Active Radiation) in each tank section at the top of the seagrass leaf canopy. The HL treatment was set up to have a level that corresponds to HL treatments in other studies of around 100 ± 10 μmol photons m−2s−1 (Olesen and Sand-jensen, 1993; Biber et al., 2005; Shafer and Kaldy, 2013) also comparable to highest growth rates found previously (between 100 and 150 μmol photons m−2s−1, Olesen and Sand-jensen, 1993). The medium light treatment (ML) was set up using 40% shade cloth which gave an average of 27 ± 5 μmol photons m−2s−1 at plant height, to create light levels that correspond to levels of light compensated growth (between 19 and 47 μmol photons m−2s−1, Olesen and Sand-jensen, 1993). The low light treatment (LL) was created using a 90% shade cloth, reducing the light to around 7 ± 3 μmol photons m−2s−1. The extreme low light treatment (EL) was placed under a 98% shade cloth found to have a PAR of around 1.8 ± 0.5 μmol photons m−2s−1. Lights were fitted on a timer to give a photoperiod of 10 h of light and 14 h of dark reflecting the natural daylight hours at time of collection. An Odyssey PAR light logger (Dataflow Systems Ltd), calibrated against a Li-Cor quantum light sensor (LI 192), was deployed at mid-depth of plant canopy under each treatment for 1–2 days logging every 10 mins, to provide an average PAR per day (Table 1). The experiment was set up to run for 6 weeks after acclimation time.
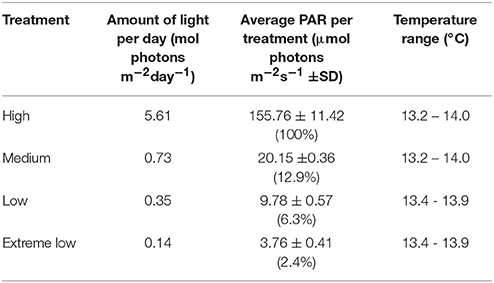
Table 1. Total amount of light recorded by Odyssey PAR logger placed within tanks (calibrated with a LI-COR, Li-250A light meter) and temperature range logged for each treatment tank.
Morphometric measurements for each shoot (n = 5 per treatment) were taken weekly, these included; sheath length, leaf length (taken from top of sheath to tip of leaf), leaf width, and shoot growth. Leaves were wiped clean of epiphytes throughout the experiment although older ends of leaves were difficult to clean without causing damage so were left, but these tended to be chlorotic and often dead (Drake et al., 2003). Lengths measurements were taken with a measuring tape to the nearest mm, and the maximum leaf length for each shoot was analysed as a measure that can be attributed to canopy height in seagrass meadows (Longstaff and Dennison, 1999). Leaf width was measured using calipers to the nearest 0.05 mm at 5 cm above sheath or in the middle of each leaf <5 cm long. Average leaf width was calculated for each shoot. Shoot surface area was calculated from the length and width measurements of all leaves of all shoots to provide potential surface area for photosynthesis. For shoot growth, each plant was marked at the top of its sheath with a needle so the growth of each leaf could be measured using the method outlined by Short and Duarte (2001). If new leaves were found, they were marked at the same location on the sheath. The new growth could then be measured against the mark on the sheath, the outer part of which is usually dead and does not alter. If the outer leaf became detached then the top of the sheath would remain so growth could still be measured from this position. Raw values for maximum leaf length, shoot surface area, shoot growth, and average leaf width per shoot were used for statistical analysis.
Pulse Amplitude Modulated (PAM) fluorometry using a Diving-PAM (Waltz), was used to measure chlorophyll fluorescence weekly, as a non-invasive technique for assessing photosynthetic activity. Photosynthetic parameters were obtained by performing rapid light curves (RLC) using the internal stepwise function of the PAM fluorometer. These were conducted on the mid-section of the youngest mature leaf using a leaf clip, enabling the measurement of effective quantum yield (ΦpsII = (–F)/), where F is fluorescence yield and Fm′ is maximal fluorescence yield of the light adapted leaf at each irradiance step (Ralph and Gademann, 2005; Collier et al., 2008). Steps ranged from 7 to 1652 μmol photons m−2s−1 lasting 10 s, with initial saturating pulse >>2,000 μmol photons m−2s−1 (Beer et al., 2001) for 0.8 s. All RLCs were carried out between 11a.m. and 2p.m. Electron Transport Rate (ETR) was worked out using the equation; ETR = ΦpsII*Ii*AF*0.5, where AF is the absorption factor, calculated to be 0.78 (± 0.02 S.D., n = 5) (Beer et al., 2001; Saroussi and Beer, 2007) and Ii is the incident irradiance (from the light stages of the light curve programmed into the Dive-PAM). The stepwise RLCs were fitted to the non-linear least-squares regression model by Eilers and Peeters (Eilers and Peeters, 1988) to estimate the ETRmax (maximum rate of photosynthesis), α (the initial slope of the rapid light curve, a measure of the light harvesting efficiency) and Ek (the minimum saturating irradiance worked out from the intercept of α and the maximum photosynthetic rate).
At the end of the experiment, leaf material from each shoot was taken to be compared with site control samples taken from the field site at Durgan. Avoiding the older chlorotic leaves, leaf material was scraped free of epiphytes, blotted dry and weighed before being dried at 60°C for 48 h. The dried seagrass was ground up with a pestle and mortar to a fine homogenous powder before being weighed (Ohaus balance, max 100g d = 0.1 mg, Switzerland). Samples were sent to IBERS (Aberystwyth University) for analysis of the % composition of C and N by weight using a continuous flow isotope ratio mass spectrometer (Anca SL 20-20, Europa Scientific, Crewe, UK).
At the end of the experiment the rhizomes from each plant were separated, weighed, and also stored at −20°C to be compared with samples taken from the field site at Durgan. The rhizomes were dried in an oven at 60°C for 4–5 days. The dried rhizome sections were ground up with a pestle and mortar to a fine homogenous powder to enable analysis by HPLC. Samples were sent to IBERS at Aberystwyth University for analysis. Soluble rhizome sugars were extracted based on the method outlined in Cairns and Pollock (1988).
Samples of Z. marina from Durgan were collected from the study site and compared with samples from all of the plants at the end of the experiment. Chlorophyll was extracted in 90% acetone and quantified using a spectrophotometer (Schimadzu UV-2550 UV VIS Series) based on the methods outlined by Dennison (1990) and Granger and Izumi (2001).
Two-way repeated measures ANOVA was used to analyse time series collected data, with light treatment (between-subject effects) over time (within-subject effects) using SigmaPlot Version 11 (Systat Software, San Jose, CA). Data did not completely fulfill the assumptions of ANOVA therefore in order to minimize the risk of Type I error, significance was only accepted based on p-values of < 0.01 (Underwood, 1997; Collier et al., 2012b; McDonald, 2014). ANOVA was still performed due to the robust nature of the test and the relative insensitivity of the F test to departures from normality (Glass et al., 1972; Lix et al., 1996; McDonald, 2014). Results from the repeated measures ANOVA were interpreted with the Holm-Šídák pairwise comparisons test in SigmaPlot.
C:N ratio, rhizome total water soluble carbohydrate (WSC) content and chlorophyll content were analysed using one-way ANOVA in RStudio (R version 3.2.2) to compare plants after treatment with site control plants that were taken directly from Durgan (untreated). The Bartlett test for homogeneity was used to test for equal variance (Bartlett, 1937). Tukey's test was used to look at multiple comparisons of means.
Principal Component Analysis (PCA) using Primer6 was used to identify patterns of which morphological and photophysiological factors contributed to the biggest responses of plants to shade treatment over time. Principal components with eigenvalues >1.0 were considered, and eigenfactors or variable coefficients ≤ −0.3, or ≥ 0.3 were selected.
At the end of the experiment none of the HL shoots had died but all plants subjected to shade treatment (ML, LL, and EL) showed signs of mortality at the basal meristem (all leaves coming free from within the sheath) by day 43, with one LL shoot dying after just 4 weeks.
At the start of the experiment all plants exhibited a maximum leaf length within the range of 455 to 727 mm with an average of 564.00 ± 18.53 mm. The average max leaf length decreased in all plants throughout the experiment although reduction was lowest in HL plants. All plants under shade treatments showed a significant reduction in average max leaf length in comparison to those under HL from day 15 for ML (p = 0.009) and LL plants (p = 0.01) and day 22 for EL plants (p = 0.013, Figure 1). ML plants decreased steadily in length from day 15 resulting in a significant reduction in max leaf length to 391.60 ± 51.61 mm by day 43 (p < 0.001). LL plants also decreased steadily from day 15 although the differences in max leaf length were not significant. EL plants decreased in max leaf length from day 22 with a significant reduction shown between day 15 and day 37 (p = 0.002). HL plants remained with a max leaf length above 610 mm until day 43 when average max leaf length had decreased to 489.80 ± 38.47 mm.
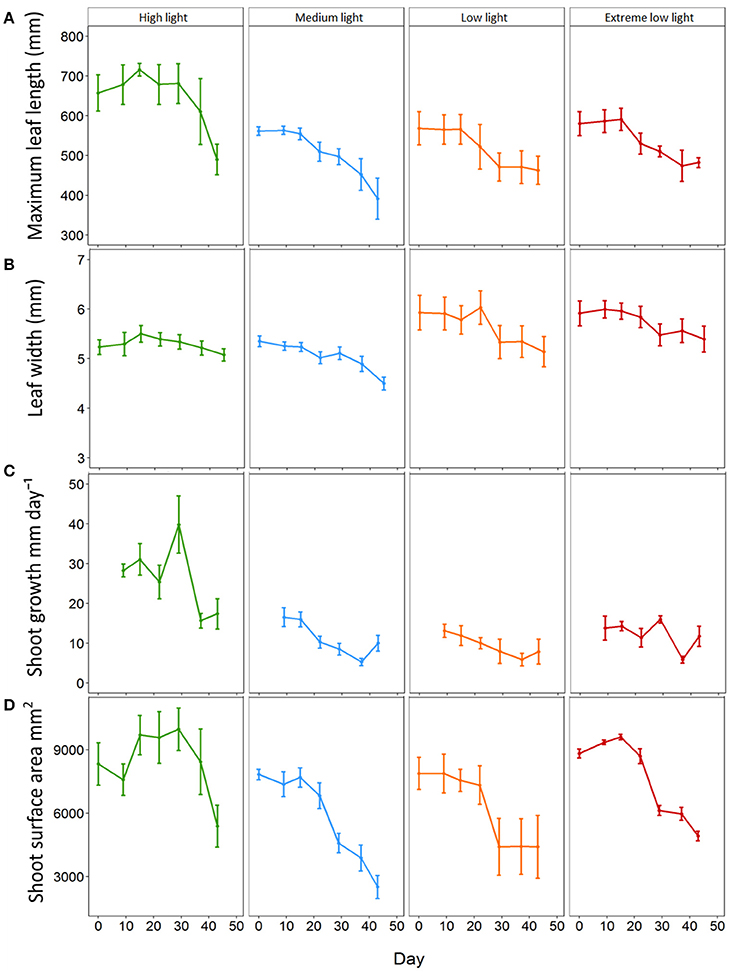
Figure 1. Effect of light shading on the morphological characteristics of Zostera marina over time. Plants were kept in a flow through aquaria using natural filtered seawater under artificial light. (A) Maximum leaf length (B) leaf width, (C) shoot growth and (D) total shoot surface area. Values are means ± SE, n = 5 (except low light plants on days 37 and 45 where n = 4).
The leaf width of all plants at the start of the experiment ranged between 4.6 and 6.85 mm.
All plants decreased in average width throughout the experiment and this reduction was lowest in HL plants. All plants under shade treatments showed significant reductions in width by day 29 with no significant change in leaf width for HL plants throughout the experiment (Figure 1). ML plants decreased steadily from day 0 and showed a significant reduction in width from 5.35 ± 0.11 mm to 5.02 ± 0.12 mm on day 22 (p = 0.002). LL plants decreased significantly in width from 5.93 ± 0.35 mm on day 0 to 5.14 ± 0.30 mm on day 43 (p < 0.001) with the first significant reduction by day 29 (5.33 ± 0.33 mm, p < 0.001). For EL plants leaf width decreased significantly from 5.92 ± 1.25 mm on day 0 to 5.40 ± 0.26 mm on day 43 (p < 0.001) with the first observed significant decrease in width observed on day 29 (5.48 ± 0.22 mm, p < 0.001). Results showed there was a significant interaction between light treatment and time on average leaf width (p ≤ 0.001) (Table 2).
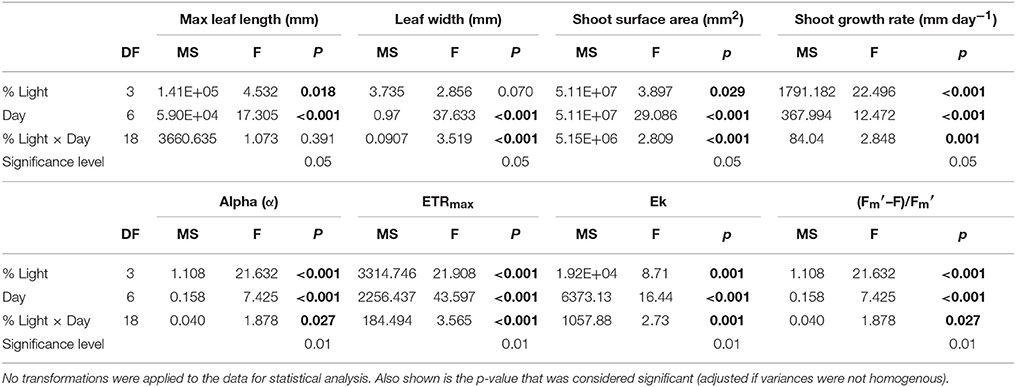
Table 2. Results of two-way repeated measures ANOVA testing for the within-subjects effects of time and treatment on the morphological parameters maximum leaf length, width shoot surface area, and shoot growth rate, and on the photosynthetic parameters Alpha (α), ETRmax and Maximal yield [(–F)/].
All plants decreased in average growth rate throughout the experiment, although this reduction was lowest in HL plants. HL plants had significantly higher growth of 28.29 ±1.63 mm day−1 on day 9 in comparison to 16.55 ± 2.36 mm day−1 for ML plants (p = 0.001), 13.10 ± 1.66 mm day−1 for LL plants (p ≤ 0.001) and 13.80 ± 3.03 mm day−1 for EL plants (p < 0.001) (Figure 1). Shoot growth of HL plants remained significantly higher than shade treated plants until day 37, and continued to remain higher than shaded plants until day 43. ML plants showed a significant decline in growth from day 9 to day 37 (p = 0.002). The growth of LL and EL plants was significantly lower than HL plants from day 9, but not significantly different to ML plants or to each other suggesting growth was already affected by light reduction for shade treated plants between before day 9. Results showed there was a significant interaction between light treatment and time for shoot growth (p = 0.001) (Table 2).
At the start of the experiment shoot surface area ranged from 4563.3 to 10580.0 mm2 and averaged 8218.6 ± 326.6 mm2. All plants decreased in average shoot surface area throughout the experiment with the lowest reduction in HL plants. All plants subjected to shade treatments showed a significant decline in surface area by day 29 (Figure 1). HL plants remained significantly larger in surface area than all shade treated plants from day 29 until day 43 (p ≤ 0.001–0.002). ML plants reduced in surface area by 41.5% (a reduction from 7831.89 ± 245.9 mm2 to 4584.1 ± 464.5 mm2, p ≤ 0.001) and LL plants were reduced by 44% by day 29 (from 7883.3 ± 756.6 mm2 to 4413.8 ± 1345.7 mm2, p ≤ 0.001). EL plants displayed a reduction of 30.5% on day 29 (p = 0.002) and had reduced by 44.3% by day 43 (p ≤ 0.001). For plant surface area there was a significant interaction between light and day (p ≤ 0.001) (Table 2).
At the start of the experiment the light harvesting efficiency or alpha (α) ranged from 0.53 to 1.27 with an overall average of 0.87 ± 0.05. Alpha responded rapidly (by day 5) to shading treatments relative to the HL plants (Figure 2A). There was no significant change in α for HL plants throughout the experiment. ML plants, displayed a significant increase in α from 0.91 ± 0.07 on day 0 to 1.19 ± 0.02 on day 19 (p = 0.003). EL plants showed a significant increase in α from day 5 from 0.69 ± 0.08 to 1.25 ± 0.08 (p ≤ 0.001). LL plants showed no significant change in α over time, although levels remained significantly higher than HL plants throughout the experiment. Results showed there was a significant interaction between light treatment and time for alpha (p = 0.001) (Table 2).
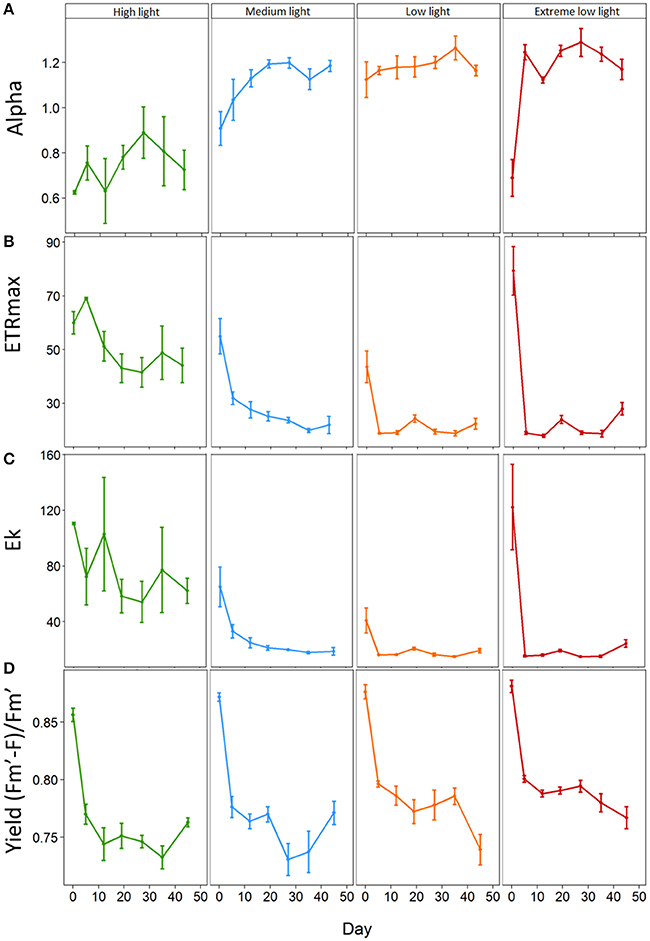
Figure 2. Effect of light shading on the photosynthetic properties of Zostera marina over time measured by PAM fluorometry. Plants were kept in a flow through aquaria using natural filtered seawater under artificial light. (A) Alpha α, (B) Maximum electron transport rate (ETRmax, μmol electrons m−2 s−1), (C) Minimum saturation irradiance (Ek, μmol photons m−2s−1) and (D) Effective quantum yield (Fm′–F)/Fm′. Values are mean ±SE, n = 4–5 (except HL and EL plants on day 0 where n = 2 and n = 3 respectively).
The maximum Electron Transport Rate (ETRmax) ranged from 26.82 μmol electrons m−2s−1 to 97.60 μmol electrons m−2 s−1 with an average of 57.98 ± 4.75 μmol electrons m−2 s−1 at the beginning of the experiment. The ETRmax was significantly affected in all shading treatments by day 5 (Figure 2B). Not all plants gave a reliable ETRmax value as some curves did not saturate and these results were omitted. HL plants remained with significantly higher ETRmax than all shade treated plants (p < 0.001–0.012) with EL plants showing the biggest drop of 76% from day 0 to day 5 (79.39 ± 9.11 to 18.96 ± 0.50 μmol photons m−2s−1; p < 0.001). ML plants showed a reduction in ETRmax of 42% on day 5 (55.03 ± 6.58 to 31.94 ± 2.34 μmol electrons m−2 s−1; p < 0.001). LL plants showed a reduction of 57% (43.66 ± 5.89 μmol electrons m−2 s−1 to 18.85 ± 0.24 μmol electrons m−2s−1; p < 0.001) on day 5. On the contrary, HL plants showed a slight increase on day 5 from 60.04 ± 4.18 μmol electrons m−2 s−1 to 69.10 ± 0.36 μmol electrons m−2 s−1.
The Ek of plants at the start of the experiment averaged 75.52 ± 11.32 μmol photons m−2s−1 with a broad range from 24.64 to 183.57 μmol photons m−2s−1. Not all plants gave a reliable Ek value as some curves did not saturate and these results were omitted. The Ek of all shaded plants was significantly affected on day 5 (Figure 2C). HL had a significantly higher Ek than shaded plants, 72.42 ± 20.38 compared to 33.07 ± 4.80 for ML (p = 0.002), 16.17 ± 0.19 for LL (p ≤ 0.001) and 15.27 ± 0.56 μmol photons m−2s−1 for EL plants (p ≤ 0.001). All plants showed a decrease in Ek throughout the experiment with EL plants showing the biggest reduction of 80.1% by day 43 (p ≤ 0.001).
The effective quantum yield was significantly affected by shading by day 12 where HL plants had significantly (p < 0.001 and p = 0.001 respectively) lower yield (0.74 ± 0.01) than EL plants (0.79 ± 0.003) and LL plants (0.79 ± 0.01). EL light levels resulted in plants having a significantly higher yield than HL until day 43 (Figure 2D).
Results of the one-way ANOVA with Tukey's post-hoc comparison showed ML plants had a significantly higher C:N (17.56 ±0.57) than EL plants (15.04 ±0.37), p ≤ 0.006. There were no significant differences in C:N between site control plants (16.48 ± 0.55) and any of the plants after treatment (Table 3, Figure 3).
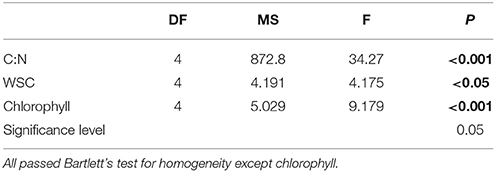
Table 3. Results of one-way ANOVA testing effects of light manipulation on the physiological parameters C:N, water soluble carbohydrate content of rhizomes (WSC), and leave chlorophyll content.
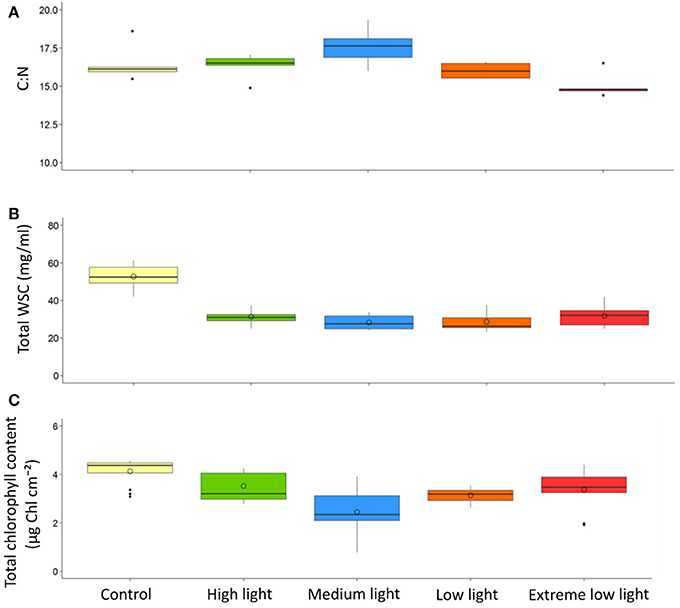
Figure 3. Effect of light shading on physiological properties of Z. marina with time. Plants were kept in a flow through aquaria using natural filtered seawater under artificial light. Boxplots show results from control site plants compared with plants at the end of the experiment. (A) C:N (B) Total water soluble carbohydrates(WSC), (C) Total chlorophyll content. Central line is the median, o point is the mean, n = 5.
Results of the one-way ANOVA with Tukey's post-hoc comparison showed site control plants had significantly higher total WSC content (52.76 ± 2.36 mg/ml) than all treatments (p ≤ 0.001). There was no significant difference between treatments at the end of the experiment (Table 3, Figure 3).
Results of the one-way ANOVA with Tukey's post-hoc comparison showed site control samples had significantly higher chlorophyll content (4.13 ± 0.16 μg Chl cm−2) than ML (2.45 ± 0.28 μg Chl cm−2), p ≤ 0.001, and LL plants (3.14 ± 0.09 μg Chl cm−2), p = 0.014. ML plants were also significantly lower in chlorophyll content than HL plants, p = 0 .002, and EL plants, p = 0.009 (Table 3, Figure 3).
Principal component analysis was used to show which bioindicators contributed to the most variability between treatments and within treatments over time. The first two principal components (PC1 and PC2) had eigenvalues over 1 making up over 70% of the variability. PC1 approximately corresponds with the change from high light to low light, whereas the treatments are more evenly spread across PC2. PC1 had an eigenvalue of 3.85 making up 48.1% of the variability, and showed a correlation (above 0.3) between the variables leaf length, shoot surface area, shoot growth, ETRmax, alpha, and Ek. The first component increases with decreasing leaf length, shoot surface area, shoot growth, ETRmax, Ek, and an increase in alpha. PC2 has a strong correlation with leaf width and shoot surface area (both above −0.5) and also a correlation with effective quantum yield (–F)/) (−0.482). PC2 increases with a decrease with these correlating factors. HL plants remain in cluster away from shade treated plants, only moving closer in similarity to shaded plants in week 5 and 6 (Figure 4).
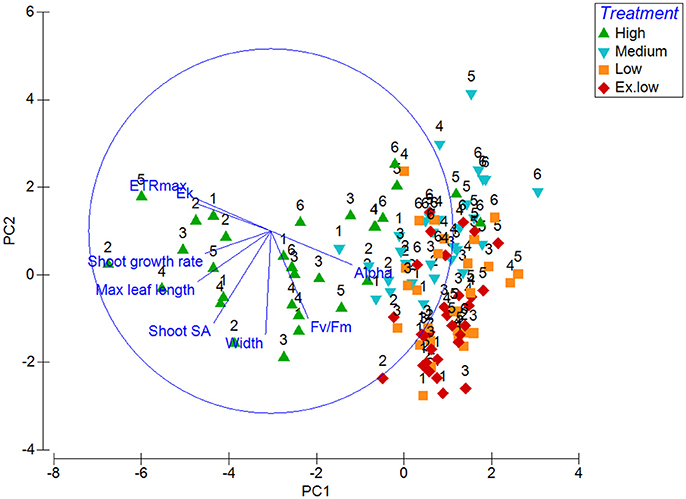
Figure 4. Principal Component Analysis graph of morphological (leaf length, width, shoot surface area and shoot growth) and photophysiological (Alpha, maximum electron transfer rate, minimum saturation irradiance, and effective quantum yield) responses with treatment and week (starting from week 1) as factors.
The present study provides an experimental test of the response of multiple photophysiological and morphological bioindicators to light limitation on Z. marina. The study provides an experimental insight into timescales and levels of response to light limitation specific to Z. marina relative to models of light stress developed through meta-analysis (McMahon et al., 2013). Leaf length, shoot growth rate, ETRmax, alpha, Ek, and shoot surface area showed the strongest responses to light limitation across time suggesting that they act as robust bioindicators of light stress in Z. marina. Leaf width and effective quantum yield were also found to respond consistently to light limitation. Physiological parameters proposed by the meta-analysis (McMahon et al., 2013) to make good bioindicators were not found to be as robust when considered directly against these other variables such as leaf length, alpha, and ETRmax.
Under light limiting conditions, plants exhibited significant reductions in length, width, surface area and growth rate within 3–4 weeks, resulting in a reduction of above ground tissue. This reduction potentially poses a respiratory burden to the plant (Fourqurean and Zieman, 1991; Collier et al., 2012a). Growth rate was significantly reduced in shaded plants by day 8, suggesting that the response could have been detected even earlier. At a meadow scale, we propose that the plant response to low light would result in a reduction in overall seagrass density with corresponding impacts upon ecosystem resilience (Unsworth et al., 2015; Maxwell et al., 2016). A reduction in canopy density may actually be considered an adaptive mechanism to maximise available light as this allows more ambient light through to reduce self-shading (Collier et al., 2012a).
The present study shows that a reduction in light to 20.12 μmol photons m−2s−1 (10:14 h light:dark photoperiod) is enough to cause a significant decrease in leaf length and width resulting in a decrease in plant surface area by 41% after 29 days, with further light stress in the LL and EL treatments causing similar albeit slightly bigger reductions. Light reductions of this scale would result in significant effects at a meadow scale within weeks, indicating that impacts causing light reductions over a similar time scale would have a substantially damaging effect. These results are comparable to in situ shading experiments conducted on Z. marina (Backman and Barilotti, 1976; Dennison and Alberte, 1985). A decline in shoot surface area results in significant implications on a meadow-scale. A reduced amount of photosynthetic tissue and a decrease in canopy density may affect the ability of the meadow to attenuate the effects of waves and currents. This results in an increase in levels of suspended sediments causing an increase in turbidity, and a reduction in sediment stabilization for the roots and rhizomes (van der Heide et al., 2007). A scenario like this can cause a shift to an alternate state within the meadow system, making it difficult for recovery unless conditions and light levels are restored (van der Heide et al., 2011; Unsworth et al., 2015). Frequent and prolonged periods of reductions in light levels to 20.12 μmol photons m−2s−1 or below should be cause enough to alert managers to take action to improve water quality.
The meta-analysis by McMahon et al. (2013) did not recommend the morphological characteristics of leaf length, leaf width or shoot surface area as robust bioindicators of light stress for seagrasses overall. However, there is evidence for differences between different genera or species in response to light limitation. For instance, Z. muelleri was found to have the most rapid and “plastic” responses in morphology and growth to shading when compared to three other species of differing genus (Collier et al., 2012b). The importance of these differences is also highlighted by contrasting interspecific morphological responses, for example, Posidonia oceanica has been found to increase leaf width whilst Zostera nigricaulis, Halophila ovalis, and Halodule wrightii exhibit an increase in leaf length as a way of increasing light capture (Bulthuis, 1983; Dalla Via et al., 1998; Shafer, 1999; Collier et al., 2007).
Photophysiological responses to shading were exhibited within the first week and results showed trends consistent with other studies (Belshe et al., 2008; Beer et al., 2014). All plants showed high variability in alpha, ETRmax and Ek on day 0, however by day 5, all shaded plants exhibited significant reductions in ETRmax and Ek and significant increases in alpha. HL plants did not show such significant changes in alpha or ETRmax as would be expected of plants adapted to higher light conditions. In contrast to the meta-analysis the present study identified alpha as a robust indicator of light stress, along with ETRmax and Ek. The use of PAM fluorometry is useful as a non-invasive monitoring tool as it can detect physiological responses of seagrasses to light stress before morphological changes take place (Belshe et al., 2007). However, photosynthesis measurements using PAM display high levels of seasonal, diurnal and shoot-scale variation which need to be fully understood (Durako and Kunzelman, 2002). Also, chlorophyll fluorescence has been found to be good for assessing recovery in Z. marina, but not for detecting the onset of mortality (Biber et al., 2009). Even so, if the use of PAM fluorometry is feasible, consistent monitoring would give valuable information about the environmental conditions of a Z. marina meadow, especially if used alongside morphological bioindicators.
Physiological responses measured in this study showed no significant changes between shaded and HL plants. There were no significant changes in C:N at the end of the experiment when compared to control site samples. This could have been affected by the time of year the samples were taken. The C:N of Z. marina is usually at its highest in summer months and lowest in winter months (Fourqurean et al., 1997) and sampling for the present study took place in late October (autumn in UK). It should also be noted that C:N has been identified as a robust bioindicator for Z. marina in a study that used an intensive field sampling strategy providing reliable evidence to this effect (Jones and Unsworth, 2016).
The WSC content of rhizomes did not vary significantly between treatments at the end of the experiment and therefore the present study did not conclusively find WSC to be a robust bioindicator of light stress. The significant seasonal variation in carbohydrate stores of Z. marina (Dawes and Guiry, 1992; Burke et al., 1996; Soissons et al., 2016) suggests sampling time could also have effected this result.
Leaf chlorophyll content did not provide a strong predictor of light limitation. LL and ML plants had the lowest chlorophyll levels, although shaded plants were expected to have higher chlorophyll content than control plants. However, if light stress is too high, plants are unable to respond by producing more chlorophyll. Collier et al. (2012b) also found that chlorophyll levels in very low light treated plants did not increase compared to the HL treated plants. This was thought to be due to the higher level of stress counteracting the energetic benefits of producing more chloroplasts.
Findings from this study indicate that MLR thresholds of Z. marina are between the levels of HL and ML treatments: between 155.76 and 20.12 μmol photons m−2s−1 or 5.61 and 0.73 mol photons m−2day−1 under experimental conditions. Maximum growth rates of Z. marina have previously been found to be at irradiances between 100-150 μmol photons μm−2s−1 (Dennison and Alberte, 1985; Olesen and Sand-jensen, 1993), or 5 mol photons m−2day−1 (Thom et al., 2008) and the photosynthesis saturating irradiance required for plant growth in situ found to be to be 30–40 μmol photons m−2s−1 (Alcoverro et al., 1999). As such, HL treatment at 155.76 μmol photons m−2day−1 could be considered to be the equivalent of a maximal surface irradiance level and it could therefore be suggested that ML treatment is equivalent to ~12.9% of SI. This is similar to the MLRs that have been determined for Z. marina in other studies (Olesen and Sand-jensen, 1993; Short et al., 1995; Koch and Beer, 1996). Despite being close to the MLR, the ML treatment in this study is still considerably higher than the light compensation point determined for Z. marina in other studies at comparable temperatures; 8.33 μmol photons m−2s−1 at 15°C (Abe et al., 2003), 10 μmol photons m−2s−1 at 20°C (Dennison and Alberte, 1982) and 18.5 μmol photons m−2s−1 at 15°C (Olesen and Sand-jensen, 1993). Consequently, one would expect seagrasses under the ML treatment to be still surviving, although maybe not thriving. However, ML plants showed similar responses to LL and EL plants with the bioindicators not changing in a proportional manner relative to light treatment. This suggests that below a certain light threshold, responses will be consistent. The significant impacts to photosynthetic properties and growth rate within the first week, and significant reductions in leaf length, width and surface area after 4 weeks of shade treatment indicates 12.9% SI or 20.12 μmol photons m−2s−1 for 10 h per day is insufficient for Z. marina survival.
This study experimentally tests a wide range of bioindicators of light stress on Z. marina plants within controlled laboratory conditions (Figure 5). The minimum light threshold for Z. marina was found to be above 20.12 μmol photons m−2s−1 with photophysiological responses and shoot growth being the first bioindicators to be adversely affected by light stress to this level within the first week. Morphological factors took longer to be affected by light stress; this response was observed between 29 and 39 days. EL plants experienced lowest light levels, but responses were not always as quickly exhibited as in LL or ML plants. This lag in response shows that previous condition, such as larger shoot surface area and rhizomal stores, will slow the effect of light limitation on morphological responses. However, shoot growth, alpha, Ek, and ETRmax are rapidly effected by light limitation. Environmental monitoring of light levels within Z. marina meadows could allow managers to foresee potential risks if light is being attenuated to this level for prolonged periods of time. Using the robust bioindicators identified in this study specifically relevant to Z. marina can make it possible to assess whether light limitation has or is occurring. This study shows that light reduction to 20 μmol photons m−2s−1 or below for 10 h daily light period causes significant reductions in above ground tissues and photosynthetic performance leading to shoot mortality within 4–6 weeks, under experimental conditions. These results show what the impacts of a light stress event to this level over the time-frame of a few weeks can have on Z. marina and its implications at a meadow scale.
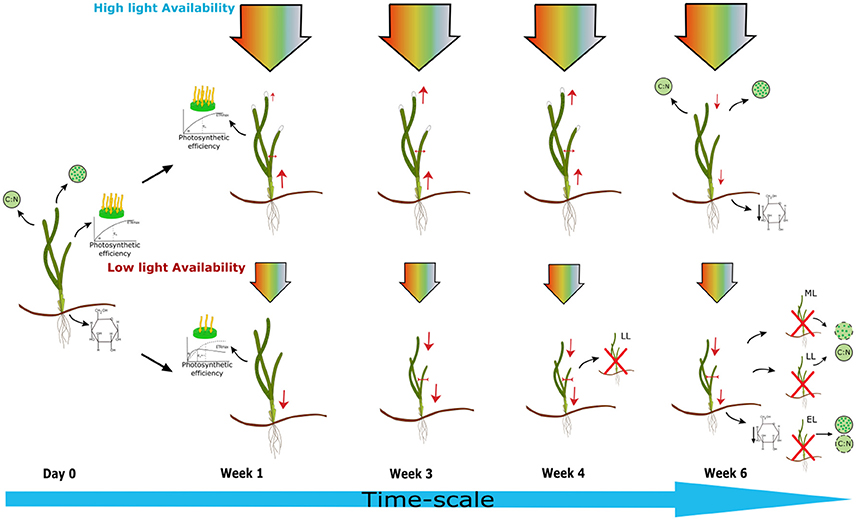
Figure 5. Schematic diagram showing effects of light limitation on Zostera marina plants over time under experimental conditions. High light treatment (HL) = 5.61 mol photons m−2day−1, light limiting treatment < 0.73 mol photons m−2day−1 (ML = medium light 0.73, LL = low light 0.35, EL = extreme low light treatments 0.14 mol photons m−2day−1). Within the first week photosynthetic efficiency was affected in shaded plants shown by the increase in α, a decrease in ETRmax and Ek, along with significantly reduced shoot growth. By week 3 leaf length was reduced in all shaded plants and leaf width reduced in ML plants. By week 4 leaf width and shoot surface area were significantly reduced in all shaded plants with the death of a LL plant. By week six, HL plants also showed decreases in leaf length, shoot growth, and shoot surface area. Water soluble carbohydrate content of rhizomes was reduced in all plants at the end of the experiment. A decrease in chlorophyll content was exhibited in LL and ML plants. There was no significant change in C:N of leaf tissue recorded for any of the plants in comparison to samples taken from site location, although EL plants had the lowest ratio. Evidence of shoot mortality was found in all shade treated plants at the end of the experiment.
CB carried out the experiment and data collection. CB was responsible for the write-up of introduction, methods, results and discussion. RU supervised and advised CB on experimental design and write-up. RU edited and added text to manuscript throughout.
The authors declare that the research was conducted in the absence of any commercial or financial relationships that could be construed as a potential conflict of interest.
I would like to thank Max Robinson for help with sample and data collection, and advice with writing R scripts; Mike Fowler for R tuition, and statistical advice; Prof Rory Wilson for supervision and support. Many thanks to Stuart Gibb and Jason McIlvenny from the University of Highlands and Islands; Richard Webster, Pippa Moore, and Nathan King from Aberystwyth for the kind loan of the Diving-PAM fluorometers for experimental trials, and Naomi Ginnever for advice on PAM fluorometry. In addition, many thanks to Skomer MNR team for allowing collection of samples to trial methods, and to Natural England and Marine Management Organisation for consenting to the collection of samples from Helford River for scientific research. This study was supported and made possible by the EU ERDF funded SEACAMS project. Also thanks to the reviewers who helped improve the article.
Abe, M., Hahimoto, N., Kurashima, A., and Maegwa, M. (2003). Estimation of light requirement for the growth of Zostera marina in central Japan. Fish. Sci. 69, 890–895. doi: 10.1046/j.1444-2906.2003.00704.x
Alcoverro, T., Zimmerman, R. C., Kohrs, D. G., and Alberte, R. S. (1999). Resource allocation and sucrose mobilization in light-limited eelgrass Zostera marina. Mar. Ecol. Prog. Ser. 187, 121–131. doi: 10.3354/meps187121
Backman, T. W., and Barilotti, D. C. (1976). Irradiance reduction: effects on standing crops of the eelgrass Zostera marina in a coastal lagoon. Mar. Biol. 34, 33–40. doi: 10.1007/BF00390785
Bartlett, M. S. (1937). Properties of sufficiency and statistical tests. Proc. R. Soc. Lond. A. Math. Phys. Sci. 160, 268–282. doi: 10.1098/rspa.1937.0109
Beer, S., Bjork, M., and Beardall, J. (2014). Photosynthesis in the Marine Environment. Oxford: John Wiley & Sons, Ltd.
Beer, S., Bjork, M., Gademann, R., and Ralph, P. J. (2001). “Chlorophyll fluorescence as a measure of photosynthesis,” in Global Seagrass Research Methods, eds F. T. Short and R. G. Coles (Amsterdam: Elsevier), 190–198.
Belshe, E. F., Durako, M. J., and Blum, J. E. (2007). Photosynthetic rapid light curves (RLC) of Thalassia testudinum exhibit diurnal variation. J. Exp. Mar. Biol. Ecol. 342, 253–268. doi: 10.1016/j.jembe.2006.10.056
Belshe, E. F., Durako, M. J., and Blum, J. E. (2008). Diurnal light curves and landscape-scale variation in photosynthetic characteristics of Thalassia testudinum in Florida Bay. Aquat. Bot. 89, 16–22. doi: 10.1016/j.aquabot.2008.01.007
Biber, P. D., Kenworthy, W. J., and Paerl, H. W. (2009). Experimental analysis of the response and recovery of Zostera marina (L.) and Halodule wrightii (Ascher.) to repeated light-limitation stress. J. Exp. Mar. Biol. Ecol. 369, 110–117. doi: 10.1016/j.jembe.2008.10.031
Biber, P. D., Paerl, H. W., Gallegos, C. L., Kenworthy, W. J., and Fonseca, M. S. (2005). “Evaluating indicators of seagrass stress to light,” in Estuar. Indic., ed S. A. Bortone (Boca Raton, FL: CRC Press), 193–209. doi: 10.1201/9781420038187.ch13
Bité, J. S., Campbell, S. J., McKenzie, L. J., and Coles, R. G. (2007). Chlorophyll fluorescence measures of seagrasses Halophila ovalis and Zostera capricorni reveal differences in response to experimental shading. Mar. Biol. 152, 405–414. doi: 10.1007/s00227-007-0700-6
Bulthuis, D. A. (1983). Effects of in situ light reduction on density and growth of the seagrass Heterozostera tasmanica (Martens ex Aschers.) den Hartog in Western Port, Victoria, Australia. J. Exp. Mar. Biol. Ecol. 67, 91–103.
Burke, M. K., Dennison, W. C., and Moore, K. A. (1996). Non-structural carbohydrate reserves of eelgrass Zostera marina. Mar. Ecol. Prog. Ser. 137, 195-201. doi: 10.3354/meps137195
Cairns, A. J., and Pollock, C. J. (1988). Fructan biosynthesis in excised leaves of Lolium temulentum L. New Phytol. 109, 399–405. doi: 10.1111/j.1469-8137.1988.tb03715.x
Campbell, S. J., and Miller, C. J. (2002). Shoot and abundance characteristics of the seagrass Heterozostera tasmanica in Westernport estuary (south-eastern Australia). Aquat. Bot. 73, 33–46. doi: 10.1016/S0304-3770(02)00002-5
Collier, C. J., Adams, M. P., Langlois, L., Waycott, M., O'Brien, K. R., Maxwell, P. S., et al. (2016). Thresholds for morphological response to light reduction for four tropical seagrass species. Ecol. Indic. 67, 358–366. doi: 10.1016/j.ecolind.2016.02.050
Collier, C. J., Lavery, P., Masini, R., and Ralph, P. (2007). Morphological, growth and meadow characteristics of the seagrass Posidonia sinuosa along a depth-related gradient of light availability. Mar. Ecol. Prog. Ser. 337, 103–115. doi: 10.3354/meps337103
Collier, C. J., Lavery, P. S., Ralph, P. J., and Masini, R. J. (2008). Shade-induced response and recovery of the seagrass Posidonia sinuosa. J. Exp. Mar. Biol. Ecol. 370, 89–103. doi: 10.1016/j.jembe.2008.12.003
Collier, C. J., Waycott, M., and McKenzie, L. J. (2012a). Light thresholds derived from seagrass loss in the coastal zone of the northern Great Barrier Reef, Australia. Ecol. Indic. 23, 211–219. doi: 10.1016/j.ecolind.2012.04.005
Collier, C. J., Waycott, M., and Ospina, A. G. (2012b). Responses of four Indo-West Pacific seagrass species to shading. Mar. Pollut. Bull. 65, 342–354. doi: 10.1016/j.marpolbul.2011.06.017
Dalla Via, J., Sturmbauer, C., Schönweger, G., Sötz, E., Mathekowitsch, S., Stifter, M., et al. (1998). Light gradients and meadow structure in Posidonia oceanica: ecomorphological and functional correlates. Mar. Ecol. Prog. Ser. 163, 267–278.
Dawes, C. J., and Guiry, M. D. (1992). Proximate constituents in the seagrasses Zostera marina and Z. noltii in Ireland : seasonal changes and the effect of blade removal. Mar. Ecol. 13, 307–315.
Dennison, W. C. (1990). “Chlorophyll content,” in Seagrass Research Methods, eds R. C. Phillips and C. P. McRoy (Paris: United Nations Educational, Scientific and Cultural Organization (UNESCO)), 83–85.
Dennison, W. C., and Alberte, R. S. (1982). Photosynthetic responses of Zostera marina to in situ manipulations of light intensity. Oecologia 55, 137–144. doi: 10.1007/BF00384478
Dennison, W. C., and Alberte, R. S. (1985). Role of daily light period in the depth distribution of Zostera marina (eelgrass). Mar. Ecol. Prog. Ser. 25, 51–61. doi: 10.3354/meps025051
Dennison, W. C., Orth, R. J., Moore, K. A., Stevenson, J. C., Carter, V., Kollar, S., et al. (1993). Assessing water quality with submersed aquatic vegetation habitat requirements as barometers of Chesapeake Bay health. Bioscience 43, 86–94. doi: 10.2307/1311969
Drake, L. A., Dobbs, F. C., and Zimmerman, R. C. (2003). Effects of epiphyte load on optical properties and photosynthetic potential of the seagrasses Thalassia testudinum Banks ex König and Zostera marina L. Limnol. Oceanogr. 48, 456–463. doi: 10.4319/lo.2003.48.1_part_2.0456
Durako, M. J., and Kunzelman, J. I. (2002). Photosynthetic characteristics of Thalassia testudinum measured in situ by pulse-amplitude modulated (PAM) fluorometry: methodological and scale-based considerations. Aquat. Bot. 73, 173–185. doi: 10.1016/S0304-3770(02)00020-7
Eilers, P. H. C., and Peeters, J. C. H. (1988). A model for the relationship between light intensity and the rate of photosynthesis in phytoplankton. Ecol. Modell. 42, 199–215. doi: 10.1016/0304-3800(88)90057-9
Erftemeijer, P. L. A., and Lewis, R. R. R. (2006). Environmental impacts of dredging on seagrasses: a review. Mar. Pollut. Bull. 52, 1553–1572. doi: 10.1016/j.marpolbul.2006.09.006
Foden, J., and Brazier, D. P. (2007). Angiosperms (seagrass) within the EU water framework directive: a UK perspective. Mar. Pollut. Bull. 55, 181–195. doi: 10.1016/j.marpolbul.2006.08.021
Fourqurean, J. W., Moore, T. O., Fry, B., and Hollibaugh, J. T. (1997). Spatial and temporal variation in C:N:P ratios, δ15N and δ13C of eelgrass Zostera marina as indicators of ecosystem processes, Tomales Bay, California. Mar. Ecol. Prog. Ser. 157, 147–157. doi: 10.3354/meps157147
Fourqurean, J. W., and Zieman, J. C. (1991). Photosynthesis, respiration and whole plant carbon budget of the seagrass Thalassia testudinum. Mar. Ecol. Prog. Ser. 69, 161–170. doi: 10.3354/meps069161
Glass, G. V., Peckham, P. D., and Sanders, J. R. (1972). Consequences of failure to meet assumptions underlying the fixed effects analyses of variance and covariance. Rev. Educ. Res. 42, 237–288. doi: 10.3102/00346543042003237
Granger, S., and Izumi, H. (2001). “Water quality measurement methods for seagrass habitat,” in Global Seagrass Research Methods, eds F. T. Short and R. G. Coles (Amsterdam: Elsevier Science, B.V.), 393–404.
Hemminga, M. A. (1998). The root/rhizome system of seagrasses: an asset and a burden. J. Sea Res. 39, 183–196. doi: 10.1016/S1385-1101(98)00004-5
Jackson, E. L., Griffiths, C. A., and Durkin, O. (2013). A Guide to Assessing and Managing Anthropogenic Impact on Marine Angiosperm Habitat - Part 1: Literature Review. Natural England Commissioned Reports Number 111.
Jiang, Z., Huang, X., and Zhang, J. (2013). Effect of nitrate enrichment and salinity reduction on the seagrass Thalassia hemprichii previously grown in low light. J. Exp. Mar. Biol. Ecol. 443, 114–122. doi: 10.1016/j.jembe.2013.02.034
Jones, B. L., and Unsworth, R. K. F. (2016). The perilous state of seagrass in the British Isles. R. Soc. Open Sci. 3:150596. doi: 10.1098/rsos.150596
Kenworthy, W. J., and Fonseca, M. S. (1996). Light requirements of seagrasses Halodule wrightii and Syringodium filiforme derived from the relationship between diffuse light attenuation and maximum depth distribution. Estuaries 19, 740–750. doi: 10.2307/1352533
Koch, E. W., and Beer, S. (1996). Tides, light and the distribution of Zostera marina in Long Island Sound USA. Aquat. Bot. 53, 97–107. doi: 10.1016/0304-3770(95)01015-7
Krause-jensen, D., Greve, T. M., and Nielsen, K. (2005). Eelgrass as a bioindicator under the European Water Framework Directive. Water Resour. Manag. 19, 63–75. doi: 10.1007/s11269-005-0293-0
Lee, K.-S., Park, S. R., and Kim, Y. K. (2007). Effects of irradiance, temperature, and nutrients on growth dynamics of seagrasses: a review. J. Exp. Mar. Biol. Ecol. 350, 144–175. doi: 10.1016/j.jembe.2007.06.016
Lix, L. M., Keselman, J. C., and Keselman, H. J. (1996). Consequences of assumption violations revisited: a quantitative review of alternatives to the one-way analysis of variance F test. Rev. Educ. Res. 66, 579–619.
Longstaff, B., and Dennison, W. (1999). Seagrass survival during pulsed turbidity events: the effects of light deprivation on the seagrasses Halodule pinifolia and Halophila ovalis. Aquat. Bot. 65, 105–121. doi: 10.1016/S0304-3770(99)00035-2
Marbà, N., Krause-Jensen, D., Alcoverro, T., Birk, S., Pedersen, A., Neto, J. M., et al. (2013). Diversity of European seagrass indicators: patterns within and across regions. Hydrobiologia 704, 265–278. doi: 10.1007/s10750-012-1403-7
Maxwell, P. S., Ekl, J. S., Katwijk, M. M., and Van, B.rien, K.R.O. (2016). The fundamental role of ecological feedback mechanisms for the adaptive management of seagrass ecosystems – a review. Biol. Rev. 92, 1521–1538 doi: 10.1111/brv.12294
McDonald, J. H. (2014). Handbook of Biological Statistics, 3rd Edn. Baltimore, MD: Sparky House Publishing.
McMahon, K., Collier, C. J., and Lavery, P. S. (2013). Identifying robust bioindicators of light stress in seagrasses: a meta-analysis. Ecol. Indic. 30, 7–15. doi: 10.1016/j.ecolind.2013.01.030
Moore, K. A., Wetzel, R. L., and Orth, R. J. (1997). Seasonal pulses of turbidity and their relations to eelgrass (Zostera marina L.) survival in an estuary. J. Exp. Mar. Biol. Ecol. 215, 115–134. doi: 10.1016/S0022-0981(96)02774-8
Ochieng, C. A., Short, F. T., and Walker, D. I. (2010). Photosynthetic and morphological responses of eelgrass (Zostera marina L.) to a gradient of light conditions. J. Exp. Mar. Biol. Ecol. 382, 117–124. doi: 10.1016/j.jembe.2009.11.007
Olesen, B., Enríquez, S., Duarte, C. M., and Sand-Jensen, K. (2002). Depth-acclimation of photosynthesis, morphology and demography of Posidonia oceanica and Cymodocea nodosa in the Spanish Mediterranean Sea. Mar. Ecol. Prog. Ser. 236, 89–97. doi: 10.3354/meps236089
Olesen, B., and Sand-jensen, K. (1993). Seasonal acclimatization of eelgrass Zostera marina growth to light. Mar. Ecol. Prog. Ser. 94, 91–99. doi: 10.3354/meps094091
Orth, R. J., Carruthers, T. J. B., Dennison, W. C., Duarte, C. M., Fourqurean, J. W., Heck Jr, K. L., et al. (2006). A global crisis for seagrass ecosystems. Bioscience 56, 987–996. doi: 10.1641/0006-3568(2006)56[987:AGCFSE]2.0.CO;2
Ralph, P. J., Durako, M. J., Enríquez, S., Collier, C. J., and Doblin, M. A. (2007). Impact of light limitation on seagrasses. J. Exp. Mar. Biol. Ecol. 350, 176–193. doi: 10.1016/j.jembe.2007.06.017
Ralph, P. J., and Gademann, R. (2005). Rapid light curves: a powerful tool to assess photosynthetic activity. Aquat. Bot. 82, 222–237. doi: 10.1016/j.aquabot.2005.02.006
Saroussi, S., and Beer, S. (2007). Alpha and quantum yield of aquatic plants derived from PAM fluorometry: uses and misuses. Aquat. Bot. 86, 89–92. doi: 10.1016/j.aquabot.2006.09.003
Shafer, D. J. (1999). The effects of dock shading on the seagrass Halodule wrightii in Perdido Bay, Alabama. Estuaries 22, 936–943. doi: 10.2307/1353073
Shafer, D. J., and Kaldy, J. E. (2013). Comparison of photosynthetic characteristics of the seagrass congeners Zostera marina L. and Zostera japonica Ascher. & Graeb. Aquat. Bot. 112, 91–97. doi: 10.1016/j.aquabot.2013.09.002
Sharon, Y., Silva, J., Santos, R., Runcie, J., Chernihovsky, M., and Beer, S. (2009). Photosynthetic responses of Halophila stipulacea to a light gradient. II. Acclimations following transplantation. Aquat. Biol. 7, 153–157. doi: 10.3354/ab00148
Short, F., and Duarte, C. M. (2001). “Methods for the measurement of seagrass growth and production,” in Global Seagrass Research Methods, eds F. T. Short, and R. G. Coles (Amsterdam: Elsevier Science B.V.), 473.
Short, F. T., Burdick, D. M., and Kaldy, J. E. I. (1995). Mesocosm experiments quantify the effects of eutrophication on eelgrass, Zostera marina. Limnol. Oceanogr. 40, 740–749. doi: 10.4319/lo.1995.40.4.0740
Short, F. T., and Wyllie-Echeverria, S. (1996). Natural and human-induced disturbance of seagrasses. Environ. Conserv. 23:17. doi: 10.1017/S0376892900038212
Silva, J., Barrote, I., Costa, M. M., Albano, S., and Santos, R. (2013). Physiological responses of Zostera marina and Cymodocea nodosa to light-limitation stress. PLoS ONE 8:e81058. doi: 10.1371/journal.pone.0081058
Soissons, L. M., Li, B., Han, Q., van Katwijk, M. M., Ysebaert, T., Herman, P. M. J., et al. (2016). Understanding seagrass resilience in temperate systems: the importance of timing of the disturbance. Ecol. Indic. 66, 190–198. doi: 10.1016/j.ecolind.2016.01.030
Thom, R. M., Southard, S. L., Borde, A. B., and Stoltz, P. (2008). Light requirements for growth and survival of eelgrass (Zostera marina L.) in Pacific northwest (USA) estuaries. Estuaries and Coasts 31, 969–980. doi: 10.1007/s12237-008-9082-3
Underwood, A. J. (1997). Experiments in Ecology: Their Logical Design and Interpretation Using Analysis of Variance. Stony Brook, NY: Cambridge University Press.
Unsworth, R. K. F., Collier, C. J., Waycott, M., Mckenzie, L. J., and Cullen-unsworth, L. C. (2015). A framework for the resilience of seagrass ecosystems. Mar. Pollut. Bull. 100, 34–46. doi: 10.1016/j.marpolbul.2015.08.016
van der Heide, T., van Nes, E. H., Geerling, G. W., Smolders, A. J. P., Bouma, T. J., and van Katwijk, M. M. (2007). Positive feedbacks in seagrass ecosystems: implications for success in conservation and restoration. Ecosystems (N. Y.). 10, 1311–1322. doi: 10.1007/s10021-007-9099-7
van der Heide, T., van Nes, E. H., van Katwijk, M. M., Olff, H., and Smolders, A. J. P. (2011). Positive feedbacks in seagrass ecosystems - evidence from large-scale empirical data. PLoS ONE 6:e16504. doi: 10.1371/journal.pone.0016504
Yaakub, S. M., Chen, E., Bouma, T. J., Erftemeijer, P. L. A., and Todd, P. A. (2013). Chronic light reduction reduces overall resilience to additional shading stress in the seagrass Halophila ovalis. Mar. Pollut. Bull. 83, 467–474. doi: 10.1016/j.marpolbul.2013.11.030.
Zimmerman, R. C., Kohrs, D. G., and Alberte, R. S. (1996). Top-down impact through a bottom-up mechanism: the effect of limpet grazing on growth, productivity and carbon allocation of Zostera marina L. (eelgrass). Oecologia 107, 560–567. doi: 10.1007/BF00333949
Keywords: bioindicator, light, shading, seagrass, morphology, fluorometry
Citation: Bertelli CM and Unsworth RKF (2018) Light Stress Responses by the Eelgrass, Zostera marina (L). Front. Environ. Sci. 6:39. doi: 10.3389/fenvs.2018.00039
Received: 23 March 2018; Accepted: 14 May 2018;
Published: 06 June 2018.
Edited by:
Sylvie Gobert, University of Liège, BelgiumReviewed by:
Marcelo Bertellotti, Centro Para el Estudio de Sistemas Marinos (CONICET), ArgentinaCopyright © 2018 Bertelli and Unsworth. This is an open-access article distributed under the terms of the Creative Commons Attribution License (CC BY). The use, distribution or reproduction in other forums is permitted, provided the original author(s) and the copyright owner are credited and that the original publication in this journal is cited, in accordance with accepted academic practice. No use, distribution or reproduction is permitted which does not comply with these terms.
*Correspondence: Chiara M. Bertelli, Yy5tLmJlcnRlbGxpQHN3YW5zZWEuYWMudWs=
Disclaimer: All claims expressed in this article are solely those of the authors and do not necessarily represent those of their affiliated organizations, or those of the publisher, the editors and the reviewers. Any product that may be evaluated in this article or claim that may be made by its manufacturer is not guaranteed or endorsed by the publisher.
Research integrity at Frontiers
Learn more about the work of our research integrity team to safeguard the quality of each article we publish.