 Achenyo Peace Abbah
 Shanshan Xu1,†
95% of researchers rate our articles as excellent or good
Learn more about the work of our research integrity team to safeguard the quality of each article we publish.
Find out more
SYSTEMATIC REVIEW article
Front. Environ. Health , 09 May 2024
Sec. Air Quality and Health
Volume 3 - 2024 | https://doi.org/10.3389/fenvh.2024.1352786
This article is part of the Research Topic Air Pollution Levels, Health Effects and Interventions View all 4 articles
Background: Few studies have investigated the association between long-term exposure to outdoor air pollution and the risk of asthma and respiratory symptoms in low-and middle-income countries (LMICs).
Objective: To systematically evaluate the epidemiological evidence regarding the associations between long-term exposure to outdoor air pollution and respiratory symptoms in LMICs.
Methods: We searched for literature published between January 1946 and September 2022 in Embase (Ovid), Medline (Ovid), and Web of Science (Core Collection). The air and gaseous pollutants studied included particulate matter (PM2.5 and PM10), nitrogen dioxide (NO2), and black carbon (BC), and exposure was 1-year duration or more. We conducted a systematic review and meta-analysis with a random-effects model to calculate the relative risk (RR) estimates. A rerun of the databases was conducted in November 2023 with no eligible studies found.
Results: Of the 1,346 studies identified, only six met our inclusion criteria, and these six reported PM2.5, PM10, and NO2 with asthma as the main outcome. Three of these included studies were further included in the meta-analysis because they had data on the same exposure and outcome (PM2.5 and asthma). The main result of our study showed a borderline significant association between a 10 µg/m3 increase in exposure to PM2.5 and an increased risk of asthma (RR 1.21, 95% CI 0.93, 1.50). There was evidence of considerable heterogeneity (I2 = 75.87%). The regression-based Egger test for small-study effects showed no significant publication bias among these three studies.
Conclusion: Our results indicate that long-term exposure to PM2.5 increases the risk of asthma in LMICs, but studies are scarce and there is a large need for more research in LMICs in this field.
Systematic Review Registration: https://journals.plos.org/plosone/article?id=10.1371/journal.pone.0288667, PROSPERO (CRD42022311326).
Due to rapid industrialization, urbanization, population growth, and changes in the rates of non-communicable diseases, outdoor air pollution has become a substantial environmental exposure for populations in low- and middle-income countries (LMICs) (1–3). Outdoor air pollution poses major global health and environmental challenges, with the situation being more severe in LMICs (1, 4), it has been linked to an increased risk of mortality resulting from lung cancer, chronic obstructive pulmonary disease (COPD), lower respiratory infections, and cardiovascular diseases (5, 6). Air pollution is emitted from both natural sources (dust, pollen, mold spores) and anthropogenic activities (man-made activities such as industrial processes, construction work, combustion of fossil fuel, cigarette smoking, biomass burning for heating or cooking purposes and for the clearing of lands, and road traffic) (5, 7, 8).
The World Health Organization (WHO) reports that the vast majority of the world's population currently lives in areas where air pollution levels surpass WHO air quality guidelines primarily due to emissions from anthropogenic activities (9). Despite significant improvements in air quality in high-income countries (HICs) since the 1970s, the adverse health effects of air pollution continue, posing a greater threat in LMICs due to higher levels of pollution (10). In Sub-Saharan Africa, and Central and Southern Asia, populations continue to experience exposure to high levels of air pollution (11). Meanwhile, the lack of sufficient data on the magnitude of the health impacts of outdoor air pollution in most parts of the African continent has led to very few studies being published (12, 13).
There is increasing evidence about the harmful health effects of high levels of long-term air pollution exposure. New findings from cohort studies have reported that long-term air pollution exposure could cause new asthma development in addition to asthma exacerbations and could cause a delay in lung development. Asthma is a chronic respiratory disease that affects people of all ages around the world (14). It is characterized by airway hyperresponsiveness, chronic airway inflammation, and airway obstruction causing symptoms such as wheezing, dyspnoea, cough, chest tightness, and shortness of breath (15–17). Even though asthma is mostly common in developed countries, it is becoming more prevalent in developing countries probably due to rapid urbanization (18). Approximately, 334 million people presently have asthma globallyThe prevalence of asthma continues to rise with an overall estimated prevalence to increase by 100 million by 2025 (19) (18, 19). Phase I of the Global Asthma Network (GAN) evaluated the global prevalence of present asthma symptoms in children, adolescents, and adults to be 9.1%, 11.0%, and 6.6%, respectively The 2019 GBD study predicted 21.6 million disability-adjusted years (DALYs) ascribed to asthma across all ages worldwide. Among the dominant causes of the burden of disease, asthma was rated 34th, which was responsible for a 5th out of the total DALYs from chronic respiratory diseases.
Despite the substantial problem of air pollution and asthma morbidity are major problems in LMICs, there is a notable lack of systematic overviews addressing these concerns in these regions. Such overviews can be important tools in improving public health by serving as a base for informed policymaking, arousing public health authorities and institutions to invest in more effective measures to cause a decline in exposure to air pollutants, and pinpointing out knowledge gaps where more original research studies are needed. A recent systematic review on this particular topic exists on children in LMICs (20), but no such review has been conducted focusing on adults. Thus, the main aim of this systematic review was to investigate the association between the long-term health effects of outdoor air pollution and asthma and respiratory symptoms among adults in LMICs.
This systematic review and meta-analysis was conducted according to the PRISMA 2020 (Preferred Reporting Items for Systematic Reviews and Meta-Analyses) checklist (21). The completed PRISMA checklist can be found in (Supplementary Appendix S1). The study protocol was registered in advance in the International Prospective Register of Systematic Reviews (PROSPERO- CRD42022311326), and the published protocol in https://doi.org/10.1371/journal.pone.0288667 (Supplementary Appendix S2). We used the World Bank's classification of the low-and middle-income countries (22).
The search strategy was developed in collaboration with a librarian at the medical faculty, at the University of Bergen. The search terms and search strategy for all databases, the interface through which the database was searched, and the date range for our search are outlined in S3 of the appendix of the supplementary material. We searched systematically in Embase (Ovid), Medline (Ovid), and Web of Science (Core Collection) from January 1946 up to September 2022. We updated the search strategies in November 2023, but no eligible studies were found.
Types of participants/population, study period, and study setting: Studies on human adult populations. exposed to outdoor air or gaseous pollutants in low- and middle-income countries (LMICs- as defined by the World Bank Classification).
Exposure: Studies that reported on exposure to either of the following outdoor air or gaseous pollutants: particulate matter <2.5 µm in aerodynamic diameter (PM2.5), <10 µm in aerodynamic diameter (PM10), nitrogen dioxide (NO2), and black carbon (BC).
Comparison: Cohort studies that reported on the exposure to relatively lower levels of air or gaseous pollutants in the same population.
Outcomes: Asthma, wheezing, cough, and dyspnea.
Study designs: Cohort studies, and cross-sectional studies with exposure measurements >1 year in duration, and with the following effect estimates: odds ratio (OR), relative risk (RR), and hazard ratio (HR).
Exclusion criteria: We excluded studies that were not published in English, studies conducted on children, qualitative studies, and studies that were not original research papers.
All identified studies were exported to EndNote 20 from the three databases (Embase, Medline and Web of Science) and duplicates were removed first in EndNote 20 and then in Rayyan, a web-based research collaboration platform that was used for screening (23). Reviewers AA and SX independently screened titles and abstracts of all records retrieved from the database searches according to the inclusion criteria described above, after which the full texts of possible eligible studies were obtained. AA and SX proceeded to screen all the included full-text studies. Disagreements on which studies to include for full-text screening were resolved by AJ in dialogue with AA and SX.
AA and SX independently extracted data from the included studies using a standardized pre-piloted data extraction form in an Excel sheet. The form was adapted from The Cochrane Collaboration (24) and modified to suit the data extraction of the included studies of this review. Extracted data included year of publication, study locations, study designs, duration of follow-up, pollutants studied, outcomes reported, and effect estimates.
The quality of the included studies was independently scored by two reviewers (AA and SX) and any disagreement was resolved by AJ. Quality was assessed using the Risk of Bias In Non-randomized Studies-of Exposure (ROBINS-E) tool developed by the ROBINS-E Development Group led by Higgins and co-workers (25), but we adopted the format of the ROBINS-E form by Park and co-workers from their supplementary data (26). The ROBINS-E tool includes seven domains of bias: confounding, exposure classification, participant selection, departure from intended exposure, missing data, and outcome measurement. By using a list of signalling questions, each domain is addressed to gather important information on the study and the analysis is evaluated (25). Furthermore, three judgments are made after the important signaling questions have been answered, then, an overall judgment is carried out for each of these considerations (25).
We performed a narrative synthesis of the studies that met our inclusion criteria where a meta-analysis was performed because two or more studies were identified for the same pollutant and the same health outcome. In view of the anticipated variations in both population sizes and pollutants, we a priori resolved to pool estimates using DerSimonian and Laird random-effect meta-analysis (27).
In the case when a study reported OR estimates for an increment different than per 10 μg/m3 (28), we converted the estimate to per 10 µg/m3 by calculating slope (Beta) and standard error (SE) per 1 µg/m3, multiplied by 10 and then exponentiated. We adopted the standard equations below from Chen et al. (29).
Beta = LN (RRo) /increment
SE = (LN(RRo_high) ‒‒ LN (RRo_low))/(2 × 1.96 × increment)
RRc = EXP (Beta × 10)
RRc_low = EXP (Beta × 10 ‒‒ 1.96 × SE × 10)
RRc_high = EXP (Beta × 10 + 1.96 × SE × 10)
RRc is the estimate we converted to, and RRo is the effect estimate originally reported in the paper with its low (RRo_low) and high (RRo_high) end of the confidence interval (CI).
Statistical investigation of heterogeneity of effect estimates between studies were evaluated using tau2, shown in the form of an 80% prediction interval around the mean effect (30), Q-test (chi2), and I2 index. If the P values were below 0.10 in the Q-test and/or the I2 index was higher than 75%, then the pooled analysis was considered significantly heterogeneous (26). To estimate the possible publication bias, we conducted Egger's weighted linear regression (31). All statistical tests and plots were done on STATA version 17.0 statistical software.
In the three studies included in the meta-analysis, one reported relative risk RR) and two reported odds ratios (OR). We initially wanted to streamline the effect estimates by converting the RR to OR, However, such conversion was not possible because the exposure variable was a continuous variable, and we could not identify formulas for the conversion of confidence intervals for estimates based on continuous exposure variables. Hence, we adopted the recommendations (32–34) that OR and RR can be interpreted interchangeably for rare outcomes when the prevalence of OR is less than 10%. We included both OR and RR in the meta-analysis and interpreted the OR as RR.
For each pollutant exposure and outcome, the certainty of evidence (CoE) was evaluated using the Grading of Recommendations Assessment, Development, and Evaluation (GRADE) approach developed by a group of experts convened by the WHO (35–37). The GRADE domains consist of five domain downgrade reasons: limitations in studies, indirectness, inconsistency, imprecision, and publication bias, and three domains of upgrade reasons: large effect size, confounding domain, and concentration-response gradient domain. In a nutshell, we began the rating steps with moderate certainty of evidence due to the risk of unmeasured confounding in observational studies. Thereafter, we downgraded or upgraded the CoE according to the five (downgraded domains reasons) and the three (upgraded domains reasons) respectively.
Our detailed literature search across Embase, Medline, and Web of Science identified 1,346 studies as shown in (Figure 1), and these studies were published between January 1946 and September 2022 with a rerun of these databases on November 20, 2023. Following the removal of duplicates from the records exported to Rayyan software from EndNote, 16 records were further removed as duplicates in Rayyan, after which we screened the titles and abstracts of 738 studies. 721 studies were excluded because of the following reasons: excluded population (n = 305), excluded study design (n = 152), excluded outcome (n = 97), excluded exposure (n = 50), not related to the topic of interest (n = 33), excluded publication type (n = 20), indoor exposure (n = 23), occupational exposure (n = 14), studies not in LMICs (n = 12), short-term study (n = 13), animal studies (n = 2). Only 17 studies were eligible for an in-depth full-text screening. However, just 6 of these studies (28, 38–42) met our inclusion criteria while 11 studies were excluded. Of these 11, 5 studies did not report on the outcome of interest, 3 studies did not report on any of the pollutants of interest, 2 studies had the wrong study design and 1 study reported on short-term exposure. Of the 6 included studies, 3 studies were included in the meta-analysis, while 3 studies did not provide estimates suitable for our meta-analysis and were included only in the descriptive part of this review.
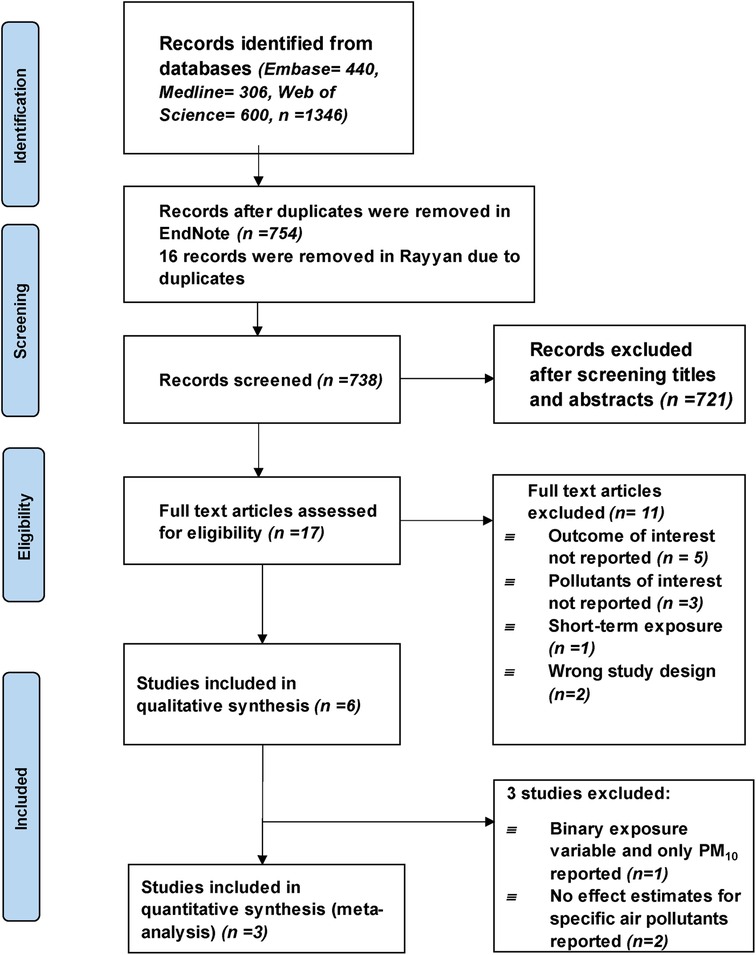
Figure 1. PRISMA flowchart of the study identification and selection process.
Of the six included studies, one study considered participants 15 years old and above as adults (41). We could not find a plausible explanation as to why they considered 15 years old as adults. We found the study useful because it assessed the exposure and outcome of interest for our study. It is important to note that definitions of adulthood can vary across studies and contexts. For the other five studies, the study participants were ≥18 years old. The outcomes reported were wheezing (n = 2), cough (n = 3), dyspnoea (n = 2), and asthma (n = 3). Studies were carried out in six different LMICs. Three studies were carried out in India, one in Northern China, one in South Africa, and one was a multi-country study including participants from India, South Africa, China, Russia, Ghana, and Mexico. These studies were published between 2001 and 2022, and the duration of studies ranged from one year to ten years. The sample size of participants ranged from 572 to 39,054. The study designs used were 1 cohort study, and 5 cross-sectional studies where pollution exposures had been measured retrospectively. A general description of each included study is shown in Table 1.
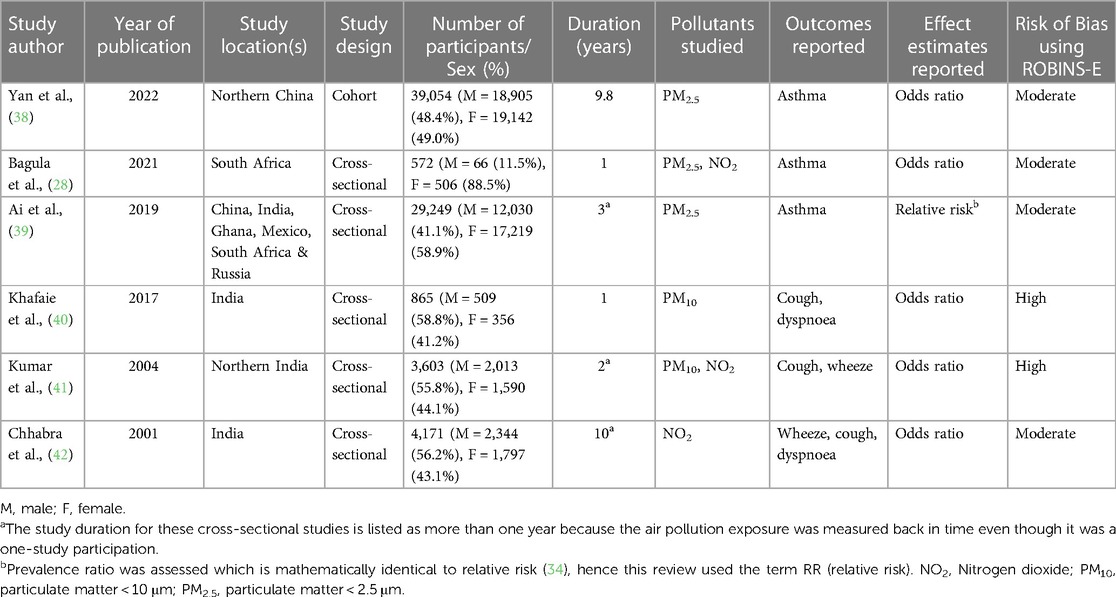
Table 1. Characteristics of the included studies.
Yan et al. (38), reported both hazard ratio (HR) and odds ratio (OR) as their effect estimates. The pooled HR was the main effect estimate reported in their article while the pooled OR was reported as part of the supplementary data. To be able to include this study in our meta-analysis, we chose the pooled OR.
Our inclusion criteria focused on studies that used OR, and RR as effect estimates to be included in our study. Hence, the study by Ai and colleagues (39) used prevalence ratio (PR) as their effect estimate to assess the association between PM2.5 and asthma (our exposure and outcome of interest). So, we searched for literature to find out if PR and RR can be used interchangeably and the study by Martinez et al. (34), confirmed that PR is mathematically identical to RR (Legenda of Table 1).
Our review found only two studies from the African continent by Bagula et al. (28), and Ai et al. (39), that reported on the exposure to PM2.5 and NO2 in South Africa and PM2.5 in Ghana and South Africa respectively. Of the six included studies, 3 assessed PM2.5 exposure, 3 assessed PM10 exposure, and 3 assessed NO2.
From the most recently included paper in our included study by Yan et al. (38), it was observed that after adjusting for cities (Model 4 as described in Table 2), there was no significant association between PM2.5 and asthma. These differences in the results between Model 4 and the other models can be attributed to the diverse economic and medical conditions that can be seen in the four different cities (Rizhao, Shenyang, Taiyuan, and Tianjin), but they can also be due to different pollution levels in the different cities. From the study by Yan et al., we included OR without adjusting for cities in the meta-analysis. This information was retrieved from “Supplementary Table S8 of the Supplementary materials” of the study conducted by Yan et al. (38), and can be found as Table 2. It showed a significant association between 10 µg/m3 increase of PM2.5 and asthma.In the study by Yan et al. (38), high-resolution PM2.5 concentration estimates of 1 km × 1 km were used because it provided more accurate exposure gradients within population clusters. Moreover, this was a large cohort study in Northern China with an almost 10-year follow-up to define the concentration-response (C-R) curves between prolonged outdoor exposure to PM2.5 and the onset of chronic respiratory diseases. It is also the first of its kind to consider passive smoking status as an adjustment variable because second-hand smoke is a significant risk factor for respiratory diseases in non-smokers. Another important strength of this study was that the authors carried out bi-pollutant models such as PM2.5-NO2 and PM2.5-SO2 to assess the impacts of multi-pollutant exposure on chronic respiratory outcomes. On the other hand, recall bias for specific self-reported contents such as lifestyle factors was experienced due to the retrospective cohort study design. The study also lacked time-scale data on lifestyles such as smoking and drinking status, hence they were not analyzed as time-varying covariates. Furthermore, this study lacked data on the composition of PM2.5, so, the authors were not able to conduct associated analyses (38).
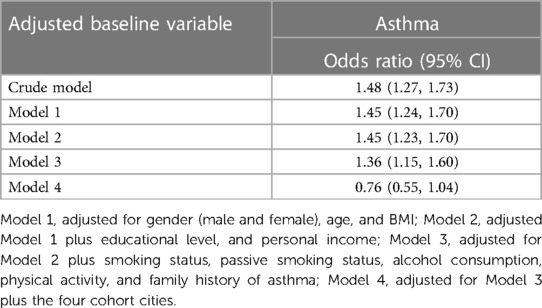
Table 2. Adjusted OR (95% CI for the incidence of asthma about each 10 µg/m3 increase in PM2.5) in the study by Yan et al. (38).
In the cross-sectional study carried out among adults from four informal settlements in the Western Cape province of South Africa by Bagula et al. (28), participants from Khayelitsha had the highest proportion of wheezing (13.4%), shortness of breath (10.5%), and chest tightness (12.2%) in the last 12 months. For shortness of breath after exercise, Masiphumelele (Noordhoek) had the highest proportion with 25.9%, while Oudtshoorn had the highest proportion of participants bringing up phlegm from the chest during winter with 12.2%. A major strength of this study was the use of Land-Use Regression models which was the first to be used in Africa to evaluate annual exposure to outdoor air pollution and to assess its link with cardiorespiratory outcomes. Thus, these models were used to assess each participant's annual concentration of exposure to NO2 and PM2.5 at their present residential address during the study duration. However, some limitations were encountered in this study which include self-reported outcomes which could have led to both recall and reporting biases and potentially may have introduced outcome misclassification. This does not make the results stronger but weaker. Also, the generalizability of their findings may not be possible either to the men or the general population because most of the participants (about 88.5%) were women (28).
The study by Ai et al. (39), showed that men and smokers had a higher risk of asthma than women and non-smokers, respectively. Almost 12% of the asthma cases in men were attributable to PM2.5. One significant strength of this study was the estimation of attributable burden which pointed out the exceptional public health importance that would be accomplished if relevant interventions are put in place to reduce the exposure to air pollution. However, some weaknesses were also identified. This study employed a cross-sectional study design which was not able to determine the causal relationship between PM2.5 and asthma. The authors could not control for potential confounders because of a lack of information on the residential changes of the participants which may also have an impact on the exposure assessment. If a person lived somewhere with high pollution exposure at the time of the exposure measurement and then moved to a place with low pollution exposure, he would have a lower pollution exposure on average than what was registered in the study. The opposite could also happen for some participants. This could lead to underestimation and overestimation of the effects, respectively.
Khafaie et al. (40), conducted the first study among diabetic and non-diabetic participants in India that investigated the long-term effect of background concentration of air pollution on respiratory health. The findings from this study showed that living in a region with high air pollution concentration is linked with chronic respiratory problems. This study has followed quality-controlled standard protocols. Nonetheless, a major weakness in this study was the presence of residual confounding even though the authors adjusted for known and possible confounders.
The study by Kumar et al. (41), was one of the few studies carried out in a developing country to use an ecological method to conduct a comparison between the respiratory health status of residents of an industrial town with a high level of air pollution and residents of a town with lower air pollution. A major strength of this study was a very high participation rate (90%), and data was collected from each town at the same time and from the same field investigators. Also, calibration of the instruments was regularly done against a standard. However, the possibility to carry out individual air sampling and to quantify the effect of various levels of air pollutants was not available, instead every person living in the same study region was defined with the same level of air pollution exposure (41).
Findings from Chhabra et al. (42), indicated a significantly higher ratio of symptomatic persons in the higher age groups both in the lower-and higher-pollution zones. Also, a highly significant linear relationship exists between increasing age and the occurrence of symptoms. It was further shown that increasing age, smoking, male sex, and lower socioeconomic status were strong independent risk factors for the occurrence of chronic respiratory symptoms, cough, and dyspnoea. However, wheezing showed no consistent pattern concerning its association with air pollution.
In our analysis, we included six studies that met our criteria, focusing on the association between exposure to PM2.5 and the outcome of asthma and respiratory symptoms. However, due to similarities in exposure and outcome measurements, we conducted a meta-analysis specifically on only three of these studies. These three studies reported similar exposure levels of PM2.5 and asthma outcomes, with effect estimates in the form of odds ratios (OR) or comparable relative risk (RR) (29, 39, 40). Upon conducting the meta-analysis, we found that all effect estimates from the included studies were greater than 1, indicating a positive association between PM2.5 exposure and the risk of asthma. However, it is noteworthy that the smallest study among the three had a wide confidence interval, indicating uncertainty in the precision of its effect estimate (29). The pooled overall estimate was borderline significant with RR 1.21 (95% CI 0.93, 1.50) (Supplementary Fig. S1) suggesting a potential association between PM2.5 exposure and the risk of asthma, but the confidence interval included 1, indicating uncertainty.
An important aim of a meta-analysis is to evaluate the existence of heterogeneity among primary studies and scrutinize the variance in the findings of the different studies. The degree of dissimilarity in the individual study findings is meta-analysis heterogeneity (43). We used the I2 value to test for heterogeneity which quantifies the effect of heterogeneity and is not dependent on the number of studies or the type of outcome data. The I2 values vary between 0% and 100% and show the proportion of inter-study variability that can be attributed to heterogeneity rather than chance (43). I2 value of 25% is considered as low, 50% is moderate while 75% is high (29). This implies that if the I2 index was above 75%, then the pooled analysis will be regarded to be significantly heterogeneous (44). Our meta-analysis revealed considerable heterogeneity among the included studies (I2 = 75.87%). This indicated substantial variability in effect sizes across the studies beyond what would be expected by chance alone.
To assess for publication bias, we conducted a regression-based Egger test for small-study effects. Typically, a p-value less than 0.05 is considered statistically significant, suggesting the presence of publication bias (45). The results of this test showed no significant evidence of publication bias among the three studies included in the meta-analysis (P-value 0.1021).
According to our risk of bias assessment, most of the included studies (28, 38, 39, 41, 42) were moderate while two studies (40, 41) were rated high (Supplementary Fig. S2).
Table 3 describes the application of the GRADE tool to the body of evidence for PM2.5 and asthma and the rationale for the rating of the various GRADE domains. We concluded a downgrade with one level for both inconsistency and imprecision because there was considerable heterogeneity (I2 = 75.87%) and the sample size was met but the confidence intervals were wide and included 1. On the other hand, an upgrade with one level was concluded for the concentration-response gradient because two studies reported a plausible shape of the concentration-response gradient. In sum, we rated the overall GRADE assessment for our included studies to be low.
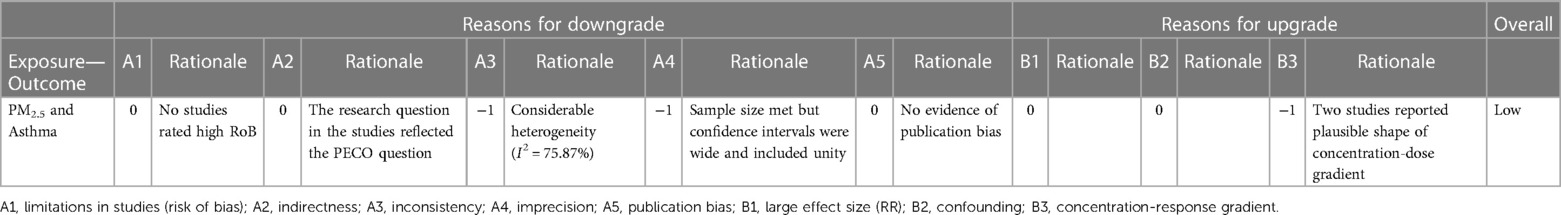
Table 3. Detailed assessment of certainty of evidence for exposure-outcome.
The harmful health effects of air pollution exposure still linger with a greater health threat in LMICs because of higher levels of pollution (10). Our meta-analysis has quantitatively investigated the association between long-term exposure to outdoor air pollution (PM2.5) and asthma in adults. To our knowledge, this is the first meta-analysis looking at pollution and asthma in adults in the LMICs. Studies that were not included in the meta-analysis but were included in the narrative part of this review further indicated a significant impact of PM10 on the development of respiratory symptoms such as cough and dyspnoea.
Three studies (28, 41, 42) included in this review provided data on NO2, with results indicating no significant association between NO2 exposure and respiratory symptoms. Despite these results, it is essential to note that thethree studies did not collectively establish a consensus regarding the impact of NO2 on respiratory health outcomes. Several factors could have contributed to the variability in findings, including differences in study populations, methodologies, exposure assessment techniques, and outcome measures. Moreover, the lack of a significant association in these particular studies does not necessarily negate the potential respiratory health effects of NO2 exposure. Studies from other parts of the world have repeatedly shown how NO2 may be an important risk factor in respiratory health (46–48). The studies included in our review may have been underpowered to detect associations, or there may be other unmeasured confounding factors influencing the results. Although this present review included only six studies and conducted a meta-analysis on only three of these, we found that certain factors contribute greatly to vulnerability to the adverse effects of air pollution. Geography, economic conditions, sex, and age were all of importance. Geography can play a direct part in different areas having different levels of air pollution exposure. For example, Bagula et al. (28), found that participants from Khayelitsha had a higher proportion of asthma and respiratory outcomes than participants from the other locations in the study, possibly because they were also exposed to the highest levels of NO2 and PM2.5 as indicated by the annual mean concentrations. However, geography can also affect the vulnerability to adverse health effects of air pollution, regardless of the air pollution levels. The same levels of PM exposure may have different health effects in urban and rural areas because the components of PM vary in different locations (49). Another example is that warmer geographic areas have more pollen than colder areas, and pollen may interact with other outdoor air pollution causing increased vulnerability to pollution health effects in a population (50). Economic conditions are also of relevance. The associations between air pollution and asthma in poorer cities or neighbourhoods are stronger than in wealthier areas (51, 52). The findings by Ai et al. (39), in addition showed that sex is another factor. It was shown that males had a higher risk of asthma due to exposure to PM2.5 (RR 1.09, 95% CI 1.04, 1.14) than females (RR 1.01, 95% CI 0.97, 1.06). This is also consistent with the previous studies of Alhanti et al. (53). An underlying reason for this higher association among the males might be that men are more prone to engage in outdoor activities than women, hence causing exposure to higher levels of pollution and then inducing the likelihood of asthma occurrence. In a cohort study from Northern China conducted by Yan et al. (38), one of the included studies in this review, it was noted that participants older than 60 years had more asthma due to exposure to outdoor PM2.5 air pollution than the younger participants. The reason for higher potential vulnerability to air pollution effects in younger people may be linked to younger people staying more outdoors.
The updated WHO 2021 guidelines recommend annual average concentrations of 5 µg/m3, 15 µg/m3, and 10 µg/m3 for PM2.5, PM10 and NO2, respectively (54). In all our six included studies, the WHO recommended guidelines on the annual mean concentrations were heavily exceeded. These findings are in agreement with the report from the development aid (55) that South and East Asian cities emerge as the most polluted cities globally.
The main result of our study showed a borderline significant association between a 10 µg/m3 increase in exposure to PM2.5 and an increased risk of asthma (RR 1.21, 95% CI 0.96, 1.50). However, we observed a considerable heterogeneity between studies (I2 = 75.87%). This is to be expected given the differences in methodology, exposure information source, concentration, geographical location, and duration as shown in Table 1 and Supplementary Table S1. These factors aforementioned are also emphasized in the systematic reviews and meta-analyses conducted by Chen et al., (29) Park et al. (26), Badida et al. (56), and Rajak et al. (57). In addition, the composition of PM and study population characteristics are also likely to differ between studies, causing increased heterogeneity. The composition of PM2.5 across studies will vary in different locations due to different industries and sources of emissions.
We applied an adapted GRADE approach to evaluate certainty in the epidemiological body of evidence. Overall, PM2.5 showed a more consistent association with asthma and respiratory symptoms than PM10. A reasonable explanation for this difference might be because there are fewer studies of PM10 relative to PM2.5 (29) and because PM2.5 enters deeper into the airways.
Our study has several strengths worth mentioning. The performance of a pilot search improved the credibility, relevance, and methodology of the review. Correcting the errors in the pilot search ensured a robust high-quality search in the work with the main review.
A thorough review of all the included studies was conducted by reading through the supplementary materials associated with the selected papers. This helped us to extract valuable additional information such as identifying from the paper by Yan et al. (38), that the effect estimates of our interest were not reported in the main paper but in the online supplement.
Finally, to ensure comparability among the effect estimates related to different exposure increments, we standardized the reported increments to a uniform scale. Specifically, while two of the included studies reported effects per 10 μg/m3 increment of PM2.5, another study presented outcomes based on an interquartile range (IQR) increase, with the IQR being 5.12 μg/m3. To align these findings, we converted the odds ratio (OR) for the less than 10 μg/m3 increment, namely, per IQR increase of 5.12 μg/m3 in PM2.5 exposure, to an OR per 10 μg/m3 increase. The details of this conversion formula are outlined in the “Methods—Data synthesis and statistical analysis section”. This standardization allowed us to perform more direct comparisons across the effect estimates from the included studies.
When interpreting the results from this review, certain limitations should also be noted. A significant limitation of our meta-analysis is that the small number of included studies affected heterogeneity. To be included in a meta-analysis, different studies should report the same kind of effect estimate, in addition to having comparable exposures and outcomes. In our meta-analysis, two of the included effects estimates were odds ratios and one was relative risk. Given the scarcity of studies on long-term pollution exposure and asthma in LMICs, our meta-analysis necessitated a practical approach. We interpreted odds ratios (ORs) and relative risks (RRs) interchangeably, a decision driven by the low asthma prevalence (less than 10%) observed across the studies we reviewed (32–34) In such contexts of rare outcomes, the approximation of ORs to RRs is methodologically acceptable, minimizing the impact of this decision on the analysis's overall integrity.
Another limitation worth highlighting is that none of the included studies in this review were able to disentangle the effects of multiple air pollutants. Collinearity between for example PM10, NO2, and SO2 makes it difficult to assess which pollution marker is the most important concerning respiratory health outcomes, and variability in NO2 or SO2 between cities could have influenced the observed results in the paper by Yan and colleagues added in our meta-analysis. Disentangling the effects of different air pollutants has been difficult to address until recently, although promising multipollutant statistical models are fortunately on the rise. However, none of the studies identified in our review had considered such models.
Studies on children were not included in our review, which could be considered a limitation since children may be even more vulnerable than adults to adverse respiratory effects resulting from exposure to outdoor air pollutants. However, as underlying mechanisms behind non-communicable diseases such as asthma may differ between children and adults, and as asthma in adults is often a different phenotype than asthma in children, we would need separate meta-analyses to cover this topic in both children and adults in LMICs. As a recent systematic review on this particular topic in children in LMICs already exists (20), while no such reviews exist for adults, we, therefore, decided to perform our systematic review in this important research area with a particular focus on adults.
Although we only included adults in our review, the age cut-off for adult populations varied slightly across studies. While most studies employed 18 years as a cut-off for defining adults, one study included in our analysis defined adults as individuals aged 15 years and older. This deviation from the standard definition of adulthood (58) could potentially impact the interpretation of the results, as it includes individuals who may still be considered adolescents in other studies (59). This variation in age definitions might have introduced heterogeneity into our meta-analysis. However, it is important to note that definitions of adulthood can vary across contexts, and as the authors of this specific study explicitly defined >15 years as adults and the number of eligible studies was very low, we chose to include it in our review.
We acknowledge the health implications associated with sulfur dioxide (SO2) and other significant pollutants, including carbon monoxide (CO) and ozone (O3), on asthma, however, these pollutants were not included in our study. This was due to the unavailability of eligible studies meeting our inclusion criteria. Initially, we conducted a pilot search in collaboration with the University Librarian, which revealed that no studies existed on long-term exposure (>1-year duration) and asthma and respiratory symptoms in adults in LMICs. Consequently, we narrowed our focus to PM2.5, PM10, and NO2 for our review. While our study provides valuable insights into the association between PM2.5, PM10, and NO2 and asthma, there is a striking need for future studies focusing on other significant pollutants and the complex interplay between, for example, SO2 and NO2The absence of adjustments for variations in NO2 and SO2 levels in any of the four models outlined in Table 2 might have influenced differences in asthma incidence, potentially serving as confounding factors or effect modifiers. Notably, NO2 was assessed in only one of the studies included in our analysis, and this study was among the smallest. Therefore, while NO2 could have introduced confounding effects into the models, its limited availability precluded its inclusion in our meta-analysis, thereby raising concerns regarding its potential to impact the results. In the study by Yan et al. (38), although NO2 and SO2 levels were considered alongside PM2.5 in a two-pollutant model, the investigation primarily focused on the confounding effects of these pollutants, without explicitly assessing their potential as effect modifiers. The findings suggested an intensified association between PM2.5 exposure and respiratory disease incidence when accounting for NO2 or SO2. However, this adjustment does not fully explore the intricate dynamics between these pollutants, potentially oversimplifying the complex interactions that contribute to respiratory health outcomes.
The exposure assessment ranges from direct monitoring to modeling approaches. Each method comes with its own set of limitations. For instance, direct monitoring might not accurately capture personal exposure levels due to spatial and temporal differences, while modeling approaches can introduce bias through assumptions made during the estimation process. This variability in exposure assessment methods introduces uncertainty and potential measurement error, which may impact the accuracy and comparability of findings across studies. Therefore, the heterogeneous nature of exposure assessment methods represents a limitation in our ability to draw robust conclusions regarding the relationship between air pollution and respiratory health outcomes.
The study by Yan et al. (38), employed a spatiotemporal model utilizing high-resolution satellite imagery, with a resolution of 1 km × 1 km, to evaluate outdoor PM2.5 concentrations. The precision of PM2.5 pollution estimations was evaluated by utilizing data sourced from ground PM2.5 measurements conducted by the China Environmental Monitoring Center. This assessment employed a random 10-fold cross-validation approach, yielding an R2 value of 0.95 at the annual level. Additionally, comparisons were made with PM2.5 ground measurements from different locations, resulting in an R2 value of 0.80 at the annual level to validate the predictions of PM2.5. A limitation observed from using these exposure assessments was the inability to conduct the related analyses because of the unavailability of data on the mixture compositions of PM2.5 which is due to the various effects induced by PM2.5 in different locations of China.
Bagula et al. (28), used land-use regression models to assess the spatial variation in the annual concentrations of PM2.5 and NO2 with predictors of exposure collected on-site such as nearby traffic (for instance, from bus stops, train stations, and major roads), land-use, waste burning sites, and household density. They highlighted that the minimal variability in PM2.5 exposure observed in their study could have introduced bias into the association between air pollutants and respiratory outcomes, skewing it towards the null. Furthermore, the limited variability in PM2.5 levels was unsurprising, considering the small scale of the four study neighborhoods and the short distances between the sites.
Ai et al. (39), used the Global Chemical Transport Models method to assess the annual average concentrations of PM2.5 for three years at 1 km × 1 km resolution, and these were validated by ground monitoring data with one-sigma uncertainty. The study utilized satellite-derived three-year average concentrations as proxies for the actual PM2.5 exposure of each participant. However, this approach may have introduced exposure misclassification, particularly given the lack of information regarding any residential changes among the participants, which could also impact the accuracy of the exposure assessment in the study. In the study by Khafaie et al. (40), the atmospheric dispersion model, AERMOD, was used to evaluate the background concentration of PM10 at the participant's home and work.
Kumar et al. (41), employed standard laboratory methods of the Central Pollution Control Board to assess the levels of PM10, and NO2 using a high-volume air sampler. They pointed out that using these methods could not measure the effect of the different levels of air pollutants because they could not conduct individual air sampling. This could have led to exposure misclassification, thereby resulting in biased estimates of the association between PM10, and NO2 and respiratory symptoms.
Chhabra et al. (42), used air quality monitoring stations in situated different locations to evaluate the concentration of NO2 in residential colonies within a 1 km radius. A limitation of this method is the spatial variability of NO2 levels within the study area. Air quality monitoring stations typically measure NO2 concentrations at specific fixed locations, which may not fully capture the spatial heterogeneity of NO2 levels within a residential neighborhood. As a result, the measurements obtained from these stations may not have accurately represented the exposure experienced by individuals living in different parts of the neighborhood. Therefore, while air quality monitoring stations provide valuable information on ambient NO2 levels, their limited spatial coverage may have introduced uncertainties in assessing NO2 exposure at the individual level within a residential area.
Some potential biases were encountered in this review. The health outcomes of interest in this review (asthma, cough, wheezing, and dyspnoea) were mainly based on self-report which might have introduced recall bias as reported by Yan and Bagulas' studies. Coughlin (60) defined recall bias as “a form of differential misclassification bias and the risk estimate may be biased away from or towards the null”. For instance, Yan's study was a retrospective cohort study that might have caused a recall bias for some self-reported details, lifestyle habits such as physical activity, etc. However, the pollution exposures were measured objectively, and the outcomes were defined by self-report based on current disease and through the registry. Also, our search was limited to English, which means we may have missed some studies published in other languages. This could have resulted in biased effect estimates and reduced generalizability. Through an additional search where we also included non-English papers, however, we found that only a limited number of studies were missed in this manner: one study was published in Bulgarian and two studies in Chinese.
Our study has important implications for policymakers. Our findings support that long-term exposure to air pollution is harmful to asthma development in low- and middle-income countries. The current review provides more evidence for why the implementation of air quality monitoring should be important for policymakers. The results can also be important for disease prevention: identifying patients at risk and advising them to avoid pollution as much as they can to avoid becoming sick.
Another possible implication is related to costs. If this study can contribute to increased air quality monitoring and knowledge about associations between pollution and respiratory diseases in LMICs, a decrease in health costs could be a significant co-benefit. The total health cost acquired from air pollution is enormous, and the decrease in associated health costs would be a significant cost-benefit of the implementation of air pollution preventive measures (61).
Our study also has implications for researchers. The considerable heterogeneity observed across included studies implies large variation regarding air pollution and respiratory diseases across LMICs. This should be considered, and studies should be planned for multiple locations such as in Africa, Eastern Mediterranean, and South-East Asia regions where no or few research projects have been carried out. Also, in areas with a significant contribution of dust to the PM2.5 composition, our pooled relative risks (RRs) may not be applicable and the need for separate studies will be even larger.
The LMICs are experiencing rapid urbanization and economic transformation. These factors contribute greatly to the increasing levels of outdoor air pollution, and health problems related to air pollution are further aggravated by poverty. More studies are needed, but our systematic review and meta-analysis indicate a positive association between long-term exposure to outdoor air pollution (PM2.5) and the development of asthma among adults. The findings of this review contribute to scientific evidence and may help underpin targeted mitigation measures to decrease the health burden associated with outdoor air pollution.
The original contributions presented in the study are included in the article/Supplementary Material, further inquiries can be directed to the corresponding author.
AA: Conceptualization, Formal Analysis, Methodology, Writing – original draft, Writing – review & editing, Data curation, Software. SX: Methodology, Supervision, Writing – review & editing, Software, Conceptualization. AJ: Methodology, Supervision, Writing – review & editing, Software, Conceptualization.
The author(s) declare that no financial support was received for the research, authorship, and/or publication of this article.
We would like to acknowledge the contribution of university librarian Elisabeth Ebner for her assistance with the electronic search strategies and suggestions for the relevant databases.
The authors declare that the research was conducted in the absence of any commercial or financial relationships that could be construed as a potential conflict of interest.
All claims expressed in this article are solely those of the authors and do not necessarily represent those of their affiliated organizations, or those of the publisher, the editors and the reviewers. Any product that may be evaluated in this article, or claim that may be made by its manufacturer, is not guaranteed or endorsed by the publisher.
The Supplementary Material for this article can be found online at: https://www.frontiersin.org/articles/10.3389/fenvh.2024.1352786/full#supplementary-material
1. Our World in Data. Outdoor Air Pollution (2019). (updated March 2024). Available online at: https://ourworldindata.org/outdoor-air-pollution
2. Madaniyazi L, Xerxes S. Outdoor air pollution and the onset and exacerbation of asthma. Chronic Dis Transl Med. (2021) 7(2):100–6. doi: 10.1016/j.cdtm.2021.04.003
3. Sun Z, Zhu D. Exposure to outdoor air pollution and its human-related health outcomes: an evidence gap map. BMJ Open. (2019) 9(12):e031312. doi: 10.1136/bmjopen-2019-031312
4. World Health Organization. Ambient (Outdoor) Air Pollution (2021). (updated 21 September 2021). Available online at: https://www.who.int/news-room/fact-sheets/detail/ambient-(outdoor)-air-quality-and-health.
5. Tiotiu AI, Novakova P, Nedeva D, Chong-Neto HJ, Novakova S, Steiropoulos P, et al. Impact of air pollution on asthma outcomes. Int J Environ Res Public Health. (2020) 17(17):6212. doi: 10.3390/ijerph17176212
6. Data. OWi. Air Pollution (2017). Available online at: https://ourworldindata.org/air-pollution (accessed May 5, 2023).
7. Bontinck A, Maes T, Joos G. Asthma and air pollution: recent insights in pathogenesis and clinical implications. Curr Opin Pulm Med. (2020) 26(1):10–9. doi: 10.1097/MCP.0000000000000644
8. United States Environmental Protection Agency. Outdoor Air Quality (2022). (updated July 12, 2022). Available online at: https://www.epa.gov/report-environment/outdoor-air-quality
9. Turner MC, Andersen ZJ, Baccarelli A, Diver WR, Gapstur SM, Pope CA, et al. Outdoor air pollution and cancer: an overview of the current evidence and public health recommendations. CA Cancer J Clin. (2020) 70(6):460–79. doi: 10.3322/caac.21632
10. Ren C, Tong S. Health effects of ambient air pollution—recent research development and contemporary methodological challenges. Environ Health. (2008) 7(1):56. doi: 10.1186/1476-069X-7-56
11. Shaddick G, Thomas ML, Mudu P, Ruggeri G, Gumy S. Half the world's Population are exposed to increasing air pollution. npj Climate Atmospheric Sci. (2020) 3(1):23. doi: 10.1038/s41612-020-0124-2
12. Landrigan PJ, Fuller R, Acosta NJR, Adeyi O, Arnold R, Basu N, et al. The lancet commission on pollution and health. Lancet. (2018) 391(10119):462–512. doi: 10.1016/S0140-6736(17)32345-0
13. Katoto PDMC, Byamungu L, Brand AS, Mokaya J, Strijdom H, Goswami N, et al. Ambient air pollution and health in sub-saharan Africa: current evidence, perspectives and a call to action. Environ Res. (2019) 173:174–88. doi: 10.1016/j.envres.2019.03.029
14. Cao Y, Chen S, Chen X, Zou W, Liu Z, Wu Y, et al. Global trends in the incidence and mortality of asthma from 1990 to 2019: an age-period-cohort analysis using the global burden of disease study 2019. Front Public Health. (2022) 10:1036674. doi: 10.3389/fpubh.2022.1036674
15. Zheng X-Y, Ding H, Jiang L-N, Chen S-W, Zheng J-P, Qiu M, et al. Association between air pollutants and asthma emergency room visits and hospital admissions in time series studies: a systematic review and meta-analysis. PLoS One. (2015) 10(9):e0138146. doi: 10.1371/journal.pone.0138146
16. Orellano P, Quaranta N, Reynoso J, Balbi B, Vasquez J. Effect of outdoor air pollution on asthma exacerbations in children and adults: systematic review and multilevel meta-analysis. PLoS One. (2017) 12(3):e0174050. doi: 10.1371/journal.pone.0174050
17. Asher MI, García-Marcos L, Pearce NE, Strachan DP. Trends in worldwide asthma prevalence. Eur Respir J. (2020) 56(6):2002094. doi: 10.1183/13993003.02094-2020
18. Braman SS. The global burden of asthma. Chest. (2006) 130(1, Supplement):4S–12S. doi: 10.1378/chest.130.1_suppl.4S
19. Smith Y. Asthma Epidemiology (Updated Jan 2, 2023). Available online at: https://www.news-medical.net/health/Asthma-Epidemiology.aspx#:∼:text=Worldwide%2C%20it%20is%20estimated%20that%20approximately%20334%20million,estimated%20to%20increase%20by%20100%20million%20by%202025
20. Ibrahim MF, Hod R, Nawi AM, Sahani M. Association between ambient air pollution and childhood respiratory diseases in low- and middle-income Asian countries: a systematic review. Atmos Environ. (2021) 256:17. doi: 10.1016/j.atmosenv.2021.118422
21. Page MJ, Bossuyt PM, Boutron I, Hoffmann TC, Mulrow CD, Shamseer L, et al. The PRISMA 2020 statement: an updated guideline for reporting systematic reviews. Br Med J. (2021) 372(71). doi: 10.1136/bmj.n71
22. The World Bank Group. (2022) Available online at: https://data.worldbank.org/indicator/NY.GNP.PCAP.CD?locations=XO&name_desc=false (accessed September 9, 2022).
23. Rayyan. Faster systematic reviews (2022). Available online at: https://www.rayyan.ai/ (accessed September 30, 2022).
24. Collaboration TC. Data Extraction Form Available online at: https://training.cochrane.org/sites/training.cochrane.org/files/public/uploads/resources/downloadable_resources/English/Collecting data—form for RCTs and non-RCTs.doc (accessed September 30, 2022).
25. ROBINS-E Development Group. (Higgins J MR, Rooney A, Taylor K, Thayer K, Silva R, Lemeris C, Akl A, Arroyave W, Bateson T, Berkman N, Demers P, Forastiere F, Glenn B, Hróbjartsson A, Kirrane E, LaKind J, Luben T, Lunn R, McAleenan A, McGuinness L, Meerpohl J, Mehta S, Nachman R, Obbagy J, O'Connor A, Radke E, Savović J, Schubauer-Berigan M, Schwingl P, Schunemann H, Shea B, Steenland K, Stewart T, Straif K, Tilling K, Verbeek V, Vermeulen R, Viswanathan M, Zahm S, Sterne J). Risk Of Bias In Non-randomized Studies—of Exposure (ROBINS-E). Launch version (2022). (updated 1 June 2022). Available online at: https://www.riskofbias.info/welcome/robins-e-tool
26. Park J, Kim H-J, Lee C-H, Lee CH, Lee HW. Impact of long-term exposure to ambient air pollution on the incidence of chronic obstructive pulmonary disease: a systematic review and meta-analysis. Environ Res. (2021) 194:110703. doi: 10.1016/j.envres.2020.110703
27. DerSimonian R, Laird N. Meta-analysis in clinical trials. Control Clin Trials. (1986) 7(3):177–88. doi: 10.1016/0197-2456(86)90046-2
28. Bagula H, Olaniyan T, de Hoogh K, Saucy A, Parker B, Leaner J, et al. Ambient air pollution and cardiorespiratory outcomes amongst adults residing in four informal settlements in the western province of South Africa. Int J Environ Res Public Health. (2021) 18(24):13. doi: 10.3390/ijerph182413306
29. Chen J, Hoek G. Long-term exposure to PM and all-cause and cause-specific mortality: a systematic review and meta-analysis. Environ Int. (2020) 143:105974. doi: 10.1016/j.envint.2020.105974
30. Borenstein M, Higgins JPT, Hedges LV, Rothstein HR. Basics of meta-analysis: i2 is not an absolute measure of heterogeneity. Res Synth Methods. (2017) 8(1):5–18. doi: 10.1002/jrsm.1230
31. Egger M, Smith GD, Schneider M, Minder C. Bias in meta-analysis detected by a simple, graphical test. Br Med J. (1997) 315(7109):629–34. doi: 10.1136/bmj.315.7109.629
32. Ranganathan P, Aggarwal R, Pramesh CS. Common pitfalls in statistical analysis: odds versus risk. Perspect Clin Res. (2015) 6(4):222–4. doi: 10.4103/2229-3485.167092
33. Greenland S, Thomas DC. On the need for the rare disease assumption in case-control studies. Am J Epidemiol. (1982) 116(3):547–53. doi: 10.1093/oxfordjournals.aje.a113439
34. Martinez BAF, Leotti VB, Silva G, Nunes LN, Machado G, Corbellini LG. Odds ratio or prevalence ratio? An overview of reported statistical methods and appropriateness of interpretations in cross-sectional studies with dichotomous outcomes in veterinary medicine. Front Vet Sci. (2017) 4:193. doi: 10.3389/fvets.2017.00193
35. Brozek JL, Canelo-Aybar C, Akl EA, Bowen JM, Bucher J, Chiu WA, et al. GRADE Guidelines 30: the GRADE approach to assessing the certainty of modeled evidence—an overview in the context of health decision-making. J Clin Epidemiol. (2021) 129:138–50. doi: 10.1016/j.jclinepi.2020.09.018
36. Balshem H, Helfand M, Schünemann HJ, Oxman AD, Kunz R, Brozek J, et al. GRADE Guidelines: 3. Rating the quality of evidence. J Clin Epidemiol. (2011) 64(4):401–6. doi: 10.1016/j.jclinepi.2010.07.015
37. Guyatt G, Oxman AD, Akl EA, Kunz R, Vist G, Brozek J, et al. GRADE Guidelines 1. Introduction—gRADE evidence profiles and summary of findings tables. J Clin Epidemiol. (2011) 64(4):383–94. doi: 10.1016/j.jclinepi.2010.04.026
38. Yan M, Ge H, Zhang L, Chen X, Yang X, Liu F, et al. Long-term PM 2.5 exposure in association with chronic respiratory diseases morbidity: a cohort study in northern China. Ecotoxicol Environ Saf. (2022) 244:114025. doi: 10.1016/j.ecoenv.2022.114025
39. Ai S, Qian ZM, Guo Y, Yang Y, Rolling CA, Liu E, et al. Long-term exposure to ambient fine particles associated with asthma: a cross-sectional study among older adults in six low- and middle-income countries. Environ Res. (2019) 168:141–5. doi: 10.1016/j.envres.2018.09.028
40. Khafaie MA, Salvi SS, Yajnik CS, Ojha A, Khafaie B, Gore SD. Air pollution and respiratory health among diabetic and non-diabetic subjects in pune, India-results from the wellcome trust genetic study. Environ Sci Pollut Res Int. (2017) 24(18):15538–46. doi: 10.1007/s11356-017-9148-5
41. Kumar R, Sharma M, Srivastva A, Thakur JS, Jindal SK, Parwana HK. Association of outdoor air pollution with chronic respiratory morbidity in an industrial town in northern India. Arch Environ Health. (2004) 59(9):471–7. doi: 10.1080/00039890409603428
42. Chhabra SK, Chhabra P, Rajpal S, Gupta RK. Ambient air pollution and chronic respiratory morbidity in Delhi. Arch Environ Health. (2001) 56(1):58–64. doi: 10.1080/00039890109604055
43. Lee YH. An overview of meta-analysis for clinicians. Korean J Intern Med. (2018) 33(2):277–83. doi: 10.3904/kjim.2016.195
44. Nordeide Kuiper I, Svanes C, Markevych I, Accordini S, Bertelsen RJ, Bråbäck L, et al. Lifelong exposure to air pollution and greenness in relation to asthma, rhinitis and lung function in adulthood. Environ Int. (2021) 146:106219. doi: 10.1016/j.envint.2020.106219
45. Saul M. P-Value And Statistical Significance: What It Is & Why It Matters (updated October 13, 2023). Available online at: https://www.simplypsychology.org/p-value.html
46. Dominski FH, Lorenzetti Branco JH, Buonanno G, Stabile L, Gameiro da Silva M, Andrade A. Effects of air pollution on health: a mapping review of systematic reviews and meta-analyses. Environ Res. (2021) 201, (no pagination). doi: 10.1016/j.envres.2021.111487
47. Faustini A, Rapp R, Forastiere F. Nitrogen dioxide and mortality: review and meta-analysis of long-term studies. Eur Respir J. (2014) 44(3):744–53. doi: 10.1183/09031936.00114713
48. Orellano P, Reynoso J, Quaranta N, Bardach A, Ciapponi A. Short-term exposure to particulate matter (PM10 and PM2.5), nitrogen dioxide (NO2), and ozone (O3) and all-cause and cause-specific mortality: systematic review and meta-analysis. Environ Int. (2020) 142:105876. doi: 10.1016/j.envint.2020.105876
49. Kundu S, Stone EA. Composition and sources of fine particulate matter across urban and rural sites in the midwestern United States. Environ Sci Process Impacts. (2014) 16(6):1360–70. doi: 10.1039/C3EM00719G
50. Deng SZ, Jalaludin BB, Antó JM, Hess JJ, Huang CR. Climate change, air pollution, and allergic respiratory diseases: a call to action for health professionals. Chin Med J (Engl). (2020) 133(13):1552–60. doi: 10.1097/CM9.0000000000000861
51. O'Lenick CR, Winquist A, Mulholland JA, Friberg MD, Chang HH, Kramer MR, et al. Assessment of neighbourhood-level socioeconomic status as a modifier of air pollution–asthma associations among children in Atlanta. J Epidemiol Community Health. (2017) 71(2):129–36. doi: 10.1136/jech-2015-206530
52. Williams DR, Sternthal M, Wright RJ. Social determinants: taking the social context of asthma seriously. Pediatrics. (2009) 123(Supplement_3):S174–S84. doi: 10.1542/peds.2008-2233H
53. Alhanti BA, Chang HH, Winquist A, Mulholland JA, Darrow LA, Sarnat SE. Ambient air pollution and emergency department visits for asthma: a multi-city assessment of effect modification by age. J Expo Sci Environ Epidemiol. (2016) 26(2):180–8. doi: 10.1038/jes.2015.57
54. (WHO) WHO. WHO Air Quality Guidelines (2023). Available online at: https://www.c40knowledgehub.org/s/article/WHO-Air-Quality-Guidelines?language=en_US (accessed February 5, 2023).
55. aid d. World's most polluted cities (2021). (updated 22 October 2021). Available online at: https://www.developmentaid.org/news-stream/post/116153/worlds-most-polluted-cities
56. Badida P, Krishnamurthy A, Jayaprakash J. Meta analysis of health effects of ambient air pollution exposure in low- and middle-income countries. Environ Res. (2023) 216:114604. doi: 10.1016/j.envres.2022.114604
57. Rajak R, Chattopadhyay A. Short and long term exposure to ambient air pollution and impact on health in India: a systematic review. Int J Environ Health Res. (2020) 30(6):593–617. doi: 10.1080/09603123.2019.1612042
58. McCue J. How Ideas of “Adulthood’, Its Rights and Responsibilities, are Changing Around the World 2018 [cited 2018 16]. Available online at: https://theconversation.com/how-ideas-of-adulthood-its-rights-and-responsibilities-are-changing-around-the-world-99669
59. Canêo LF, Neirotti R. The importance of the proper definition of adulthood: what is and what is not included in a scientific publication. Braz J Cardiovasc Surg. (2017) 32(1):60. doi: 10.21470/1678-9741-2016-0049
60. Coughlin SS. Recall bias in epidemiologic studies. J Clin Epidemiol. (1990) 43(1):87–91. doi: 10.1016/0895-4356(90)90060-3
Keywords: air quality, ambient air pollution, asthma, environmental health, LMICs, respiratory symptoms, public health
Citation: Abbah AP, Xu S and Johannessen A (2024) Long-term health effects of outdoor air pollution on asthma and respiratory symptoms among adults in low-and middle-income countries (LMICs): a systematic review and meta-analysis. Front. Environ. Health 3:1352786. doi: 10.3389/fenvh.2024.1352786
Received: 8 December 2023; Accepted: 22 April 2024;
Published: 9 May 2024.
Edited by:
Reginald Quansah, University of Ghana, GhanaReviewed by:
Brie Hawley Blackley, Centers for Disease Control and Prevention (CDC), United States© 2024 Abbah, Xu and Johannessen. This is an open-access article distributed under the terms of the Creative Commons Attribution License (CC BY). The use, distribution or reproduction in other forums is permitted, provided the original author(s) and the copyright owner(s) are credited and that the original publication in this journal is cited, in accordance with accepted academic practice. No use, distribution or reproduction is permitted which does not comply with these terms.
*Correspondence: Achenyo Peace Abbah Y2hlbnlvYWJiYWhAeWFob28uY29t
†ORCID Shanshan Xu orcid.org/0000-0002-8019-9819 Ane Johannessen orcid.org/0000-0003-3269-8354
Disclaimer: All claims expressed in this article are solely those of the authors and do not necessarily represent those of their affiliated organizations, or those of the publisher, the editors and the reviewers. Any product that may be evaluated in this article or claim that may be made by its manufacturer is not guaranteed or endorsed by the publisher.
Research integrity at Frontiers
Learn more about the work of our research integrity team to safeguard the quality of each article we publish.