- 1Environmental Health Analyst, Saudi Electricity Company, Dammam, Saudi Arabia
- 2Environmental Health Department, College of Public Health, Imam Abdulrahman Bin Faisal University, Dammam, Saudi Arabia
Ambient air quality remains a significant health and environmental challenge in developing cities, primarily due to increasing gas emissions from fossil fuel use. Harmful outdoor air pollutants constitute a critical environmental and public health concern, as poor air quality directly impacts human health, leading to respiratory and cardiovascular diseases. This study aimed to assess ambient gaseous air pollutants—specifically sulfur dioxide (SO2), nitric oxide (NO), nitrogen dioxide (NO2), carbon monoxide (CO), and non-methane hydrocarbons (NMHC)—in Jubail Industrial City, Saudi Arabia. Hourly fixed-site air quality monitoring data were collected from three monitoring stations distributed throughout Jubail, covering the period from January 2020 to December 2022, alongside recorded hourly meteorological conditions. Standard monitoring equipment was employed to measure pollutant concentrations at all three locations. Notably, the highest emissions of CO, SO2, and NMHC occurred in 2021, while the highest emissions of NO, NO2, and NOx were recorded in 2022, with 2022 generally exhibiting the highest gas emissions and 2020 the lowest. Variations in gaseous contaminants were observed, influenced by changes in meteorological conditions and human activities. However, the levels of gaseous emissions remained within acceptable limits according to the air quality index. Consequently, policies implemented during and after the COVID-19 lockdown effectively reduced the accumulation of gaseous emissions to below harmful levels. Maintaining these measures is crucial for ensuring ongoing air quality improvements.
Introduction
Air pollution has emerged as a global concern, posing significant risks to human health, contributing to environmental challenges, and impacting mortality rates in both developed and developing nations (Saber et al., 2020; Biswas et al., 2020; Al-Kallas et al., 2021; Filonchyk, 2022). The consequences of poor air quality are particularly severe in urban areas (NRC, 2001; EEA, 2015). The rapid increase in pollution is closely linked to factors that can harm human health, such as industrial activities and the widespread use of automobiles.
Anthropogenic emissions are the primary driver of rising air pollution levels, with atmospheric phenomena occurring on various spatial scales that further amplify the environmental impact (Miranda et al., 2015). Common gaseous pollutants are air contaminants in the form of gases that pose risks to human health and the environment. These include pollutants such as carbon monoxide (CO), sulfur dioxide (SO₂), nitrogen oxides (NOx), ozone (O₃), and volatile organic compounds (VOCs). Along with suspended particles like PM10 and PM2.5 (World Health Organization, 2024).
Ambient air quality is a critical environmental and public health concern because poor air quality directly impacts human health, leading to respiratory and cardiovascular diseases. Pollutants like particulate matter, ozone, and nitrogen oxides harm ecosystems, reduce biodiversity, and contribute to climate change. Ensuring good ambient air quality is essential for protecting public health and preserving environmental integrity especially in rapidly industrializing cities. Rising emissions of greenhouse gases such as carbon dioxide, methane, and nitrous oxide—predominantly from fossil fuel consumption—have led to increased levels of harmful outdoor air pollutants, posing significant risks to human health and the environment (World Health Organization, 2024). In developing industrial cities like Jubail, Saudi Arabia, the monitoring and management of air quality are paramount to mitigating these risks.
This study focuses on assessing the ambient gaseous air pollutants in Jubail, a city known for its extensive petrochemical and industrial activities. The key pollutants of interest include sulfur dioxide (SO2), nitric oxide (NO), nitrogen dioxide (NO2), carbon monoxide (CO), and non-methane hydrocarbons (NMHC). These pollutants are influenced by various meteorological parameters such as temperature, wind speed, relative humidity, and pressure, which are crucial for understanding the dynamics of air quality in the region (Environmental Protection Agency, 2020 and Rovira et al., 2021).
The objective of this study is to analyze the trends in gaseous pollutant concentrations in Jubail from 2020 to 2022 and examine the relationship between air pollutant levels and meteorological conditions including, temperature, pressure, solar radiation, wind speed at 10 m, and wind direction at 10 m. Additionally, the study compares Jubail’s air quality levels with national and international standards to provide insights into the effectiveness of current air quality management practices.
The concentration of aerosols, containing both organic and inorganic components, has significantly increased since the onset of the Industrial Revolution (Wang et al., 2017). High levels of gases, including primary pollutants such as NOx and SOx, which are directly emitted into the air, along with secondary pollutants formed through chemical reactions involving tropospheric O3, acids, and primary pollutants, have exacerbated the issue (Lelieveld et al., 2019; EPA, 2018).
Gaseous sulfur compounds (such as SO2 and H2S), along with suspended particulate matter, are considered harmful outdoor air pollutants. These pollutants arise from both anthropogenic and biogenic activities in industrial areas associated with population growth (Al-Zboon and Tening Forton, 2019; Ramli et al., 2020).
Al-Jubail was chosen as the focus of this study due to its status as an industrial city with extensive construction activities, water desalination plants, and petrochemical industries. The investigation explores the relationships between meteorological parameters and gas emissions, specifically NOx, NO, NO2, SO2, CO, and NMHC. These pollutants can be influenced by meteorological factors.
The objective of this study is to analyze the trends of SO2, NO, NO2, NOx, CO, and NMHC in Jubail, Saudi Arabia, and to examine the relationships between air pollutant concentrations and various meteorological parameters, including temperature and wind speed (WS). The air quality levels in Jubail’s industrial city are then compared with national and international air quality trends and standards.
Materials and methods
In Jubail, the primary industries account for 7% of the world’s petrochemical production, contribute 11.5% to Saudi Arabia’s GDP, and make up 85% of the country’s non-oil exports. With a steady annual growth rate of 6%, Jubail has attracted over 50% of Saudi Arabia’s total foreign investment, with 68% of this investment focused on the city (2014 Annual Report of the RCJY).
The primary industrial sector in Jubail-1 includes hydrocarbon-based and heavy mineral facilities, while the secondary industries produce items such as petrochemical intermediates, plastics, steel, and agrochemicals. The industrial wastewater treatment network services both the primary and secondary sectors in Jubail-1. Meanwhile, Jubail-2 further expands the industrial landscape, incorporating primary, secondary, support, value park, and logistics areas. Jubail’s industrial area, designed under the capital concentration method, includes 19 primary industries, 136 secondary industries, and 100 ancillary industries, creating over 100,000 jobs.
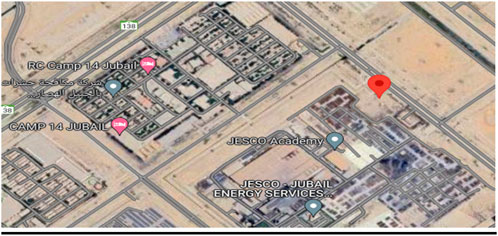
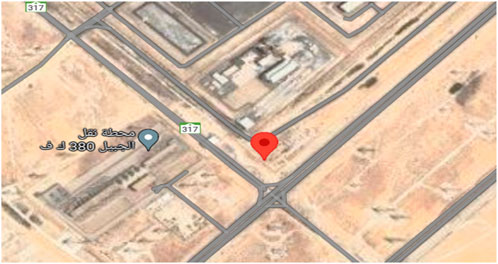
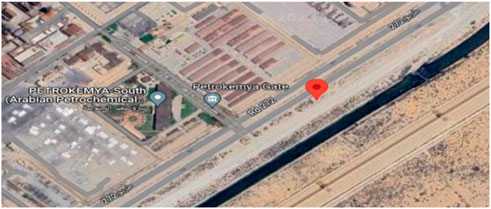
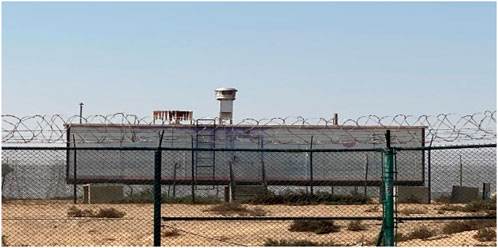
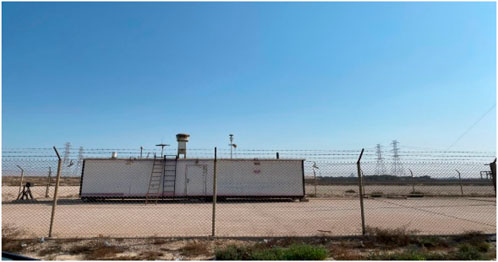
The selected industrial area was classified into three sites: 1, 6, and 9. Sites 1 and 9 represent industrial areas in Jubail-1, while Site 6 represents the industrial area in Jubail-2. The Global Positioning System (GPS) coordinates of all Air Quality and Meteorological Stations (Figures 1–6).
Air Quality and Meteorological Data were collected from three Air Quality Monitoring Stations (AQMSs), site 1 (27° 2′16.2″N-49°32′2.62″E), site 6 (26°55′11.85″N-49°28′59.37″E) and site 9 (27° 1′49.14″N- 49°36′40.54″E). The data, spanning from January 2020 to March 2023, focused on hourly fixed-site air quality measurements taken at ground level. The data were categorized into four-quarters: the first quarter (January–March), second quarter (April–June), third quarter (July–September), and fourth quarter (October–December). The monitored pollutants included SO2, NO, NO2, NOx, CO, and NMHC.
These fixed-site monitoring stations also recorded hourly meteorological conditions, including temperature, pressure, relative humidity (RH), wind speed (WS), and wind direction (WD). Average concentrations for each pollutant were calculated according to the procedures outlined in the US EPA technical report (Environmental Protection Agency, 2020). The instrumentation and analytical methods varied depending on the detection techniques for each trace species: NO and NO2 were measured using chemiluminescence (APNA370), SO2 using UV fluorescence (APSA370), and CO using infrared absorption (APMA370).
Quality control of the air quality data was conducted following standard operating procedures. Microsoft Excel’s regression tool was used for statistical analysis to explore temporal variations in air pollutants, with comparisons made against air quality standards from international organizations (such as WHO and EEA) and regional regulations (such as those set by the Royal Commission for Jubail and Yanbu (RCJY); Organization that manages the cities of the petrochemical industry and energy-intensive industries).
Routine air quality measurements for all examined emissions were reported in micrograms per cubic meter, except for CO, which was reported in grams per cubic meter.
Surface measurements for outdoor emissions, including SO2, NO, NO2, NMHC, and CO, were obtained, and the concentrations of these gases at the three AQMSs were compiled from RCJY reports covering the period from 2020 to 2022.
Results
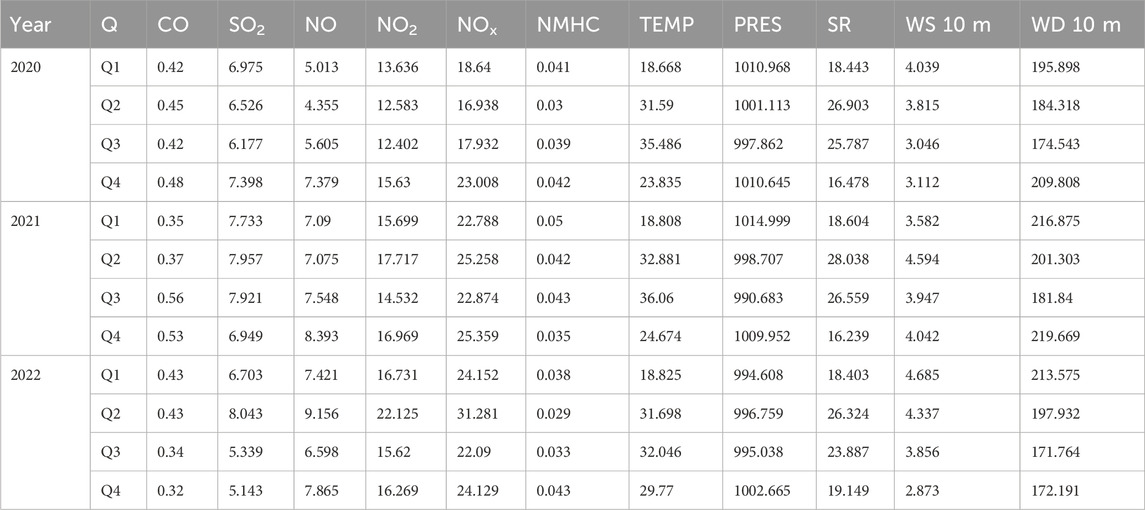
The statistical metrics for gases emitted from the three Air Quality Monitoring Stations (AQMSs 1, 6, and 9) were calculated. Table 1 presents the quarterly average values for each emitted gas, which serve as the dependent variables, alongside the independent variables (temperature, pressure, solar radiation, wind speed at 10 m, and wind direction at 10 m) for the period 2020–2022.
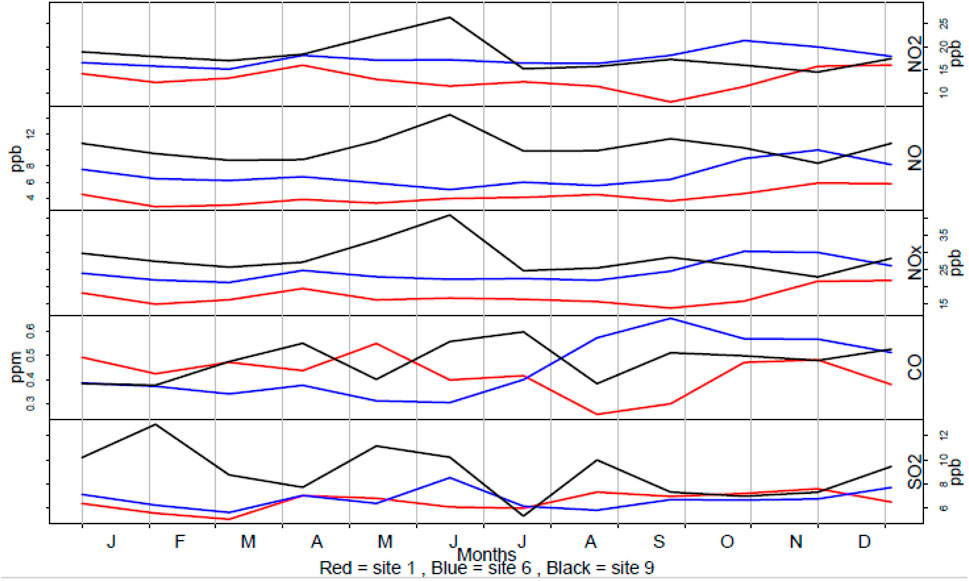
To examine the quarterly trends for each component of the model, the following figures illustrate the quarterly variations for both the independent and dependent variables. In 2020, the fourth quarter recorded the highest average gas emissions at 0.49, while the first quarter had the lowest at 0.42. In 2021, the third quarter exhibited the highest average at 0.56, with the first quarter showing the lowest at 0.35. In 2022, the second quarter had the highest average at 0.44, while the fourth quarter recorded the lowest at 0.32 (Figures 7–9).
Table 2 lists the values of the arithmetic averages for the study variables according to the three geographical locations of the AQMSs (site 1, site 6, and site 9).
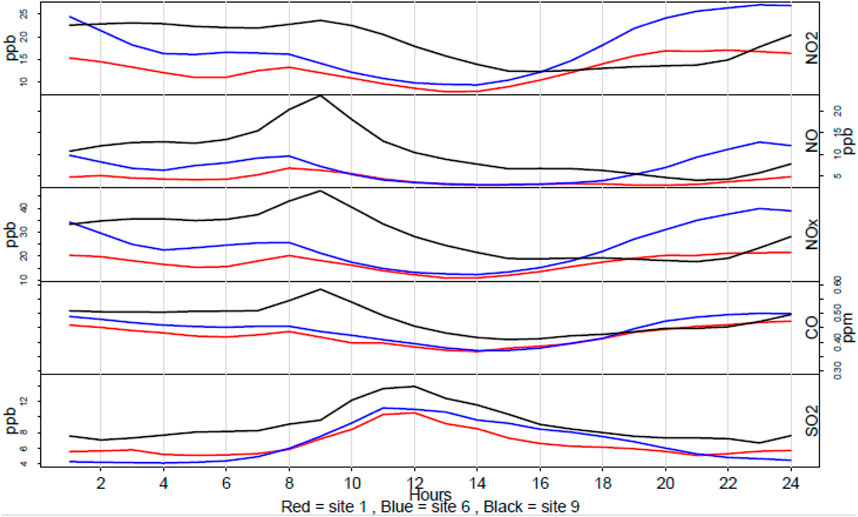
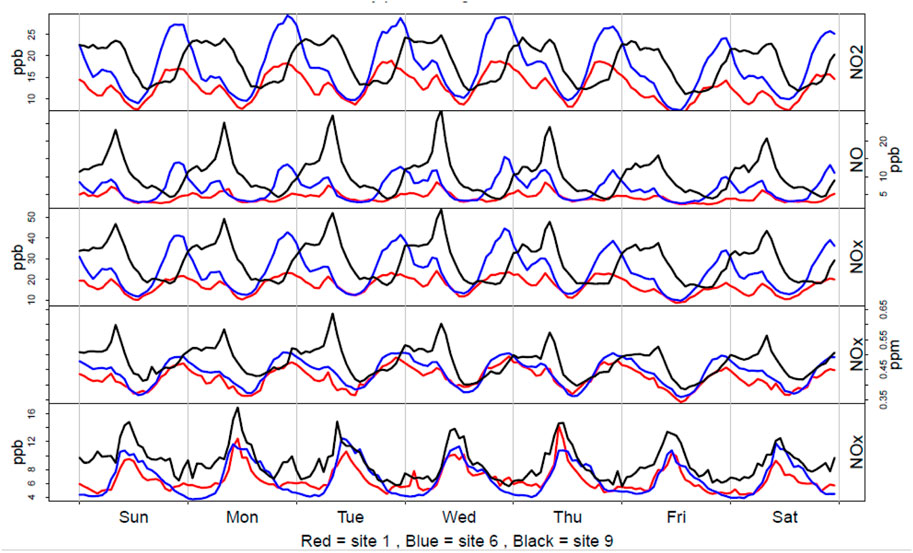
Based on Table 2 and Figure 10, site 9 exhibits the highest CO emissions, while site 1 has the lowest. Similarly, site 9 records the highest levels of SO2, NO, NO2, and NOx gases, with site 1 consistently showing the lowest values. For NMHC emissions, site 9 has the highest average, whereas site 6 has the lowest. In terms of temperature, site 9 has the highest value, and site 6 has the lowest. Regarding wind speed (WS), site 6 shows the highest average, while site 9 records the lowest. Lastly, site 6 exhibits the greatest deviation in wind direction (WD), with site 1 showing the least deviation.
Table 3 presents the annual values of the independent and dependent study variables. Notably, the highest emissions of CO, SO2, and NMHC occurred in 2021, while the highest emissions of NO, NO2, and NOx were recorded in 2022.
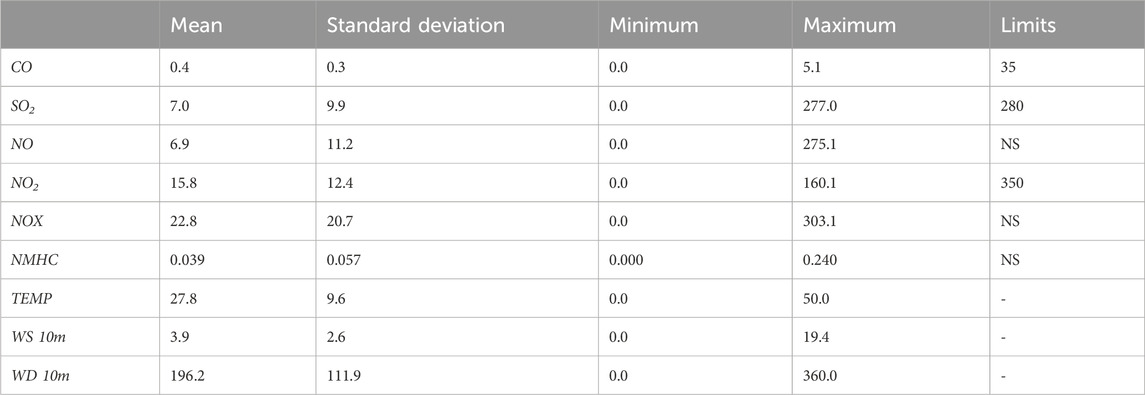
Table 4 shows the values of the arithmetic mean, standard deviation, and minimum and maximum limits for each of the study variables, specifying the critical values that exceeded the permissible values reported by the Royal Commission Environment Regulations (2015).
From Table 4, the average CO emission during the study period was 0.4, with a maximum value of 5.1, which remained below the regulatory limit of 35. The average SO2 emission was 7.00, with a peak value of 277, also within the maximum limit of 280. The average NO emission was 6.9, with the highest recorded value being 275.1. The average NO2 emission was 15.80, and its maximum value of 160.1 did not exceed the limit of 350. The average NOx emission was 22.80, with the highest value being 303.1. The average NMHC emission during the study period was 0.04, with a maximum of 0.24.
Table 5 presents the correlation coefficients between the independent and dependent variables in the model. A weak direct relationship was observed between temperature (TEMP) and CO and SO2 emissions, while a weak inverse relationship was found with NO, NO2, and NOx emissions. No relationship was observed between temperature and NMHC. Additionally, there was a weak inverse relationship between wind speed (WS) and the concentrations of CO, NO, NO2, NOx, and NMHC, but a weak direct relationship with SO2. An inverse relationship was also observed between wind direction (WD) and the concentrations of CO, NO2, NOx, and NMHC, whereas a weak direct relationship was noted with SO2 and NO.
The regression model outlines the relationship between each independent variable (temperature, WS, and WD) and the dependent variables (CO, SO2, NO, NO2, NOx, and NMHC), illustrating the contribution of each independent variable to the emission of these gases. The model’s explanatory power is represented by the adjusted R-squared value, which indicates how well the independent variables account for variations in the dependent variables.
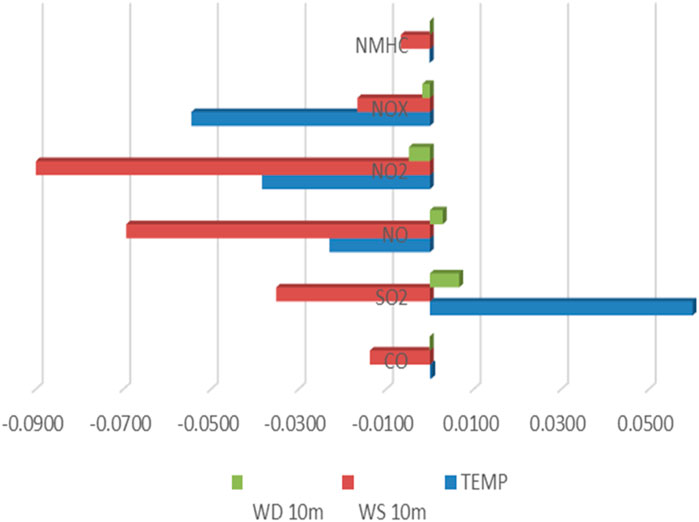
From Table 6, the regression coefficients of the proposed models are significant (Sig F = 0.000), which is less than the significance level of 5%. Figure 10 shows the values of the regression model coefficients for each of the different gases.

Table 6. Coefficients of the regression equation for the proposed model between each of the independent variables and the emitted gases.
Discussion
The primary challenge in improving ambient air quality is addressing the pollutants from domestic, agricultural, and industrial sources, which are predominantly released as gaseous emissions. To improve outdoor air quality, particularly in industrial areas near residential zones, regulatory thresholds for air pollution have been established and enforced on both regional and international levels. These guidelines are designed to assess the health impacts of severe pollution levels in industrial sectors.
In this study, the highest average SO2 emissions were recorded in the second quarter of 2022 (8.04 ppb), while the lowest average was observed in the fourth quarter of 2022 (5.14 ppb). Most of the SO2 levels at the studied sites were within the permissible limits set by the Royal Commission Environment Regulations (2015). Among the sites, site 9 had the highest average SO2 value (8.50 ppb), likely due to its proximity to petrochemical industries, whereas site 1 recorded the lowest (6.091 ppb), potentially due to reduced traffic and lower pollution levels in that area.
Heavy traffic was identified as the main source of NO2 pollution, with an influx observed on the roads during certain intervals. This pattern of temporal variability in NO2 levels, reported by Han et al. (2011) in other locations, can be explained by various hypotheses. During the study periods, several meteorological parameters were also monitored, including relative humidity (RH), temperature, wind direction (WD), and wind speed (WS). Pollutant levels are often influenced by meteorological conditions such as temperature, WD, WS, and RH (Danek et al., 2022).
Berezina et al. (2020) noted that O3 responses to changes in precursor emissions vary depending on the local VOC-to-NOx ratio in the atmosphere. O3 formation is particularly sensitive to VOC and NO2 concentrations. On weekends, lower NOx concentrations, due to reduced traffic, lead to a weaker inhibitory effect of NOx on O3 formation, resulting in higher O3 production.
The daily maximum 8-hour moving average for CO during the two measurement campaigns was 0.47 mg/m³, well below the national standard of 10 mg/m³. The CO levels reflect pollution primarily from road traffic (Das et al., 2022; Zhao et al., 2019; Nagpure and Gurjar, 2012; Wu and Wang, 2005).
Our analysis, using hourly data collected for gaseous pollutants, proposed a regression equation to explore the relationship between pollutants (NO2, NO, SO2, NMHC, and CO) and two meteorological variables (WS and temperature). The findings revealed a significant impact on NO2 and CO concentrations, with increased WS leading to decreased NO2 and CO levels, while temperature showed a direct correlation. Lower WS allows pollutants to accumulate, and higher temperatures cause more pollutants to remain airborne, trapped under a layer of warm air. Similar results were observed by He et al. (2017).
Regarding temperature, site 9 recorded the highest value, while site 6 had the lowest. For wind speed (WS), site 6 had the highest average, whereas site 9 had the lowest. Additionally, site 6 exhibited the greatest variation in wind direction (WD), with site 1 showing the least deviation. Site 9 displayed the highest concentrations of CO, SO2, NO2, and NMHC, likely due to its proximity to petrochemical industries, while sites 6 and 1 had the lowest concentrations, attributed to their location near the Royal Commission campus and academy buildings, which emit significantly fewer pollutants compared to petrochemical industries.
This study revealed a weak direct correlation between temperature (TEMP) and the concentrations of CO, SO2, NOx, and NMHC, consistent with findings by Ahmed and Alharbi (2020), which indicated an insignificant correlation between temperature and NOx levels. In contrast, Dandotiya et al. (2018) observed a slight inverse correlation between SO2 concentrations and increasing temperature, a trend also noted by Preradović et al. (2011), who found that SO2 levels decrease as temperature rises.
Liu et al. (2020) identified temperature as a key factor influencing CO concentration changes at most sites, with relative humidity (RH) also playing a significant role in altering CO levels in the eastern coastal regions. This study found a weak inverse relationship between temperature and the concentrations of NO, NO2, and NOx, mirroring the results reported by Khalil et al. (2016) and Dandotiya et al. (2018).
Additionally, this study identified an inverse relationship between WS and the concentrations of CO, NO, NO2, NOx, and NMHC, consistent with findings by Dandotiya et al. (2018) and Khalil et al. (2016). While an inverse relationship was observed between WD and the concentrations of CO, NO2, NOx, and NMHC, there was a weak direct relationship with SO2 and NO. Conversely, Tasić et al. (2013) found that high WS reduces SO2 concentration due to the dilution effect, leading to inverse correlations between SO2 and both WS and WD at nearly all monitoring stations.
In this study, temperature was found to be the most significant factor influencing the increase in gas emissions (CO, SO2). In contrast, Dandotiya et al. (2018) reported a marginally negative correlation between SO2 concentrations and rising temperatures, a trend also observed by Preradović et al. (2011). Liu et al. (2020) identified temperature as the dominant factor affecting CO concentration changes at most sites, with RH also recognized as a major meteorological factor influencing CO levels in the eastern coastal areas.
This study also noted that an increase in temperature resulted in decreased emissions of NO, NO2, NOx, and NMHC, in line with the findings of Khalil et al. (2016) and Acharya et al. (2018). A significant inverse relationship was observed between WS and the concentrations of CO, SO2, NO, NO2, NOx, and NMHC, similar to the findings of Khalil et al. (2016) and Dandotiya et al. (2018). Site 9 was identified as the highest emitter of gases, while site 1 was the lowest. Notably, significant differences were observed over the 3 years, with the highest gas emissions recorded in 2022 and the lowest in 2020 (Al-Zahrani and Abdul-Wahab, 2015).
Overall, the greatest reductions in SO2 and NO2 were observed in industrial areas, with minimal reductions in other pollutants during the lockdown period of 2020–2021. The higher reductions in certain pollutants during the COVID-19 lockdown can be attributed to the shutdown of major polluting sources. These reductions in Air Quality Indices (AQIs) were influenced by the lower source intensity, atmospheric chemistry, and favorable meteorological conditions.
Similar trends for selected air pollutants have been reported in different cities in India and various geographic locations globally (Kumar et al., 2020; Mahato et al., 2020; Otmani et al., 2020; Dumka et al., 2021). Given the similar trends observed in many cities, it would be prudent to assess the regional improvement in air quality due to the COVID-19 lockdown on a broader scale.
Site 1 consistently showed lower pollutant concentrations, potentially due to reduced traffic and overall lower pollution levels in that area. Both Sites 1 and 6 recorded the lowest concentrations, likely because they are located near the Royal Commission campus and academy buildings, which emit significantly fewer pollutants. In contrast, Site 9 exhibited higher pollutant levels, probably due to its proximity to petrochemical industries. The significantly higher concentrations of NO₂ and SO₂ at Site 9 can be attributed to lower wind speeds, which allow pollutants to accumulate, and higher temperatures that cause pollutants to remain airborne, trapped under a layer of warm air. This aligns with the fact that Site 9 had the lowest wind speed. For other pollutants, the effects of road traffic and higher temperatures were minimal.
The findings of this study highlight the complex interplay between industrial emissions, meteorological factors, and air quality in Jubail Industrial City. While the pollutant levels remained within regulatory limits, the variations observed underscore the need for continuous monitoring and adaptive policy measures to mitigate potential health risks. The effectiveness of policy interventions during and after the COVID-19 lockdown in reducing pollutant levels is evident. These measures, if maintained, could play a crucial role in ensuring sustained air quality improvements in Jubail and similar industrial cities.
Conclusion
A comprehensive evaluation was conducted on outdoor air pollutant levels within the Jubail industrial City and its surrounding areas from 2020 to 2022. The assessment focused on major hazardous gaseous emissions, including SO2, NO, NO2, NOx, CO, and NMHC. The findings revealed that industrial activities—such as those at petrochemical plants, power plants, fertilizer production facilities, oil stations, water treatment plants, and warehouses—along with specific meteorological factors, contributed to significant variations in gaseous concentrations where, petrochemical plants, power plants, fertilizer production facilities and oil stations represent highest source of pollutants emissions as they close to the recording air pollution monitoring stations. Notably, the highest emissions of CO, SO2, and NMHC occurred in 2021, while the highest emissions of NO, NO2, and NOx were recorded in 2022 with 2022 generally exhibiting the highest gas emissions and 2020 showing the lowest. However, the analysis of air quality data showed a downward trend in emissions from 2020 to 2022. The reasons behind these discrepancies were attributed to the exclusion of metrological factors and variations in industrial emissions indicating that could lead to an improvement in air quality over this period. Considering the frequency with which annual concentrations exceeded regulatory limits, the Air Quality Index (AQI) was deemed effective in assessing the gaseous emissions in the outdoor environment. To mitigate health risks associated with these emissions, especially during periods of increased human activity, temperature inversions, and heightened production rates in industrial facilities, targeted policies must be implemented and consistently maintained.
This study provides a comprehensive analysis of ambient gaseous air quality in Jubail Industrial City, revealing that while pollutant levels are within acceptable limits, ongoing industrial activities and meteorological factors continue to influence air quality. Sustained efforts in monitoring and regulatory enforcement are essential to maintaining these levels and protecting public health.
Data availability statement
The raw data supporting the conclusions of this article will be made available by the authors, without undue reservation.
Author contributions
AIA: Writing–review and editing, Writing–original draft, Visualization, Software, Resources, Methodology, Investigation, Formal Analysis, Data curation, Conceptualization. KS: Writing–review and editing, Writing–original draft, Visualization, Validation, Supervision, Project administration, Methodology, Investigation, Formal Analysis. MMA: Writing–review and editing, Writing–original draft, Visualization, Supervision, Methodology, Investigation. MTA: Writing–review and editing, Writing–original draft, Visualization, Methodology, Investigation, Formal Analysis. ASA: Writing–review and editing, Writing–original draft, Visualization, Methodology, Investigation, Formal Analysis. MA-W: Writing–original draft, Methodology, Investigation, Formal Analysis. AAA: Writing–review and editing, Writing–original draft, Visualization, Methodology, Investigation.
Funding
The author(s) declare that no financial support was received for the research, authorship, and/or publication of this article.
Acknowledgments
Thanks to the Royal Commission for Jubail and Yanbu for their unwavering support and invaluable cooperation in providing the necessary dataset.
Conflict of interest
Author AIA was employed by Saudi Electricity Company.
The remaining authors declare that the research was conducted in the absence of any commercial or financial relationships that could be construed as a potential conflict of interest.
Publisher’s note
All claims expressed in this article are solely those of the authors and do not necessarily represent those of their affiliated organizations, or those of the publisher, the editors and the reviewers. Any product that may be evaluated in this article, or claim that may be made by its manufacturer, is not guaranteed or endorsed by the publisher.
References
Acharya, D., Singh, J. K., Kadel, R., Yoo, S. J., Park, J. H., and Lee, K. (2018). Maternal factors and utilization of the antenatal care services during pregnancy associated with low birth weight in rural Nepal: analyses of the antenatal care and birth weight records of the MATRI-SUMAN trial. Int. J. Environ. Res. Public Health 15 (11), 2450. doi:10.3390/ijerph15112450
Ahmed, R., and Alharbi, B. H. (2020). Evaluating air quality and pollution sources in Jubail industrial city. J. Environ. Sci. Technol. 14 (2), 85–95. doi:10.1016/j.jest.2020.03.007
Al-Kallas, S., Al-Mutairi, M., Abdel Basset, H., Abdeldym, A., Morsy, M., and Badawy, A. (2021). Climatological study of ozone over Saudi Arabia. Atmosphere 12, 1275. doi:10.3390/atmos12101275
Al-Zahrani, M. A., and Abdul-Wahab, S. A. (2015). Air quality levels in the industrial city of Jubail: assessment and implications. Environ. Monit. Assess. 187 (8), 1–12. doi:10.1007/s10661-015-4690-1
Al-Zboon, K., and Tening Forton, O. (2019). Indoor air quality in steel rolling industries and possible health effects. Environ. Nat. Resour. J. 17 (4), 20–29. doi:10.32526/ennrj.17.4.2019.28
Biswas, K., Chatterjee, A., and Chakraborty, J. (2020). Comparison of air pollutants between Kolkata and Siliguri, India, and its relationship to temperature change. J. Geovisualization Spatial Analysis 4, 25. doi:10.1007/s41651-020-00065-4
Dandotiya, B., Jadon, N., and Sharma, H. K. (2018). Effects of meteorological parameters on gaseous air pollutant concentrations in urban area of Gwalior City, India. Environ. Pollut. 22 (3), 150–160. doi:10.1016/j.envpol.2018.02.123
Danek, T., Weglinska, E., and Zareba, M. (2022). The influence of meteorological factors and terrain on air pollution concentration and migration: a geostatistical case study from Krakow, Poland. Scientific Reports 12, 11050. doi:10.1038/s41598-022-15160-3
Das, B., Bhave, P. V., Puppala, S. P., Adhikari, S., Sainju, S., Mool, E., et al. (2022). Emission factors and emission inventory of diesel vehicles in Nepal. Science of the Total Environment 812, 152539. doi:10.1016/j.scitotenv.2021.152539
Dumka, U. C., Kaskaoutis, D. G., Verma, S., Ningombam, S. S., Kumar, S., and Ghosh, S. (2021). Silver linings in the dark clouds of COVID-19: improvement of air quality over India and Delhi metropolitan area from measurements and WRF-CHIMERE model simulations. Atmospheric Pollution Research 12, 225–242. doi:10.1016/j.apr.2020.11.005
EEA (European Environment Agency) (2015). Air quality in Europe - 2015 report. EEA Report No. 5/2015.
Environmental Protection Agency (2020). Air quality and meteorological conditions. Available at: https://www.epa.gov/.
EPA (Environmental Protection Agency) (2018). Reducing emissions of hazardous air pollutants. Available at: https://www.epa.gov/haps/reducing-emissions-hazardous-air-pollutants#stat (Accessed April 27, 2019).
Filonchyk, M. (2022). Characteristics of the severe March 2021 Gobi Desert dust storm and its impact on air pollution in China. Chemosphere 287 (3), 132219. doi:10.1016/j.chemosphere.2021.132219
Khalil, M. A. K., Butenhoff, C. L., Porter, W. C., Almazroui, M., Alkhalaf, A., and Al-Sahafi, M. S. (2016). Air quality in Yanbu, Saudi Arabia. Journal of the Air and Waste Management Association 66 (4), 341–355. doi:10.1080/10962247.2015.1129999
Kumar, P., Hama, S., Omidvarborna, H., Sharma, A., Sahani, J., Abhijith, K. V., et al. (2020). Temporary reduction in fine particulate matter due to 'anthropogenic emissions switch-off' during COVID-19 lockdown in Indian cities. Sustainable Cities and Society 62, 102382. doi:10.1016/j.scs.2020.102382
Lelieveld, J., Klingmüller, K., Pozzer, A., Burnett, R. T., Haines, A., and Ramanathan, V. (2019). Effects of fossil fuel and total anthropogenic emission removal on public health and climate. Proceedings of the National Academy of Sciences 116 (15), 7192–7197. doi:10.1073/pnas.1819989116
Liu, Y., Zhou, Y., and Lu, J. (2020). Exploring the relationship between air pollution and meteorological conditions in China under environmental governance. Scientific Reports 10, 14518. doi:10.1038/s41598-020-71338-7
Mahato, S., Pal, S., and Ghosh, K. G. (2020). Effect of lockdown amid COVID-19 pandemic on air quality of the megacity Delhi, India. Science of the Total Environment 730, 139086. doi:10.1016/j.scitotenv.2020.139086
Miranda, A., Silveira, C., Ferreira, J., Monteiro, A., Lopes, D., Relvas, H., et al. (2015). Current air quality plans in Europe designed to support air quality management policies. Atmospheric Pollution Research 6, 434–443. doi:10.5094/apr.2015.048
Nagpure, A. S., and Gurjar, B. R. (2012). Development and evaluation of vehicular air pollution inventory model. Atmospheric Environment 59, 160–169. doi:10.1016/j.atmosenv.2012.04.044
NRC (National Research Council) (2001). Global air quality: an imperative for long-term observational strategies. Washington, DC: National Academy Press.
Otmani, A., Benchrif, A., Tahri, M., Bounakhla, M., Chakir, E. M., El Bouch, M., et al. (2020). Impact of COVID-19 lockdown on PM10, SO2 and NO2 concentrations in salé city (Morocco). Science of the Total Environment 735, 139541. doi:10.1016/j.scitotenv.2020.139541
Preradović, L., Ilić, P., Marković, S., and Janjušević, Z. (2011). Meteorological parameters and pollution caused by sulfur dioxide and their influence on construction materials and heritage. Environmental Science and Pollution Research 18 (5), 820–830. doi:10.1007/s11356-011-0467-3
Ramli, N. A., Md Yusof, N. F. F., Shith, S., and Suroto, A. (2020). Chemical and biological compositions associated with ambient respirable particulate matter: a review. Water, Air, and Soil Pollution 231, 120. doi:10.1007/s11270-020-04490-5
Rovira, J., Nadal, M., Schuhmacher, M., and Domingo, J. L. (2021). Environmental impact and human health risks of air pollutants near a large chemical/petrochemical complex: case study in Tarragona, Spain. Science of the Total Environment 787, 147550. doi:10.1016/j.scitotenv.2021.147550
Saber, A., Abdel Basset, H., Morsy, M., El-Hussainy, F. M., and Eid, M. M. (2020). Characteristics of the simulated pollutants and atmospheric conditions over Egypt. NRIAG Journal of Astronomy and Geophysics 9, 402–419. doi:10.1080/20909977.2020.1755479
Tasić, V., Kovačević, R., and Milošević, N. (2013). Investigating the impacts of winds on SO2 concentrations in Bor, Serbia. Journal of Sustainable Development of Energy, Water and Environment Systems 1 (6), 141–151. doi:10.13044/j.sdewes.2013.01.0010
Wang, Y., Liu, X., and Zhang, H. (2017). Trends in aerosol concentrations since the industrial revolution: implications for air quality and climate change. J. Environ. Sci. 45 (2), 123–135. doi:10.1016/j.jenvsci.2017.05.012
World Health Organization (2024). Air pollution. Available at: https://www.who.int/health-topics/air-pollution#tab=tab_1 (Accessed November 21, 2024).
Keywords: ambient air quality, jubail industrial city, gaseous pollutants, meteorological influence, industrial emission, Saudi Arabia
Citation: AlQahtani AI, Salama KF, Alwadei MM, Aljassim MT, Alsaif AS, Al-Warthan M and AlMulla AA (2024) Air quality levels in the industrial city of Jubail, Saudi Arabia. Front. Environ. Eng. 3:1483568. doi: 10.3389/fenve.2024.1483568
Received: 21 August 2024; Accepted: 25 November 2024;
Published: 11 December 2024.
Edited by:
Isidro A. Pérez, University of Valladolid, SpainReviewed by:
Banwari Dandotiya, Jiwaji University, IndiaYasser El Safori, Ain Shams University, Egypt
Copyright © 2024 AlQahtani, Salama, Alwadei, Aljassim, Alsaif, Al-Warthan and AlMulla. This is an open-access article distributed under the terms of the Creative Commons Attribution License (CC BY). The use, distribution or reproduction in other forums is permitted, provided the original author(s) and the copyright owner(s) are credited and that the original publication in this journal is cited, in accordance with accepted academic practice. No use, distribution or reproduction is permitted which does not comply with these terms.
*Correspondence: Khaled F. Salama, a3NhbGFtYUBpYXUuZWR1LnNh
 Abdullah I. AlQahtani
 Khaled F. Salama
 Manna M. Alwadei
 Mohammed T. Aljassim2
 Abdulaziz A. AlMulla