 Andrew M. Graham
 Seth Van Helten
 Samuel Lopez
94% of researchers rate our articles as excellent or good
Learn more about the work of our research integrity team to safeguard the quality of each article we publish.
Find out more
ORIGINAL RESEARCH article
Front. Environ. Chem., 30 August 2023
Sec. Inorganic Pollutants
Volume 4 - 2023 | https://doi.org/10.3389/fenvc.2023.1242813
This article is part of the Research TopicEnvironmental Chemistry of Mercury: Sources, Pathways, Transformations and ImpactView all 12 articles
Scant attention has been paid to cycling of total mercury (THg) and methylmercury (MeHg) in agriculturally intensive watersheds. Monitoring of Hg and MeHg in river basins provides valuable information on the efficacy of environmental policy and the impacts of land use and climate change on Hg fluxes and biogeochemistry. We report on Hg and MeHg yields in the Cedar River (Iowa), a major tributary of the Upper Mississippi River, and on Hg biogeochemistry in a floodplain of the lower Cedar River, with emphasis on Hg cycling in groundwater and wetland ponds. For the period 2016 to 2018, total Hg yields for the 21,000 km2 Cedar River watershed ranged from 2.6 to 6.9 μg m−2 yr−1, or 25% to 70% of estimated wet deposition, and MeHg yields ranged from 0.09 to 0.18 μg m−2 yr−1. High watershed transfer efficiencies for THg are driven by soil erosion and suspended sediment delivery. Policies and land management practices targeting soil conservation are thus likely to have significant impacts on downstream transport of Hg. Within alluvial groundwaters, Hg and MeHg concentrations were highly spatiotemporally variable, ranging from 0.5 to 2.0 ng/L for THg and 0.03–1.50 ng/L for MeHg. Microtopography exerted strong control on groundwater geochemistry and Hg biogeochemical cycling, with groundwater sampled from lower lying swales exhibiting less dissolved oxygen (DO), higher conductivity, higher dissolved organic carbon (DOC), and higher THg and MeHg. The alluvial aquifer exhibits high hydrologic connectivity with the river and groundwater THg and MeHg concentrations responded rapidly to hydrologic events, with MeHg concentrations increasing with a rising water table. Concentrations of THg and MeHg in wetland ponds were elevated compared to groundwater and most strongly correlated with DOC and UV-absorbance. Methylation potentials in pond sediments were among the highest reported for freshwater sediments, up to 0.15 d−1, which we hypothesize to be linked to high primary productivity associated with nutrient enrichment. Floodplain groundwaters and wetlands constitute important ecosystem control points for downstream MeHg delivery, the magnitude of which is sensitive to changing hydroclimate, especially flood frequency.
Mercury (Hg) contamination of aquatic and terrestrial ecosystems has deleterious consequences for wildlife and human health (Driscoll et al., 2013). Emissions inventories indicate that human activities (especially gold and silver production and coal combustion) have increased Hg in the present-day atmosphere by at least a factor of 3 relative to 1850 (Streets et al., 2017). Owing to its long residence time in the atmosphere, mercury can be deposited far from emission sources, resulting in contamination of remote terrestrial, freshwater, and marine ecosystems (Driscoll et al., 2013). Methylation of Hg by diverse bacteria and archaea carrying the hgcAB genes to produce bioaccumulative methylmercury (MeHg), predominantly in anoxic environments like sediments, wetlands, and saturated soils (Gilmour et al., 2013), is the main driver of risk associated with Hg contamination. The Minamata Convention on Mercury entered into force in 2017, and represents a global effort to significantly reduce anthropogenic Hg emissions. The effectiveness of the Minamata Convention will depend both on realizing intended emissions reductions and the impacts of changing climate and land use on the release and transport of large legacy Hg stores (Bishop et al., 2020). Climate and land use change also have potential to impact biogeochemical processing of Hg (e.g., Hg methylation and demethylation) and Hg bioaccumulation and trophic transfer (Krabbenhoft and Sunderland, 2013). In this paper, we explore unresolved aspects of terrestrial Hg cycling within a large river and its flood plain in the Upper Midwest United States–the Cedar River in Iowa.
Long-term monitoring of Hg and MeHg fluxes in large rivers has great utility for quantifying the export of Hg and MeHg from terrestrial watersheds and system response to environmental policy and climate change. In a review of terrestrial Hg cycling, Bishop et al. (2020) reported a global summary of MeHg and THg yields from rivers and streams. These workers reported median yields for diverse ecosystems (Arctic, forested, agricultural, and urban) to range from 1.45 to 4.77 μg m−2 y−1 for unfiltered THg and 0.017–0.080 μg m−2 y−1 for unfiltered MeHg. There are relatively few reports of THg and MeHg yields in agroecosystems, where yields for agricultural watersheds were reported to range from 0.53 to 4.90 μg m-2 y−1 (median = 2.69 μg m−2 y−1) for unfiltered THg and 0.026–0.120 μg m−2 y−1 (median = 0.063 μg m−2 y−1) for unfiltered MeHg (Bishop et al., 2020). In the Upper Mississippi River Basin (UMRB), work has focused mostly on Minnesota and Wisconsin rivers (Hurley et al., 1995; Babiarz et al., 1998; Balogh et al., 1998; Brigham et al., 2009), and is non-existent to our knowledge for rivers within the state of Iowa. Annual wet deposition of Hg in the UMRB is elevated. At the National Atmospheric Deposition Program (NADP) Mercury Deposition Network (MDN) station closest to the study site (station WI-031 in southern Wisconsin), Hg deposition has averaged 11.0 ± 2.7 μg/m2 between 2001–2018, with no discernible trend in either Hg wet deposition or precipitation Hg concentration (NADP, 2019). While Hg deposition has declined in portions of the eastern United States and Canada, increasing emissions outside of North America and long-range Hg transport have resulted in stable or increasing wet Hg deposition in the upper Midwestern United States (Weiss-Penzias et al., 2016). Earlier studies in the UMRB reported lower watershed transfer efficiencies for THg (the ratio of watershed export to wet deposition) in agricultural watersheds (Hurley et al., 1995) and increasing MeHg export with increasing wetland land cover (Hurley et al., 1995; Brigham et al., 2009). THg and MeHg export from agriculturally-dominated watersheds in the UMRB have since received little attention. Total suspended solids (TSS) yields in Minnesota and Wisconsin rivers are 4–20 times lower than that of Iowa and Illinois rivers (Heimann et al., 2011). We argue that determination of THg and MeHg export in high TSS rivers of the UMRB is worthy of further attention, as such watersheds may play a larger role in downstream THg and MeHg transport than previously recognized.
The impacts of climate change on terrestrial export of THg and MeHg are uncertain. Significant increases in river discharge (Jones et al., 2018b) and flood frequency (Mallakpour and Villarini, 2015) have occurred in the UMRB over the late 20th and early twenty-first centuries. Downscaled general circulation climate models project further increases in spring and winter flood events in this region (Neri et al., 2019). Within the Cedar River basin, the focus of this study, mean annual discharge from 1980–2019 was 61% higher than the period 1940–1979. Extreme discharge events within the basin have also increased, with about half of the top 1% discharge days and nearly 60% of the top 0.1% discharge days occurring within just the last 20 years. Increased flood events almost certainly lead to greater downstream THg and MeHg delivery. Quantifying the impact of increased flood frequency on THg and MeHg transport is a priority for assessing how climate change may impact the global biogeochemical cycle of Hg (Krabbenhoft and Sunderland, 2013). Furthermore, flood events may also represent “hot moments” of in situ MeHg production within river floodplains (Balogh et al., 2006; Gygax et al., 2019). Clarifying the timing of peak MeHg production relative to peak discharge is important for determining the scale of flooding impact on downstream MeHg delivery. There are few (Balogh et al., 2006) investigations of Hg biogeodynamics with respect to flooding within large river floodplains of the UMRB. Notably, there are no studies in river systems with exceptionally high nitrate loads, as is typical (Jones et al., 2018a) of Iowa rivers–whether high nitrate delivery to floodplains suppresses Hg methylation associated with iron and sulfate reduction remains an open question.
Lastly, the role of groundwater in THg and MeHg transport in the riparian zone warrants further attention. We are aware of only a handful of observational studies (Creswell et al., 2008; Bradley et al., 2010; 2011; 2012; Vidon et al., 2013) of MeHg and THg riparian groundwaters. In hydrologically connected floodplains, groundwater inputs may be an important source of riverine MeHg (Bradley et al., 2010). Groundwater geochemistry (e.g., alkalinity, redox active solutes like dissolved oxygen (DO), nitrate, Fe, and Mn, and dissolved organic carbon (DOC)) in floodplains can vary substantially over small spatial scales due to differences in sediment lithology (Schilling and Jacobson, 2012). Microtopographic variation in MeHg production is well documented for northern peatlands (Branfireun, 2004), and, given microtopographic control of other biogeochemical processes, we hypothesize that THg and MeHg concentrations in groundwater of temperate river floodplains likely show strong fine scale spatial variability. Characterizing the magnitude of this variability is important for designing sampling programs to quantify groundwater transport of THg and MeHg through terrestrial ecosystems.
In summary, our work has three major objectives, spanning multiple temporal and spatial scales.
1) To characterize THg and MeHg fluxes in a large river of the UMRB, in a region (the state of Iowa) for which little information on THg and MeHg fluxes exists.
2) To evaluate THg and MeHg transport, and MeHg production, within the river floodplain across seasons and in response to flood events.
3) To determine to what extent, if any, microtopography controls THg and MeHg dynamics
Sampling of shallow alluvial groundwaters and shallow wetland ponds occurred periodically from June 2016 to September 2018 at the Swamp White Oak (SWO) Nature Preserve, a Nature Conservancy-owned restored savanna oak forest dominated by Quercus bicolor (Dettman and Mabry, 2008), occupying the floodplain of the lower Cedar River in east-central Iowa near Conesville, Iowa (lat. 41°24′36″, long. 91°17′06″, see map in Figure 1). Samples were also collected nearby from the main channel of the Cedar River at the site of a United States Geological Survey (USGS) gaging station (USGS station number 05465000), for which continuous discharge measurements have been available since 1940. The Cedar River is a major tributary of the Upper Mississippi River, with a watershed area of approximately 20,200 km2 at the sampling station. Corn and soybean cultivation comprise the major land cover (72.5% of land area) with smaller areas of grasslands (14.9%, including pasture), forest (7%) and impervious surface (2.7%). The climate of the region is temperate, with hot, humid summers and cold, dry winters. Mean annual precipitation in nearby Muscatine, Iowa is 810 mm/year, with May, June, and July typically the wettest months of the year (NCEI Climatology Database). Long-term mean annual discharge of the Cedar River at Conesville, Iowa is 164 m3 s−1 (5,800 ft3 s−1).
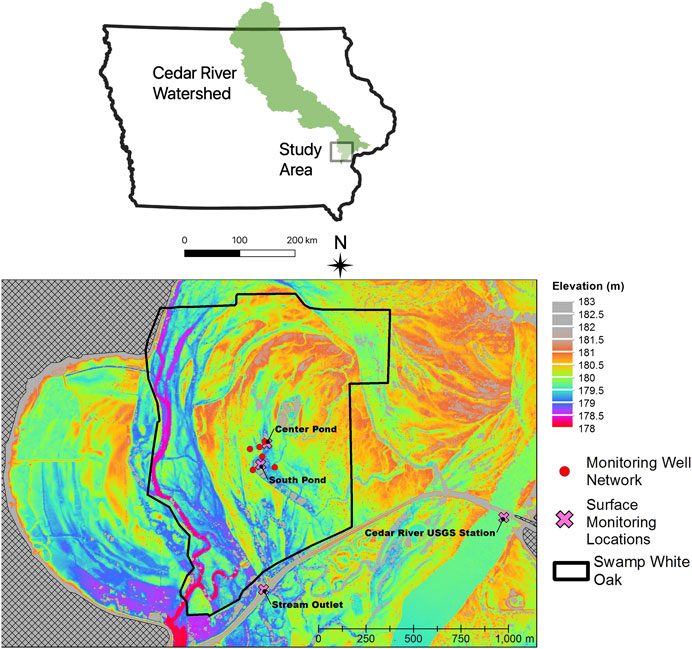
FIGURE 1. Map of Cedar River watershed showing approximate location of study area and detailed LiDAR digital elevation model of study area, showing locations of groundwater monitoring wells (red circles) and surface water monitoring stations (pink crosses).
A monitoring well network encompassing microtopographic highs (sandy ridges) and lows (silty swales) was installed in 2005 as part of studies of riparian hydrology, nutrient processing, and carbon dynamics within the SWO preserve (Schilling and Jacobson, 2009; 2012; 2015). Monitoring wells were installed to a depth of approximately 2 m with a 1.5 m long polyvinyl chloride (PVC) well-screen and 1.5 m long PVC riser (Schilling and Jacobson, 2009). The water table in these floodplain monitoring wells responds rapidly to Cedar River stage indicating a high level of hydrologic connectivity between the floodplain and the river (Schilling and Jacobson, 2009). Significant differences in groundwater quality, with respect to nitrate, DO, and DOC, exist between ridges and swales, with wells in microtopographic depressions exhibiting lower DO and nitrate and higher DOC (Schilling and Jacobson, 2012). Schilling and Jacobson (2009)A subset of three topographically “high” wells (>180.5 m land surface elevation; Center, West, and South) and three “low” wells (<180.5 m land surface elevation; North, East, and Swale) were selected for our study of Hg biogeochemistry.
All samples were collected utilizing a clean hands/dirty hands approach (Fitzgerald, 1999) to minimize sample contamination. Monitoring wells were sampled using a peristaltic pump with acid-washed Teflon tubing and a short piece of silicone tubing on the pump head. Prior to sampling, depth to water table was measured to the nearest cm using an electronic water level tape (Solinst Model 101). Wells were flushed for 2–3 min and allowed to recharge for a minimum of 1 h prior to sampling. Samples from the two ponds were collected by wading and filling a sample bottle at maximal reach from the area of sediment suspension caused by wading. Samples from the Cedar River and the SWO outlet stream were collected by lowering a virgin polyethylene terephthalate glycol (PETG) bottle or acid-washed Teflon bottle to a depth of about 30 cm below the water surface. All samples were stored in PETG bottles with zero headspace on ice until return to laboratory to minimize sample oxidation. DO, pH, specific conductance, and water temperature were measured immediately on a separate subsample using a multimeter (YSI Pro DSS or PASCO Xplorer GLX) with optical DO sensor. Samples for dissolved Fe(II) and sulfide were immediately filtered in the field through a 0.2 µm nylon membrane filter and preserved in ferrozine colorimetric reagent (1 mM ferrozine, 10 mM HEPES buffer) for Fe(II) analysis (Stookey, 1970) and sulfide antioxidant buffer (SAOB) for sulfide analysis (Clesceri et al., 2000).
Samples were returned to the laboratory, refrigerated, and processed within 24 h of collection. Samples were filtered through 0.45 µm glass fiber filters (baked for 4 h at 550OC in a muffle furnace and stored at room temperature in a double-bagged sealed plastic container) using an acid-washed PFA filtration assembly (Savillex; Eden Prairie, MN) into virgin PETG bottles. A known volume (generally about 150 mL) of filtrate was collected for both THg and MeHg and analyses and preserved with 1% trace metal grade HCl. Filters corresponding to particulate THg and MeHg were retrieved and stored frozen until analysis. All MeHg analyses were completed within 60 days, within the acceptable holding time (180 days) per EPA Method 1630 (US EPA, 1998). For THg, the majority of samples were analyzed with 90 days, the EPA recommended holding time (US EPA, 2002). 25% of samples (corresponding to THg samples from 7/7/17, 8/17/17, 7/19/18, and 9/4/18) were held acid-preserved and refrigerated up to 10–18 months prior to analysis. Prior work indicates that preserved THg samples are stable for at least 10 months (Parker and Bloom, 2005). Filtered THg samples for the Cedar River on 6/3/16 and 7/17/17 and particulate MeHg on 6/3/16 and 9/8/16 were lost during processing. A separate subsample of the filtrate was preserved with 2% HNO3 for other major and trace element analysis, carried out within 6 months of sample collection. Samples for anions and DOC were collected in 50 mL polypropylene tubes and stored frozen until analysis, typically within 30 days of sample collection.
In June and July of 2018, sediment cores were retrieved from the Center and South ponds at SWO via hand-coring with 5 cm diameter, 45 cm long polycarbonate tubes, predrilled at 1 cm intervals with openings sealed with silicone. Sediment cores were 12–16 cm in length and filled with overlying water leaving no headspace, capped with plastic seals wrapped in vinyl tape, and transported to the laboratory at ambient temperature. Upon return to the laboratory, cores were stored overnight at 4°C, then transferred the next day to incubators at field temperature (22.5°C–23.7°C) for in situ methylation potential determination or sectioned at 2 cm intervals for ambient total Hg (THg) and MeHg analyses. Sub-sectioned sediment core samples were homogenized and stored frozen until analysis.
Core injections for methylation potential (km) determination followed the method of Mitchell and Gilmour (2008). Sediment cores were injected at 1 cm intervals through the silicone septa with 100 µL of 4 μg/mL enriched 201HgCl2 (pre-equilibrated for 1 hour with 0.2 µm-filtered overlying water from the respective ponds). Injections were performed while moving the syringe needle in a back-and-forth motion while withdrawing the needle to try to evenly inject the 201Hg spike across the core’s entire cross-sectional area at each depth. After injection, the cores were incubated at site temperature in the dark for 3 h. Cores were then sectioned at 2 cm intervals and samples frozen for analysis.
Samples for MeHg (either filtered water, filters with particulate matter, or sediments) were analyzed by steam distillation, ethylation with sodium tetraethylborate, and isotope dilution gas chromatography inductively coupled plasma mass spectrometry (Hintelmann and Evans, 1997) using enriched Me199Hg as the internal standard (Oak Ridge National Laboratories, 91.95% 199Hg). All MeHg analyses were carried out with a manual purge and trap GC system as described in Kanzler et al. (2018) interfaced to an Agilent 7500ce ICP-MS. Quality assurance/quality control (QA/QC) measures included analysis of field blanks (filter blanks), distillation blanks, a certified reference material (NIST 1566b oyster tissue), and duplicate sample analyses. QA/QC data for MeHg analyses is summarized in Supplementary Table S1.
Sample digestion and analysis protocols for THg analyses differed depending on the subsample type. Filtered water samples for total Hg analysis were digested overnight in 1% BrCl. Filters (for particulate THg) and sediments were digested in 7:4 v/v HNO3:H2SO4 at 190°C for 2 h, diluted with deionized water (resistivity of 18.2 MΩ-cm), then preserved with 1% BrCl. For filtered water samples and filters, THg was determined by isotope dilution purge and trap dual gold trap Hg amalgamation coupled to ICP-MS. Briefly, a 50–100 mL sample was added to a bubbler with 100 µL of 20% w/v hydroxylamine hydrochloride (to reduce excess BrCl), 300 µL of 60 g/L SnCl2 reductant, and a known amount of enriched 201HgCl2 (Oak Ridge National Laboratories, 98.11% 201Hg) and purged for 15 min onto a sample trap containing glass beads coated with gold (Brooks Rand Instruments, Seattle WA). Gold sample traps were heated via a nichrome wire to release amalgamated Hg in a stream of argon gas onto a second gold trap (the analytical trap), which was heated to release Hg directly into the Agilent 7500ce ICP-MS. A small subset of filtered THg samples were analyzed by an automated total mercury analysis system (Brooks Rand Instruments MERX-T using SnCl2 reduction and dual gold trap amalgamation) interfaced to a Perkin Elmer Nexion 2000 ICP-MS. Sediment samples which had higher THg concentrations were analyzed by ICP-MS with flow injection reduction of Hg(II) to Hg(0) using 60 g/L SnCl2 in 1% HCl (Graham et al., 2012). QA/QC measures for THg analyses were identical to those for MeHg (except that NIST 2709a San Joaquin soil was used as certified reference material) and are summarized in Supplementary Table S1.
Dissolved Fe(II) was measured colorimetrically at 562 nm following complexation with ferrozine reagent (Stookey, 1970). Dissolved sulfide concentrations were measured using a sulfide ion selective electrode calibrated against a Pb-titrated sulfide standard (Clesceri et al., 2000). Major anion concentrations (chloride, nitrate, and sulfate) were determined using isocratic ion chromatography (Latchat 8000 series) with a carbonate eluent (2.6 mM Na2CO3 and 2.0 M NaHCO3, pH = 10.44) with conductivity detection and ion suppression. Major and trace element concentrations other than Hg were determined by ICP-MS using either an Agilent 7500 ce or Perkin Elmer Nexion 2000. DOC concentrations were determined using a Shimadzu TOC-VCSH/CSN analyzer. UV-Vis absorbance spectra were measured in quartz cuvettes on a Cary 60 UV-Vis spectrophotometer following addition of 0.2% w/v hydroxylamine hydrochloride to the sample to minimize interference due to formation of light scattering Fe(III) (oxy)hydroxides (Doane and Horwáth, 2010) upon sample storage after filtering. QA/QC measures for DOC, anions, and trace elements are provided in Supplementary Table S2.
Three methods were utilized for computing fluxes of THg and MeHg in the Cedar River. First, fluxes were estimated using the program LOADEST (Runkel et al., 2004) as implemented in R (R Core Team, 2019). LOADEST has the advantage of automated selection from multiple regression models using the Akaike Information Criterion, with computation of model coefficients using an adjusted maximum likelihood estimation (AMLE). A downside is the risk of overfitting given the relatively small number of observations (n = 16 across 3 years).
In a second approach, we calculated daily fluxes based on daily discharge and median THg or MeHg concentration. A third approach relied on using high resolution turbidity (5 min time interval) and discharge (at 15 min intervals) to estimate instantaneous fluxes at 15 min intervals. Turbidity data were available for a portion of 2018 (late February through mid-November), measured at the Conesville station at 5 min intervals (data retrieved from the Iowa Water Quality Information System; IWQIS: https://iwqis.iowawis.org/app/). The turbidity-based approach is discussed further in the results and discussion below. Fluxes were converted to yields by dividing the flux by the watershed area.
A hydrograph for the Cedar River during the study period is shown in Figure 2, and shows that discharge exceeded that required for overbank flow on several occasions during 2016–2018. The Fall 2016 event corresponds to the second largest discharge on record. Total unfiltered Hg concentrations in the Cedar River are also shown in Figure 2 and ranged from 1.6 to 14.6 ng/L (mean = 8.6 ± 3.4 ng/L, where uncertainty represents one standard deviation); median = 7.1 ng/L, n = 16), the bulk (nearly 80% on average) of which was particulate THg (mean = 6.7 ± 3.4 ng/L; median = 6.7 ng/L). No obvious seasonal trend is apparent, though few samples were collected during low flow winter months due to ice cover. Measured unfiltered THg concentrations are within the range reported by others during the 1990s and early 2000s for UMRB rivers at varying discharge scales (Hurley et al., 1995; Balogh et al., 1998; 2005). Particulate THg concentrations were strongly correlated to measured total suspended solids (TSS; r2 = 0.71, p = 0.0005), as shown in Supporting Information Supplementary Figure S2. Unfiltered THg concentrations were well correlated with discharge (r2 = 0.46, p = 0.004), likely due to a positive relationship between discharge and TSS.
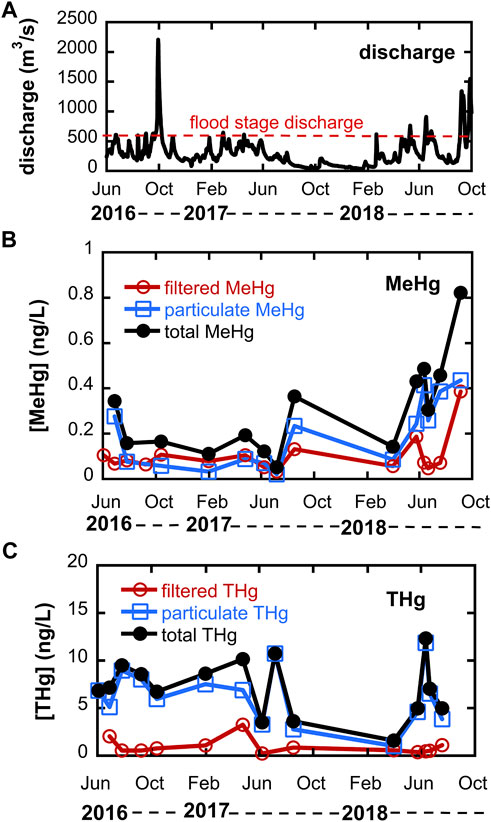
FIGURE 2. (A) hydrograph for Cedar River near Conesville, Iowa (USGS station number 05465000) during study period. Flood stage is 3.96 m, corresponding to a discharge of ∼594 m3/s. (B) Methylmercury (MeHg) distribution between 0.45 µm filtered and particulate phases; and (C) Total Hg (THg) distribution between 0.45 µm filtered and particulate phases. Note that summed totals for total MeHg or total THg do not include filtered THg data on 6/3/16 and 7/7/17 or particulate MeHg data for 6/3/16 and 9/8/16 due to sample loss.
Unfiltered MeHg concentrations in the Cedar River ranged from 0.05 to 0.82 ng/L (mean = 0.30 ± 0.21 ng/L; median = 0.25 ng/L, n = 14), with the particulate fraction accounting for about 64% of total MeHg. Total unfiltered MeHg was not strongly correlated with unfiltered THg (Supplementary Figure S2). The lower fraction of particulate MeHg compared to THg reflects stronger solid-solution partitioning for inorganic Hg relative to MeHg–calculated log Kd’s based on TSS (distribution coefficients with units of L kg-1) for THg averaged 4.89 vs 4.21 for MeHg. Measured log Kd’s are similar to that reported for Wisconsin rivers by Babiarz et al. (1998). The mean unfiltered MeHg concentration for the Cedar River is similar to the 0.20 ng/L reported for the Minnesota River (Balogh et al., 2005) but higher than that reported for agriculture-intensive watersheds in Wisconsin (mean MeHg = <0.03–0.085 ng/L) (Hurley et al., 1995). Approximately 4.8% of unfiltered THg was MeHg, also higher than that reported for predominantly agricultural watersheds in Wisconsin rivers (Hurley et al., 1995). The highest filtered MeHg concentrations were observed in October 2016 May 2018 and September 2018 following overbank flow events, consistent with the idea that the floodplain is a significant MeHg source area.
Annual THg and MeHg yields were estimated using the daily discharge data and measured concentrations (Table 1). Automated model selection for both THg and MeHg in LOADEST resulted in a model of the form:
where lnQ is the ln(observed daily discharge)—center of ln(daily discharge). In the case of THg, this model described 81.2% of the variability in THg flux (p < 0.0001), whereas the model for MeHg only explained 40.6% of the variability in MeHg flux (p = 0.0039). Yields calculated using LOADEST-derived fluxes ranged from 2.6 to 6.9 μg m-2 y-1 for THg and 0.09–0.18 μg m-2 y-1 for unfiltered MeHg. Using the median concentrations of unfiltered THg and MeHg, yields were estimated to be between 2.5 and 4.2 μg m-2 y-1 for THg and 0.09–0.15 μg m-2 y-1 for MeHg. The median concentration and LOADEST approaches agree closely for MeHg, but the median concentration approach results in lower yields for THg in wet years.
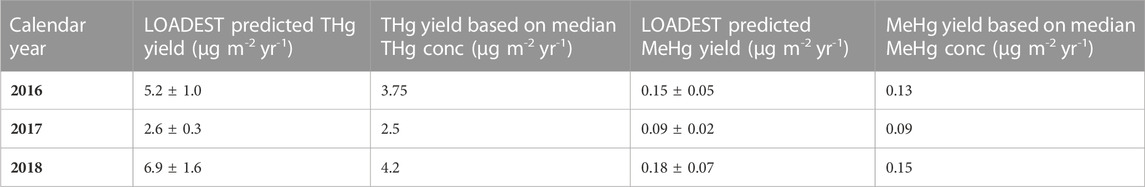
TABLE 1. Summary of annual Hg yields for the Cedar River watershed. Error estimates are standard errors derived from the LOADEST model.
An alternative approach for estimating THg yields is to use turbidity as a proxy measure of particulate THg concentration. Turbidity is strongly linearly correlated with TSS (Supplementary Figure S3, r2 = 0.96, p < 0.001) and TSS is strongly correlated with particulate THg (Supplementary Figure S2). A potential advantage of this approach is that turbidity and discharge measures are only weakly correlated (r2 = 0.01), an observation that is likely driven by significant discharge-TSS hysteresis, so the high-resolution turbidity measurements provide a more accurate real-time estimate of sediment flux not captured by the regression models. For example, during 2018, high turbidity occurred on the rising limb of the hydrograph, but fell much more quickly than discharge (Supplementary Figure S4). For 2018, where high resolution turbidity data were available, the particulate THg yield was estimated at 3.1 μg m-2 y-1 for the period 3/1 through 11/14/18. Assuming that the particulate THg flux is 80% of the total Hg flux (supported by concentration measurements in Figure 2C), the total Hg yield for this period would be 3.9 μg m-2 y-1, within 10% of the yield predicted based on median THg concentration (3.6 μg m-2 y-1 for the same interval). The LOADEST estimate for this same period is significantly higher, about 6.1 μg m-2 y-1. High resolution turbidity monitoring may be a useful proxy measure for THg in some watersheds (Riscassi and Scanlon, 2013; Vermilyea et al., 2017), as also demonstrated for phosphorus (Schilling et al., 2017), providing more accurate estimates of Hg fluxes especially under circumstances where suspended sediment delivery shows complex relationships with discharge (see Supplementary Figure S4).
Total unfiltered Hg and MeHg yields for the Cedar River are toward the higher end of what has been reported for agriculturally-dominated watersheds elsewhere in the Upper Midwest United States and even for many watersheds with much larger proportions of forests and wetlands (Bishop et al., 2020). Unfiltered MeHg and THg yields are above the 75th percentile (3.12 μg m-2 y-1 for THg, n = 80 and 0.091 μg m-2 y-1 for MeHg, n = 67) for all watersheds reviewed by Bishop et al. (2020). Hurley et al. (1995) reported mean watershed yields of 0.05 (fall) to 3.2 (spring) μg m-2 y-1 for unfiltered THg in agricultural watersheds in Wisconsin in the early 1990s. Balogh et al. (2005) reported THg yields of 0.3–6.4 μg m-2 y-1 for the Minnesota River and its tributaries in the early 2000s. Reported unfiltered MeHg yields range from 0.002 to 0.05 μg m-2 y-1 in Wisconsin rivers (Hurley et al., 1995) to 0.03–0.09 μg m-2 y-1 in Minnesota Rivers (Balogh et al., 2005). Wet deposition for the Cedar River watershed is estimated at 10–14 μg m-2 y-1 for the period 2016 to 2018 (NADP, 2019). Dry deposition and litter fall inputs of Hg within this watershed are not known [but are often similar in magnitude to wet deposition (Bishop et al., 2020)]. We are not aware of any local point sources of Hg within the watershed. Relative to wet deposition, observed THg yields thus represent watershed transfer efficiencies of about 25% to nearly 70%.
High THg yields likely reflect high TSS loads in rivers of this region. For 2018, we estimated TSS yield to be about 60 tons/km2, similar to long-term observations of sediment yields for Iowa rivers contributing to the Upper Mississippi River Basin (Heimann et al., 2011; Jones and Schilling, 2011). High TSS loads can drive high THg and MeHg yields even when mean Hg concentrations of soil particles are fairly low (median THg concentration of suspended sediments was 48 ng/g and median MeHg concentration was 1.5 ng/g). Changing climate (increased frequency of intense rainfall events (Mallakpour and Villarini, 2015)) and land management practices (e.g., bringing conservation reserve program (CRP) lands back into production) have potential to increase sediment yields, and hence Hg yields, in this region.
Riparian groundwaters and wetlands may be important sources of MeHg to the Cedar River. In order to understand biogeochemical processes controlling MeHg production, we monitored geochemistry in groundwater and surface waters within the adjacent river floodplain. Groundwater geochemistry was monitored in six shallow monitoring wells, representing three microtopographically “high” wells and three “low” wells over the period June 2016 through July 2018. The south well has the highest land elevation, but geochemistry was more similar to low wells. Hereafter, we exclude the south well from our analysis when discussing differences between low and high wells. Aquifer sediments at high wells tend to be coarser grained and have greater depth to water table (DWT) than low wells. Mean DWT was about 0.6 m greater in high wells (1.10 m) compared to low wells (0.47 m; p < 0.001 for one-way ANOVA). The rapid response of the water table elevation to Cedar River discharge is indicative of high hydrologic connectivity between the floodplain and the river. Supplementary Figure S5 shows the strong linear relationship (r2 = 0.78) between 5-day prior discharge of Cedar River and DWT at the swale well. Our results are in close agreement with insights provided by continuous monitoring of the water table in the center well from 2005–2007, which suggested a lag of 1–6 days between river discharge and water table elevation (Schilling and Jacobson, 2009).
Low and high wells also showed contrasting geochemistry. High wells had significantly lower specific conductance, higher DO, and lower DOC compared to low wells averaged across all sampling events (Supplementary Figure S6). Specific conductance was about 60% higher (p < 0.001 for one-way ANOVA) in low wells (mean = 352 ± 62 μS/cm) vs high wells (mean = 218 ± 51 μS/cm). DOC was about double (p < 0.001 for one-way ANOVA) in low wells (mean = 4.07 ± 1.74 mg/L) compared to high wells (mean = 2.09 ± 1.25 mg/L). Groundwater pH was similar across all wells (mean = 6.60 ± 0.34). Analysis of major cations and anions suggested similar distribution of ions (see Piper diagram in Supplementary Figure S7), though absolute concentrations were significantly higher in low wells compared to high wells, consistent with conductivity data. Alkalinity, estimated for these relatively hard groundwaters as the difference between strong base cation equivalents and strong acid anion equivalents, was nearly double for low wells (mean alkalinity = 2.74 meq/L) vs high wells (mean alkalinity = 1.35 meq/L). We posit that higher alkalinity and dissolved solids for low wells reflect greater rates of carbon mineralization at these sites, resulting in higher PCO2 in groundwater, thus driving increased dissolution of carbonate minerals. Increased dissolved inorganic carbon and carbonate mineral dissolution in shallow aquifers in response to increased soil respiration in summer months are well-documented in other similar systems (Tsypin and Macpherson, 2012). Alluvial sediments at the high and low sites contain similar organic carbon in surficial sediments, but low sites have 2–5 times more carbon at depths greater than or equal to 0.5 m (Schilling and Jacobson, unpublished data), supporting the idea that increased carbon availability leads to greater subsurface microbial activity in the low wells. This hypothesis is further supported by observations of DO in these shallow groundwaters, as an indicator of aerobic microbial activity. DO was about 60% higher (p = 0.001 for one-way ANOVA) across all high wells (mean = 3.5 ± 1.9 mg/L) compared to all low wells (mean = 2.2 ± 1.4 mg/L). No significant differences were observed between low and high wells for other indicators of terminal electron accepting processes, including nitrate, dissolved Fe(II), dissolved Mn, and sulfate (Supplementary Figure S6).
Filtered THg concentrations in shallow groundwater (mean = 0.87 ± 0.92 ng/L; median = 0.57 ng/L across all sampling sites and dates) were similar to that observed in the Cedar River (mean = 0.94 ± 0.83 ng/L). Filtered MeHg concentrations (mean = 0.16 ± 0.26 ng/L; median = 0.087 ng/L) were slightly higher than that observed for Cedar River (mean = 0.10 ± 0.08 ng/L). MeHg represented about 22% of filtered THg for all groundwater samples. These averages, however, may mask significant difference in Hg and MeHg concentrations in time and space within the alluvial aquifer. Figure 3 shows differences in THg and MeHg concentrations averaged across all sampling dates. Filtered THg concentrations generally ranged from 0.5 to 2 ng/L, with only a few exceptions, and were not significantly different between wells, though both the south well and swale well did have larger median concentrations. Greater spatial variability existed for MeHg concentrations, with MeHg concentrations ranging from below detection (0.029 ng/L) to nearly 1.5 ng/L (a 50-fold difference). MeHg represented as little as 1% of filtered THg to as much as 94%, with a mean of 22% across all sites and sampling dates. MeHg concentrations were greatest in the low-lying north and swale wells.
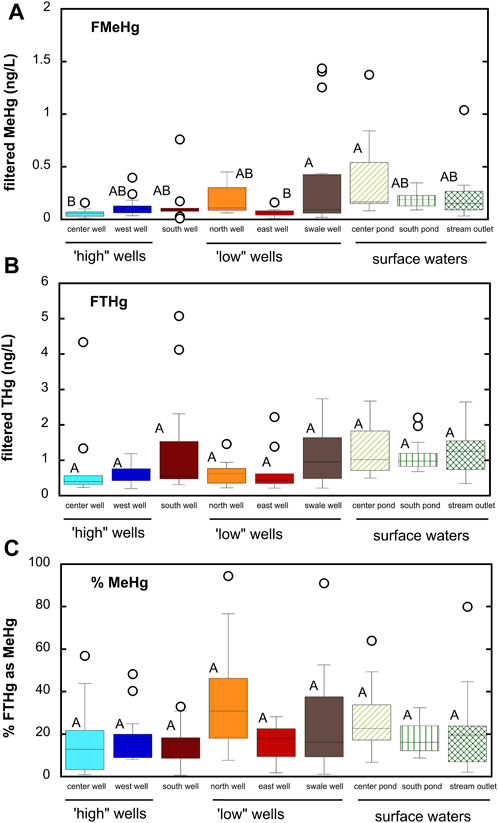
FIGURE 3. Box and whisker plots summarizing differences in MeHg and THg between microtopographically “high” and “low” wells and surface waters. South well is not classified as either “high” or “low”. (A) filtered MeHg; (B) filtered THg; (C) percent filtered THg as MeHg. Boxes represent 25th and 75th percentiles, line the median, and whiskers the 10th and 90th percentiles; points represent outliers. Stations that do not share a common letter are significantly different (α = 0.05) from one another based on one-way ANOVA and Tukey post hoc comparison.
There are few studies of Hg and MeHg in alluvial groundwater with which to compare our findings. Vidon et al. (2013) measured THg and MeHg in alluvial groundwaters at three sites in central Indiana and observed lower filtered THg concentrations medians ranging from 0.28 to 1.05 ng/L) and filtered MeHg concentrations (medians ranging from 0.01 to 0.05 ng/L (Vidon et al., 2013). The highest MeHg concentrations in groundwater at these sites were observed during the summer months of July and August. Creswell et al. (2008) reported THg concentrations in hyporheic wetland sediments from northern Wisconsin of 2–10 ng/L and MeHg concentrations of <0.05 to as much as 3 ng/L, more similar to the range of MeHg and THg concentrations we observe in these alluvial groundwaters in Iowa. Bradley et al. (2010) reported filtered MeHg concentrations ranging from 0.1 to greater than 1.5 ng/L in riparian pools fed by groundwater in a coastal plain floodplain of a blackwater stream in South Carolina. Filtered THg concentrations were reported to range from 1 to 10 ng/L in groundwater in a follow-up study (Bradley et al., 2012). Of these studies, the work of Vidon et al. (2013) is most similar in terms of geomorphic setting–a river floodplain developed on glacial outwash/alluvium with significant agriculture in upland portions of the watershed. Vidon et al. (2013) concluded that riparian zones in regions with low groundwater DOC may not contribute appreciable MeHg. Here, we show higher MeHg in groundwaters, especially in response to rapid groundwater table rise (see section 3.6 below), and suggest that such hydrologically connected floodplains do constitute important sources of MeHg during critical moments. For the Cedar River system, the moments of highest MeHg in groundwaters immediately precede the highest observed filtered MeHg concentrations in the Cedar River (Figure 2).
Comparing wells sampled on the same date (see Supplementary Figure S8), MeHg concentrations were on average about 2.5–7.9 times higher in the microtopographically low north and swale wells compared to the microtopographically high center and west wells. The low east well and unclassified south well were on average 1.8–3.7 times higher compared to the center well, but similar to the west well. Just as microtopography can influence carbon and nutrient cycling (Schilling and Jacobson, 2012), Hg dynamics are influenced by microtopography over very small spatial scales in this alluvial aquifer. We hypothesize that these microtopographic differences in groundwater MeHg reflect underlying geomorphic control on biogeochemical processing of carbon and other redox active solutes, as illustrated in the geochemical data in Supplementary Figure S6. Our finding highlights the need for consideration of microtopography in sampling design when investigating Hg biogeochemistry in groundwaters where small-scale spatial heterogeneity is likely to be important (e.g., river floodplains).
To better understand the controls on Hg speciation in these groundwaters, we examined relationships between MeHg and other geochemical variables (Table 2). Significant positive correlations were observed between filtered MeHg (FMeHg) and THg, DOC, absorbance at 254 nm (A254, a parameter that depends on both DOM concentration and DOM character, especially aromatic carbon content (Weishaar et al., 2003)), dissolved Fe(II), and temperature. The fraction of filtered THg as MeHg (%MeHg) positively correlated with DOC, A254, dissolved Fe(II) and Mn. The strong link between MeHg and DOC (r = 0.603) or A254 (r = 0.640) has been noted in numerous studies of surface waters and wetlands (Hall et al., 2008) and may relate to the role of DOM as a principal control of microbial community structure and function, including Hg methylation (Graham et al., 2018), the role of DOM in altering the bioavailability of inorganic Hg(II) for methylation (Graham et al., 2012), and/or increased aqueous partitioning of MeHg due to MeHg complexation by thiols in DOM (Skyllberg, 2008).
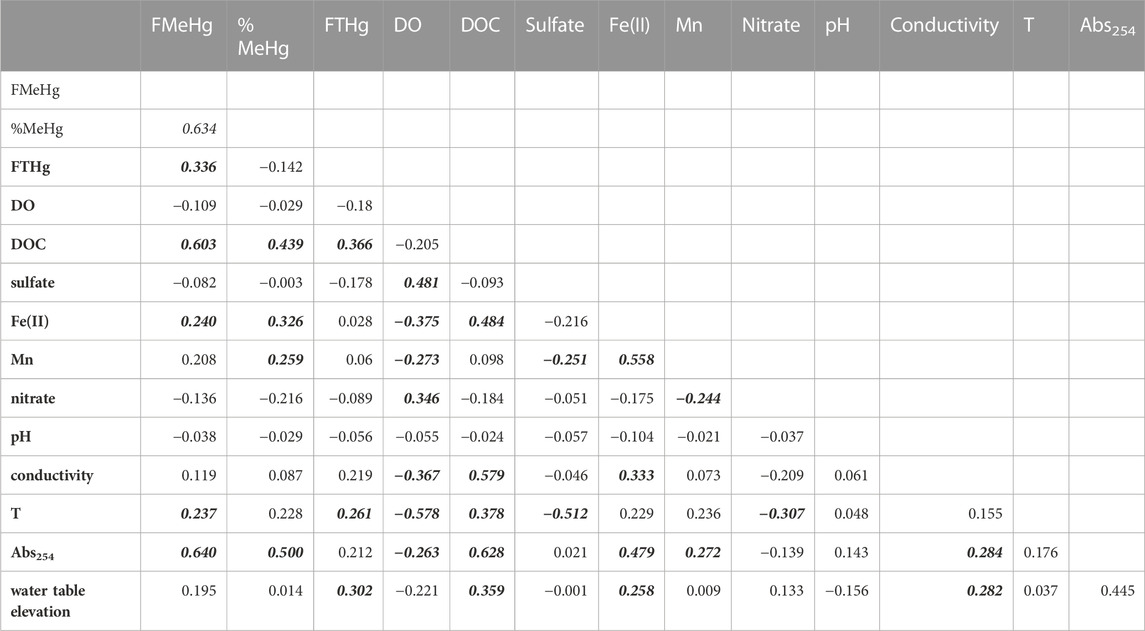
TABLE 2. Correlation matrix for groundwater samples. Correlation coefficients in bolded-italics indicate significance at α = 0.05 level.
Interestingly, we did not observe any significant correlation of MeHg or %MeHg with sulfate concentrations. The mean sulfate concentration across all groundwater sites was 20.7 ± 20.9 mg/L, about 35% lower than mean sulfate in the Cedar River. Sulfate reduction was evidenced by minima in sulfate during the summer months, as reflected in the inverse correlation of groundwater sulfate with temperature shown in Table 2. Dissolved sulfide was rarely detected above 2 µM (mean = 0.5 ± 1.9 µM; Supplementary Figure S6) and showed no significant correlation with sulfate. Precipitation of Fe-S minerals (e.g., mackinawite, FeS(s) (Rickard, 2006)) via reaction of sulfide with dissolved Fe(II) produced from dissimilatory Fe reduction may explain the low sulfide concentrations in these groundwaters. The highest sulfate concentrations, occasionally exceeding 100 mg/L, occurred during early spring, when groundwaters were more oxygen rich, suggesting internal cycling of sulfur stores in aquifer sediments (e.g., oxidation of reduced Fe-S minerals accumulating from prior sulfate and iron reduction). Compared to many sulfate-limited freshwater wetlands where Hg methylation has been extensively studied, sulfate supply may not limit Hg methylation in these systems and/or Hg methylation may be driven by microorganisms other than SRB (e.g., Fe-reducers, methanogens, or fermentative bacteria (Gilmour et al., 2013)). Recent studies investigating the diversity of hgcA in a variety of freshwater environments have shown that while Deltaproteobacteria (which includes SRB and FeRB) are often well-represented amongst Hg-methylators, other organisms, with diverse metabolisms, including those belonging to Firmicutes, Spirochaetota, Chloroflexota, Nitrospirota, and Methanomicrobia, can comprise an important fraction of the Hg-methylator community (Schaefer et al., 2014; Christensen et al., 2019; Jones et al., 2020; Xu et al., 2021).
Significant positive correlations between %MeHg and dissolved Fe(II) and Mn concentrations suggest that dissimilatory metal reduction may be important to Hg methylation in this system. Strong correlations between MeHg concentrations and dissolved Mn have been noted in agricultural wetlands (i.e., rice fields; (Alpers et al., 2014); and in a eutrophic reservoir (Beutel et al., 2020). We note that Geobacter, which include a number of species capable of Hg methylation (Gionfriddo et al., 2019), can reduce both Fe(III) and Mn(III,IV) (hydr)oxides (Richter et al., 2012). Mn(III,IV) hydroxides may also be reduced by dissolved Fe(II) (Schaefer et al., 2017), complicating interpretation of relationships between dissolved Mn and MeHg.
Wetland ponds represent another possible source of MeHg to the Cedar River. Total Hg and MeHg concentrations in the shallow wetland ponds tended to be greater than in groundwaters (Figure 3). Across all three wetland ponds, mean filtered MeHg was 0.26 ± 0.27 ng/L (median = 0.17 ng/L, n = 45) and mean filtered THg was 1.24 ± 0.65 ng/L (median = 1.02 ng/L, n = 45). Due to a combination of sediment suspension and primary production within these shallow wetland ponds and streams, these waters contain appreciable suspended particulate matter (Figure 4; mean SPM = 54.5 ± 71.4 mg/L; median SPM = 21.6 mg/L). Whole, unfiltered THg and MeHg concentrations are thus appreciably higher than filtered concentrations, averaging 4.89 ± 4.25 ng/L for THg (median = 2.96 ng/L) and 0.50 ± 0.48 ng/L for MeHg (median = 0.32 ng/L) respectively. Filtered MeHg comprised 55% ± 21% (median = 53%) of the total MeHg; for total Hg, this fraction was slightly lower, at 38% ± 24% (median = 37%). Distribution coefficients (log KD’s) for partitioning between the dissolved phase and suspended sediments averaged 4.5 ± 0.6 and 4.9 ± 0.5 for MeHg and THg respectively, similar to that observed for the Cedar River. In general, no significant differences in MeHg and THg concentrations or partitioning behavior were observed across the three wetland ponds, excepting higher THg in the south pond that had the highest suspended particulate matter.
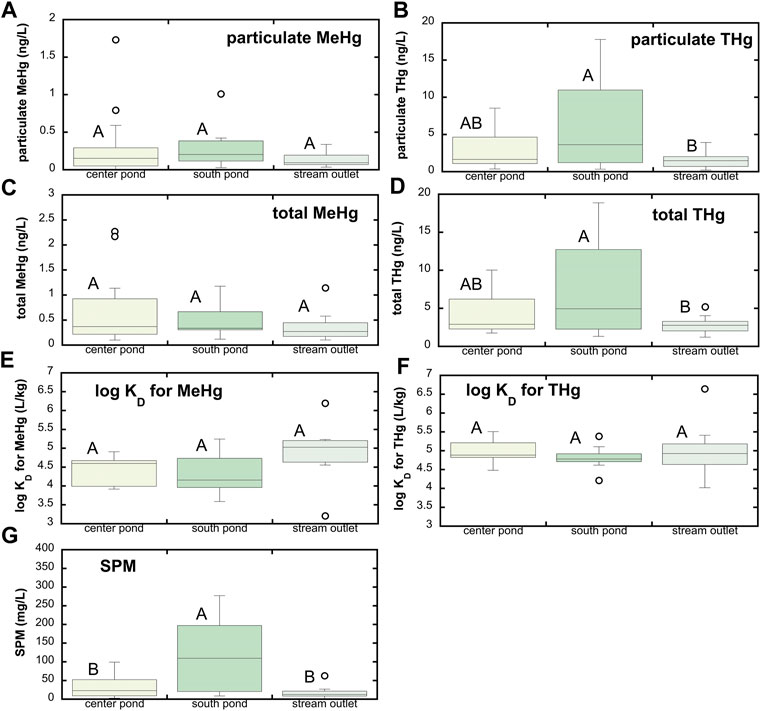
FIGURE 4. Hg speciation associated with suspended particulate matter (SPM) at SWO surface water sites. (A) Particulate MeHg; (B) particulate THg; (C) total MeHg (sum of filtered and particulate MeHg); (D) total THg (sum of filtered and particulate THg); (E) distribution coefficient (KD) for partitioning between dissolved phase and SPM for MeHg; (F) KD for THg; and (G) SPM. Boxes represent 25th and 75th percentiles, line the median, and whiskers the 10th and 90th percentiles; points represent outliers. Stations that do not share a common letter are significantly different (α = 0.05) from one another based on one-way ANOVA and Tukey post hoc comparison. Note that SPM was sampled beginning 4/25/17 and through last sample collection on 9/4/18, so panels e, f, and g correspond to that time frame only. Panels a–d include data from the full study period beginning in June 2016.
Similar to groundwater samples, we examined a correlation matrix of Hg species concentrations and associated geochemical and physical parameters for these wetland ponds (Table 3). Total MeHg was significantly correlated with dissolved Mn and the absorbance at 254 nm (Abs254), a parameter that reflects both DOM concentration and aromaticity (Weishaar et al., 2003). Total Hg was most strongly correlated with SPM and DOC. Several earlier studies have highlighted the link between DOM and MeHg in wetland systems. Hall et al. (2008) found that MeHg in wetlands in coastal Louisiana was highly correlated with the hydrophobic acid fraction of DOM, but weakly correlated with bulk DOC. Mitchell and Gilmour (2008) observed strong correlation of Hg methylation rates in wetland sediments with SUVA280 and slope ratio (SR) (Helms et al., 2008), spectroscopic measures mostly strongly related to DOM molecular weight and aromaticity. Our results suggest tight coupling of DOM and MeHg in inland wetlands within agriculturally-dominated regions of the UMRB. Recent advances in measuring individual low molecular weight (LMW) thiols (Liem-Nguyen et al., 2021) and sulfur-containing compounds in DOM by high-resolution mass spectrometry (HR-MS) (Mangal et al., 2022) indicate the importance of thiols to Hg methylation in freshwater wetlands, presumably by controlling Hg bioavailability to Hg-methylating organisms (Graham et al., 2012; 2017). Increased anthropogenic sulfur inputs in regions with intensive corn and soy cultivation appear likely as soils may become sulfur-depleted following acid deposition recovery (Hinckley et al., 2020). Such sulfur inputs could induce changes in microbial community structure (Jones et al., 2020) and/or Hg bioavailability for methylation due to complex linkages between sulfide, DOM, and Hg (Graham et al., 2017; Poulin et al., 2017) that alter MeHg production in terrestrial ecosystems.
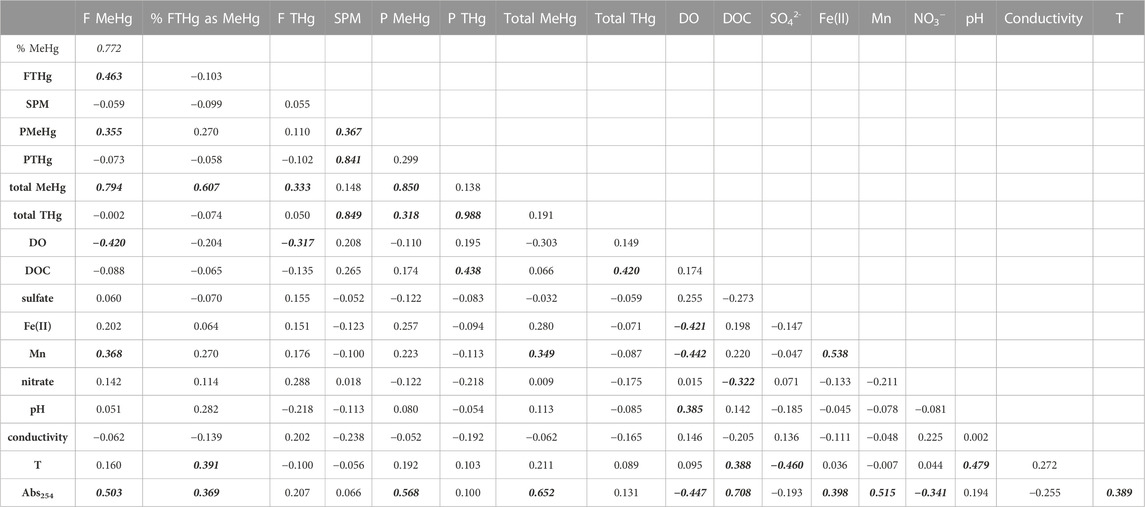
TABLE 3. Correlation matrix for SWO surface water samples. Correlation coefficients in bolded-italics indicate significance at α = 0.05 level.
Observations of Hg speciation in wetland waters were supplemented by measurements of Hg speciation and Hg methylation potentials in shallow sediment cores. Total Hg concentrations in wetland sediments were generally between 70 and 100 ng/g dry weight and generally decreased slightly with depth (Figure 5). MeHg concentrations were greatest in near surface sediments, reaching 1 ng/g dry weight, up to 1.6% of THg. Methylation potentials were determined in short term incubations with injection of enriched 201Hg pre-equilibrated with filtered surface water from each site and were greatest (kmeth exceeding 0.15 d-1) in surface sediments.
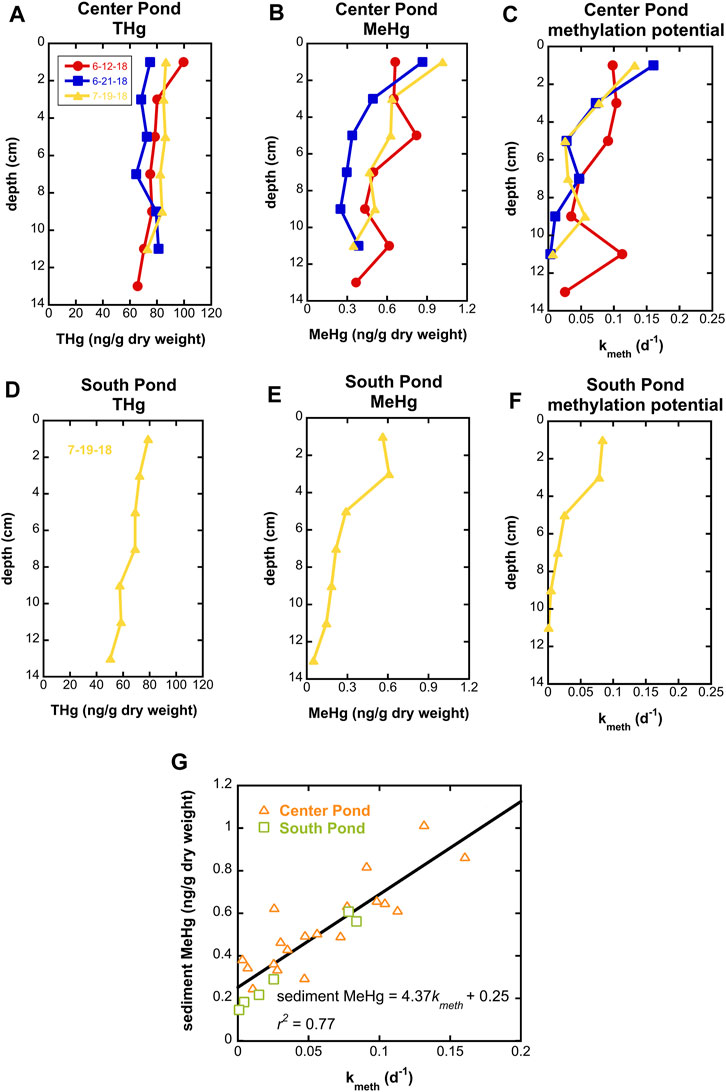
FIGURE 5. Total Hg, MeHg, and Hg methylation potential in center pond sediment cores on three dates in summer 2018 ((A-C) respectively) and a south pond sediment core on 7/19/18 (D-F). (G) shows correlation between Hg methylation potential (kmeth) and MeHg concentrations for all samples.
Surficial sediments in the SWO ponds have methylation potentials toward the upper end of the range reported previously for other freshwater wetlands (Hoggarth et al., 2015), indicative of robust Hg methylation potential within wetlands of the Cedar River floodplain. Interestingly, the %MeHg observed in sediments (not exceeding 1.6%) is relatively low given the large values of kmeth observed. We hypothesize that MeHg degradation in SWO sediments may be comparatively fast and relatively invariant with depth, leading to the strong correlation between kmeth and MeHg in sediment (Figure 5G). Future studies at SWO will investigate biological and dark abiotic MeHg degradation processes, which, apart from MeHg degradation by merB containing organisms, remain poorly understood (Barkay and Gu, 2022).
Geochemistry in groundwaters and wetlands can change rapidly in riparian zones with high hydrologic connectivity. During the summer of 2018, we sampled at SWO just before and after overbank flow events of the Cedar River (Figure 6). We observed that filtered Hg and MeHg concentrations in groundwater increased markedly immediately following flood conditions. In the low-lying swale well (Figure 6B), groundwater MeHg concentrations increased 17 to 35-fold (from as little as 0.04 ng/L to 1.4 ng/L) following flood events. THg concentrations also showed significant increases, about 5-fold (from 0.5 to 2.7 ng/L) following flooding. During this period, we observed tight coupling with DOC concentrations. We hypothesize that water table rise into the OM-rich surface soils results in leaching of both DOM and THg and supports high MeHg production. A similar trend for MeHg and THg following flooding was observed within the center pond wetland, but DOC was actually highest during the June sampling with the lowest MeHg (Figure 6C). Apparent mismatch between peak DOC and peak MeHg and THg at this site may relate to shifting sources of DOM within the pond that have differential impact on Hg bioavailbity for methylation. DOM may be transported into the pond via both overland flow and groundwater, as well as being produced autochthonously via leakage from phytoplankton. Periods of groundwater table rise or overland flow are likely to increase the delivery of allocthonous DOM. During dry periods, groundwater recharge of the pond will be reduced, and DOM will be mostly derived from algal biomass produced within the pond. Laboratory experiments indicate that high molecular weight, more aromatic allocthonous DOM is especially effective at enhancing Hg methylation by Hg-methylating bacteria (Graham et al., 2013).
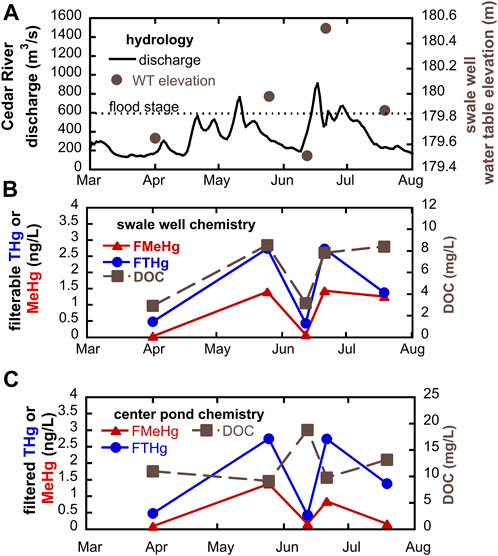
FIGURE 6. Response to flood events during summer 2018, showing (A) water table rise and fall in swale well; (B) groundwater chemistry in swale well; and (C) surface water chemistry in center pond.
Importantly, we see no evidence that delivery of nitrate rich water suppresses Hg methylation during flooding. Nitrate concentrations in the Cedar River averaged 6.5 ± 1.7 mg N/L during the 2018 sampling dates but were markedly lower in wetlands (0.43 ± 1.0 mg N/L) and alluvial groundwaters (0.21 ± 0.51 mg N/L) over the same period. Nitrate inputs have potential to suppress other less-energetically favorable terminal electron acceptor processes. If the suppressed processes are the dominant metabolisms associated with Hg methylation, then nitrate addition may inhibit microbial Hg methylation. Nitrate addition to a sulfate-rich stratified freshwater lake resulted in lowered MeHg concentrations in hypolimnetic waters, likely related to both shifts in terminal electron acceptor processes and the formation/stability of iron-oxide layers at the sediment-water interface that adsorb and store MeHg (Todorova et al., 2009; Matthews et al., 2013). In this system, we see no buildup of nitrate in either alluvial groundwaters or wetland surface waters at or near flood conditions. The supply of labile organic carbon in this system is likely sufficient to allow for rapid denitrification and less-energetically favorable microbial metabolisms associated with Hg methylation (e.g., iron and sulfate reduction and methanogenesis).
Clearly, flood events result in significant increases in Hg and MeHg available for transport within the Cedar River floodplain. We posit that river floodplains are important “control points” (Bernhardt et al., 2017) for downstream delivery of Hg and MeHg. Hydrologic connectivity between floodplain and river likely plays an important role in the efficiency of both stimulation of Hg methylation and subsequent Hg and MeHg transport. Flood frequency has increased in the central United States over the last 50-plus years (Mallakpour and Villarini, 2015). Streamflow estimates derived from coupled downscaled precipitation projects and a hillslope link model for the Cedar River basin project a 50% increase in the Cedar River discharge during a flood with a 100-year recurrence interval by the end of the 21st century (Quintero et al., 2018). While increased streamflow will almost certainly lead to increased fluxes of Hg and MeHg (see section 3.1), our results suggest this effect may be amplified, especially for MeHg, by increased MeHg production within riparian zones during floods. Climate change thus has potential to partially offset reductions in export of Hg and MeHg from terrestrial ecosystems achieved by emissions reductions via implementation of the Minamata Convention. Long-term monitoring of Hg and MeHg in fluvial systems could serve an important role in measuring the effectiveness of the Minamata Convention and climate-change driven changes in Hg biogeochemistry and transport.
There are few, if any, reports of MeHg or THg in rivers of Iowa or wetlands of the UMRB. MeHg concentrations measured at SWO (<0.03 to as much as 1.5 ng/L) fall within the range reported for lakes and wetlands in the upper plains region of the United States and Canada (Sando et al., 2007; Hall et al., 2009; Cowdery and Brigham, 2013; Hoggarth et al., 2015). MeHg concentrations in SWO groundwaters and wetlands were strongly correlated with DOC and reduced metal (Fe and Mn) species, suggesting a role for dissimilatory metal reduction in Hg methylation at these sites. Groundwater transport of dissolved MeHg and THg in river systems with high hydrologic connectivity between river and floodplain may play an underappreciated role in Hg and MeHg export from terrestrial ecosystems. Hg speciation and other geochemical variables show significant spatiotemporal variability on small scales (meters and days), linked to landscape position (geomorphic control) and water table elevation (hydrologic control). While fine-scale variability of DO and nutrient biogeochemistry within this landscape has been noted previously (Schilling and Jacobson, 2012) we extend that understanding to include trace element biochemistry. The reality of such fine-scale spatiotemporal variability highlights the importance of adequate sampling density in environmental monitoring and assessment for Hg in patchy landscapes, like ridge and swale floodplains.
We contend that riparian groundwaters and wetlands act as critical ecosystem control points (Bernhardt et al., 2017) for Hg trophic transfer in terrestrial ecosystems and downstream export of MeHg. MeHg concentrations increase rapidly in response to flood events, leading to increased transport and potential wildlife exposure. The SWO preserve is a high-value ecosystem that provides critical habitat for waterfowl and endangered reptiles and amphibians (SWO is part of a designated Amphibian and Reptile Conservation Area within the state of Iowa). Further studies on the impacts on wildlife in these ecosystems are warranted.
Total Hg and MeHg fluxes for the Cedar River watershed ranged from 2.6 to 6.9 μg m-2 yr-1 for THg and 0.09–0.18 μg m-2 yr-1 for MeHg. The THg flux can represent near 50% of total wet deposition in this region. The high watershed transfer efficiency of THg is almost certainly linked to high rates of soil loss and sediment transport. Our findings suggest that agricultural watersheds may be overlooked contributors of export of THg and MeHg from terrestrial ecosystems. Given the importance of suspended sediment to THg transport (and MeHg to a lesser extent), land use and management (e.g., soil conservation practices vs new land in production) and climate change (e.g., increased frequency and shifts in seasonality of extreme precipitation events) have the potential to alter riverine Hg and MeHg fluxes in this region. Long-term monitoring of Hg and MeHg fluxes in intermediate and large-scale watersheds like the Cedar River is a valuable tool for evaluating changes in the global biogeochemical cycle of Hg, such as land to sea fluxes, that are likely to change in response to implementation of the Minamata Convention and climate change.
The raw data supporting the conclusion of this article will be made available by the authors, without undue reservation.
AG designed and supervised the study. All authors contributed to field work, analytical work, and data analysis. AG wrote the first draft of the paper. All authors contributed to the article and approved the submitted version.
The authors gratefully acknowledge support from the Grinnell College Mentored Advanced Project program and National Science Foundation grant EAR 1919696. We appreciate additional field work and laboratory assistance from Vivian Cheslack, Ania Szlembarska, and Feven Getachew and helpful conversations with Peter Jacobson and Keith Schilling that improved the quality of this study.
The authors declare that the research was conducted in the absence of any commercial or financial relationships that could be construed as a potential conflict of interest.
All claims expressed in this article are solely those of the authors and do not necessarily represent those of their affiliated organizations, or those of the publisher, the editors and the reviewers. Any product that may be evaluated in this article, or claim that may be made by its manufacturer, is not guaranteed or endorsed by the publisher.
The Supplementary Material for this article can be found online at: https://www.frontiersin.org/articles/10.3389/fenvc.2023.1242813/full#supplementary-material
Alpers, C. N., Fleck, J. A., Marvin-DiPasquale, M., Stricker, C. A., Stephenson, M., and Taylor, H. E. (2014). Mercury cycling in agricultural and managed wetlands, yolo bypass, California: spatial and seasonal variations in water quality. Sci. Total Environ. 484, 276–287. doi:10.1016/j.scitotenv.2013.10.096
Babiarz, C. L., Benoit, J. M., Shafer, M. M., Andren, A. W., Hurley, J. P., and Webb, D. A. (1998). Seasonal influences on partitioning and transport of total and methylmercury in rivers from contrasting watersheds. Biogeochemistry 41, 237–257. doi:10.1023/a:1005940630948
Balogh, S. J., Meyer, M. L., and Johnson, D. K. (1998). Transport of mercury in three contrasting river basins. Environ. Sci. Technol. 32, 456–462. doi:10.1021/es970506q
Balogh, S. J., Nollet, Y. H., and Offerman, H. J. (2005). A comparison of total mercury and methylmercury export from various Minnesota watersheds. Sci. Total Environ. 340, 261–270. doi:10.1016/j.scitotenv.2004.08.013
Balogh, S. J., Swain, E. B., and Nollet, Y. H. (2006). Elevated methylmercury concentrations and loadings during flooding in Minnesota rivers. Sci. Total Environ. 368, 138–148. doi:10.1016/j.scitotenv.2005.09.045
Barkay, T., and Gu, B. (2022). Demethylation-the other side of the mercury methylation coin: A critical review. Acs Environ. Au 2, 77–97. doi:10.1021/acsenvironau.1c00022
Bernhardt, E. S., Blaszczak, J. R., Ficken, C. D., Fork, M. L., Kaiser, K. E., and Seybold, E. C. (2017). Control points in ecosystems: moving beyond the hot spot hot moment concept. Ecosystems 20, 665–682. doi:10.1007/s10021-016-0103-y
Beutel, M., Fuhrmann, B., Herbon, G., Chow, A., Brower, S., and Pasek, J. (2020). Cycling of methylmercury and other redox-sensitive compounds in the profundal zone of a hypereutrophic water supply reservoir. Hydrobiologia 847, 4425–4446. doi:10.1007/s10750-020-04192-3
Bishop, K., Shanley, J. B., Riscassi, A., Wit, H. A., Eklöf, K., Meng, B., et al. (2020). Recent advances in understanding and measurement of mercury in the environment: terrestrial Hg cycling. Sci. Total Environ. 721, 137647. doi:10.1016/j.scitotenv.2020.137647
Bradley, P. M., Burns, D. A., Murray, K. R., Brigham, M. E., Button, D. T., Chasar, L. C., et al. (2011). Spatial and seasonal variability of dissolved methylmercury in two stream basins in the eastern United States. Environ. Sci. Technol. 45, 2048–2055. doi:10.1021/es103923j
Bradley, P. M., Journey, C. A., Chapelle, F. H., Lowery, M. A., and Conrads, P. A. (2010). Flood hydrology and methylmercury availability in coastal plain rivers. Environ. Sci. Technol. 44, 9285–9290. doi:10.1021/es102917j
Bradley, P. M., Journey, C. A., Lowery, M. A., Brigham, M. E., Burns, D. A., Button, D. T., et al. (2012). Shallow groundwater mercury supply in a coastal plain stream. Environ. Sci. Technol. 46, 7503–7511. doi:10.1021/es301540g
Branfireun, B. A. (2004). Does microtopography influence subsurface pore-water chemistry? Implications for the study of methylmercury in peatlands. Wetlands 24, 207–211. doi:10.1672/0277-5212(2004)024[0207:dmispc]2.0.co;2
Brigham, M. E., Wentz, D. A., Aiken, G. R., and Krabbenhoft, D. P. (2009). Mercury cycling in stream ecosystems. 1. Water column chemistry and transport. Environ. Sci. Technol. 43, 2720–2725. doi:10.1021/es802694n
Christensen, G. A., Gionfriddo, C. M., King, A. J., Moberly, J. G., Miller, C. L., Somenahally, A. C., et al. (2019). Determining the reliability of measuring mercury cycling gene abundance with correlations with mercury and methylmercury concentrations. Environ. Sci. Technol. 53, 8649–8663. doi:10.1021/acs.est.8b06389
Clesceri L., Greenberg A. E., and Eaton, A. D. (Editors) (2000). Standard methods for the examination of water and wastewater (American Public Health Association).
Cowdery, T. K., and Brigham, M. E. (2013). Mercury in wetlands at the glacial Ridge National wildlife refuge, northwestern Minnesota, 2007-9. United States Geological Survey Scientific Investigations. Report 2013-5068.
Creswell, J. E., Kerr, S. C., Meyer, M. H., Babiarz, C. L., Shafer, M. M., Armstrong, D. E., et al. (2008). Factors controlling temporal and spatial distribution of total mercury and methylmercury in hyporheic sediments of the allequash creek wetland, northern Wisconsin. J. Geophys Res. Biogeosciences 113. doi:10.1029/2008jg000742
Dettman, C. L., and Mabry, C. M. (2008). Lessons Learned about Research and Management: A Case Study from a Midwest Lowland Savanna, U.S.A. Restor. Ecol. 16, 532–541. doi:10.1111/j.1526-100x.2008.00478.x
Doane, T. A., and Horwáth, W. R. (2010). Eliminating Interference From Iron(III) for Ultraviolet Absorbance Measurements of Dissolved Organic Matter. Chemosphere 78, 1409–1415. doi:10.1016/j.chemosphere.2009.12.062
Driscoll, C. T., Mason, R. P., Chan, H. M., Jacob, D. J., and Pirrone, N. (2013). Mercury as a Global Pollutant: sources, Pathways, and Effects. Environ. Sci. Technol. 47, 4967–4983. doi:10.1021/es305071v
Fitzgerald, W. F. (1999). “Clean hands, dirty hands: clair Patterson and the aquatic biogeochemistry of mercury,” in Clean hands: Clair patterson’s crusade against environmental lead contamination. Editor C. I. Davidson, 119–137.
Gilmour, C. C., Podar, M., Bullock, A. L., Graham, A. M., Brown, S. D., Somenahally, A. C., et al. (2013). Mercury Methylation by Novel Microorganisms from New Environments. Environ. Sci. Technol. 47, 11810–11820. doi:10.1021/es403075t
Gionfriddo, C., Podar, M., Gilmour, C., Pierce, E., and Elias, D. (2019). ORNL compiled mercury methylator Database. Available at: https://www.osti.gov/dataexplorer/biblio/dataset/1569274.
Graham, A. M., Aiken, G. R., and Gilmour, C. C. (2013). Effect of Dissolved Organic Matter Source and Character on Microbial Hg Methylation in Hg–S–DOM Solutions. Environ. Sci. Technol. 47, 5746–5754. doi:10.1021/es400414a
Graham, A. M., Aiken, G. R., and Gilmour, C. C. (2012). Dissolved Organic Matter Enhances Microbial Mercury Methylation Under Sulfidic Conditions. Environ. Sci. Technol. 46, 2715–2723. doi:10.1021/es203658f
Graham, A. M., Cameron-Burr, K., Hajic, H., Lee, C., Msekela, D., and Gilmour, C. C. (2017). Sulfurization of Dissolved Organic Matter Increases Hg–Sulfide–Dissolved Organic Matter Bioavailability to a Hg-Methylating Bacterium. Environ. Sci. Technol. 51, 9080–9088. doi:10.1021/acs.est.7b02781
Graham, E. B., Gabor, R. S., Schooler, S., McKnight, D. M., Nemergut, D. R., and Knelman, J. E. (2018). Oligotrophic Wetland Sediments Susceptible to Shifts in Microbiomes and Mercury Cycling with Dissolved Organic Matter Addition. Peerj 6, e4575. doi:10.7717/peerj.4575
Gygax, S., Gfeller, L., Wilcke, W., and Mestrot, A. (2019). Emerging Investigator Series: mercury Mobility and Methylmercury Formation in a Contaminated Agricultural Flood Plain: influence of Flooding and Manure Addition. Environ. Sci. Process Impacts 21, 2008–2019. doi:10.1039/c9em00257j
Hall, B. D., Aiken, G. R., Krabbenhoft, D. P., Marvin-DiPasquale, M., and Swarzenski, C. M. (2008). Wetlands as Principal Zones of Methylmercury Production in Southern Louisiana and the Gulf of Mexico Region. Environ. Pollut. 154, 124–134. doi:10.1016/j.envpol.2007.12.017
Hall, B. D., Baron, L. A., and Somers, C. M. (2009). Mercury Concentrations in Surface Water and Harvested Waterfowl from the Prairie Pothole Region of Saskatchewan. Environ. Sci. Technol. 43, 8759–8766. doi:10.1021/es9024589
Heimann, D. C., Sprague, L. A., and Blevins, D. W. (2011). Trends in suspended-sediment loads and concentrations in the Mississippi River Basin, 1950-2009. U.S. Geological Survey Scientific Investigations. Report 2011-5200.
Helms, J. R., Stubbins, A., Ritchie, J. D., Minor, E. C., Kieber, D. J., and Mopper, K. (2008). Absorption Spectral Slopes and slope Ratios as Indicators of Molecular Weight, Source, and Photobleaching of Chromophoric Dissolved Organic Matter. Limnol. Oceanogr. 53, 955–969. doi:10.4319/lo.2008.53.3.0955
Hinckley, E.-L. S., Crawford, J. T., Fakhraei, H., and Driscoll, C. T. (2020). A Shift in Sulfur-Cycle Manipulation From Atmospheric Emissions to Agricultural Additions. Nat. Geosci. 13, 597–604. doi:10.1038/s41561-020-0620-3
Hintelmann, H., and Evans, R. D. (1997). Application of Stable Isotopes in Environmental Tracer Studies – Measurement of Monomethylmercury (CH3Hg+) by Isotope Dilution ICP-MS and Detection of Species Transformation. Fresenius’ J. Anal. Chem. 358, 378–385. doi:10.1007/s002160050433
Hoggarth, C. G. J., Hall, B. D., and Mitchell, C. P. J. (2015). Mercury Methylation in High and Low-Sulphate Impacted Wetland Ponds Within the Prairie Pothole Region of North America. Environ. Pollut. 205, 269–277. doi:10.1016/j.envpol.2015.05.046
Hurley, J. P., Benoit, J. M., Babiarz, C. L., Shafer, M. M., Andren, A. W., Sullivan, J. R., et al. (1995). Influences of Watershed Characteristics on Mercury Levels in Wisconsin Rivers. Environ. Sci. Technol. 29, 1867–1875. doi:10.1021/es00007a026
Jones, C. S., Nielsen, J. K., Schilling, K. E., and Weber, L. J. (2018a). Iowa Stream Nitrate and the Gulf of Mexico. PLOS One 13, e0195930. doi:10.1371/journal.pone.0195930
Jones, C. S., and Schilling, K. E. (2011). From Agricultural Intensification to Conservation: sediment Transport in the Raccoon River, Iowa, 1916–2009. J. Environ. Qual. 40, 1911–1923. doi:10.2134/jeq2010.0507
Jones, C. S., Schilling, K. E., Simpson, I. M., and Wolter, C. F. (2018b). Iowa Stream Nitrate, Discharge and Precipitation: 30-Year Perspective. Environ. Manage 62, 709–720. doi:10.1007/s00267-018-1074-x
Jones, D. S., Johnson, N. W., Mitchell, C. P. J., Walker, G. M., Bailey, J. V., Pastor, J., et al. (2020). Diverse Communities of hgcAB + Microorganisms Methylate Mercury in Freshwater Sediments Subjected to Experimental Sulfate Loading. Environ. Sci. Technol. 54, 14265–14274. doi:10.1021/acs.est.0c02513
Kanzler, C. R., Lian, P., Trainer, E. L., Yang, X., Govind, N., Parks, J. M., et al. (2018). Emerging Investigator Series: methylmercury Speciation and Dimethylmercury Production in Sulfidic Solutions. Environ. Sci. Process Impacts 20, 584–594. doi:10.1039/c7em00533d
Krabbenhoft, D. P., and Sunderland, E. M. (2013). Global Change and Mercury. Science 341, 1457–1458. doi:10.1126/science.1242838
Liem-Nguyen, V., Skyllberg, U., and Björn, E. (2021). Methylmercury formation in boreal wetlands in relation to chemical speciation of mercury(II) and concentration of low molecular mass thiols. Sci. Total Environ. 755, 142666. doi:10.1016/j.scitotenv.2020.142666
Mallakpour, I., and Villarini, G. (2015). The Changing Nature of Flooding Across the Central United States. Nat. Clim. Change 5, 250–254. doi:10.1038/nclimate2516
Mangal, V., Lam, W. Y., Huang, H., Emilson, E. J. S., Mackereth, R. W., and Mitchell, C. P. J. (2022). Molecular Correlations of Dissolved Organic Matter with Inorganic Mercury and Methylmercury in Canadian Boreal Streams. Biogeochemistry 160, 127–144. doi:10.1007/s10533-022-00944-6
Matthews, D. A., Babcock, D. B., Nolan, J. G., Prestigiacomo, A. R., Effler, S. W., Driscoll, C. T., et al. (2013). Whole-Lake Nitrate Addition for Control of Methylmercury in Mercury-Contaminated Onondaga Lake, NY. Environ. Res. 125, 52–60. doi:10.1016/j.envres.2013.03.011
Mitchell, C. P. J., and Gilmour, C. C. (2008). Methylmercury Production in a Chesapeake Bay Salt Marsh. J. Geophys Res. Biogeosciences 113. doi:10.1029/2008jg000765
National Atmospheric Deposition Program (2019). National atmospheric deposition program 2018 annual summary. Madison, WI: Wisconsin State Laboratory of Hygiene, University of Wisconsin-Madison.
Neri, A., Villarini, G., and Napolitano, F. (2019). Statistically-Based Projected Changes in the Frequency of Flood Events Across the U.S. Midwest. J. Hydrol. 584, 124314. doi:10.1016/j.jhydrol.2019.124314
Parker, J. L., and Bloom, N. S. (2005). Preservation and Storage Techniques for Low-level Aqueous Mercury Speciation. Sci. Total Environ. 337, 253–263. doi:10.1016/j.scitotenv.2004.07.006
Poulin, B. A., Ryan, J. N., Nagy, K. L., Stubbins, A., Dittmar, T., Orem, W. H., et al. (2017). Spatial Dependence of Reduced Sulfur in Everglades Dissolved Organic Matter Controlled by Sulfate Enrichment. Environ. Sci. Technol. 51, 3630–3639. doi:10.1021/acs.est.6b04142
Quintero, F., Mantilla, R., Anderson, C., Claman, D., and Krajewski, W. (2018). Assessment of Changes in Flood Frequency Due to the Effects of Climate Change: implications for Engineering Design. Hydrology 5, 19. doi:10.3390/hydrology5010019
R Core Team (2019). R: A language and environment for statistical computing. Vienna, Austria: R Foundation for Statistical Computing. Available at: https://www.R-project.org/.
Richter, K., Schicklberger, M., and Gescher, J. (2012). Dissimilatory Reduction of Extracellular Electron Acceptors in Anaerobic Respiration. Appl. Environ. Microb. 78, 913–921. doi:10.1128/aem.06803-11
Rickard, D. (2006). The Solubility of FeS. Geochim. Cosmochim. Ac 70, 5779–5789. doi:10.1016/j.gca.2006.02.029
Riscassi, A. L., and Scanlon, T. M. (2013). Particulate and Dissolved Mercury Export in Streamwater Within Three Mid-Appalachian Forested Watersheds in the US. J. Hydrol. 501, 92–100. doi:10.1016/j.jhydrol.2013.07.041
Runkel, R. L., Crawford, C. G., and Cohn, T. A. (2004). Load Estimator (LOADEST): A FORTRAN Program for Estimating Constituent Loads in Streams and Rivers. U.S. Geological Survey. doi:10.3133/tm4A5
Sando, S. K., Krabbenhoft, D. P., Johnson, K. M., Lundgren, R. F., and Emerson, D. G. (2007). Mercury and methylmercury in water and bottom sediments of wetlands at lostwood national wildlife refuge, north Dakota, 2003-04. United States Geological Survey Scientific Investigations. Report 2007-5219.
Schaefer, J. K., Kronberg, R. M., Morel, F. M. M., and Skyllberg, U. (2014). Detection of a key Hg methylation gene,hgcA, in wetland soils: detection of the Hg methylation gene, hgcA, in soils. Env. Microbiol. Rep. 6, 441–447. doi:10.1111/1758-2229.12136
Schaefer, M. V., Handler, R. M., and Scherer, M. M. (2017). Fe(II) Reduction of Pyrolusite (β-MnO2) and Secondary Mineral Evolution. Geochem T 18, 7. doi:10.1186/s12932-017-0045-0
Schilling, K. E., and Jacobson, P. J. (2015). Temporal Variations in Dissolved Oxygen Concentrations Observed in a Shallow Floodplain Aquifer. River Res. Appl. 31, 576–589. doi:10.1002/rra.2759
Schilling, K. E., and Jacobson, P. (2012). Spatial Relations of Topography, Lithology, and Water Quality in a Large River Floodplain. River Res. Appl. 28, 1417–1427. doi:10.1002/rra.1531
Schilling, K. E., and Jacobson, P. (2009). Water Uptake and Nutrient Concentrations Under a Floodplain Oak Savanna During a Non-Flood Period, lower Cedar River, Iowa. Hydrol. Process 23, 3006–3016. doi:10.1002/hyp.7403
Schilling, K. E., Kim, S.-W., and Jones, C. S. (2017). Use of Water Quality Surrogates to Estimate Total Phosphorus Concentrations in Iowa Rivers. J. Hydrol. Reg. Stud. 12, 111–121. doi:10.1016/j.ejrh.2017.04.006
Skyllberg, U. (2008). Competition Among Thiols and Inorganic Sulfides and Polysulfides for Hg and MeHg in Wetland Soils and Sediments Under Suboxic Conditions: illumination of Controversies and Implications for MeHg Net Production. J. Geophys Res. Biogeosciences 113. doi:10.1029/2008jg000745
Stookey, L. L. (1970). Ferrozine -- A New Spectrophotometric Reagent for Iron. Anal. Chem. 42, 779–781. doi:10.1021/ac60289a016
Streets, D. G., Horowitz, H. M., Jacob, D. J., Lu, Z., Levin, L., Schure, A. F. H. T., et al. (2017). Total Mercury Released to the Environment by Human Activities. Environ. Sci. Technol. 51, 5969–5977. doi:10.1021/acs.est.7b00451
Todorova, S. G., Driscoll, C. T., Matthews, D. A., Effler, S. W., Hines, M. E., and Henry, E. A. (2009). Evidence for Regulation of Monomethyl Mercury by Nitrate in a Seasonally Stratified, Eutrophic Lake. Environ. Sci. Technol. 43, 6572–6578. doi:10.1021/es900887b
Tsypin, M., and Macpherson, G. L. (2012). The effect of Precipitation Events on Inorganic Carbon in Soil and Shallow Groundwater, Konza Prairie LTER Site, NE Kansas, USA. Appl. Geochem. 27, 2356–2369. doi:10.1016/j.apgeochem.2012.07.008
United States Environmental Protection Agency (1998). Method 1630: Methyl mercury in water by distillation aqueous ethylation purge and trap and cold vapor atomic fluorescence spectrometry. Washington, D.C. United States Environmental Protection Agency.
United States Environmental Protection Agency (2002). Cold vapor atomic fluorescence spectrometry. Washington, D.C. United States Environmental Protection Agency.Method 1631, Revision E: mercury in Water by Oxidation, Purge and Trap
Vermilyea, A. W., Nagorski, S. A., Lamborg, C. H., Hood, E. W., Scott, D., and Swarr, G. J. (2017). Continuous Proxy Measurements Reveal Large Mercury Fluxes from Glacial and Forested Watersheds in Alaska. Sci. Total Environ. 599, 145–155. doi:10.1016/j.scitotenv.2017.03.297
Vidon, P. G., Mitchell, C. P. J., Jacinthe, P.-A., Baker, M. E., Liu, X., and Fisher, K. R. (2013). Mercury Dynamics in Groundwater Across Three Distinct Riparian Zone Types of the US Midwest. Environ. Sci. Process Impacts 15, 2131–2141. doi:10.1039/c3em00254c
Weishaar, J. L., Aiken, G. R., Bergamaschi, B. A., Fram, M. S., Fujii, R., and Mopper, K. (2003). Evaluation of Specific Ultraviolet Absorbance as an Indicator of the Chemical Composition and Reactivity of Dissolved Organic Carbon. Environ. Sci. Technol. 37, 4702–4708. doi:10.1021/es030360x
Weiss-Penzias, P. S., Gay, D. A., Brigham, M. E., Parsons, M. T., Gustin, M. S., and Schure, A. ter (2016). Trends in Mercury Wet deposition and Mercury Air Concentrations across the U.S. and Canada. Sci. Total Environ. 568, 546–556. doi:10.1016/j.scitotenv.2016.01.061
Keywords: mercury, methylmercury, floodplain, groundwater, climate change
Citation: Graham AM, Van Helten S, Wadle A, Mamrak E, Morsch J, Lopez S and Smith K (2023) Mercury transport and methylmercury production in the lower Cedar River (Iowa) floodplain. Front. Environ. Chem. 4:1242813. doi: 10.3389/fenvc.2023.1242813
Received: 19 June 2023; Accepted: 17 August 2023;
Published: 30 August 2023.
Edited by:
Robert Peter Mason, University of Connecticut, United StatesReviewed by:
Brett Poulin, University of California, Davis, United StatesCopyright © 2023 Graham, Van Helten, Wadle, Mamrak, Morsch, Lopez and Smith. This is an open-access article distributed under the terms of the Creative Commons Attribution License (CC BY). The use, distribution or reproduction in other forums is permitted, provided the original author(s) and the copyright owner(s) are credited and that the original publication in this journal is cited, in accordance with accepted academic practice. No use, distribution or reproduction is permitted which does not comply with these terms.
*Correspondence: Andrew M. Graham, Z3JhaGFtYW5AZ3Jpbm5lbGwuZWR1
†Present address: Katherine Smith, Department of Crop and Soil Sciences, College of Agricultural, Human, and Natural Resource Sciences, Washington State University, Pullman, WA, United States
Disclaimer: All claims expressed in this article are solely those of the authors and do not necessarily represent those of their affiliated organizations, or those of the publisher, the editors and the reviewers. Any product that may be evaluated in this article or claim that may be made by its manufacturer is not guaranteed or endorsed by the publisher.
Research integrity at Frontiers
Learn more about the work of our research integrity team to safeguard the quality of each article we publish.