 C. W. Cuss
 C. Guéguen
- Trent University, Peterborough, ON, Canada
The molecular mass distribution (MMD) and fluorescence properties of dissolved organic matter (DOM) are important characteristics for tracing and predicting its pathways, processes, and fate in aquatic systems. For the first time, asymmetrical flow field-flow fractionation (AF4) with coupled absorbance and fluorescence detectors was used to determine the contribution of endmembers to three mixtures of leaf leachate and riverine DOM in various proportions. Parallel factor analysis (PARAFAC) and fractogram deconvolution were used to decompose and distinguish the size distributions and fluorescence excitation-emission matrices (EEMs) of mixture constituents. It was determined that: 1) Both size and optical properties were conservative tracers in mixtures; 2) Fractogram deconvolution was extremely helpful for discriminating endmember size properties; 3) The contributions of endmembers to overall DOC concentration were accurately estimated using both the proportion of a humic-like PARAFAC component (0.93 < R2 < 1.00), and the ratios of deconvoluted peaks (0.88 < R2 < 0.98). The fluorescence at the peak maximum of the MMD was lacking in protein-/polyphenol-like and microbial humic-like fluorescence compared to the whole sample (−11 ± 9 and −10 ± 7%, respectively); however, the contribution of endmembers to the MMD (A254) were also effectively predicted using both the proportion of a microbial humic-like PARAFAC component (0.91 < R2 < 0.98) and the ratio of deconvoluted peaks (0.94 < R2 < 0.98).
1 Introduction
Dissolved organic matter (DOM) is a ubiquitous mixture of molecules originating from the release and subsequent decomposition of material from living and decaying organisms. In natural waters, DOM modulates the toxicity and mobility of heavy metals and other pollutants (Guéguen and Dominik, 2003; Aiken et al., 2011), reacts with chlorine to produce carcinogenic disinfection by-products during water treatment (Beggs and Summers, 2011; Pifer and Fairey, 2012), and serves as a primary source of energy and nutrients for microorganisms (Zepp et al., 2006; Bernhardt and McDowell, 2008).
Recent efforts have begun connecting sources of DOM to their fate, transport and mobility in surface waters. For example, increases in the DOC concentration of forested streams during rainfall events have been linked to throughfall and surficial runoff pathways in the riparian zone using end-member mixing analyses based on element concentrations and absorbance (Van Gaelen et al., 2014). Elevated levels of riverine DOM and nutrients observed during spring flush have also been linked to plant material from leaf litter, surface soils, and shallow soil waters based on lignin concentration and isotopic tracers (Sebestyen et al., 2008; Spencer et al., 2008). The contribution of endmembers to the size and optical properties of mixtures has been estimated using DOM extracts (i.e., Suwannee River fulvic acid; Aldrich humic acid), and algae-derived DOM (Hur et al., 2006; Yang and Hur, 2014).
The fluorescence properties of DOM have been widely used to shed light on DOM dynamics and biogeochemical cycling (Fellman et al., 2010 and references therein), including distinguishing hydrologic flow paths in forested watersheds (Johnson et al., 2011). Parallel factor (PARAFAC) analysis of excitation-emission matrices (EEMs; Coble, 1996) has been especially effective for deconvoluting and extracting the complex fluorescence signatures associated with DOM (Stedmon and Bro, 2008), in turn facilitating allochthonous source differentiation (Cuss and Guéguen, 2013), endmember discrimination (Yang and Hur, 2014), tracing (Stedmon et al., 2003), and estimation of value for supporting microbial processes (Sleighter et al., 2014; Cuss and Guéguen, 2015a). When algal DOM was mixed with Suwannee River fulvic acid extract standard, DOM fluorescence and absorbance exhibited linear changes with endmember DOC contributions; however, changes in fluorescence indices and molecular mass proxies (e.g., BIX, HIX, FI, and S-parameter) were non-linear (Yang and Hur, 2014).
Endmember contributions from mixed DOM standards have been successfully resolved using size-exclusion chromatography (SEC; Hur et al., 2006). However, SEC requires high ionic strengths (∼0.1 M) that do not reflect most natural waters, and can misrepresent the size distribution of DOM through non-size exclusion interactions and the shearing of large particles (Podzimek, 2011). Further, the extremely low pH required to extract fulvic and humic acids can cause irreversible changes in the properties of fresh allochthonous DOM (Cuss et al., 2014). On the other hand, the shear forces in asymmetrical flow field flow fractionation (AF4) are much lower, and the pH and ionic strength of its carrier fluid can be adjusted to match physicochemical conditions similar to natural waters. Separation using AF4 has proven useful for characterizing DOM sources based on their size properties (Baalousha and Lead, 2007; Guéguen and Cuss, 2011; Pifer and Fairey, 2012; Cuss and Guéguen, 2013; Stolpe et al., 2014). The size and optical properties of DOM measured using AF4 with offline fluorescence have also been used as a tracer of delayed mixing across a large boreal river (Xue J.-P. et al., 2022); however, no studies have yet determined whether the size and optical properties of DOM can be used to determine the relative contributions of DOC from endmembers in mixtures of natural riverine DOM and leaf leachates.
In this study, endmember mixing experiments were conducted using different proportions of DOM collected from balsam and willow leaf leachates, and from a river, to determine whether their contributions to the overall DOC concentration could be determined using their size and optical properties. Absorbance and fluorescence measurements were combined with molecular mass distributions measured using AF4, to provide a thorough and fine-grained assessment of endmember contributions and resolvability. Fractograms were deconvoluted into distinct underlying peaks, and PARAFAC was used to separate EEMs into independent fluorescent components.
2 Materials and Methods
2.1 Leaf Leachates and River Samples
The methods used for the collection, storage, and leaching of leaves are detailed in a prior study (Cuss and Guéguen, 2013). Briefly, senescent leaves and needles of A. balsamea (balsam fir; BL) and Salix bebbiana (Bebb’s willow; WL) were respectively stripped and shaken from branches, air dried for 24 h, and frozen for storage. Leaching was conducted in the dark at 5°C by placing 3.4 and 5.9 g of thawed needles (mixtures 1 and 2), and 2.0 g of thawed leaves (mixture 3) into a glass beaker and adding 200 ml of purified Milli-Q water (MQW; ≤ 18.2 MΩ cm−1). The resulting leachate was discarded and the beaker was refilled with fresh MQW after one and three hours to remove surface contamination, and the five-hour leachate was filtered and used for analysis. Three samples were collected from the Otonabee River under baseflow conditions between June and November (OR1-3). Prior to analysis, all samples were sequentially vacuum filtered through 0.7- and 0.2-μm pre-combusted glass fiber and polycarbonate filters (Millipore), respectively.
Previous work has demonstrated that changes in pH, conductivity and concentration can impact DOM fluorescence and mixing curve linearity (Kothawala et al., 2013; Cuss et al., 2014; Yang and Hur, 2014). Hence, endmembers were diluted with AF4 carrier fluid (buffer) to control and replicate the physicochemical conditions of local headwaters. The carrier fluid was created using MQW adjusted to a pH of 6 and a conductivity of 220 μS cm−1 with NaOH and NaCl (Sigma-Aldrich). The endmembers were diluted so that A254 at the fractogram peak maximum (Mp) was ≤0.02 AU. Diluted samples were used to compose mixtures, and for all analyses. The instrumental analysis of the endmembers commenced within two hours of filtration and all analyses were completed within nine days of sample collection. Two-component mixtures of leachates and riverine DOM were composed by mixing endmembers in proportions of 100, 90, 70, 50, 30, 10, and 0% based on the relative intensities of A254 (Mp) (Table 1). Samples were acidified for storage and analyzed for DOC concentration within one week using a TOC analyzer (Shimadzu TOC-VCPH). A range of optical and size properties of the DOM endmembers and mixtures were measured, and tested as potential predictors of DOC concentration and A254 (Mp) (Figure 1).
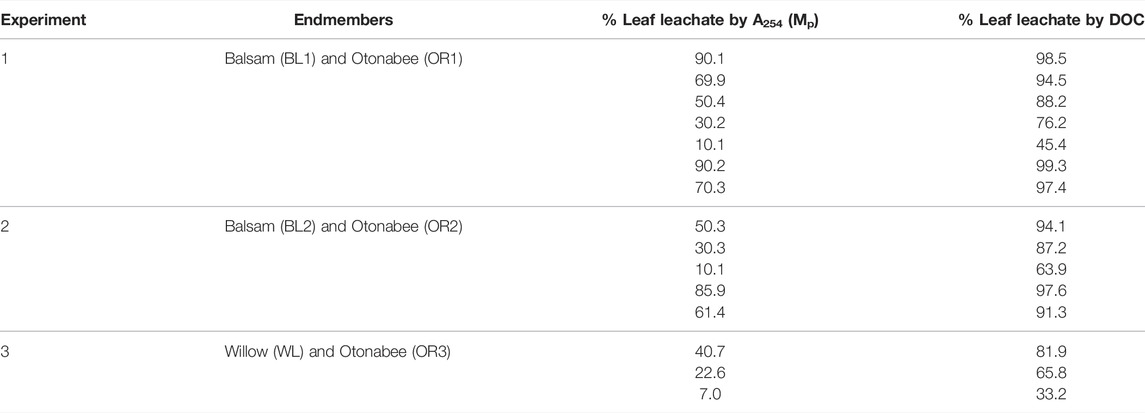
TABLE 1. Endmember contributions to DOC and absorbance at the fractogram peak maximum of mixtures.
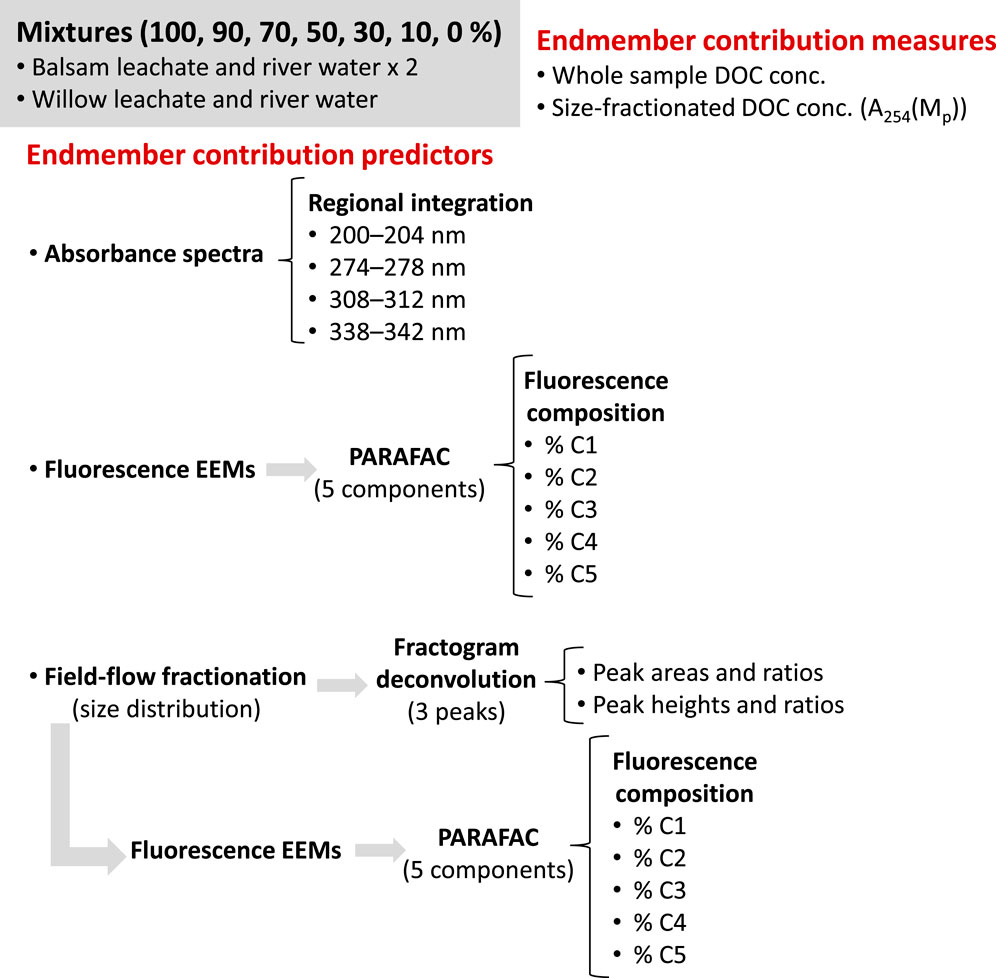
FIGURE 1. Mixing experiment schematic showing the measurements and associated data analyses that were assessed as potential predictors for endmember contributions.
2.2 Instrumental Analysis
Size and optical properties were measured using on-line asymmetrical flow field-flow fractionation (AF4; Postnova AF2000 FOCUS) coupled to UV-visible diode-array (Shimadzu SPD-M20A) and fluorescence detectors (Agilent 1200 series FLD, model G1321). Complete method details are reported elsewhere (Guéguen and Cuss, 2011; Cuss and Guéguen, 2013). After injecting 2 ml of sample into the 0.33-ml sample loop to minimize memory effects, fractionation was carried out under the following conditions, with a 500-μm spacer and a 300-Da polyethersulfone membrane (Postnova): tip, cross, and detector flow rates of 0.15, 2.2, and 0.4 ml min−1 for seven minutes of focussing, with 13 min of elution at the same constant cross and detector flow rates. Carrier-fluid blanks were run before each sample to ensure the absence of memory effects. To estimate the amount of balsam leachate lost through the separation membrane, mass spectra of the whole sample, size-fractionated sample, and the material that passed through the membrane during separation were measured by accumulating 948 MCA scans of each using an Applied Biosystems API3000 mass spectrometer (MS) operating in positive mode, with sample introduction via electrospray ionization (ESI). Positive mode was required to obtain a strong signal from the relatively low concentration of DOM that had passed through the AF4 membrane. Consequently, a sample of AF4 eluent was also analyzed, and sample spectra were corrected by removing mass-to-charge ratios that were associated with the carrier fluid. The average molecular mass of each sample was subsequently estimated by weighting the mass-to-charge (m/z) ratio of ions according to their intensity (I), so that average molecular mass = Σ (m/z)·I(m/z)/Σ(m/z) (Persson et al., 2005; Stubbins et al., 2014).
The absorbance fractogram measured at 254 nm (A254) was transformed directly into a molecular mass distribution (MMD) using calibration curves developed from twice-daily injections of a mixture of five molecules and macromolecules: rhodamine B (0.48 kDa), trypan blue (0.96 kDa), vitamin B12 (1.33 kDa), bovine cytochrome C (12.4 kDa), and egg white lysozyme (14.0 kDa) (Guéguen and Cuss, 2011). The molecular mass corresponding to the retention time of the fractogram maximum (Mp) is the center of the MMD, and therefore represents the dominant size fraction of light-absorbing DOM in each sample.
Fluorescence excitation-emission matrices (EEMs; Coble, 1996) were measured by fractionating an additional 2 ml of sample, and stopping system flow at MP. Multiple analyses using riverine DOM demonstrated that the MMD is highly reproducible (Mp = 1.192 ± 0.012 kDa, n = 8 over one day). The EEMs were measured in S/R mode by exciting the sample at wavelengths spanning the range from Ex = 200–450 nm in 1-nm increments, and measuring the corresponding emission over a wavelength range of Em = 280–600 nm in 5-nm increments. A smaller Ex wavelength interval than the typical 5 nm was chosen to improve the resolution of fluorescent components using PARAFAC. The Ex and Em wavelengths were calibrated following the manufacturer-recommended procedure.
Whole-sample absorbance was measured offline over the range of 200–700 nm in 1-nm increments using a double-beam scanning spectrophotometer (Shimadzu UV-2550), and were normalized to A254 to remove concentration effects. Mixtures were subsequently diluted to A200 ≤ 0.01 AU using AF4 carrier fluid to minimize inner-filtering effects during whole-sample fluorescence analysis. Whole-sample EEMs were measured using the Agilent 1200 series FLD by injecting the sample directly into an 8-μl cell designed for offline measurements. The EEMs of carrier fluid were used for blank corrections, and the cell was rinsed and flushed with >0.5 ml of sample prior to measuring each EEM. Intra-sample variation in whole-sample fluorescence was estimated by analyzing distinct injections of at least three subsamples for each mixture.
2.3 Data Pre-Processing and Analysis
The standard deviation at each wavelength, calculated over all whole-sample absorbance spectra within each mixing experiment, was used to locate wavelengths that exhibited high variation. The wavelengths with maximum variation differed slightly between experiments (1–3 nm), so that single wavelengths were not appropriate for comparison. Consequently, the maxima were incorporated by averaging absorbance across each of six wavelength bands: 200–204, 274–278, 308–312, and 338–342 nm.
The MMD was deconvoluted into underlying peaks (Di) using a modified version of the “peakfit” function in MatlabR 2010a (Mathworks, Inc.; Figure 2; O'Haver, 2012; Cuss and Guéguen, 2012). The optimal number of peaks was determined by increasing the number of peaks and using scree plots to assess the stability of the retention time of the predicted peak maxima, and the corresponding change in the root mean square error (RMSE; Cuss and Guéguen, 2012). In addition to measuring Mp and the molecular mass of deconvoluted peaks, the height [H (Di)] and area [A (Di)] of each Di were calculated (Figure 2). To eliminate concentration effects, the height and area of deconvoluted peaks were transformed into proportional variables for each mixture using ratios [e.g., A (D1)/A (D2)].
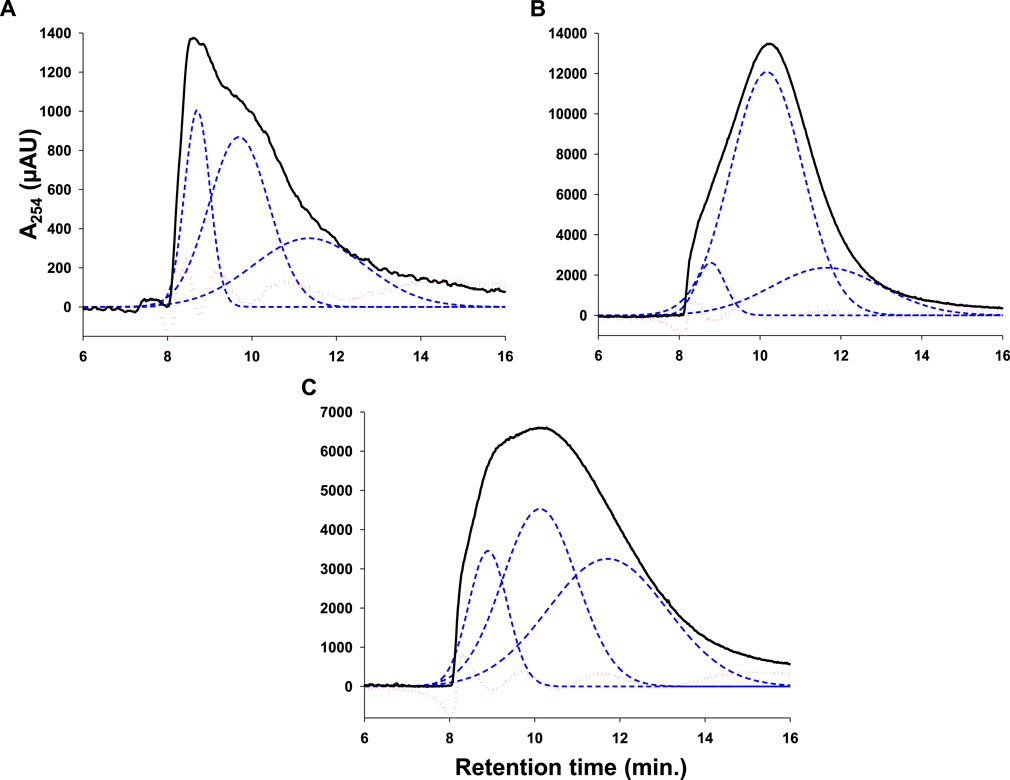
FIGURE 2. Fractograms (─), deconvoluted peaks (- - -), and model residuals (···) for (A) balsam (BL1), (B) Otonabee river (OR1), and (C) willow (WL) endmembers.
Parallel factor (PARAFAC) analysis was used to extract independent peaks from fluorescence EEMs using the drEEM toolbox (Murphy et al., 2013) in Matlab R2010a. The PARAFAC model was developed using a data set of 121 EEMs, comprised of whole samples and size-fractionated mixtures. The EEMs were standardized to Raman units using the area under the Raman water peak at Ex = 350 nm (Lawaetz and Stedmon, 2009), and background fluorescence was removed by subtracting an EEM of carrier fluid. To reduce noise, excitation wavelengths <230 nm and >430 nm, and emission wavelengths >550 nm were removed. The PARAFAC model was successfully four-fold, “S4C4T2” split-half validated for five components. To remove effects caused by concentration differences, PARAFAC loadings were transformed into fluorescence composition by dividing the loading of each component by the sum of all loadings within the same EEM (Cuss and Guéguen, 2012; Chen and Jaffé, 2014; Kothawala et al., 2014).
3 Results and Discussion
3.1 Endmember DOC and Absorbance
The DOC concentrations of endmembers were comparable for OR1-3 (3.2, 4.0, and 3.2 mg C L−1 for mixtures 1, 2, and 3, respectively). On the other hand, DOC concentrations were variable for BL (4.8 and 10.2 mg C L−1 for mixtures 1 and 2, respectively), and relatively high for willow (WL = 21.5 mg C L−1). Whole-sample A254 was much higher than A254 (Mp), and this relationship differed by endmember. For example, A254 (whole sample) was 59 times higher than A254 (Mp) for BL1 and only 11 times higher for OR1, and a similar difference in this ratio was found in the second mixture (52 times for BL2, 10 times for OR2) (Table 2). In general, leachates had a much higher ratio of A254 (whole sample) to A254 (Mp), suggesting that a lower proportion of DOM was present at Mp for leachates. This absent DOM could be lost through the separation membrane (i.e., MW < 300 Da), or present in regions of the fractogram that are poorly represented at Mp (e.g., centered at D1 in samples where Mp is centered at D2; Figure 2). Consequently, the proportion of DOC contributed to mixtures by each endmember was not always the same as the proportion of A254 (Mp) (Table 1). Analysis with ESI-MS determined that the average molecular mass of size-fractionated DOM was larger (320 Da) than that of the whole sample (298 Da) and the material that passed through the 300 Da membrane pores, suggesting that low-molecular-weight material passed through the membrane (Supplementary Figure S1).
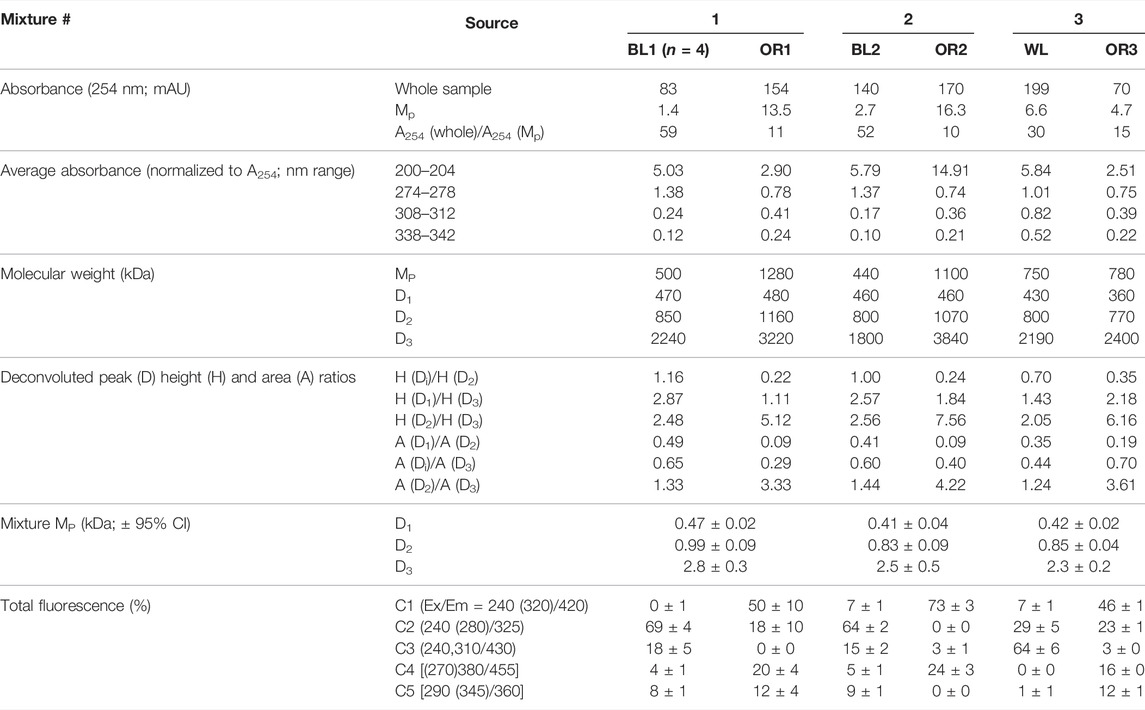
TABLE 2. Optical and size properties of mixing endmembers. PARAFAC components that compose a relatively large proportion of each source (>10%) are shown in bold type. Means are shown ± 1 SD where applicable, and n = 3 unless otherwise specified.
3.2 Size Properties
The molecular mass distribution (MMD) of leachates differed considerably following the addition of OR (Figure 3A). These fractograms were best fit using a three-peak deconvolution model, similar to previous findings for leaf leachates (Cuss and Guéguen, 2013). Variation in the fitted peak location (Mp), height, and area were very low for each fractogram (RSD <1%). The Mp of each deconvoluted peak was also relatively stable in each mixture (Table 2). Relationships between the proportion of endmember DOC and MP were primarily non-linear, as expected given the sudden transition from an MMD dominated by small leachate to that dominated by larger riverine DOM (Figures 1, 2A). Yet, strong linear relationships were evident between endmember DOC proportion and the ratio of deconvoluted peak heights and areas, emphasizing the improved resolving power of fractogram deconvolution (Table 3). Interestingly, the strongest linear relationship was found between the proportion of A254 (Mp) and H (D1)/H (D2) for mixtures (R2 = 0.98, 0.97, and 0.94 for mixtures 1 to 3, respectively), again suggesting that some DOC may not be well represented in the fractogram. Indeed, the strongest linear relationships for DOC contribution were associated with the ratio of the larger deconvoluted peaks, H (D2)/H (D3) (R2 = 0.88, 0.90, and 0.98, respectively). Such a mismatch is understandable given that the MMD of BL was centered at D1 and WL also contained a large proportion of DOM near the void peak (Figure 2), so that some low-molecular-weight DOC may have passed through the AF4 membrane. The Mp of WL (750 Da) was higher than for BL (440–500 Da), and the ratio of A254 (whole sample) to A254 (Mp) was lower for WL (30) compared to BL (52–60). These differences suggest that more DOM was retained by the AF4 membrane in mixtures containing high molecular mass WL (750 Da, Table 2), leading to the stronger relationship with DOC proportion that was observed. It has been previously demonstrated that the leachates of coniferous needles have a lower molecular mass than those of deciduous leaves (Cuss and Guéguen, 2013).
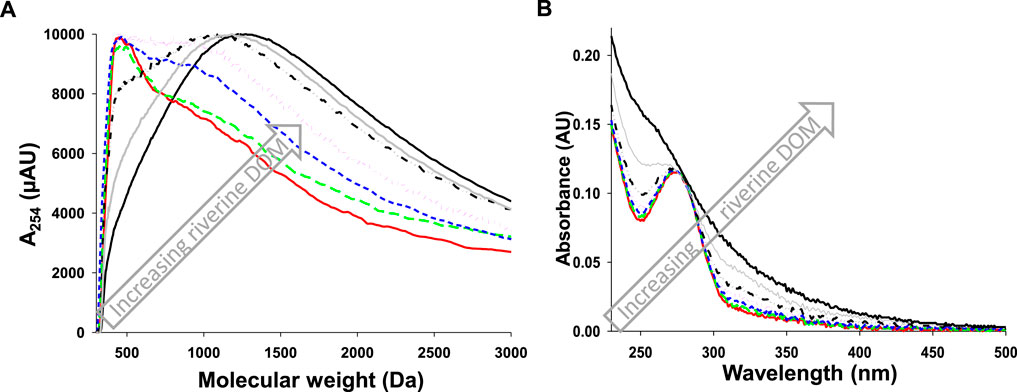
FIGURE 3. (A) Molecular mass distributions and (B) corresponding absorbance spectra for mixture 1 by proportion of BL1: ── 100%, - - - 90%, - - - 70%, ··· 50%, ─ ·· 30%, ── 10%, and ── 0% (100% OR1).

TABLE 3. Linear correlation coefficients for best size-, absorbance-, and PARAFAC-based predictors of endmember contributions for A) % DOC and B) % A254 (Mp).
3.3 Optical Properties
3.3.1 Absorbance Spectra and Bands
Differences in the shape of absorbance spectra were readily apparent for mixtures of BL and OR, and the spectra of mixtures fell along a smooth gradient between those of the endmembers (Figure 3B). However, these gradients differed depending upon wavelength band, and for endmember contributions to DOC compared to A254 (Mp) (Table 3). For example, the linear relationship between endmember DOC contribution and absorbance was best described by the 274–278 nm band (R2 = 0.97, 0.93, and 0.99 for mixtures one to three, respectively). On the other hand, the proportion of endmembers in the same respective mixtures were best described by the 308–312 nm bands based on contributions to A254 (Mp) (R2 = 0.98, 0.96, and 0.88). This suggests that smaller, protein-/polyphenol-like DOM that is prominent in fresh leaf leachates may not have been adequately represented at Mp (fluorescence Ex/Em maxima near 225,275/300–350 nm; Cuss and Guéguen, 2013).
3.3.2 Fluorescence and Parallel Factor Analysis
The PARAFAC model consisted of five components that were validated using split-half analysis and explained 96.8% of the total variation. Excitation-emission (Ex/Em) maxima for components are presented in Table 2, and full spectra are shown in Supplementary Figure S2.
Component C1 consisted of two peaks [Ex/Em = 240 (320)/420], and was dominated by fluorescence that has been described as UV humic-like, also termed the A peak (Coble, 1996; Fellman et al., 2010). Components C2 [Ex/Em = 240 (280)/325] and C5 [Ex/Em = 290 (345)/360] were similar to the fluorescence previously associated with proteins and polyphenols (respectively called peaks B and T; Coble, 1996; Aiken, 2014; Stedmon and Cory, 2014). These peaks have since been found to dominate lower molecular mass material in the leachates of fresh conifer needles (Beggs and Summers, 2011; Cuss and Guéguen, 2013; 2015b). The small secondary peak that was part of C5 (Ex/Em = 345/360) is not normally associated with proteins, and is likely an artefact of related Ex/Em pairs in the Rayleigh scatter region that were not completely removed during preprocessing. Component C3 resembled the M peak, which has been associated with marine DOM and microbial activity (Coble, 1996; Stedmon and Markager, 2005). The M peak has been recently revealed as a major constituent of fresh leaf leachates, and dominates fluorescence in the leachates of red and sugar maple leaves (Wong and Williams, 2010; Cuss and Guéguen 2013, 2015b; Chen and Jaffé, 2014). The remaining component (C4) resembled humic-like fluorescence, which has been associated with a wide array of aged DOM from natural and anthropogenic sources (Coble 1996; Li et al., 2008; Ishii and Boyer, 2012; Cuss and Guéguen, 2013; Aiken, 2014; Chen and Jaffé, 2014; Stedmon and Cory, 2014).
The EEMs and corresponding proportions of PARAFAC components were strikingly different for different endmembers, but the fluorescence of OR and BL were each relatively consistent (Table 2; Figure 4). For example, all OR endmembers contained large proportion of C1 (46 ± 1 to 73 ± 3%), and relatively high proportions of C4 (16 ± 0 to 24 ± 3%). On the other hand, BL was dominated by C2 and contained substantial C3 (64 ± 2 to 69 ± 4 and 15 ± 2 to 18 ± 5%, respectively), while WL was dominated by C3 and contained considerable C2 (64 ± 6 and 29 ± 5%, respectively).
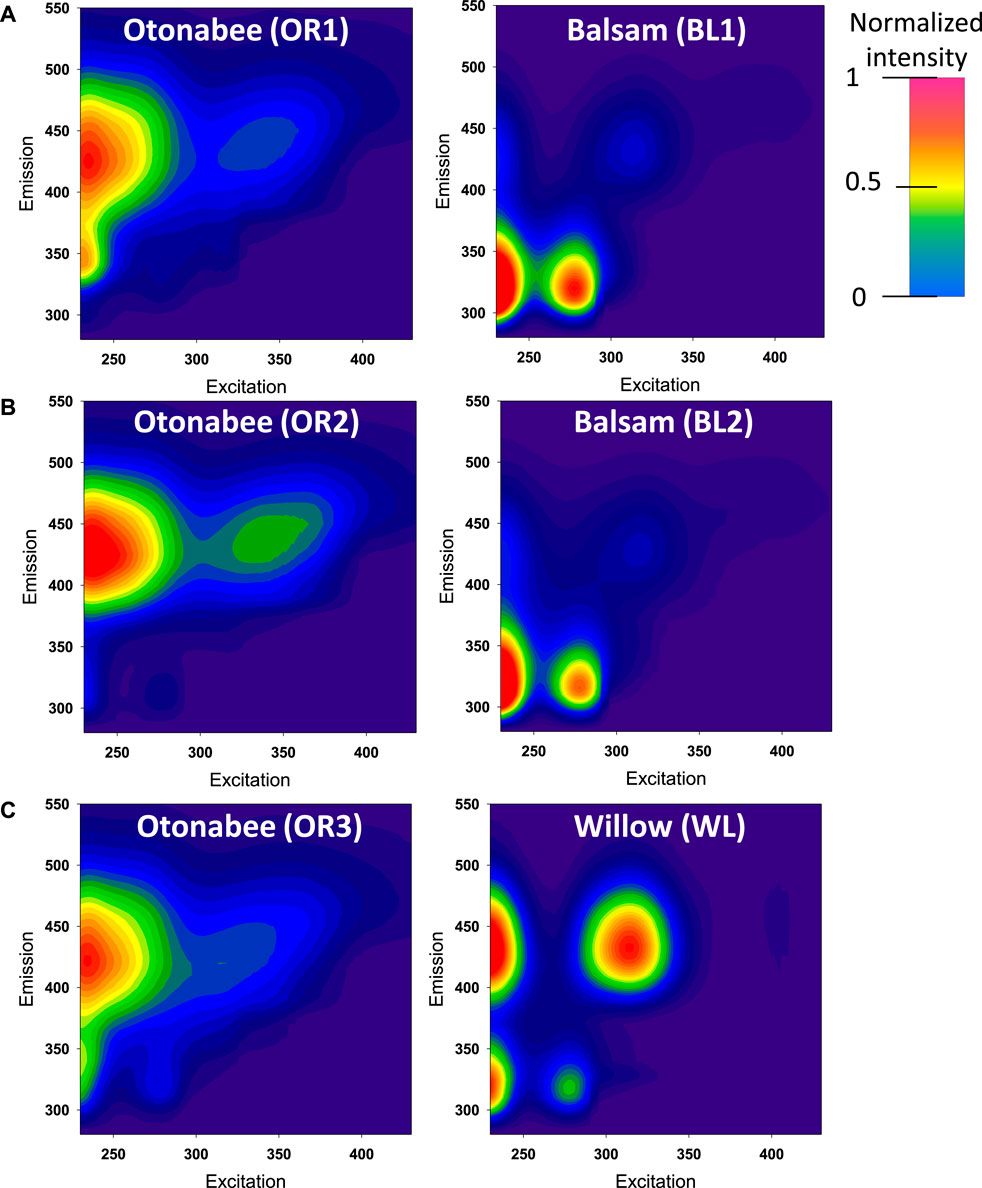
FIGURE 4. Average PARAFAC-modeled EEMs for mixing end members from mixtures 1 to 3 (A–C), respectively.
On average, the proportions of PARAFAC components in EEMs measured at Mp were similar to whole-sample fluorescence, but were significantly lower for components C2 (mean ± 95% CI = −11 ± 9%) and C3 (−10 ± 7%), and significantly higher for components C1, C4, and C5 (12 ± 5, 5 ± 2, and 4 ± 1%, respectively) (Figure 5). The intensity-weighted molecular mass of PARAFAC components with spectra very similar to protein-like C2 and microbial humic-like C3 have been respectively estimated at 279 and 329 Da using ultrahigh resolution MS, which were the lowest values out of five PARAFAC components modeled using riverine DOM (Stubbins et al., 2014). Hence, it is likely that this smaller DOM passed through the AF4 membrane. The majority of protein-/polyphenol-like fluorescence in the leachates of fresh needles has been previously associated with DOM that had a molecular mass near 300 Da using AF4, but has also been detected in higher molecular mass material in aged riverine DOM using size exclusion chromatography and AF4 (Romera-Castillo et al., 2014; Cuss and Guéguen, 2015b).
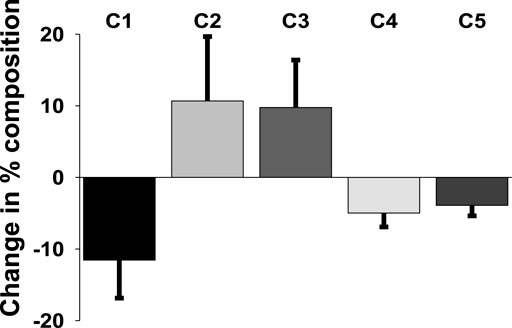
FIGURE 5. Average difference in the percentage of PARAFAC components (whole-sample EEMs—EEMs measured at Mp). Error bars show 95% CI.
Multiple significant (p < 0.05) linear relationships were found between the proportions of PARAFAC components and the contribution of DOC from different endmembers. However, the PARAFAC component that was the most significant predictor of endmember content differed for contributions to DOC and A254 (Mp) (Table 3). Component C1 was the best predictor of DOC contribution (R2 = 0.95, 1.00, and 0.93 for mixtures 1–3), while C3 was the best predictor of A254 (Mp) (R2 = 0.91, 0.96, and 0.98, respectively). In general, the ability of individual PARAFAC components to predict endmember contributions of DOC and A254 (Mp) was similar to the results of size and absorbance-based predictors, which is understandable given that strong relationships have been detected between the size and fluorescence properties of DOM from rivers and leaf leachates (Cuss and Guéguen, 2012, 2015b; Romera-Castillo et al., 2014).
3.4 Comparison With Other Findings and Relevance
Early findings suggested that the mixing of organic matter is typically non-conservative; however, systematic experimentation has since indicated that the non-linear behaviour of some optical property measurements may be misinterpreted as non-conservative mixing (Stedmon and Markager, 2003; Yang and Hur, 2014). The loss of organic matter during mixing is associated with changing physicochemical parameters such as pH and ionic strength, sedimentation following sorption to particulate material and inorganic colloids, or aggregation in the presence of bridging ions such as Ca2+ (McKnight et al., 1992; Aucur et al., 2003; Yang and Hur, 2014; Simon et al., 2019). On the other hand, the mixing of DOM tends to be conservative when concentrations are low and the pH and ionic strength are stable (Hur et al., 2006; Xue J.-P. et al., 2022). Under conservative mixing conditions, DOM size properties such as Mw, Mn, and Mp have also been correlated with optical properties (Hur et al., 2006; Xue et al., 2022a,b); however, they have been generally less effective predictors of endmember contributions due to the different optical properties of various size fractions, and the nonlinear behaviour of individual points and regions on size fractions, for the linear addition of size distributions that are quite different (Figure 3A). This shortcoming may be overcome by applying fractogram deconvolution to isolate and compare the behaviour of distinct size fractions, especially when estimating the contribution of endmembers to the size distribution (Table 3B).
The combination of AF4 with online UV, fluorescence and fractogram deconvolution is an effective approach for the routine characterization and differentiation of DOM. Despite considerable losses of organic matter and associated fluorescent components during fractionation, the size and optical properties of fractionated DOM were similarly effective for predicting the contribution of endmembers in this study, compared to similar predictors for whole sample measurements in mixtures (Tables 2 and 3). Further research is required to assess the effectiveness of this approach for other endmembers, and for these and other endmembers under non-conservative mixing conditions.
4 Conclusion
Asymmetrical flow field-flow fractionation (AF4) has been used to describe endmember contributions to mixed DOM sources using their size properties. These endmembers were comprised of riverine DOM and leaf leachates from several natural sources. Deconvolution vastly improved the differentiability of endmembers by decomposing the fractogram into several underlying peaks, providing multiple variables for comparison. The endmember contributions to DOC that were estimated using size properties were comparably accurate to those found using absorbance and fluorescence properties as tracers. Size-property tracers were the most effective for predicting endmember contribution to absorbance at 254 nm at the maximum of mixture fractograms, even though smaller DOM moieties were not always fully represented by the proportion of absorbance at the center of the molecular mass distribution. These techniques may be useful for assessing the contributions of DOM sources in mixtures, given known endmembers; however, further investigation is required to assess the impacts of changes in pH and ionic strength on intermolecular interactions, with corresponding changes in size and optical properties.
Data Availability Statement
The raw data supporting the conclusion of this article will be made available by the authors, without undue reservation.
Author Contributions
CC designed and performed the experiments. CG supervised the work, and provided the instrumentation, supplies and facilities. Both authors contributed to the writing and editing of the manuscript.
Funding
This work was funded in part by the Canada Research Chairs program, Natural Sciences and Engineering Research Council grants.
Conflict of Interest
The authors declare that the research was conducted in the absence of any commercial or financial relationships that could be construed as a potential conflict of interest.
Publisher’s Note
All claims expressed in this article are solely those of the authors and do not necessarily represent those of their affiliated organizations, or those of the publisher, the editors and the reviewers. Any product that may be evaluated in this article, or claim that may be made by its manufacturer, is not guaranteed or endorsed by the publisher.
Acknowledgments
CC gratefully acknowledges the financial support accorded by the Alexander Graham Bell Canada Graduate Scholarship (NSERC).
Supplementary Material
The Supplementary Material for this article can be found online at: https://www.frontiersin.org/articles/10.3389/fenvc.2022.930327/full#supplementary-material
Supplementary Figure S1 | Raw mass spectra for balsam leachate that has been (A) untreated, (B) size-fractionated, and (C) passed through the AF4 separation membrane.
Supplementary Figure S2 | Component EEMs from PARAFAC model.
References
Aiken, G. (2014). “Fluorescence and Dissolved Organic Matter: a Chemist's Perspective,” in Aquatic Organic Matter Fluorescence. Editors P. G. Coble, J. Lead, A. Baker, D. M. Reynolds, and R. G. M. Spencer (New York: Cambridge University Press), 35–74.
Aiken, G. R., Hsu-Kim, H., and Ryan, J. N. (2011). Influence of Dissolved Organic Matter on the Environmental Fate of Metals, Nanoparticles, and Colloids. Environ. Sci. Technol. 45, 3196–3201. doi:10.1021/es103992s
Aucur, A-M., Tao, F-X., Moreira-Turcq, P., Seyler, P., Sheppard, S., and Benedetti, M. F. (2003). The Amazon River: Behaviour of Metals (Fe, Al, Mn) and Dissolved Organic Matter in the Initial Mixing at the Rio Negro/Solimões Confluence. Chem. Geol. 197, 271–285.
Baalousha, M., and Lead, J. R. (2007). Size Fractionation and Characterization of Natural Aquatic Colloids and Nanoparticles. Sci. Total Environ. 386, 93–102. doi:10.1016/j.scitotenv.2007.05.039
Beggs, K. M. H., and Summers, R. S. (2011). Character and Chlorine Reactivity of Dissolved Organic Matter from a Mountain Pine Beetle Impacted Watershed. Environ. Sci. Technol. 45, 5717–5724. doi:10.1021/es1042436
Bernhardt, E. S., and McDowell, W. H. (2008). Twenty Years Apart: Comparisons of DOM Uptake during Leaf Leachate Releases to Hubbard Brook Valley Streams in 1979 versus 2000. J. Geophys. Res. 113, G03032. doi:10.1029/2007JG000618
Chen, M., and Jaffé, R. (2014). Photo- and Bio-Reactivity Patterns of Dissolved Organic Matter from Biomass and Soil Leachates and Surface Waters in a Subtropical Wetland. Water Res. 61, 181–190. doi:10.1016/j.watres.2014.03.075
Coble, P. G. (1996). Characterization of Marine and Terrestrial DOM in Seawater Using Excitation-Emission Matrix Spectroscopy. Mar. Chem. 51, 325–346. doi:10.1016/0304-4203(95)00062-3
Cuss, C. W., and Guéguen, C. (2015a). “Characterizing the Labile Fraction of Dissolved Organic Matter in Leaf Leachates: Methods, Indicators, Structure, and Complexity,” in Labile Organic Matter—Chemical Compositions, Function, and Significance in Soil and the Environment. Editors F. Wu, and Z. He (Madison, Wisconsin: Soil Science Society of America), 237–274. doi:10.2136/sssaspecpub62.2014.0043
Cuss, C. W., and Guéguen, C. (2012). Determination of Relative Molecular Weights of Fluorescent Components in Dissolved Organic Matter Using Asymmetrical Flow Field-Flow Fractionation and Parallel Factor Analysis. Anal. Chim. Acta 733, 98–102. doi:10.1016/j.aca.2012.05.003
Cuss, C. W., and Guéguen, C. (2013). Distinguishing Dissolved Organic Matter at its Origin: Size and Optical Properties of Leaf-Litter Leachates. Chemosphere 92, 1483–1489. doi:10.1016/j.chemosphere.2013.03.062
Cuss, C. W., and Guéguen, C. (2015b). Relationships between Molecular Weight and Fluorescence Properties for Size-Fractionated Dissolved Organic Matter from Fresh and Aged Sources. Water Res. 68, 487–497. doi:10.1016/j.watres.2014.10.013
Cuss, C. W., Shi, Y. X., McConnell, S. M., and Guéguen, C. (2014). Changes in the Fluorescence Composition of Multiple DOM Sources over pH Gradients Assessed by Combining Parallel Factor Analysis and Self-Organizing Maps. J. Geophys. Res. Biogeosci. 119, 1850–1860. doi:10.1002/2013JG002598
Fellman, J. B., Hood, E., and Spencer, R. G. M. (2010). Fluorescence Spectroscopy Opens New Windows into Dissolved Organic Matter Dynamics in Freshwater Ecosystems: a Review. Limnol. Oceanogr. 55 (6), 2452–2462. doi:10.4319/lo.2010.55.6.2452
Guéguen, C., and Cuss, C. W. (2011). Characterization of Aquatic Dissolved Organic Matter by Asymmetrical Flow Field-Flow Fractionation Coupled to UV-Visible Diode Array and Excitation Emission Matrix Fluorescence. J. Chrom. A 1218, 4188–4198.
Guéguen, C., and Dominik, J. (2003). Partitioning of Trace Metals between Particulate, Colloidal and Truly Dissolved Fractions in a Polluted River: the UpperVistulaRiver (Poland). Appl. Geochem. 18, 457–470.
Hur, J., Williams, M. A., and Schlautman, M. A. (2006). Evaluating Spectroscopic and Chromatographic Techniques to Resolve Dissolved Organic Matter via End Member Mixing Analysis. Chemosphere 63, 387–402. doi:10.1016/j.chemosphere.2005.08.069
Ishii, S. K. L., and Boyer, T. H. (2012). Behavior of Reoccurring PARAFAC Components in Fluorescent Dissolved Organic Matter in Natural and Engineered Systems: A Critical Review. Environ. Sci. Technol. 46, 2006–2017. doi:10.1021/es2043504
Johnson, M. S., Couto, E. G., Abdo, M., and Lehmann, J. (2011). Fluorescence Index as an Indicator of Dissolved Organic Carbon Quality in Hydrologic Flowpaths of Forested Tropical Watersheds. Biogeochemistry 105, 149–157. doi:10.1007/s10533-011-9595-x
Kothawala, D. N., Murphy, K. R., Stedmon, C. A., Weyhenmeyer, G. A., and Tranvik, L. J. (2013). Inner Filter Correction of Dissolved Organic Matter Fluorescence. Limnol. Oceanogr. Methods 11, 616–630. doi:10.4319/lom.2013.11.616
Kothawala, D. N., Stedmon, C. A., Müller, R. A., Weyhenmeyer, G. A., Köhler, S. J., and Tranvik, L. J. (2014). Controls of Dissolved Organic Matter Quality: Evidence from a Large‐scale Boreal Lake Survey. Glob. Change Biol. 20, 1101–1114. doi:10.1111/gcb.12488
Lawaetz, A. J., and Stedmon, C. A. (2009). Fluorescence Intensity Calibration Using the Raman Scatter Peak of Water. Appl. Spectrosc. 63 (8), 936–940. doi:10.1366/000370209788964548
Li, W. H., Sheng, G. P., Liu, X. W., Yu, H. Q., and Yu, H. Q. (2008). Characterizing the Extracellular and Intracellular Fluorescent Products of Activated Sludge in a Sequencing Batch Reactor. Water Res. 42, 3173–3181. doi:10.1016/j.watres.2008.03.010
McKnight, D. M., Bencala, K. E., Zellweger, G. W., Aiken, G. R., Feder, G. L., and Thorn, K. A. (1992). Sorption of Dissolved Organic Carbon by Hydrous Aluminum and Iron Oxides Occurring at the Confluence of Deer Creek with the Snake River, Summit County, Colorado. Environ. Sci. Technol. 26, 1388–1396. doi:10.1021/es00031a017
Murphy, K. R., Stedmon, C. A., Graeber, D., and Bro, R. (2013). Fluorescence Spectroscopy and Multi-Way Techniques. PARAFAC. Anal. Methods 5, 6557. doi:10.1039/c3ay41160e
O’Haver, T. (2012). “peakfit.m” Function for MATLAB, BSD Licensing. Available at: http://www.mathworks.com/matlabcentral/fileexchange/23611-peak-fitter (Accessed March, 2012).
Persson, L., Bastviken, D., Alsberg, T., Tranvik, L., and Odham, G. (2005). Electrospray Mass Spectrometry to Study Lake Water DOM and Effects of Microbial Degradation. Int. J. Environ. Anal. Chem. 85 (1), 15–27. doi:10.1080/0306731042000303198
Pifer, A. D., and Fairey, J. L. (2012). Improving on SUVA254 Using Fluorescence-PARAFAC Analysis and Asymmetric Flow-Field Flow Fractionation for Assessing Disinfection Byproduct Formation and Control. Water Res. 46, 2927–2936. doi:10.1016/j.watres.2012.03.002
Podzimek, S. (2011). Light Scattering, Size Exclusion Chromatography, and Asymmetric Flow Field Flow Fractionation: Powerful Tools for the Characterization of Polymers, Proteins, and Nanoparticles. New Jersey: John Wiley & Sons, 372.
Romera-Castillo, C., Chen, M., Yamashita, Y., and Jaffé, R. (2014). Fluorescence Characteristics of Size-Fractionated Dissolved Organic Matter: Implications for a Molecular Assembly Based Structure? Water Res. 55, 40–51. doi:10.1016/j.watres.2014.02.017
Sebestyen, S. D., Boyer, E. W., Shanley, J. B., Kendall, C., Doctor, D. H., Aiken, G. R., et al. (2008). Sources, Transformations, and Hydrological Processes that Control Stream Nitrate and Dissolved Organic Matter Concentrations during Snowmelt in an Upland Forest. Water Resour. Res. 44, W12410. doi:10.1029/2008WR006983
Simon, C., Osterholz, H., Koschinsky, A., and Dittmar, T. (2019). Riverine Mixing at the Molecular Scale - an Ultrahigh-Resolution Mass Spectrometry Study on Dissolved Organic Matter and Selected Metals in the Amazon Confluence Zone (Manaus, Brazil). Org. Geochem. 129, 45–62. doi:10.1016/j.orggeochem.2019.01.013
Sleighter, R. L., Cory, R. M., Kaplan, L. A., Abdulla, H. A. N., and Hatcher, P. G. (2014). A Coupled Geochemical and Biogeochemical Approach to Characterize the Bioreactivity of Dissolved Organic Matter from a Headwater Stream. J. Geophys. Res. Biogeosci. 119, 1520–1537. doi:10.1002/2013JG002600
Spencer, R. G. M., Aiken, G. R., Wickland, K. P., Striegl, R. G., and Hernes, P. J. (2008). Seasonal and Spatial Variability in Dissolved Organic Matter Quantity and Composition from the Yukon River Basin, Alaska. Glob. Biogeochem. Cycles 22, a–n. doi:10.1029/2008GB003231
Stedmon, C. A., and Cory, R. M. (2014). “Biological Origins and Fate of Fluorescent Dissolved Organic Matter in Aquatic Environments,” in Aquatic Organic Matter Fluorescence. Editors P. G. Coble, J. Lead, A. Baker, D. M. Reynolds, and R. G. M. Spencer (New York: Cambridge University Press), 278–302.
Stedmon, C. A., and Markager, S. (2003). Behaviour of the Optical Properties of Coloured Dissolved Organic Matter under Conservative Mixing. Estuar. Coast Shelf S. 57, 1–7. doi:10.1016/s0272-7714(03)00003-9
Stedmon, C. A., and Bro, R. (2008). Characterizing Dissolved Organic Matter Fluorescence with Parallel Factor Analysis: a Tutorial. Limnol. Oceanogr. Methods 6, 572–579. doi:10.4319/lom.2008.6.572b
Stedmon, C. A., Markager, S., and Bro, R. (2003). Tracing Dissolved Organic Matter in Aquatic Environments Using a New Approach to Fluorescence Spectroscopy. Mar. Chem. 82, 239–254. doi:10.1016/s0304-4203(03)00072-0
Stedmon, C. A., and Markager, S. (2005). Resolving the Variability in Dissolved Organic Matter Fluorescence in a Temperate Estuary and its Catchment Using PARAFAC Analysis. Limnol. Oceanogr. 50 (2), 686–697. doi:10.4319/lo.2005.50.2.0686
Stolpe, B., Zhou, Z., Guo, L., and Shiller, A. M. (2014). Colloidal Size Distribution of Humic- and Protein-like Fluorescent Organic Matter in the Northern Gulf of Mexico. Mar. Chem. 164, 25–37. doi:10.1016/j.marchem.2014.05.007
Van Gaelen, N., Verheyen, D., Ronchi, B., Struyf, E., Govers, G., Vanderborght, J., et al. (2014). Identifying the Transport Pathways of Dissolved Organic Carbon in Contrasting Catchments. Vadose Zone J. 13, 1. doi:10.2136/vzj2013.11.0199
Wong, J. C. Y., and Williams, D. D. (2010). Sources and Seasonal Patterns of Dissolved Organic Matter (DOM) in the Hyporheic Zone. Hydrobiologia 647, 99–111. doi:10.1007/s10750-009-9950-2
Xue, J. P., Cuss, C. W., Wang, Y., Javed, M. B., Noernberg, T., Pelletier, R., et al. (2022b). Size-resolved Fluorescence Underscores Negligible Interaction of Dissolved Organic Matter during Conservative Mixing in a Large Boreal River. Front. Env. Chem. (Submitted to special issue on Advanced Characterization of Dissolved Organic Matter in Natural Aquatic Environments and Water/Wastewater Treatment Processes).
Xue, J. P., Cuss, C. W., Noernberg, T., Javed, M. B., Chen, N., Pelletier, R., et al. (2022a). Size and Optical Properties of Dissolved Organic Matter in Large Boreal Rivers during Mixing: Implications for Carbon Transport and Source Discrimination. J. Hydrology Regional Stud. 40, 101033. doi:10.1016/j.ejrh.2022.101033
Yang, L., and Hur, J. (2014). Critical Evaluation of Spectroscopic Indices for Organic Matter Source Tracing via End Member Mixing Analysis Based on Two Contrasting Sources. Water Res. 59, 80–89. doi:10.1016/j.watres.2014.04.018
Keywords: parallel factor analysis, excitation-emission matrix, leaf leachate, fractogram deconvolution, molecular mass distribution, endmember mixing tracer
Citation: Cuss CW and Guéguen C (2022) The Contribution of Endmembers to Mixtures of Leaf Leachates and Riverine DOM can be Determined by Measuring Their Size and Fluorescence Properties. Front. Environ. Chem. 3:930327. doi: 10.3389/fenvc.2022.930327
Received: 27 April 2022; Accepted: 26 May 2022;
Published: 30 June 2022.
Edited by:
Kang Xiao, University of Chinese Academy of Sciences, ChinaReviewed by:
Liyang Yang, Fuzhou University, ChinaTahir Maqbool, University of Alabama, United States
Copyright © 2022 Cuss and Guéguen. This is an open-access article distributed under the terms of the Creative Commons Attribution License (CC BY). The use, distribution or reproduction in other forums is permitted, provided the original author(s) and the copyright owner(s) are credited and that the original publication in this journal is cited, in accordance with accepted academic practice. No use, distribution or reproduction is permitted which does not comply with these terms.
*Correspondence: C. Guéguen, Y2VsaW5lLmd1ZWd1ZW5AdXNoZXJicm9va2UuY2E=
†Present Address: C. W. Cuss, School of Science and the Environment, Grenfell Campus, Memorial University of Newfoundland, Corner Brook, NL, CanadaC. Guéguen, Department of Chemistry, Université de Sherbrooke, Montreal, QC, Canada