 Caroline Goedecke1†Paul Eisentraut1,2†Korinna Altmann1Anna Maria Elert1Claus G. Bannick3
 Mathias Ricking3Nathan Obermaier3Anne-Katrin Barthel3Thomas Schmitt4Martin Jekel2
 Ulrike Braun1,3*
- 1BAM Bundesanstalt für Materialforschung und -prüfung, Berlin, Germany
- 2Technische Universität Berlin, Berlin, Germany
- 3UBA Umweltbundesamt, Berlin, Germany
- 4Berliner Wasserbetriebe, Berlin, Germany
An investigation of microplastic (MP) occurrence in a municipal wastewater treatment plant (WWTP) effluent with tertiary treatment was carried out. Representative sample volumes of 1 m3 were taken by applying a fractionated filtration method (500, 100, and 50 µm mesh sizes). The detection of MP mass fractions by thermal extraction desorption–gas chromatography/mass spectrometry (TED-GC/MS) was achieved without the previously required additional sample pretreatment for the first time. Different types of quantification methods for the evaluation of TED-GC/MS data were tested, and their accuracy and feasibility have been proven for real samples. Polyethylene, polystyrene, and polypropylene were identified in effluent samples. The polymer mass content varied significantly between 5 and 50 mg m−3. A correlation between the MP load and the quantity of suspended matter in the WWTP effluents, particle size distribution, particle type, and operation day (i.e., weekday, season, and capacity) was not found. It can be concluded that a meaningful assessment of WWTPs requires a comprehensive sampling campaign with varying operation conditions.
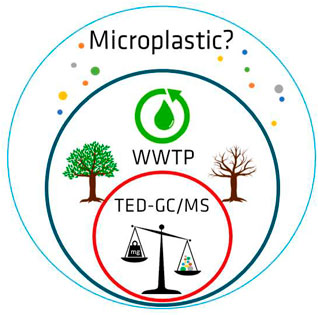
GRAPHICAL ABSTRACT
Introduction
In recent years, the uncontrolled, increasing occurrence of plastic products, plastic waste (plastic litter), and plastic fragments in the environment has become a highly discussed topic of public and political interest (World Health Organization, WHO, United Nations Environmental Program, UNEP, and Organization for Economic Co-operation and Development, OECD). The ubiquitous presence of plastics in aquatic systems may have a negative impact on these ecosystems. Not only the large and visible plastic particles but especially the smaller fragments, the so-called microplastic (MP) particles, are the focus of the discussion. MPs are particles in the range between 1 µm and 1,000 µm, according to ISO 21960 (ISO 21960: ISO/TR 21960, 2020).
Numerous scientific studies on MPs in different aquatic environmental compartments have been published; for example, for marine waters (Lusher et al., 2014), for marine sediments (Harrison et al., 2012; Van Cauwenberghe et al., 2015), for biota (Bellas et al., 2016), and for freshwaters (Dris et al., 2015; Fischer et al., 2016). Various authors postulated that wastewater treatment plants (WWTPs) are a relevant source of MPs in the environment (Browne et al., 2011; Castañeda et al., 2014; McCormick et al., 2014). However, many studies reveal a good removal efficiency of MP particles by conventional WWTPs; for example, Murphy et al. (2016) reported MP particle numbers of 15.70 ± 5.23 items L−1 in the raw wastewater and 0.25 ± 0.04 items L−1 in the effluent of a Scottish WWTP, which corresponds to a 98% reduction in the MP particle number. Comparable effluent concentrations of 0.28 items L−1 (Mason et al., 2016), 0.05 ± 0.024 items L−1 (Ziajahromi et al., 2017), and 1.5 items L−1 (Tagg et al., 2020) were observed in tertiary-treated effluents of the United States, Australian, and the United Kingdom WWTPs. However, these studies did not investigate the effectiveness of MPs removal. Further studies from Finland, the Czech Republic, Germany, Canada, and Sweden described removal rates between 95% and over 99% (Lares et al., 2018; Magnusson and Norén, 2014; Mintenig et al., 2017; Pivokonsky et al., 2018; Talvitie et al., 2017; Gies et al., 2018). Despite these very high removal rates, a significant amount of MPs still ends up in the environment due to WWTPs. Owing to the large volumes of wastewater processed within these plants, treated wastewater can still make a sizeable contribution to aquatic MP pollution (Freeman et al., 2020). Furthermore, technical aspects of a WWTP (number of clarification stages, operating conditions and capacity, seasons, and time of day) influence the removal rates, especially for small MP particles and fibers (Ben-David et al., 2021). Therefore, further efforts must be made to determine and understand the input of MP pollution via WWTP and ultimately make a recommendation on how to reduce the MP load.
Mostly, MP detection is performed by visual inspection, Fourier-transformed infrared (FTIR) spectroscopy, and Raman spectroscopy. These techniques are able to characterize MPs by particle number. This is of high interest for scientific understanding (fragmentation behavior, identification of sources, etc.) and when the time and costs of a single analysis is of secondary importance. However, in practice, the determination of particle masses is of higher interest for the monitoring and regulation of WWTP effluents as this allows for monitoring of mass-based threshold values. Simon et al. (2018) evaluated the role of Danish WWTPs in the emission of MP particles to the environment by sampling raw wastewater and the effluents of ten WWTPs, in terms of amount and types of polymers in the range of 10–500 µm. In the raw wastewater, a median of 54 items L−1 was detected, and 7.22 items L−1 were determined in the effluent. Based on these results and a number of extrapolations, mass contents of 250 mg m−3 and 4.2 mg m−3 were calculated, respectively, corresponding to a removal efficiency of 98.3% by mass. An additional study indicated 1.3 mg m−3 (Simon et al., 2019) in WWTP effluent. The conversion of particle numbers into mass contents is subject to many assumptions and simplifications and has neither been validated by an experimental setup nor does it give comparable results (Primpke et al., 2020).
Spectroscopic imaging methods were applied in all published studies. These techniques allowed the determination of comprehensive information, such as polymer type, particle sizes (in two dimensions), and particle numbers (Elert et al., 2017). The calculation of these parameters can be optimized with advanced software tools for automated particle recognition and allocation (Primpke et al., 2017; Wander et al., 2020). However, when using these techniques for environmental samples, complex sample treatment is essential to reduce the number of filtered particles in the field sample. Those sample treatment steps are very time-consuming, and they involve the risk of particle loss or (particle) contamination from other sources. Even with technically complex equipment (including parallel or staggered workflows), it remains too time-consuming to analyze more than a few samples, which in turn is insufficient to cover the real fluctuations of a regular working WWTP. Ultimately, time-consuming and technically complex methods always result in high costs.
In this respect, it is foreseeable that it will be difficult to implement these procedures for use in the field of regulatory or in-house surveillance. However, the selection of methods goes far beyond the scientific question. For example, it will be necessary to have methods that can set requirements in legislation in order to limit unwanted inputs and monitor them. Such methods must be simple, fast, and reliable.
Thermo-analytical methods, such as pyrolysis–gas chromatography–mass spectrometry (Py-GC/MS), or thermal extraction desorption–gas chromatography–mass spectrometry (TED-GC/MS), are methods able to determine the polymer type and mass fraction in samples. The applications of Py-GC/MS for the determination of MP in real samples from WWTP’s are documented in the literature (Funck et al., 2020). In Py-GC/MS, a small sample mass of less than 1 µg is heated up very fast, and the formed decomposition product gases are then transferred in a GC/MS system. Using Py-GC/MS, the analysis of water filtrate from a WWTP effluent requires the reduction of environmental matrix (i.e., natural environmental sample contents) to achieve a representative analysis sample. This means additional time- and cost-consuming preparation steps. Using the TED-GC/MS technique, the sample is heated up to 600°C in a thermobalance; polymer-specific decomposition products are then collected on a solid-phase and analyzed after thermal desorption with GC/MS (Duemichen et al., 2015; Duemichen et al., 2017; Duemichen et al. 2019). Using TED-GC/MS, a sample mass of 10–50 mg can be analyzed, which allows for the analysis of more representative samples than Py-GC/MS. However, the most significant advantage is that TED-GC/MS allows direct detection of MP mass contents without any time- and cost-consuming sample treatment. In turn, this makes a comprehensive mass flow from source to sink achievable, which is needed to design strategies, which avoid the input of plastic and MPs.
In this study, the effluent of a German WWTP was analyzed by combing fractionated filtration as the sampling method with a subsequent TED-GC/MS analysis of the filter residues as a proof of concept. The samples were screened for the standard commodity polymers, such as polyethylene (PE), polystyrene (PS), polypropylene (PP), polyamide (PA), polyethylene terephthalate (PET), and poly(methyl methacrylate) (PMMA). FTIR imaging was used exemplarily as a support to verify the results obtained from TED-GC/MS measurements.
The development of the filtration process has already been published (Bannick et al., 2019). The knowledge about identification and quantification processes using TED-GC/MS, including optimization of the methodical parameters and faults in signal evaluation, is presented here in detail for the first time.
Materials and Methods
Materials
For the evaluation of the quantification methods, PS granulate (PS 158K, BASF, Germany) and PP (PP, Moplen RP320M, LyondellBasell, Germany) were used as reference polymers. They were cryogenically milled (liquid nitrogen) using a sieve mill (ultra-centrifugal mill ZM 200, Retsch, Germany) equipped with a ring sieve of 1-mm trapezoid holes. The milling was performed at a velocity of 18,000 rpm. The D50 values (value of the particle diameter at 50% in the cumulative distribution) were 297 µm for PS and 556 µm for PP. For PE, an ultra-high-molecular weight polyethylene (PE-UHMW, GUR 4022) was used as the reference polymer (Celanese, Germany) with a particle size of 145 μm, specified by the manufacturer.
For the development of the quantification and detection method, external calibrations with a suitable MP-free environmental reference matrix must be carried out. However, a guaranteed MP-free suspended particulate matter from a WWTP effluent does not exist. As a compromise, a suspended particulate matter was chosen from the upper course of the Danube River with low anthropogenic influence. The environmental reference matrix was provided by the German Environment Agency (Umweltbundesamt, Dessau, Germany). The environmental reference matrix was characterized as follows: pH value of 7.045, total carbon of 8.76%, organic carbon of 6.43%, and inorganic carbon of 2.33%. The carbon content in the environmental reference matrix is clearly lower than the expected content in a WWTP effluent of 30–40%.
Description of the Selected Wastewater Treatment Plant
The samples were taken from the effluent of the WWTP in Ruhleben (Berlin, Germany). Ruhleben is one of six WWTPs in Berlin with activated sludge tertiary treatment. With an annual treated wastewater volume of 90,340,000 m3 per year, 8% of which goes back to precipitation, Ruhleben cleans one-third of the total amount of the daily generated wastewater in the city, corresponding to the consumption of 1.6 million inhabitants. The daily capacity is around 248,000 m3 per day and can go up to 511,100 m3 per day.
Sampling and Sample Treatment
The sampling of the effluent was carried out using fractionated filtration, as introduced by Bannick et al. (2019). Centrifugal pumps (Heide-Pumpen GmbH, Gelsenkirchen, Germany, type D, 600 W, AN-21.5) are suspended directly into the effluent stream, approximately 50 cm below the water surface. The water flow was measured (0.33 m3/h) and recorded by using flow meters (C.A. Loewe GmbH, Berlin, Germany). Pressure-resistant silicone tubes were used (resistance up to 5 bars, inner diameter of 25 mm, and wall thickness of 6 mm) (Keller Elastomere, Überlingen, Germany). Water was filtered over a series of stainless steel sieves (ATECHNIK GmbH, Germany) with a diameter of approximately 20 cm and mesh sizes of 500, 100, and 50 µm. No clogging of the sieves was observed during any of the sampling procedures. Filtered water was collected between the filtration steps in a pre-cleaned (using de-ionized water) stainless steel barrel of 200 L (Speidel Tank-und Behälterbau GmbH, Ofterdingen, Germany).
A total effluent volume of one cubic meter each was filtered over a period of about 3 hours in the morning. The extraction of such a large volume sample was necessary, on the one hand, to obtain enough solids for the subsequent analyses and, on the other hand, to be able to assume that a representative sample was taken regarding the expected particles distribution. It should be noted that this is still a spot sample and hence not representative of the WWTP effluent over a 24-h period. The recovered solids were steam sterilized and freeze-dried using an Alpha 1-4 LSC plus lyophilizer (Christ, Osterode am Harz, Germany). Only the 500 μm fraction was crushed with a mortar before the measurement to achieve a homogeneous analysis sample.
One cubic meter of the effluent as a spot sample was taken on the 4 days in 1 week during summer and on the 4th day during winter using the fractionated filtration method with 500-, 100-, and 50-µm sieves. Weather influence such as heavy precipitation was considered negligible as only one precipitation event occurred during the sampling period. An overview about the taken samples including precipitation events are presented in Table 1.
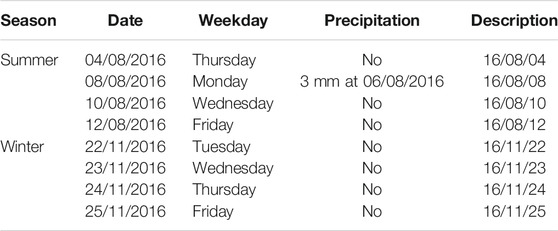
TABLE 1. Overview about the samples.
Thermal Extraction Desorption–Gas Chromatography–Mass Spectrometry
The detection of MPs was realized with two devices. In the first stage of TED-GC/MS development, the coupling process between the thermobalance and the GC/MS system was realized manually. In the course of the project, this step was replaced by a fully automated coupling tool. Additional measurements were performed with the automated TED-GC/MS as it also offered advantages in the type of column used and the detection limits (see later in the study).
Determination of MPs with first-stage TED-GC/MS can be described as follows. A total of 15 mg of the environmental samples were weighed in a 150-µL aluminum oxide crucible and placed in the oven of the TGA/SDTA 851 single arm thermobalance (Mettler-Toledo GmbH, Gießen, Germany). Blank measurements were performed daily to monitor potential carryover. The samples were annealed from 25°C up to 600°C with a heating rate of 10 K min−1 under a constant flow of nitrogen (flow rate of 30 ml min−1). The decomposition products were collected on a solid-phase sorption agent (Sorb-Star© Polydimethylsiloxane, Innovative MessTechnik GmbH, Vohenstrauß, Germany). The sorbent (length: 20 mm and diameter: 2 mm) was fixed in a thermal desorption glass tube with a stainless steel sieve. The tube was connected to the gas-tight oven outlet. After the thermal extraction step, the trapped decomposition products were desorbed and analyzed using the GC/MS. For thermal desorption, a TDS-A2 sampler (Gerstel GmbH & Co. KG, Mülheim an der Ruhr, Germany) was used in combination with a cool injection system (CIS4, Gerstel). The TDS was operated splitless under a helium atmosphere from 25 to 200°C with 40°C min−1, and the temperature was held for 5 min at 200°C. For cryo-focusing of the analytes, the CIS was cooled to −100°C with liquid nitrogen and then heated up to 270°C with 12°Cs−1. The GC/MS analyses were performed using an Agilent 6890+ gas chromatograph (Agilent Technologies, Palo Alto, CA, United States) equipped with a mass selective detector (Agilent MSD 5973N). GC was carried out using a highly inert 100% polydimethylsiloxane phase capillary column (HP-1MS, length: 30 m × inner diameter: 0.25 mm × film thickness: 0.25 µm). Helium (Linde, 5.0) was used as a carrier gas with a constant column flow rate of 1.0 ml min−1. The initial oven temperature of 40°C was increased at a rate of 5°C min−1–300°C. The mass spectrometer was operated in the electron ionization mode at 70 eV. The analyses were performed in the full scan mode with a mass range of m/z = 35–350. The source and the transfer-line were held constant at 230 and 250°C, respectively. Chemstation software™ (Agilent) was used for the data analysis.
The quantification was implemented via the following degradation products: 1,14-pentadecadiene (m/z = 55 Da) for PE, 2,4-diphenyl-1-butene (m/z = 208 Da) for PS, and 4,6,8-tetramethylundec-10-ene (m/z = 111) for PP.
In the second part of this study a new, fully automated TED-GC/MS was used (second-stage TED-GC/MS). The sample was pyrolyzed in a thermobalance (TGA2, Mettler/Toledo, Gießen, Germany). Afterward, the samples were desorbed and analyzed using a thermal desorption unit of the GC/MS system (TDU 2 and CIS4, Gerstel, gas chromatograph 7890 + mass spectrometer 5977B, both Agilent). GC was carried out using a highly inert 95% polydimethylsiloxane/5% polydiphenylsiloxane phase capillary column (HP-5MS, length: 30 m × inner diameter: 0.25 mm × film thickness: 0.25 µm). This column was found to be more suitable for the analytes considered. The methods and parameters of polymer markers of the second-stage TED-GC/MS were the same as described earlier. Further information on the fully automated method and parameters are reported in the publications by Eisentraut et al. (2018) and Duemichen et al. (2019). However, in contrast to these publications, the study presented here was carried out without an internal standard.
Fourier Transformed Infrared Microscopy
FTIR imaging was used exemplarily as a support to verify the results obtained from TED-GC/MS measurements. An aliquot of the 100 µm fraction sampled on the 16/11/22 embedded in anhydrous KBr was characterized using the transmission mode.
The measurements were performed using an FTIR Vertex 70 spectrometer coupled with a Hyperion 3000 FTIR microscope (Bruker Corporation, Billerica, United States) equipped with a 15 × IR objective (NA 0.4, lateral pixel resolution: 2.7 µm). A 64 × 64 focal plane array (FPA), cooled with liquid nitrogen, was used as a detector which enables the simultaneous measurement of 4,096 images within one run. The sample substance was mixed with a six-fold amount of anhydrous potassium bromide (KBr) and was pressed at a pressure of about 10 kN into tablets with a diameter of 13 mm and a thickness of about 1 mm using a hydraulic press (Perkin Elmer, Waltham, United States). The measurements were performed in the transmission mode with a wavenumber range of 3,850–900 cm−1 using a spectral resolution of 8 cm−1. A total of 12 × 8 FPA fields were measured covering the area of 2,040 μm × 1,360 µm. To identify the corresponding polymers, the specific absorption bands were integrated. The software Opus 7.2 (Bruker Corporation) was used for the data analysis. No transformation or postprocessing was carried out.
Quality Assurance and Quality Control
The effect of contamination and subsequent overestimation with MP particles from other sources (especially from air transport) is well known; however, for thermo-analytical methods, it was found to be less relevant compared to spectroscopic methods (Altmann et al., 2021). This is caused by the fact that small but numerous available particles (which are easy transported by air) contribute less to the mass fraction signal of the TED-GC/MS. However, between all TED-GC/MS measurements, blank controls were used to avoid carry over effects in the detection tool.
Nevertheless, the additional common measures were followed during sampling and detection, such as exclusive use of plastic-free laboratory equipment (except silicone tubes and teflon-coated spray bottles), avoidance of plastic clothing and gloves, careful rinsing of all equipment with de-ionized water, and covering open vessels with plastic-free lids when storing samples (Bannick et al., 2019).
In the first-stage TED-GC/MS, the determined limits of detection (LOD) were 4 µg (PS and PP) and 27 µg (PE) (absolute polymer mass in crucible). In the second-stage TED-GC/MS, LOD were significantly improved than that the first-stage TED-GC/MS system reaching values of 0.2 µg (PS), 0.4 µg (PP), and 1.6 µg (PE) (absolute polymer mass in crucible). LOD for the polymers were determined as a triple signal/noise ratio of the most intensive m/z signal. For TED-GC/MS, the limit of quantification (LOQ) was calculated based on a factor of two LOD.
Results and Discussion
Identification
Filter residues were obtained and freeze dried. The thermogravimetric analysis (TGA) of those samples, consisting of thermogravimetric and differential thermogravimetric curve of the summer and winter samples, is exemplarily shown for the three fractions of one sample per season in Figure 1. The tendencies and conclusions drawn from this exemplary example are also valid for the other three samples not shown here. All three fractions show a small decomposition step up to 100°C due to the release of water. The main decomposition step of all fractions starts at about 200°C and ends at about 500°C. In this temperature range, the environmental matrix and MPs decompose. Residues of the samples between 35% and 70% can be detected after TGA measurements consisting of pyrolytic char and inorganic content. Seasonal differences are observed in the main mass loss step for the 50 and 100 µm fraction, indicating different contents of natural polymers (i.e., microbiologic components). Comparing the summer and winter data, a higher mass loss of the winter samples was generally observed. The cause of the increased organic contents found in the winter samples is not clear and is beyond the scope of this study. Most likely, the centralized wastewater distribution of Berlin is responsible for different wastewater composition during summer and winter. In Berlin, the wastewater can be distributed individually to the six WWTP, depending on the season, the capacities of the plants, etc. The intensity of the signals does not show any systematic trends regarding the observations between the different particle size classes or averaged values.
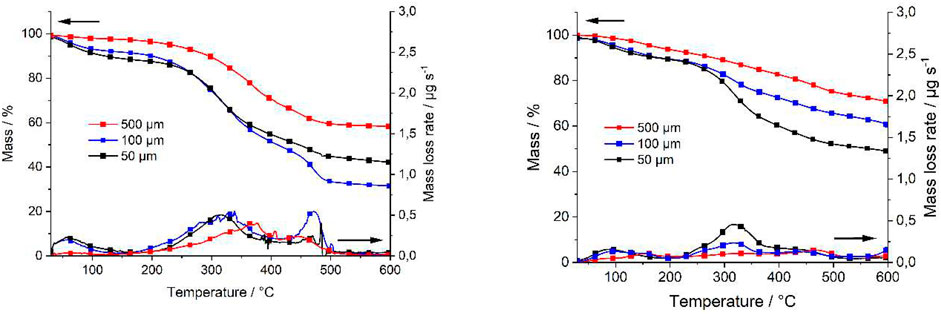
FIGURE 1. TGA results of all three fractions of the WWTP effluent exemplarily for winter (A) and summer (B) samples at 1 day.
The identification of MPs was done by screening for specific markers in the GC/MS data. Figure 2 shows the peak areas of the detected polymer markers on all sampling days and fractions in 1 mg of the filter residue. On summer days, PE, PS, and PP were detected in the samples, whereas on winter days only PE and PS were detected. The reason for the increased levels of PP found in the summer samples is not clear and is beyond the scope of this study.
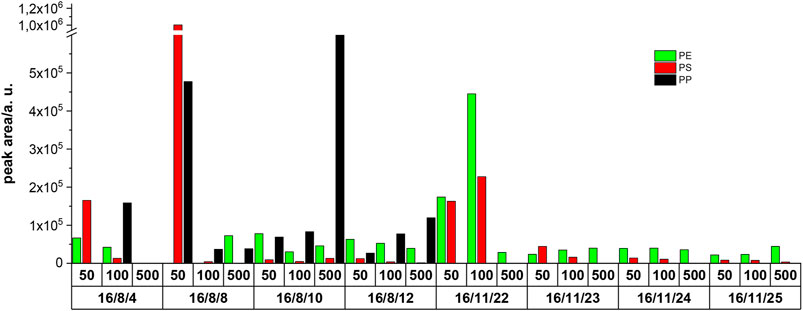
FIGURE 2. Peak areas of the detected polymers in 1 mg of filter residue determined by the first-stage TED-GC/MS; 50, 100, and 500 represent the fraction particle size cutoff in µm, after the fractionated filtration.
Additional screening for specific markers of PA, PET, and PMMA was performed, but it revealed no evidence of their presence above their individual LOD (4, 20, and 3 µg of absolute polymer mass in the crucible, respectively).
The three detected polymers (PE, PS, and PP) are, according to the literature, among the most frequently verified polymers in the effluents of WWTP. Murphy et al. (2016) identified, among others, PE and PS as the most commonly occurring polymers in the final effluent of a WWTP in Glasgow. Mintenig et al. (2017) identified PE and PP as the most frequently detected polymers in the fraction larger than 500 µm. In the fraction smaller than 500 μm, PE and PS were observed.
Based on this measurement campaign, it was found that fatty acids also form alkadienes as pyrolysis products in first-stage TED-GC/MS measurements (by appropriate detection of the complimentary fatty acid molecules). However, the alkadienes from fatty acids could be distinguished from the alkadienes from PE. In addition, co-elutions of unknown environmental matrix components with the alkadienes, which were used for quantification of PE, were observed. Therefore, the winter samples were reanalyzed using the second-stage TED-GC/MS system equipped with an HP-5MS column affording a better separation of signals. The use of this type of column eliminated co-elutions.
Comparison of Quantification Methods
Three different quantification procedures were performed to identify the most accurate and suitable method for practical application. This was done exemplarily for two of the present WWTP effluent samples.
First, a “1-point calibration” without any environmental matrix was carried out for a first approximation. For each polymer type, defined masses of pure reference polymers were measured by TED-GC/MS in duplicate. Based on these results, the peak areas were used to deduce the masses of polymers in the environmental samples. This method can be considered as first approximation because environmental matrix effects are not included. The advantage, however, is the low expenditure of time since the values can then be used for the determination of polymer mass contents in various or unknown environmental matrices.
For the inclusion of environmental matrix effects, the “standard addition” method was used as the second quantification procedure. The present environmental samples were spiked with exact amounts of reference polymers and measured again. The procedure was repeated three times. The difference in signal intensities is attributable to the mass of the added reference polymers. This method is more accurate because of the inclusion of environmental matrix effects, but more time-consuming since spiking and re-measurement must be done for each sample. As the TED-GC/MS is a destructive method, this quantification protocol is restricted to samples with a sufficient amount of sample mass.
As a third independent method for the quantification, an “external matrix calibration” was performed. For this purpose, a well-characterized, plastic-free reference environmental matrix was chosen; in this case, a natural matrix consisting of suspended particulate matter from a river expected to be plastic-free. The environmental matrix (∼15 mg) was spiked with 0.07, 0.19, 0.30, 0.57, and 1.05 mg of PE and 0.01, 0.04, 0.05, and 0.10 mg PS and analyzed (Figure 3). Linear correlation coefficients of 0.993 for PE and 0.988 for PS were achieved. It is expected that the external matrix calibration depicts environmental matrix effects, but a new calibration is necessary for every type of environmental matrix. However, for a routine quantification, an MP-free environmental matrix should be available, which is not expected to be feasible in practice for a WWTP effluent.

FIGURE 3. Exemplary external matrix calibration curves for PE and PS.
The masses of polymers determined by different types of quantification procedures using the TED-GC/MS system are presented in Table 2 for the two selected exemplary samples.
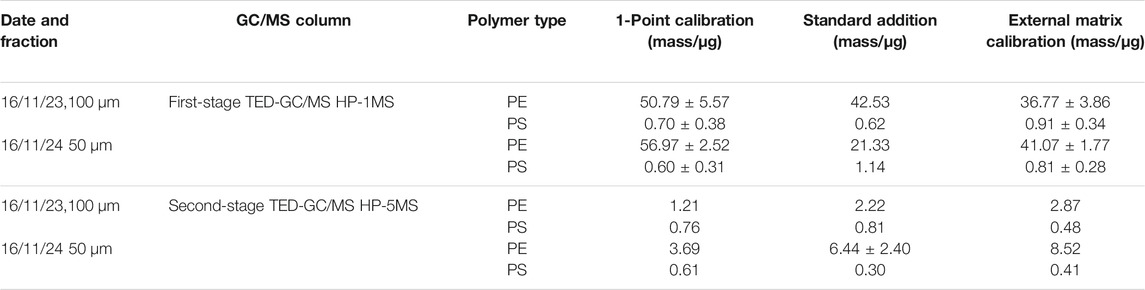
TABLE 2. Quantification of PE and PS in 1 mg of dry mass of the exemplary selected effluent samples (data with ± based on at least two measurement repetitions).
For PS, nearly comparable results, or better said, in a comparable dimensions, were found independent of the quantification procedure using either HP-1MS or HP-5MS columns in all measurements. For the 100 µm fraction sample, polymer mass contents of 0.6–0.9 µg (HP-1MS) and 0.5–0.8 µg (HP-5MS) were determined as well as for the 50 µm fraction sample 0.6–1.1 µg (HP-1MS) and 0.3–0.6 µg (HP-5MS). The relative errors of the different evaluation methods are up to 50%, but this is caused by the high sensitivity of TED-GC/MS to decomposition products of PS (see the slope of Figure 3). Therefore, minor deviations (including slight sample inhomogeneities) in the PS mass content have a strong effect on the quantification process. Using the 1-point calibration protocol, the PS mass content was found to be higher. As a result, the PS mass content will always be overestimated using 1-point calibration, by a factor of approximately two. The determined mass contents when applying the HP-1MS column for PE are very similar for all quantification procedures of 37–51 µg (100 µm fraction) and 20–57 µg (50 µm fraction). The relative errors of <11% for all evaluation methods are clearly lower than those for the PS values.
Because of the abovementioned co-elutions in the HP-1MS column, which prevented correct PE marker peak integration, the evaluation of the quantification procedures were repeated using the second-stage TED-GC/MS equipped with an HP-5MS GC column. In summary, the absolute PE mass contents are significantly lower, but the different quantification procedures result in similar ranges of PE loads in the samples determined as 1.2–2.9 µg (100 µm fraction) and 3.7–8.5 µg (50 µm fraction). The determined polymer mass contents using standard addition and external calibration are very similar. Using the 1-point calibration protocol, the PE mass content was found to be lower. The response factors obtained from the 1-point calibration suggest a high level of sensitivity that cannot be achieved with real samples. As a result, the PE mass content will always be underestimated using 1-point calibration, by a factor of approximately two.
For the subsequent quantification of the MP mass contents of the effluent samples, the 1-point calibration protocol was applied. It provides a sufficient approximation while exhibiting a high measurement time efficiency. Regarding the more accurate standard addition, an error must be considered. This means the determined PS values are overestimated at least by a factor of two, whereas the PE values are underestimated by a factor of two. Even though a factor of two sounds critical for the determination of environmental pollution in a screening this is still sufficiently exact. Actual measurements use a fourth quantification method, the “environmental matrix related response factors”. For a set of samples with similar environmental matrix composition, a compromise between measuring effort and result accuracy can be achieved by using the following protocol. After identification of relevant markers, defined quantities of reference polymers are added for a second measurement to a single sample of the set. The spiked sample should have a very high homogeneity, be representative for the sample set, and should be used in the same amount as in the first measurement. The measurement of the spiked sample should be performed shortly after the measurements of the raw samples. The resulting matrix-dependent response factors are subsequently used to determine the polymer contents of the original samples.
Quantification Wastewater Treatment Plant Effluent
During the sampling process, different solid contents were obtained for the individual sieve fractions (500, 100, and 50 µm). For an absolute mass calculation per volume of water, the total suspended matter contents must be recorded during sampling. Table 3 shows the masses of dried samples at the different sampling days and mass fractions measured for 1 m3 effluent. Using the investigated dried masses, the mass fractions of PS and PP (using the first-stage TED-GC/MS measurements) was quantified in the sampled water volume of one cubic meter following the 1-point calibration protocol (Figure 4). For PE, the calculation was not done because the co-elution would distort the result.
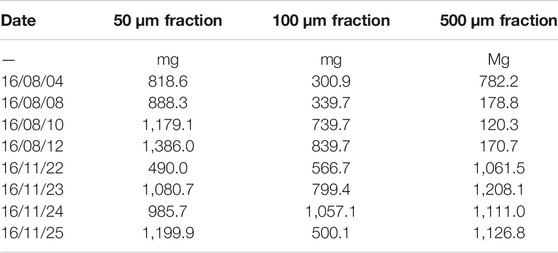
TABLE 3. Dry masses of suspended particulate matter of the fractions in 50, 100, and 500 µm of the effluent (1 m3) on all sampling days.
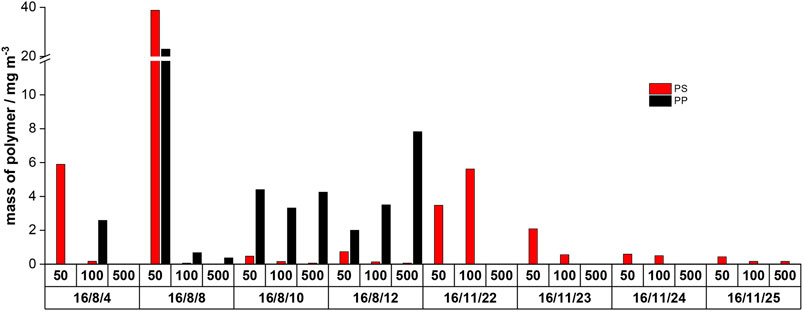
FIGURE 4. Overview of only PS and PP contents in 1 m3 of WWTP effluent; 50, 100, and 500 represent the fractions in µm which were received after fractional filtration (PE was not evaluated because of faulty co-elutions).
PS and PP were found to be prevalent during all summer days but with highly fluctuating mass contents. During the winter sampling days, only PS was detected; here, the mass contents seem very consistent. Considering the high temporal variability of the MP mass contents (summer/winter and daily fluctuations), the evaluation of WWTP’s MP emissions based on single samples or measurements appears questionable.
As already discussed before, co-elutions influence the PE marker substances. Therefore, additional measurements of selected samples were performed with the automated second-stage TED-GC/MS using an HP-5MS column. The results are presented in Figure 5. Due to the better sensitivity of the second-stage TED-GC/MS system, PP signals could be identified in some of the samples.
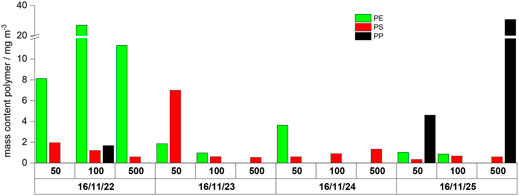
FIGURE 5. Overview of the detected polymers in 1 m3 of WWTP effluent re-measured with the automated second-stage TED-GC/MS (only winter samples); 50, 100, and 500 represent the fraction particle size cutoff in µm, after the fractionated filtration.
Strong variations of polymer types and polymer mass contents are observed not only for individual days but also for different fractions. A determination of averaged values or any statistic evaluation is therefore not meaningful. The evaluation of the data shows that the composition of the filter residue cannot be correlated with a general polymer mass content. Thus, the determination of suspended particular matter as a surrogate parameter cannot be used to predict an MP mass content. The determination of MP is needed for the assessment of WWTP effluents.
Considering the dry masses in Table 3 and the sum of the three filtration size classes, the MP load (only for PE, PP, and PS) in one cubic meter can be determined for each sample (Table 4). It should be considered that only the screened polymers (i.e., PA, PET, and PMMA) are taken into account, and additional non-screened polymers could be present in the sample (i.e., polyvinylchloride and polyacrylates). Values of 7–52 mg m−3 were determined. Evidently, the calculation of averaged values is not meaningful because of the large derivation and low sample numbers. It can also be concluded that the determination of MP in individual spot samples cannot be used to evaluate WWTP and that comprehensive sampling campaigns, including analyses, are necessary to reach a general conclusion. However, it also became obvious that the absolute MP mass content is a minor fraction in the suspended particulate matter.

TABLE 4. MP load of the WWTP effluent on various sampling days.
Imaging
To support the results of the TED-GC/MS measurements, FTIR imaging of an aliquot of the 100 µm fraction sampled on the 16/11/22 embedded in anhydrous KBr was performed using the transmission mode. This part of the study is not intended to be an additional, validated particle analysis but rather intends to validate whether the result of the TED-GC/MS analysis is plausible. A characteristic band between 1,517 cm−1 and 1,411 cm−1 was detected for PE, indicating CH2 bending vibration. The corresponding FTIR spectrum is shown in Figure 6. The integration of this band allowed the detection of three PE particles with dimensions between 110 and 180 µm. These results are consistent with the particle size information received with the fractionated filtration. By means of FTIR only PE could be detected in the samples. This confirms the TED-GC/MS result. Signals of PS and PP were not observed; however, these particles are expected to be significantly less and therefore were not detected with this single measurement.
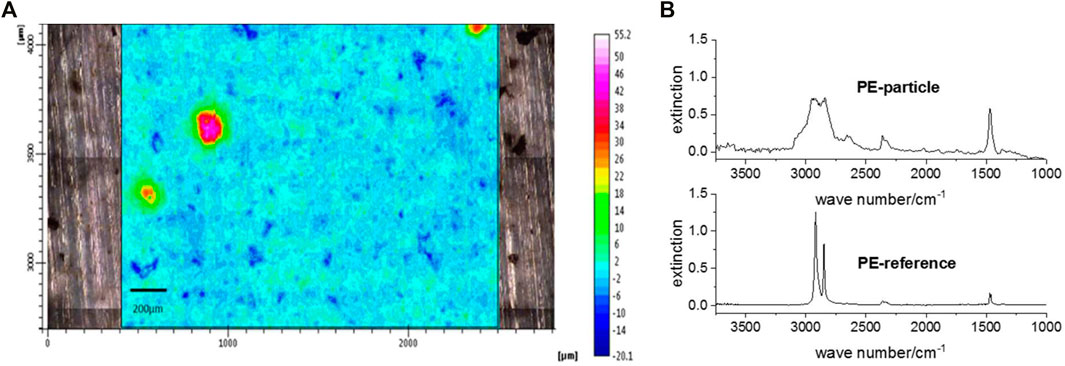
FIGURE 6. Chemical image with a dimension of 3,200 μm x 1,400 µm with a signal integration area of 1,517–1,411 cm−1 (A) and corresponding FTIR spectra of the particles (B).
Conclusion
In the present study, the MP mass fractions of the WWTP effluent were investigated for the several days in summer and winter. The analysis of MP was achieved using a fractionated filtration of the effluent and subsequent MP mass content determination of the dried suspended particulate matter by TED-GC/MS. This approach allows for representative samples of various types of waste water from the WWTP in practice (filtering large amounts of water without clogging the filter) as well as the fast determination the MP release into the environment by TED-GC/MS. TED-GC/MS is able to determine mass fractions of polymers in the WWTP effluent without further sample purification. Different types of up-to-date quantification methods were tested, and their accuracy and feasibility have been proven in practice.
Various masses of PE, PS, and PP in the effluent of the WWTP were analyzed. Additional signals of PA, PET, and PMMA were not detected. The detected mass fractions vary strongly, depending on the season, the particle size classes, and the different sampling days. The polymer masses in the effluent range from ca. 6 mg m−3 up to ca. 51 mg m−3. Depending on the applied quantification method (the choice is restricted by the available sample masses and time), the individual data may under- or overestimate the MP concentrations, by a maximum factor of two.
In principle, the thermo-analytical detection is suitable as an MP monitoring tool by determining the MP mass fractions from WWTP effluents. Due to the limited amount of data from spot samples, general MP calculations, such as mass flows per person and year, are still not meaningful. Therefore, more comprehensive studies are needed to gain an accurate picture of MP emissions from WWTPs.
The method can be applied in routine without sample preparation (a key request for the method), but it leads to a more challenging data evaluation than, for example, Py-GC/MS. Part of this can be overcome by using improved technical equipment (sort of GC column), user knowledge, and new, alternative quantification options, which are in progress. The application of the method to other samples, the application by other groups, and a meaningful exchange of pitfalls and complication will further accelerate this process.
Data Availability Statement
The original contributions presented in the study are included in the article/Supplementary Material, further inquiries can be directed to the corresponding author.
Author Contributions
CG, KA, and PE did the TED-GC/MS data. AE realized the FTIR results. CB, MR, NO, A-KB, and TS did the sampling. MJ and UB are the supervisors of the work.
Funding
The investigations were supported by the German Federal Ministry of Education and Research (BMBF) within the project MiWa (Funding Number 02WRS1378A) and the project OEMP (Funding Number 03XP0045D).
Conflict of Interest
The authors declare that the research was conducted in the absence of any commercial or financial relationships that could be construed as a potential conflict of interest.
Publisher’s Note
All claims expressed in this article are solely those of the authors and do not necessarily represent those of their affiliated organizations, or those of the publisher, the editors, and the reviewers. Any product that may be evaluated in this article, or claim that may be made by its manufacturer, is not guaranteed or endorsed by the publisher.
Acknowledgments
The manuscript writing was done under the extended responsibility of J. Heidemeier (UBA). The authors would like to thank him for his valuable contributions to the topic, although they cannot reach him anymore because he passed away in 2019. Furthermore, we thank S. Giess (UBA) for treatment of the samples and M. Kittner (BAM) for the graphical abstract.
References
Altmann, K., Braun, U., Fischer, D., Fischer, D., Ivleva, N., Sturm, H., et al. (2021). Cross-Cutting Topic 1: Analytics and Reference Materials: Comparative Test. Available at: https://bmbf-plastik.de/en/node/370.
Bannick, C. G., Szewzyk, R., Ricking, M., Schniegler, S., Obermaier, N., Barthel, A. K., et al. (2019). Development and Testing of a Fractionated Filtration for Sampling of Microplastics in Water. Water Res. 149, 650–658. doi:10.1016/j.watres.2018.10.045
Ben-David, E. A., Habibi, M., Haddad, E., Hasanin, M., Angel, D. L., Booth, A. M., et al. (2021). Microplastic Distributions in a Domestic Wastewater Treatment Plant: Removal Efficiency, Seasonal Variation and Influence of Sampling Technique. Sci. Total Environ. 752, 141880. doi:10.1016/j.scitotenv.2020.141880
Browne, M. A., Crump, P., Niven, S. J., Teuten, E., Tonkin, A., Galloway, T., et al. (2011). Accumulation of Microplastic on Shorelines Woldwide: Sources and Sinks. Environ. Sci. Technol. 45 (21), 9175–9179. doi:10.1021/es201811s
Castañeda, R. A., Avlijas, S., Simard, M. A., Ricciardi, A., and Smith, R. (2014). Microplastic Pollution in St. Lawrence River Sediments. Can. J. Fish. Aquat. Sci. 71 (12), 1767–1771. doi:10.1139/cjfas-2014-0281
Duemichen, E., Eisentraut, P., Celina, M., and Braun, U. (2019). Automated thermal Extraction-Desorption Gas Chromatography Mass Spectrometry: A Multifunctional Tool for Comprehensive Characterization of Polymers and Their Degradation Products. J. Chromatogr. A 1592, 133–142. doi:10.1016/j.chroma.2019.01.033
Dümichen, E., Barthel, A. K., Braun, U., Bannick, C. G., Brand, K., Jekel, M., et al. (2015). Analysis of Polyethylene Microplastics in Environmental Samples, Using a thermal Decomposition Method. Water Res. 85, 451–457. doi:10.1016/j.watres.2015.09.002
Dümichen, E., Eisentraut, P., Bannick, C. G., Barthel, A. K., Senz, R., and Braun, U. (2017). Fast Identification of Microplastics in Complex Environmental Samples by a thermal Degradation Method. Chemosphere 174, 572–584. doi:10.1016/j.chemosphere.2017.02.010
Eisentraut, P., Dümichen, E., Ruhl, A. S., Jekel, M., Albrecht, M., Gehde, M., et al. (2018). Two Birds with One Stone-Fast and Simultaneous Analysis of Microplastics: Microparticles Derived from Thermoplastics and Tire Wear. Environ. Sci. Technol. Lett. 5 (10), 608–613. doi:10.1021/acs.estlett.8b00446
Elert, A. M., Becker, R., Duemichen, E., Eisentraut, P., Falkenhagen, J., Sturm, H., et al. (2017). Comparison of Different Methods for MP Detection: What Can We Learn from Them, and Why Asking the Right Question before Measurements Matters? Environ. Pollut. 231 (Pt 2), 1256–1264. doi:10.1016/j.envpol.2017.08.074
Freeman, S., Booth, A. M., Sabbah, I., Tiller, R., Dierking, J., Klun, K., et al. (2020). Between Source and Sea: The Role of Wastewater Treatment in Reducing marine Microplastics. J. Environ. Manage. 266, 110642. doi:10.1016/j.jenvman.2020.110642
Funck, M., Yildirim, A., Nickel, C., Schram, J., Schmidt, T. C., and Tuerk, J. (2020). Identification of Microplastics in Wastewater after cascade Filtration Using Pyrolysis-GC-MS. MethodsX 7, 100778. doi:10.1016/j.mex.2019.100778
Gies, E. A., LeNoble, J. L., Noël, M., Etemadifar, A., Bishay, F., Hall, E. R., et al. (2018). Retention of Microplastics in a Major Secondary Wastewater Treatment Plant in Vancouver, Canada. Mar. Pollut. Bull. 133, 553–561. doi:10.1016/j.marpolbul.2018.06.006
ISO 21960: ISO/TR 21960 (2020). Plastics — Environmental Aspects — State of Knowledge and Methodologies.
Lares, M., Ncibi, M. C., Sillanpää, M., and Sillanpää, M. (2018). Occurrence, Identification and Removal of Microplastic Particles and Fibers in Conventional Activated Sludge Process and Advanced MBR Technology. Water Res. 133, 236–246. doi:10.1016/j.watres.2018.01.049
Magnusson, K., and Norén, F. (2014). Screening of Microplastic Particles in and Down-Stream a Wastewater Treatment Plant.
Mason, S. A., Garneau, D., Sutton, R., Chu, Y., Ehmann, K., Barnes, J., et al. (2016). Microplastic Pollution Is Widely Detected in US Municipal Wastewater Treatment Plant Effluent. Environ. Pollut. 218, 1045–1054. doi:10.1016/j.envpol.2016.08.056
McCormick, A., Hoellein, T. J., Mason, S. A., Schluep, J., and Kelly, J. J. (2014). Microplastic Is an Abundant and Distinct Microbial Habitat in an Urban River. Environ. Sci. Technol. 48 (20), 11863–11871. doi:10.1021/es503610r
Mintenig, S. M., Int-Veen, I., Löder, M. G. J., Primpke, S., and Gerdts, G. (2017). Identification of Microplastic in Effluents of Waste Water Treatment Plants Using Focal Plane Array-Based Micro-fourier-transform Infrared Imaging. Water Res. 108, 365–372. doi:10.1016/j.watres.2016.11.015
Murphy, F., Ewins, C., Carbonnier, F., and Quinn, B. (2016). Wastewater Treatment Works (WwTW) as a Source of Microplastics in the Aquatic Environment. Environ. Sci. Technol. 50 (11), 5800–5808. doi:10.1021/acs.est.5b05416
Pivokonsky, M., Cermakova, L., Novotna, K., Peer, P., Cajthaml, T., and Janda, V. (2018). Occurrence of Microplastics in Raw and Treated Drinking Water. Sci. Total Environ. 643, 1644–1651. doi:10.1016/j.scitotenv.2018.08.102
Primpke, S., Fischer, M., Lorenz, C., Gerdts, G., and Scholz-Böttcher, B. M. (2020). Comparison of Pyrolysis Gas Chromatography/mass Spectrometry and Hyperspectral FTIR Imaging Spectroscopy for the Analysis of Microplastics. Anal. Bioanal. Chem. doi:10.1007/s00216-020-02979-w
Simon, M., van Alst, N., and Vollertsen, J. (2018). Quantification of Microplastic Mass and Removal Rates at Wastewater Treatment Plants Applying Focal Plane Array (FPA)-based Fourier Transform Infrared (FT-IR) Imaging. Water Res. 142, 1–9. doi:10.1016/j.watres.2018.05.019
Simon, M., Vianello, A., and Vollertsen, J. (2019). Removal of > 10 Mu M Microplastic Particles from Treated Wastewater by a Disc Filter. Water 11 (9), 11. doi:10.3390/w11091935
Tagg, A. S., Sapp, M., Harrison, J. P., Sinclair, C. J., Bradley, E., Ju-Nam, Y., et al. (2020). Microplastic Monitoring at Different Stages in a Wastewater Treatment Plant Using Reflectance Micro-FTIR Imaging. Front. Environ. Sci. 8, 9. doi:10.3389/fenvs.2020.00145
Talvitie, J., Mikola, A., Setälä, O., Heinonen, M., and Koistinen, A. (2017). How Well Is Microlitter Purified from Wastewater? - A Detailed Study on the Stepwise Removal of Microlitter in a Tertiary Level Wastewater Treatment Plant. Water Res. 109, 164–172. doi:10.1016/j.watres.2016.11.046
Keywords: microplastics, thermo-analytical methods, TED-GC/MS, mass content, wastewater, sewage
Citation: Goedecke C, Eisentraut P, Altmann K, Elert AM, Bannick CG, Ricking M, Obermaier N, Barthel A-K, Schmitt T, Jekel M and Braun U (2022) Development of a Routine Screening Method for the Microplastic Mass Content in a Wastewater Treatment Plant Effluent. Front. Environ. Chem. 3:844633. doi: 10.3389/fenvc.2022.844633
Received: 28 December 2021; Accepted: 28 February 2022;
Published: 22 March 2022.
Edited by:
Jie Wang, China Agricultural University, ChinaCopyright © 2022 Goedecke, Eisentraut, Altmann, Elert, Bannick, Ricking, Obermaier, Barthel, Schmitt, Jekel and Braun. This is an open-access article distributed under the terms of the Creative Commons Attribution License (CC BY). The use, distribution or reproduction in other forums is permitted, provided the original author(s) and the copyright owner(s) are credited and that the original publication in this journal is cited, in accordance with accepted academic practice. No use, distribution or reproduction is permitted which does not comply with these terms.
*Correspondence: Ulrike Braun, dWxyaWtlLmJyYXVuQHViYS5kZQ==
†These authors have contributed equally to this work