
94% of researchers rate our articles as excellent or good
Learn more about the work of our research integrity team to safeguard the quality of each article we publish.
Find out more
ORIGINAL RESEARCH article
Front. Environ. Chem., 20 September 2021
Sec. Sorption Technologies
Volume 2 - 2021 | https://doi.org/10.3389/fenvc.2021.729779
This article is part of the Research TopicEnvironmental Contamination Solutions for Complex Heterogeneous SystemsView all 10 articles
 Rick McGregor1*
 Leticia Benevenuto2
Per-and polyfluoroalkyl substances (PFAS) have been identified as emerging contaminants of concern in the environment in a wide variety of media including groundwater. Typically, PFAS-impacted groundwater is extracted by pump and treat systems and treated using sorptive media such as activated carbon and ion exchange resin. Pump and treat systems are generally considered ineffective for the remediation of dissolved phase contaminants including PFAS but instead are considered applicable for plume containment. An alternative to pump and treat is in-situ treatment. The demonstrated use of in-situ treatment for PFAS-impacted groundwater is limited with only colloidal activated carbon (CAC) being shown to effectively attenuate PFAS over short and moderate time periods. Active research topics for the in-situ treatment of PFAS include the effect of heterogeneity on the distribution of the CAC, the lifespan of the CAC itself, the effect of competitive adsorption/absorption, and the effect of other geochemical conditions on the removal process. This study looked at the effect of heterogeneity on the distribution of CAC and subsequent treatment of PFAS at a site with a multiple aquifer system. The site’s geology varied from a silty sand to sand to fractured bedrock with all three units being impacted by PFAS and benzene (B), toluene (T), ethylbenzene (E), and xylene (X). Parameters evaluated included the distribution of the CAC as well as the subsequent treatment of the PFAS and BTEX. Results of groundwater sampling indicated that the PFAS detected within the groundwater were treated effectively to below their respective reporting limits for the duration of the 1-year test in both the silty sand and sand aquifers. The PFAS in the fractured rock aquifer showed a different treatment profile with longer carbon chained PFAS being attenuated preferentially compared to the shorter carbon chained PFAS. These results suggest that competitive sorptive reactions were occurring on the CAC within the fractured rock. Analysis of the unconsolidated aquifer materials determined that direct push injection of the CAC was effective at delivering the CAC to the target injection zones with post-injection total organic carbon (TOC) concentrations increasing by up to three orders of magnitude compared to pre-injection TOC concentrations. Heterogeneity did have an impact on the CAC distribution with higher hydraulic conductivity zones receiving more CAC mass than lower hydraulic conductivity zones.
The in-situ treatment of groundwater impacted by petroleum hydrocarbons and chlorinated solvents is well established (Interstate Technology and Regulatory Council ITRC, 2005; Huling and Pivetz, 2006; Petri et al., 2011; Usman et al., 2012; Sra et al., 2013; Kashir and McGregor, 2015; Saeed et al., 2021) with in-situ chemical oxidation (ISCO), in-situ chemical reduction (ISCR), and enhanced bioremediation (EBR) being the most applied.
The in-situ treatment of emerging compounds of concern such as per and polyfluoroalkyl substances (PFAS), synthetic dyes and synthetic musks have become a topic of interest over the past few years as stakeholders look for more economical and technically feasible options for treating groundwater impacted by these compounds (McGregor, 2018; McGregor and Maziarz, 2021; McGregor and Zhao, 2021; McGregor and Carey, 2019). The emerging compounds of concern that have garnered the most attention is the PFAS with most studies focused on the above-ground treatment. Simon (2020) estimated that there may be greater than 42,000 PFAS-impacted sites around the world which could cost over $80 billion to address. The in-situ treatment of PFAS is limited to a few field studies (Darlington et al., 2018; Interstate Technology and Regulatory Council ITRC, 2018; McGregor, 2018; Ross et al., 2018; McGregor, 2020a; McGregor and Zhao, 2021). The treatment of PFAS-impacted groundwater is complex due to numerous physical and chemical factors. These include PFAS’ resistance to biological and chemical degradation due to the strong carbon-fluoride bonding (National Ground Water Association National Ground Water Association Press, 2017); the low regulatory guidelines for treatment; poorly understood environmental fate and transport processes; and limited proven remedial approaches (Simon et al., 2019). These factors combined with other technical challenges including distribution, required contact between the PFAS and the remedial reagent, and back/matrix diffusion can all influence the outcome of in-situ treatment.
Laboratory and field studies for the in-situ treatment of dissolved PFAS have focused on using sorptive media for the removal of the PFAS with chemical oxidation also being evaluated. (Higgins and Luthy, 2006; Park et al., 2016; Bruton and Sedlak., 2017; Eberle et al., 2017; Dombrowski et al., 2018; McGregor, 2018; Aly et al., 2019; Barajas, 2019; Carey and McGregor, 2019; McGregor, 2020a; Interstate Technology and Regulatory Council ITRC, 2020; Liu et al., 2020; McGregor and Zhao, 2021). Sorptive media for the in-situ treatment of dissolved PFAS is limited by the amount of sorptive capacity of the media itself (Higgins and Luthy, 2006; Yu et al., 2009; Carter and Farrell, 2010). In the case of activated carbon, the mass of PFAS removed is a function of the activated carbon’s surface area. Xiao et al. (2017) determined that while granular and powdered activated carbon were effective over the short and moderate term at removing various PFAS. Particle size had a significant influence on breakthrough with powdered activated carbon having a longer breakthrough time than granular activated carbon (Xiao et al., 2017). Other factors affecting the effectiveness of activated carbon include the type of carbon being used (i.e., coal vs. plant based); the ratio of macro, meso, and micropores of the activated carbon; and the hydrophobicity of the individual PFAS. Other limitations include the delivery method and resulting distribution of the remedial reagents. To overcome some of these limitations, a colloidal form of activated carbon was developed for the injection into the subsurface. Colloidal activated carbon offers advantages over powdered and granular due to its smaller particle size making it easier to inject while having a larger surface area and sorptive capacity on a unit weight basis compared to granular and powdered activated carbon.
Colloidal transport within unconsolidated and fractured geologic media has shown that various colloids can be present within groundwater including inorganic and organic colloids. The transport of colloids within groundwater is controlled by advection and diffusion (De Jong et al., 2004; Frimmel et al., 2007). The advantages of using colloidal reagents for in-situ remediation include the ease of injection compared to powdered/granular reagent forms (i.e., less pressure required) and potentially larger areas of influence.
McGregor (2020a, 2020b) demonstrated that CAC could be effectively delivered to the target injection areas using direct push technology (DPT) with greater than 90 percent of the targeted aquifers having CAC being measured within the solids. Coarse-grained materials such as powdered activated carbon (PAC), ion exchange resin and biochar were significantly affected by heterogeneities within the aquifer which subsequently impacted the performance of the media. Specifically, the remedial reagents preferentially accumulated in higher hydraulic conductivity zones when compared to zones of lower hydraulic conductivity. The heterogenetic distribution of the various reagents was determined to be a result of the particle size of the reagents with reagents greater than 10 microns being heavily influenced by heterogeneities within the aquifers. Other concerns with using sorptive media for PFAS removal include competition between the PFAS and other organic and inorganic compounds within the groundwater. In addition to matrix-diffusion and desorption issues in heterogeneous geologic materials over the long term (Carey et al., 2015; Carey and McGregor, 2019).
Limited in-situ field studies using colloidal sorptive media for the removal of PFAS suggests that over short and moderate time, PFAS can be removed from solution to below regulatory requirements. McGregor (2020a, 2018) showed that CAC is effective at removing both PFAS and other organic compounds of concern including benzene (B), toluene (T), ethylbenzene (E), xylene (X), gasoline, and diesel range petroleum hydrocarbons (GRO and DRO). McGregor and Zhao (2021) demonstrated at a site with trichloroethene (TCE) and its dichlorination by-products; 1.2 cis dichloroethene (1,2 DCE), and vinyl chloride could be treated to regulatory requirements within a moderately heterogenetic aquifer system. Numerical modeling of field data by Carey and McGregor (2019) estimated that CAC would be effective at controlling back/matrix diffusion reactions over several decades.
The use of CAC in complex geologic settings for treatment of PFAS is not well demonstrated in the literature. McGregor (2018) demonstrated that CAC could be injected into an unconsolidated silty sand aquifer containing a seam of higher hydraulic conductivity sand. The unconfined aquifer was impacted by petroleum hydrocarbons and PFAS. Testing of the aquifer solids, post injection, indicated that the CAC was effectively distributed within the target injection zone. Monitoring of the groundwater over a 5-year period showed that the various PFAS detected within the groundwater prior to the injection of the CAC remain below their respective reporting limits. Numerical modeling of the results of the study by Carey and McGregor (2019) predicted that the CAC would continue to remove the PFAS from the groundwater for decades indicating that processes such as back and matrix diffusion could be effectively controlled at this site.
McGregor (2020a) completed a field study within a sand aquifer using a series of six reactive zones with each zone testing a unique reagent including CAC, PAC, ion exchange resin, biochar, hydrogen peroxide, and sodium persulphate. The results of the 18-months study indicated that the CAC removed the relevant PFAS to below their respective reporting limits whereas the oxidants were not effective at attenuating the PFAS. The PAC, ion exchange resin, and biochar were partially effective at removing the relevant PFAS, however lower carbon chained PFAS (i.e., C4 and C5) was measured downgradient of the reactive zones. The PFAS within the groundwater broke though downgradient due to poor reagent distribution, related to grain size. McGregor and Zhao (2021) implemented a field study involving the injection of CAC in an unconfined silty sand aquifer containing a higher hydraulic conductivity sand lens. The groundwater was impacted by PFAS, TCE, and its dichlorination by-products; 1,2 DCE, and vinyl chloride. The study showed that the CAC could be effectively injected and distributed into the target injection zone. Subsequent monitoring of the groundwater determined that the relevant PFAS and chlorinated ethenes were removed to below their reporting limits over the 24-months monitoring period.
While the aquifers at these sites were mildly heterogenetic, the PFAS were contained within a single aquifer and thus represented a relatively simplistic hydrogeologic/geologic system. The use of CAC to treat PFAS within complex multiple aquifer systems remains unstudied with no peer-reviewed literature available to date. This study evaluated the effectiveness of treating PFAS in a three-aquifer system that had a complex geologic environment consisting of a silty sand till, alluvial sand unit and a fractured dolostone bedrock. The objectives of the study were to determine if CAC could be effectively distributed within a three-aquifer system and effectively treat various PFAS within the groundwater over a short and moderate period.
The study site is in Central Canada at a small industrial location that was the scene of a fire in which fire-fighting foam was used to suppress the fire. The foam contained various PFAS which were released to the shallow groundwater during and following fire suppression operations. The site is underlain by an approximately 6-m (m) thick layer of glacial till dominated by silty sand. A thin (∼0.05 m) sandy layer occurs within the silty sand at a depth of approximately 4 m below ground surface (mbgs). Underlying the silty sand till is a medium grained sand unit that is up to 3 m thick. The sand unit overlies a fractured dolostone bedrock. The site acts as a groundwater recharge area with the water table situated within the silty sand till unit at a depth of approximately 2.5 mbgs.
The characterization and monitoring of the site was completed with the aid of a series of multilevel wells and continuous cores. The groundwater was monitored using three CMT Multilevel Systems (Solinst, Canada) including one 3-channel system and two 7-channel systems (Figure 1). In addition to the CMT systems, three 0.07-m diameter boreholes were advanced into the shallow bedrock to a depth of 15 mbgs to allow for determination of fracture locations, hydraulic conductivity testing, and subsequent groundwater sampling. The bedrock boreholes were cased and cemented into the shallow bedrock with the bedrock annulus being left open to allow for the installation of inflatable packers (RST Instruments, Canada) (Figure 1). The boreholes for the CMT systems were drilled using 0.2 m-diameter hollow-stem augers with the 0.15-m long CMT screens being surrounded by coarse silica sand and sealed above and below each screen with hydrated bentonite.
To characterize the groundwater prior to and post-injection, groundwater samples were collected for analyses of various chemical parameters including PFAS, BTEX, major cations [calcium (Ca), magnesium (Mg]) potassium (K), sodium (Na), iron (Fe)], manganese [Mn], and anions [chloride (Cl), nitrate (NO3), and sulfate (SO4)] using low-flow sampling methods (Puls and Barcelona, 1996). The major cations were analyzed following United States Environmental Protection Agency (US EPA) Method 3010D which employs inductively coupled plasma optical emission spectroscopy (ICP/OES). Iron and Mn were analyzed using modified EPA 200.8 methodology employing inductively coupled plasma mass spectrometry (ICP/MS). The anions were analyzed following method SM 4100B using ion chromatography (IC). The PFAS concentrations were determined using solid phase extraction/liquid chromatography mass spectrometric detection (SPE/LCMS). The BTEX concentrations were measured using gas chromatography with mass spectrometric detection (GC/MS).
Select chemical parameters, including pH, oxidation-reduction potential (ORP), temperature, specific conductivity, turbidity, and dissolved oxygen (DO), were measured at the wellhead using a flow-through cell connected to a YSI Professional Plus hand-held multi-parameter meter (YSI; Yellow Springs, Ohio). The pH meter was calibrated to solutions of 4.0, 7.0, and 10.0 standard units prior to each sampling event, whereas the ORP was checked with Zobell’s solution (Nordstrom, 1977) prior to each sample measurement. Specific conductivity was calibrated to a National Institute of Standards and Technology (NIST) traceable standard solution. The samples for anions, PFAS and BTEX analyses were not filtered, whereas samples for alkalinity and dissolved cations were filtered with a 0.45-micron cellulose acetate membrane. The cation samples were acidified to pH below 2 with nitric acid (HNO3). Groundwater samples for PFAS and BTEX analysis were collected on seven occasions: 7 days prior to (Day -7) and on 182-, 273-, and 366-days post injection (Day 182, Day 273, and Day 366). Samples for the inorganic and general chemistry were collected on the Day-7 and Day 366 sampling events.
Horizontal hydraulic conductivity (KH) estimates within the overburden aquifers were completed using a flexible wall permeameter (ASTM International Inc. ASTM, 2016). Aquifer samples were collected using continuous cores, subdivided into 0.15 to 0.20 m-long samples. Estimates of the KH for the shallow bedrock were completed using straddle packers. Half-metre-long intervals of the bedrock boreholes were tested using constant head methods to determine KH with depth within each borehole. The KH tests for the three aquifers were completed under constant-head conditions using site groundwater.
Prior to testing for KH, samples of each core were collected for analysis of total organic carbon (TOC) to determine the organic matter content of the silty sand and sand aquifers prior to the injection. Additional cores were collected from the injection area 3 days post-injection to determine the distribution of the CAC. The samples were submitted to a commercial laboratory for TOC analysis following the combustion methods outlined by ASTM (ASTM International Inc. ASTM, 2011 and 2013). Cores of the fractured bedrock aquifer were collected pre- and post-injection of the CAC, however, due to the introduction of water during drilling operations, the CAC within the fracture zones was flushed away, thus making analysis for TOC inaccurate.
The CAC used in this study is sold under the brand name PlumeStop™ (Regenesis, San Clemente, CA). PlumeStop™ is a mixture of CAC and an organic carbon substrate that biodegrades over a short period of time. Once the substrate biodegrades, the CAC drops out of solution and coats the aquifer solids. The injection event was conducted over a 1-week period and involved the injection of 30,000 L (L) of CAC solution at 20 locations within the silty sand and sand aquifers. The number of injection locations was based on a 2.5 m grid spacing. At each location, the solution was injected over five vertical intervals to ensure vertical coverage of the two aquifers. The CAC was injected into the unconsolidated aquifers using DPT which delivered the CAC solution to the targeted injection areas via advective transport over the short term (i.e., minutes). Monitoring of the groundwater post injection indicated that the organic substrate degraded within 4 weeks of injection suggesting that the CAC was dispersed within the aquifer by advection processes during the injection event. The volume of solution was estimated based on an estimated pore volume of approximately 60,000 L with a replacement volume of 50 percent being targeted (i.e., 30,000 L). The ten-weight percent CAC solution was injected at flow rates ranging from 9.8 to 14.6 L/min (LPM) at pressures of up to 45 pounds per square inch (psi). The flow rate and pressure used during the injection program was minimized to reduce the possibility of hydraulic fracturing within the unconsolidated geologic media. Fracturing of the media can result in heterogenetic distribution of the reagents resulting in incomplete treatment of the PFAS (McGregor, 2020b). Within the bedrock, approximately 500 kg of CAC solution was injected at each of the six interval/packer during the week-long injection (Figure 1). Advection under injection and groundwater flow conditions are considered the dominant delivery mechanisms for the CAC solution within the fractured bedrock.
The water table at the site was measured over the 1-year monitoring period to be at a mean depth of approximately 2.5 mbgs. The water table varied up to a 0.11 m during the observation period. The aquifers are unconfined and the area acts as a groundwater recharge area with vertical hydraulic gradients averaging 0.018 downwards during the testing period.
Three continuous cores of the silty sand till and sand units were collected and subdivided for KH analysis using a flexible wall permeameter. A total of 42 samples were tested with 18 being measured from the sand aquifer and the 24 being tested from the silty sand aquifer. Within the silty sand aquifer, a thin (∼0.05 m) seam of sand was present within all three cores at a depth of approximately 4.0 mbgs. The geometric mean KH of the silty sand aquifer was 3.5 x 10⁻³ cm per second (cm/sec). The KH ranged from 9.7 x 10⁻⁴ cm/s to 8.0 x 10⁻² cm/s with the highest KH values being associated with the sand seam (Figure 2). The KH geometric mean for the sand aquifer was 3.9 x 10⁻² cm/s, ranging from 9.8 x 10⁻³ cm/s to 7.3x10⁻² cm/s (Figure 2). The mean horizontal hydraulic gradient across the injected area was 0.003 during the test period. Based on these measured KH values and an assumed effective porosity of 0.2, the mean horizontal groundwater flow velocity was calculated to range from 12 m/year in the silty sand unit to 220 m/year in the sand unit.
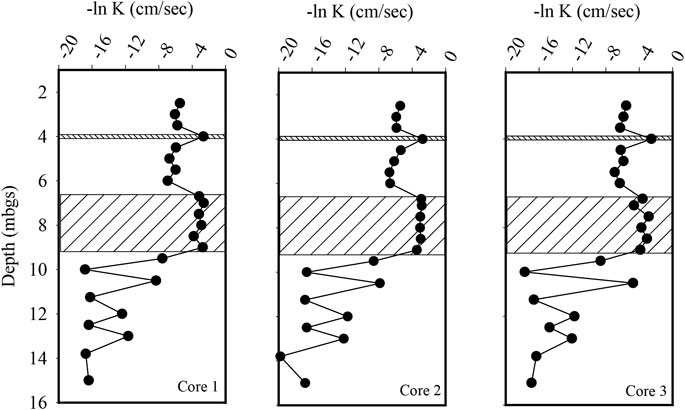
FIGURE 2. Horizontal hydraulic conductivity (KH) profiles within the three-aquifer system. The hatched area represents sand aquifer which is overlain by a silty sand till and underlain by a fractured dolostone.
To characterize the hydrogeology of the underlying fractured dolostone bedrock, three boreholes were advanced to a depth of 15 mbgs. The boreholes were cased through the overburden and then left open to allow for testing by a two-packer system that allowed for the isolation of 0.5 m long sections of the borehole. A total of 27 tests were conducted with the results shown in Figure 2. The tests identified three fracture zones located at 9.5, 10.5, and 12 mbgs, with the KH ranging from 4.1 x 10⁻⁶ to 8.9 x 10⁻³ cm/s within the fracture zones. In the bedrock with no interpreted fractures the KH geometric mean was 1.1 x 10⁻⁷ cm/s (Figure 2).
For successful in-situ treatment of PFAS to occur, the CAC must be distributed effectively within the aquifer to maximize contact between the CAC and the PFAS. At this site, the CAC was injected into the silty sand and sand aquifers using direct push technology. Within the bedrock, the CAC solution was injected into the fractured rock aquifer using pneumatic packers within the wells. Distribution of CAC is dominated by advection during the injection process. While diffusive-based transport of the CAC can occur, it is considered insignificant compared to advection at this site. Based on visual observations during the monitoring period, the CAC remained in solution for less than 4 weeks in the unconsolidated aquifers and less than 90 days within the fractured rock aquifer.
Prior to the injection of the CAC, three cores of the silty sand and sand aquifers were collected to determine the TOC concentration of the aquifer solids. The TOC concentration within the 24 samples collected from the silty sand aquifer ranged from the detection limit of 0.5–0.6 g per kilogram (g/kg), averaging 0.53 g/kg (SD = 0.04 g/kg) (Figure 3). Following the injection of the CAC solution, three additional cores of the aquifer were collected with the mean TOC concentration of the 24 samples being calculated to be 8.1 g/kg (SD = 2.50 g/kg) within the silty sand aquifer (Figure 3). Overall, the mean concentration of TOC within the silty sand aquifer increased by approximately 1,300 percent following the injection of the CAC solution. Post-injection, the highest TOC concentrations were measured in the three sand seam samples at a depth of approximately four mbgs with an average TOC concentration of 13.0 g/kg being calculated. The mean TOC concentration of the remaining 21 silty sand samples averaged 7.4 g/kg indicating that the CAC preferentially accumulated within the sand seam during the injection process by 74 percent on average.
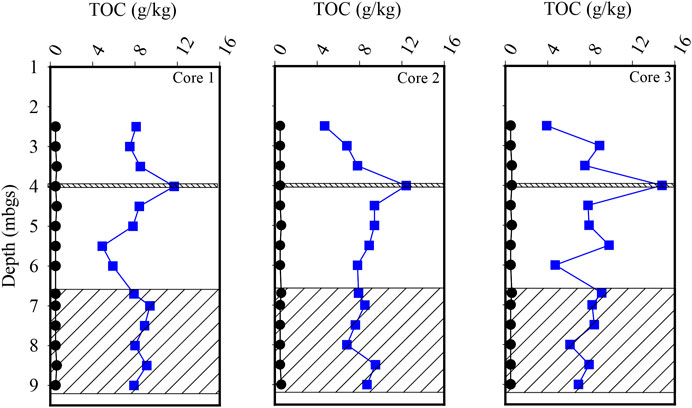
FIGURE 3. Vertical profiles of total organic carbon within the silty sand and sand (hatched) aquifers. The black circles represent pre-injection results, and the blue squares represent post-injection results.
Total organic carbon concentrations determined from the 18 sand aquifer samples averaged 0.52 g/kg (SD = 0.04 g/kg) prior to the injection of the CAC (Figure 3). Following the injection of the CAC solution, the mean TOC concentration increased to 7.99 g/kg (SD = 1.03 g/kg) for the 18 samples collected from the aquifer (Figure 3). This represents an increase of 1,430 percent in TOC concentration, similar to what was calculated for the overlying silty sand aquifer.
Due to sampling and analytical challenges, no analysis of TOC was completed on the bedrock samples.
To establish if the injection of CAC altered the overall groundwater geochemical conditions within the three aquifers, pre and post-injection groundwater samples were collected from the three aquifers. Groundwater sampling was conducted on two occasions, on Day -7 (pre injection) and on Day 366 (post injection) and analyzed for various inorganic and general chemical parameters including pH, ORP, dissolved oxygen, chloride, nitrate, sulphate, dissolved iron, dissolved manganese, and alkalinity.
Prior to the injection of the CAC solution, the mean pH of the groundwater collected from the 20 monitoring points within the silty sand and sand aquifers were 6.98 and 6.58, respectively. The pH of the groundwater sampled from the four bedrock monitoring points averaged 7.12.
One year after the injection of the CAC, the mean pH of the groundwater sampled from the eight sampling locations within the silty sand aquifer was 6.99 vs. a mean pH of 6.61 for groundwater collected from the six sampling locations within the sand aquifer where the CAC was injected. The mean pH of the four monitoring points within the fractured rock aquifer was 7.18 following the injection of the CAC solution.
Corresponding to the increase in the mean pH of the three aquifers following the CAC injection were increases in the groundwater alkalinity. Prior to the injection of the CAC within the silty sand and sand aquifers, the mean alkalinity of the groundwater was 420 and 357 mg/L (as CaCO3), respectively. Following the injection of the CAC solution, the mean alkalinity of the groundwater sampled from the silty sand and sand aquifers was 435 and 411 mg/L (as CaCO3), respectively. The mean alkalinity of the groundwater sampled from the four sampling locations within the shallow bedrock was 187 mg/L (as CaCO3) prior to the injection of the CAC. Following injection of the CAC, the mean alkalinity increased to 214 mg/L (as CaCO3) on Day 366. The increased alkalinity within the three aquifers is attributed to buffering reactions associated with increased biological activity due to the addition of the organic carbon-based CAC substrate and the subsequent reactions between the organic matter and nitrate within the groundwater in a biological-mediated denitrification reaction such as:
Concentrations of dissolved iron and manganese decreased following the injection of the CAC within all three aquifers. Prior to the injection of the CAC, the mean dissolved iron and manganese concentrations in groundwater sampled from the silty sand aquifer were 1.9 and 0.5 mg/L, respectively. The mean dissolved iron and manganese concentrations within the sand aquifer were 1.51 and 0.48 mg/L, respectively. Mean dissolved iron concentrations measured on Day 366 within the silty sand and sand aquifers were 0.5 and 1.2 mg/L, respectively. The dissolved manganese concentrations on Day 366 were determined to be less than the reporting limit of 0.005 mg/L for both aquifers. The decrease in dissolved iron and manganese within the groundwater is thought to be the results of sulphide mineral precipitation due to sulphate reduction reactions. Sulphate was detected within the silty sand, sand, and bedrock aquifers at mean concentrations of 2.9, 5.8, and 15.8 mg/L, respectively, on sampling event Day -7. On sampling event Day 366, sulphate mean concentrations were determined to be less than the reporting limit of 0.5 mg/L in all three aquifers, suggesting that sulphate reducing reactions were occurring post injection of CAC. This decrease in sulphate within the groundwater which corresponded to decreases in dissolved iron and manganese, is attributed to sulphate reduction reactions and the subsequent precipitation of sulphide minerals. The reduction of sulphate by organic matter is illustrated through the following reactions:
The acidity produced in these reactions is buffered by the carbonate minerals present within the aquifer including dolomite (MgCa(CO3)2) and calcite (CaCO3) as measured by the increase in alkalinity post injection. Corresponding to the detection of dissolved iron and manganese within the three aquifers was the presence of reducing geochemical conditions as reflected by the ORP. Prior to the injection of the CAC, the mean ORP measured for the silty sand, sand, and bedrock aquifers was −126, −147, and 45 mV, respectively, Following the injection of the CAC, the mean ORP for the silty sand, sand, and bedrock aquifers decreased to −155, −186, and −125, respectively. The decrease in ORP is likely the result of the addition of organic carbon associated with CAC. Nitrate was not detected within any monitoring wells prior to or post injection of the CAC.
The results of the general chemistry groundwater sampling suggests that prior to the injection of the CAC the groundwater within the three aquifers was buffered by carbonate minerals at a near neutral pH. The aquifers were reducing in nature, most likely the result of the presence of petroleum hydrocarbons, which have depleted most electron acceptors such as oxygen, nitrate, and sulphate. The addition of the CAC and its associated organic-carbon carrier fluid, appears to have enhanced the reducing conditions of the three aquifers and further promoted the reduction of sulphate in the groundwater. Resulting in the presumed precipitation of iron and manganese sulphide minerals which decreased the dissolved iron and manganese concentrations within the groundwater.
Prior to the injection of the CAC solution within the three aquifers, a total of nine PFAS were detected above the method reporting limit within the groundwater including PFBA, PFBS, PFPeA, PFHxA, PFHxS, PFHpA, PFOA, PFOS, and PFNA. Table 1 and Figures 4–7 provide summaries of the detected PFAS within the three aquifers including the six PFAS detected prior to the injection of the CAC in the silty sand aquifer, the five PFAS were detected prior to the injection of the CAC solution in the sand aquifer and the nine PFAS detected within the fractured bedrock prior to the injection of the CAC.
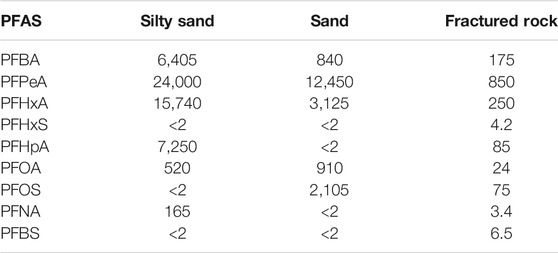
TABLE 1. Summary of maximum concentrations of detected PFAS within the three aquifers prior to the injection of the CAC. All units ng/L.
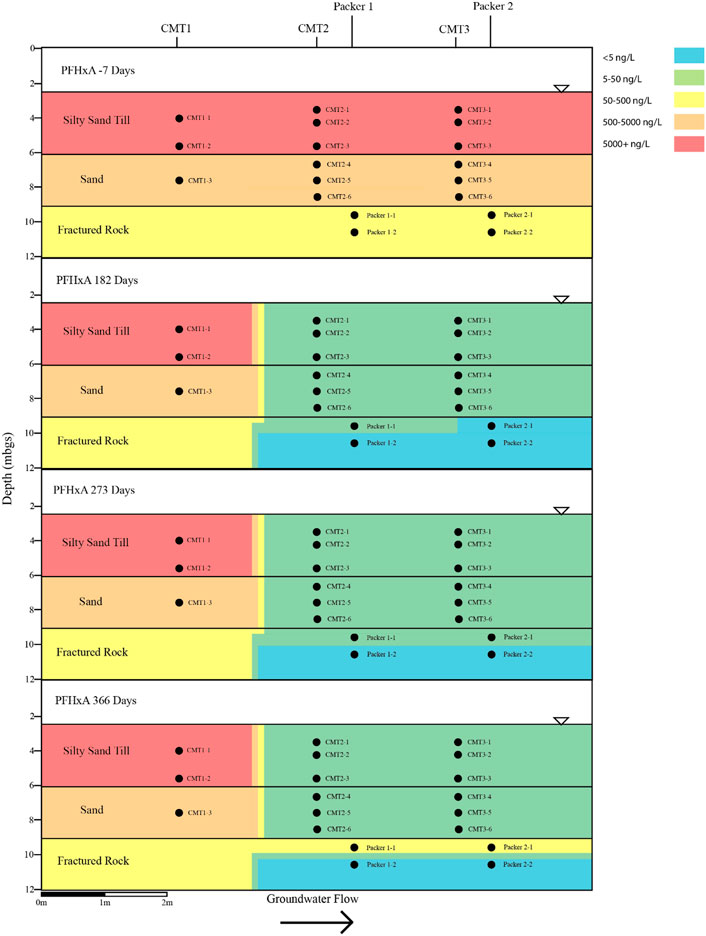
FIGURE 4. Cross sectional view of PFHxA within groundwater determined pre- and post-injection of the CAC within the three aquifers.
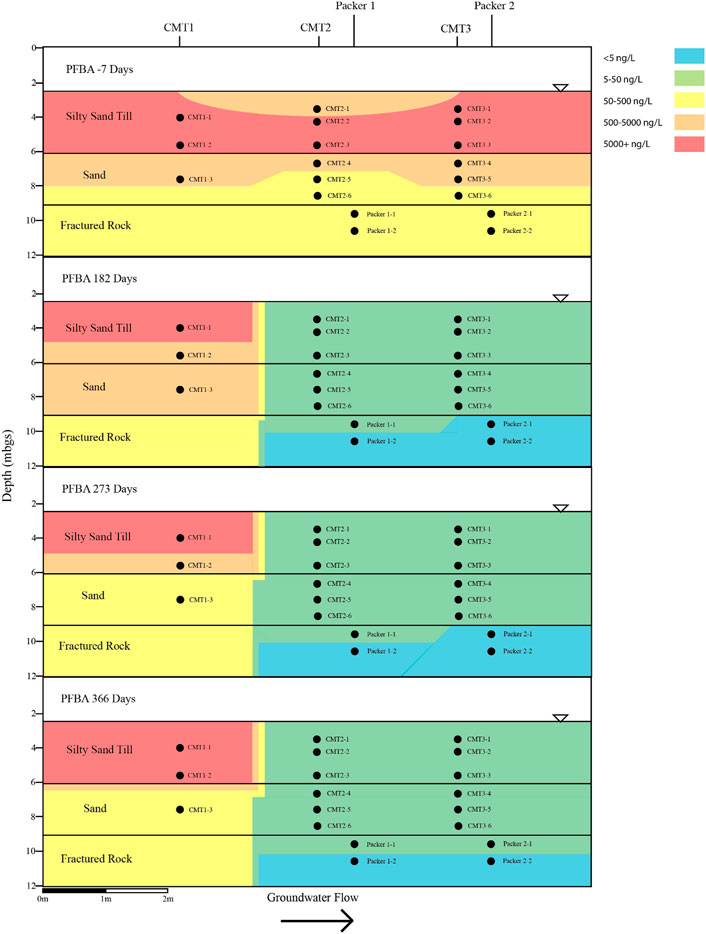
FIGURE 5. Cross sectional view of PFBA within groundwater determined pre- and post-injection of the CAC within the three aquifers.
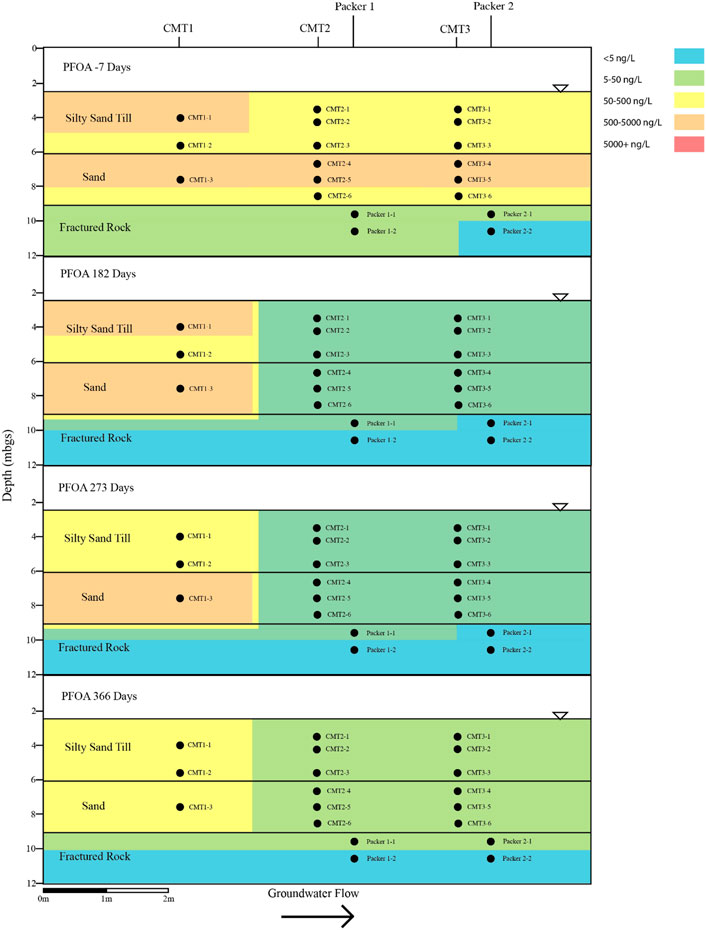
FIGURE 6. Cross sectional view of PFOA within groundwater determined pre and post-injection of the CAC within the three aquifers.
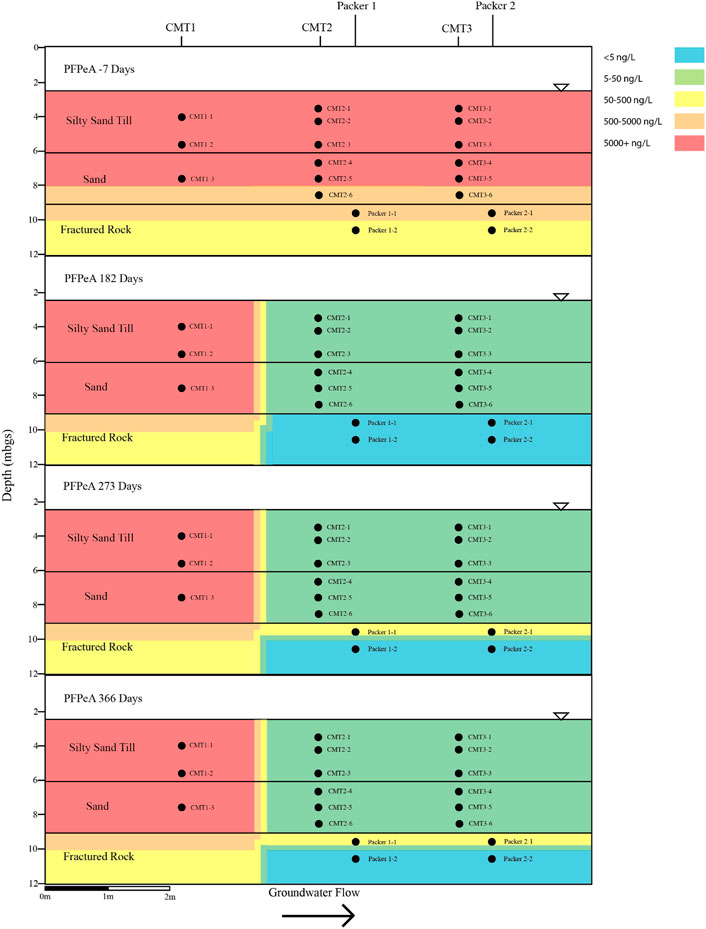
FIGURE 7. Cross sectional view of PFPeA within groundwater determined pre and post-injection of the CAC within the three aquifers.
Following the injection of the CAC solution, the concentration of the PFAS detected within the silty sand and sand aquifers decreased to below their respective reporting limits within 182 days of injection (Figures 4–7). Concentrations of PFAS within the groundwater sampled from both the silty sand and sand aquifers remained below their respective reporting limits for the duration of the sampling period (i.e., 366 days).
Within the fractured bedrock, groundwater PFAS concentrations decreased following the injection of the CAC with PFAS concentrations within Packer two borehole being measured below their respective reporting limits on Day 182 (Figures 4–7). Groundwater collected from Packer one borehole had concentrations of 24 ng/L for PFHxA and 5.2 ng/L for PFOA for groundwater sampled from the fracture zone situated at approximately 9.5 mbgs during the Day 182 sampling event. During the Day 273 sampling event the number and concentration of PFAS detected within the shallow fracture zone (i.e., 9.5 mbgs) increased in both Packer one and Packer two boreholes with six PFAS being detected within the groundwater collected from Packer one and Packer two boreholes. These included PFBA, PFHpA, PFHxA, PFOA, PFOS, and PFPeA. Groundwater sampling of the shallow fracture zone in Packer one and Packer two boreholes on Day 366 indicated that PFAS concentrations continued to increase with time in addition to the number of different PFAS being detected within the groundwater. During the Day 366 sampling event, seven PFAS were detected above the reporting limit including the six PFAS detected during the Day 273 event plus PFHxS which was measured at 2.8 ng/L (Figure 7). Concentrations of PFAS within the fracture zone located at a depth of 10.5 mbgs remained below their respective reporting limits during the 366-days testing period (Figures 4–7).
Based on the observed breakthrough of the PFAS within the bedrock aquifer, it appears that the carboxylic acids breakthrough prior to the sulfonic acids with the short carbon chained carboxylic acids being more mobile in the presence of CAC than the longer carbon chained carboxylic acids.
The PFAS plume is comingled, with a BTEX plume within the three aquifers underlying the site. The bulk of the BTEX mass within the groundwater is associated with the silty sand aquifer with BTEX concentrations generally decreasing with depth. The maximum concentration of BTEX within silty sand aquifer was 6,160 μg per litre (µg/L) which was measured in CMT1-2 on the Day -7 sampling event (Figure 8). The majority of mass within the BTEX plume is associated with the xylene and ethylbenzene fractions which make up 93 percent of the total BTEX within the sample collected from CMT1-2 on the Day -7 sampling event.
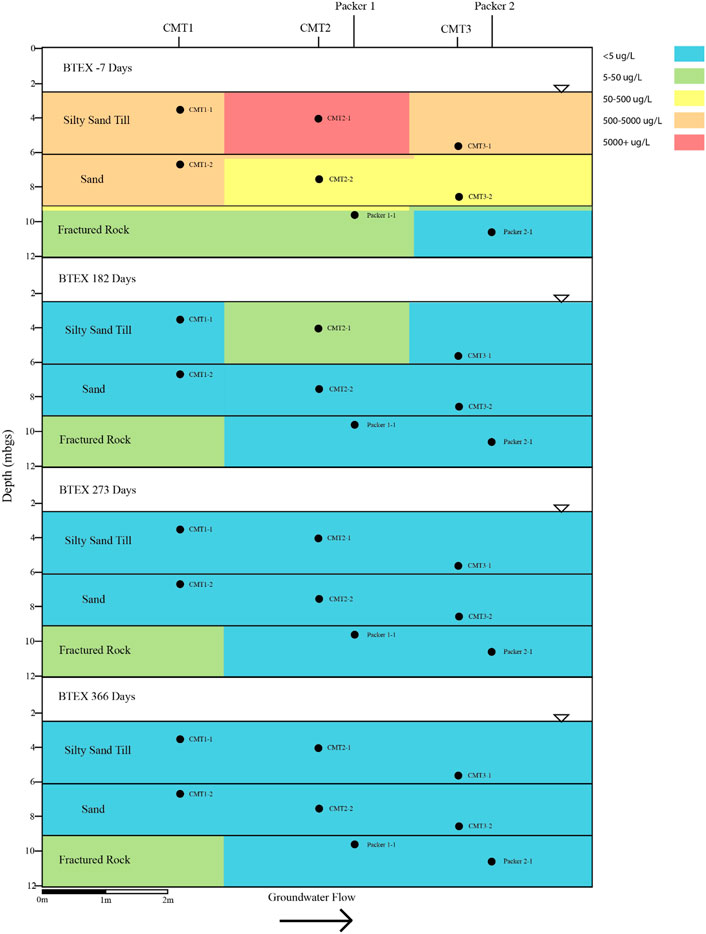
FIGURE 8. Cross sectional view of BTEX groundwater concentrations determined on pre- and post-injection of the CAC within the three aquifers.
Following the injection of the CAC, BTEX concentrations within the silty sand aquifer decreased to below their respective reporting limits for all three sampling events except for the Day 182 event where benzene was detected in samples collected from CMT2-1 and CMT3-1 (Figure 8). Benzene adsorption onto activated carbon has been shown to have less affinity for activated carbon than TEX, thus it would be expected to be the last to be removed via sorptive processes from the groundwater when present with other BTEX compounds.
The BTEX within the sand aquifer showed a similar behaviour, as with the BTEX within the silty sand aquifer. Concentrations of BTEX decreased following the injection of the CAC to below their respective reporting limits for all three sampling events apart from benzene being detected in groundwater sampled from CMT2-4 on the Day 182 sampling event (Figure 8). The maximum total concentration of BTEX within the sand aquifer prior to the injection of the CAC was 703 μg/L (CMT1-3, Figure 8).
The maximum concentration of BTEX within the fractured dolostone prior to the injection of the CAC solution was 9.6 μg/L (Packer 2-1, Day -7, Figure 8) with benzene and total xylene both being detected at 4.8 μg/L. Following the injection of CAC, the BTEX concentrations decreased to below their respective reporting limits for all three sampling events (i.e., Day 182, Day 273, and Day 366). Overall, the CAC was effective at removing the BTEX from the groundwater within the three aquifers with greater than 99.99 percent removal being calculated within the groundwater after 273 days of treatment.
The presence of PFAS within groundwater has been identified by many regulatory agencies as being a threat to human health and the ecology as some of PFAS have been confirmed or suspected of being cariogenic. The treatment of PFAS-impacted groundwater is currently dominated by pump and treat methods that employ activated carbon and/or ion exchange resins to remove the PFAS from solution. Limited laboratory and field studies have been conducted to evaluate the effectiveness of using in-situ methods to address PFAS in groundwater as an alternative to pump and treat. These studies have been conducted in relatively simple geologic and hydrogeologic environments and thus the effect of complex geology on the distribution and subsequent treatment of PFAS is not well understood.
This field study evaluated the in-situ treatment of a mixed BTEX-PFAS plume at a site in Central Canada. The site, underlain by three aquifers including a silty sand till aquifer, a sand aquifer, and a fractured dolostone aquifer, was impacted by BTEX and PFAS during a fire suppression event. The groundwater within the silty sand, sand and dolostone aquifers was impacted with BTEX concentrations up to 6,160, 703, and 9.6 ug/L, respectively. Concentrations of nine PFAS ranged up to 24,000 ng/L for PFPeA, up to 15,740 ng/L for PFHxA, up to 7,250 for PFHpA, up to 6,405 ng/L for PFBA, up to 2,105 ng/L for PFOS, up to 910 ng/L for PFOA, up to 165 ng/L for PFNA, up to 6.5 ng/L for PFBS, and up to 4.2 ng/L for PFHxS were detected within the three aquifers.
To mitigate the BTEX and PFAS within the three aquifers, a CAC solution was injected using a combination of direct push technology for the overburden aquifers and a series of injection wells within the fractured dolostone. Sampling of the groundwater for a variety of inorganic and general chemical parameters prior to and post CAC injection indicated that the groundwater within the three aquifers was reducing, with most electron acceptors being depleted because of reactions with the petroleum hydrocarbons within the groundwater. These reactions appear to have been buffered to near neutral pH conditions by reactions with carbonate minerals within the three aquifers. The addition of CAC and its associated organic carbon-based substrate enhanced the reducing reactions occurring within the aquifers with further depletion of sulphate and assumed precipitation of iron- and manganese-based sulphide minerals.
Total organic carbon concentrations within the silty sand and sand aquifer solids increased from pre-injection concentrations of 0.53 and 0.52 g/kg, respectively, to 8.10 and 7.99 g/kg, respectively, following the injection of the CAC. Analysis of the silty sand aquifer solids pre- and post-injection indicated that the distribution of the CAC was influenced by small scale heterogeneities within the silty sand aquifer with a thin higher KH sand seam being enriched with TOC relative to the surrounding aquifer material. The high KH seam had a mean TOC concentration of 13.0 g/kg compared to a mean of 7.40 g/kg for the surrounding silty sand aquifer material.
Sampling of the groundwater over a 12-month period post CAC injection indicated that the nine PFAS detected within the groundwater prior to treatment were treated to below their analytical reporting limits within the silty sand and sand aquifers. Similar results were also observed for the BTEX within the silty sand and sand aquifers over the 12-months monitoring period. The BTEX concentrations decreased to below their analytical reporting limits following the injection of the CAC solution and remained there over the duration of the monitoring period. The exception was benzene, which was measured near its analytical reporting limit in two shallow wells during the Day 182 event. After the Day 182 event, benzene was not detected within the groundwater at concentrations greater than its reporting limit.
The BTEX concentrations within the fractured dolostone aquifer decreased to below their respective reporting limits following the injection of the CAC solution and remained below their reporting limits for the duration of the 1-year test. Total concentrations of detectable PFAS within the fractured dolostone decreased from a maximum of 1,332 to 37 ng/L within 182 days of injection, with only three of the original nine PFAS being detected within the groundwater on the Day 182 sampling event. The PFAS detected during the Day 182 sampling event were short carbon chained carboxylic acids. Groundwater collected during the Day 366 sampling event detected seven of the nine PFAS originally found with concentrations increasing with time following the CAC injection suggesting that the CAC within the fracture zone was at or near capacity for short and moderate carbon chain carbon carboxylic acid PFAS.
The results of the field study suggested that CAC could be effectively injected using direct push technology into the two unconsolidated aquifers with effective treatment of BTEX and PFAS being obtained within 6 months of application. The concentrations of BTEX and PFAS within the groundwater remained below their respective reporting limits for the 1-year monitoring period. The results gathered from the fractured dolostone aquifer indicated that BTEX could be effectively removed to below their respective reporting limits over the 1-year monitoring period, whereas PFAS was only partially attenuated with short carbon chain carboxylic acid PFAS breaking through within 6 months of CAC application. The partial attenuation of the PFAS is attributed to competitive adsorption between the BTEX and various PFAS as well as the limited sorptive sites due to the limited mass of CAC within the fractures themselves.
The datasets presented in this article are not readily available because Confidential site and data, site location can not be shared. Requests to access the datasets should be directed to cmlja21AaXJzbC5jYQ==.
RC and LB contributed to interpretation and writing the article.
RM and LB are employed by InSitu Remediation Services Ltd.
The authors declare that the research was conducted in the absence of any commercial or financial relationships that could be construed as a potential conflict of interest.
All claims expressed in this article are solely those of the authors and do not necessarily represent those of their affiliated organizations, or those of the publisher, the editors and the reviewers. Any product that may be evaluated in this article, or claim that may be made by its manufacturer, is not guaranteed or endorsed by the publisher.
Aly, Y. H., McInnis, D. P., Lombardo, S. M., Arnold, W. A., Pennell, K. D., Hatton, J., et al. (2019). Enhanced Adsorption of Perfluoro Alkyl Substances for In Situ Remediation. Environ. Sci. Water Res. Technol. 5, 1867–1875. doi:10.1039/c9ew00426b
ASTM International Inc.ASTM (2016). ASTM D5084-16a. Standard Test Methods for Measurement of Hydraulic Conductivity of Saturated Porous Materials Using a Flexible wall Permeameter. West Conshohocken, PA: Author. doi:10.1520/d5084-16a
ASTM International Inc. ASTM (2011). ASTM E1019-11. Standard Test Methods for Determination of Carbon, Sulfur, Nitrogen, and Oxygen in Steel, Iron, Nickel, and Cobalt Alloys by Various Combustion Fusion Techniques. West Conshohocken, PA: Author. doi:10.1520/e1019-11
ASTM International Inc. ASTM (2013). ASTM E1409-13. Standard Test Methods for Determination of Oxygen and Nitrogen in Titanium and Titanium Alloys by Inert Gas Fusion. West Conshohocken, PA: Author. doi:10.1520/e1409-05
Barajas, F. (2019). Bench-scale Treatability Studies on Emerging Contaminants: PFAS and 1,4 Dioxane Presented at Air and Waste Management Association. June 13. Austin, Texas.
Bruton, T. A., and Sedlak, D. L. (2017). Treatment of Aqueous Film-Forming Foam by Heat-Activated Persulfate under Conditions Representative of In Situ Chemical Oxidation. Environ. Sci. Technol. 51, 13878–13885. doi:10.1021/acs.est.7b03969
Carey, G. R., Chapman, S. W., Parker, B. L., and McGregor, R. (2015). Application of an Adapted Version of MT3DMS for Modeling Back-Diffusion Remediation Timeframes. Remediation 25 (4), 55–79. doi:10.1002/rem.21440
Carey, G. R., McGregor, R., Pham, A. L.-T., Sleep, B., and Hakimabadi, S. G. (2019). Evaluating the Longevity of a PFAS In Situ Colloidal Activated Carbon Remedy. Remediation 29, 17–31. doi:10.1002/rem.21593
Carter, K. E., and Farrell, J. (2010). Removal of Perfluorooctane and Perfluorobutane Sulfonate from Water via Carbon Adsorption and Ion Exchange. Separat. Sci. Tech. 45 (6), 762–767. doi:10.1080/01496391003608421
Darlington, R., Barth, E., and McKernan, J. (2018). The Challenges of PFAS Remediation. Mil. Eng. 110 (712), 58–60.
De Jonge, L. W., Kjaergaard, C., and Moldrup, P. (2004). Colloids and Colloid-Facilitated Transport of Contaminants in Soils: An Introduction. Vadose Zone J. 3 (2), 321–325. doi:10.2113/3.2.321
Dombrowski, P. M., Kakarla, P., Caldicott, W., Chin, Y., Sadeghi, V., Bogdan, D., et al. (2018). Technology Review and Evaluation of Different Chemical Oxidation Conditions on Treatability of PFAS. Remediation 28 (2), 135–150. doi:10.1002/rem.21555
Eberle, D., Ball, R., and Boving, T. B. (2017). Impact of ISCO Treatment on PFAA Co-contaminants at a Former Fire Training Area. Environ. Sci. Technol. 51 (9), 5127–5136. doi:10.1021/acs.est.6b06591
Frimmel, F. H., von der Kammer, F., and Flemming, H-C. (2007). Colloidal Transport in Porous media. Spring, 292.
Higgins, C. P., and Luthy, R. G. (2006). Sorption of Perfluorinated Surfactants on Sediments. Environ. Sci. Technol. 40 (23), 7251–7256. doi:10.1021/es061000n
Huling, S. G., and Pivetz, B. E. (2006). Engineering Issue: In-Situ Chemical Oxidation. Cincinnati, OH: EPA/600/R-06/072U.S. Environmental Protection Agency Office of Research and Development, National Risk Management Research Laboratory.
Interstate Technology and Regulatory Council ITRC (2005). “In Situ Chemical Oxidation Team,” in Technical and Regulatory Guideline for in Situ Chemical Oxidation of Contaminated Soil and Groundwater. (Washington, D.C.: ISCO-2Interstate Technology and Regulatory Council).
Interstate Technology and Regulatory Council ITRC (2018). “In Situ Chemical Oxidation Team,” in Remediation Technologies and Methods for Per- and Polyfluoroalkyl Substances (PFAS) (Washington, DCWashington, D.C.: ISCO-1Interstate Technology and Regulatory Council).
Interstate Technology and Regulatory Council ITRC (2020). PFAS – Per- and Polyfluoroalkyl Substances TeamRemediation Technologies and Methods for Per- and Polyfluoroalkyl Substances (PFAS). Washington, DCWashington, D.C.: ISCO-1Interstate Technology and Regulatory Council. https://pfas-1.itrcweb.org/12-treatment-technologies/.
Kashir, M., and McGregor, R. (2015). Chemical Oxidation Performance in High Temperature, saline Groundwater Impacted with Hydrocarbons. Remediation 25 (2), 55–70. doi:10.1002/rem.21424
Liu, C., Hatton, J., Arnold, W. A., Simcik, M. F., and Pennell, K. D. (2020). In Situ sequestration of Perfluoroalkyl Substances Using Polymer-Stabilized Powdered Activated Carbon. Environ. Sci. Technol. 54 (11), 6929–6936. doi:10.1021/acs.est.0c00155
McGregor, R. (2020b). Distribution of Colloidal and Powdered Activated Carbon for the In Situ Treatment of Groundwater. J. Water Resource Prot. 12, 1001–1018. in press. doi:10.4236/jwarp.2020.1212060
McGregor, R. (2018). In Situ treatment of PFAS-Impacted Groundwater Using Colloidal Activated Carbon. Remediation 28, 33–41. doi:10.1002/rem.21558
McGregor, R., and Maziarz, A. (2021). The In Situ Treatment of Basic Violet 16 Synthetic Dye in Groundwater. Remediation 31, 27–34. doi:10.1002/rem.21689
McGregor, R. (2020a). Six Pilot‐scale Studies Evaluating the In Situ Treatment of PFAS in Groundwater. Remediation 30, 39–50. doi:10.1002/rem.21653
McGregor, R., and Zhao, Y. (2021). The In Situ Treatment of TCE and PFAS in Groundwater within a Silty Sand Aquifer. Remediation 31, 7–17. doi:10.1002/rem.21675
National Ground Water Association Press (2017). Groundwater and PFAS: State of Knowledge and Practice. Westerville, OH: Author.
Nordstrom, D. K. (1977). Thermochemical Redox Equilibria of ZoBell's Solution. Geochimica et Cosmochimica Acta 41 (12), 1835–1841. doi:10.1016/0016-7037(77)90215-0
Park, S., Lee, L. S., Medina, V. F., Zull, A., and Waisner, S. (2016). Heat-activated Persulfate Oxidation of PFOA, 6:2 Fluorotelomer Sulfonate, and PFOS under Conditions Suitable for In-Situ Groundwater Remediation. Chemosphere 145, 376–383. doi:10.1016/j.chemosphere.2015.11.097
Petri, B. G., Watts, R. J., Tsitonaki, A., Crimi, M., Thomson, N. R., and Teel, A. L. (2011). Fundamentals of ISCO Using Persulfate. in: Editors. R. L. Siegrist, M. Crimi, and T. J. Simpkin, In Situ Chemical Oxidation for Groundwater Remediation (pp. 147–191). New York, NY: Springer. doi:10.1007/978-1-4419-7826-4_4
Puls, R. W., and Barcelona, M. J. (1996). Low-flow (Minimal Drawdown) Groundwater Sampling Procedures. EPA groundwater issue, EPA/540/S-95/504. Washington, DC: US Environmental Protection Agency, Office of Solid Waste and Emergency Response.
Ross, I., McDonough, J., Miles, J., Storch, P., Thelakkat Kochunarayanan, P., Kalve, E., et al. (2018). A Review of Emerging Technologies for Remediation of PFASs. Remediation 28, 101–126. doi:10.1002/rem.21553
Saeed, W., Shouakar-Stash, O., Barker, J., Thomson, N., and McGregor, R. (2021). Laboratory Experiments to Evaluate the Effectiveness of Persulfate to Oxidize BTEX in Saline Environment and at Elevated Temperature Using Stable Isotopes. Hydrology 8 (139). doi:10.3390/hydrology8030139
Simon, J. A., Abrams, S., Bradburne, T., Bryant, D., Burns, M., Cassidy, D., et al. (2019). PFAS Experts Symposium: Statements on Regulatory Policy, Chemistry and Analytics, Toxicology, Transport/fate, and Remediation for Per‐ and Polyfluoroalkyl Substances (PFAS) Contamination Issues. Remediation 29 (4), 31–48. doi:10.1002/rem.21624
Simon, J. A. (2020). Editor's Perspective-Just How Large Is the PFAS Problem? Remediation 30, 3–4. doi:10.1002/rem.21643
Sra, K. S., Thomson, N. R., and Barker, J. F. (2013). Persulfate Treatment of Dissolved Gasoline Compounds. J. Hazard. Tox. Radioact. Waste 17 (1), 9–15. doi:10.1061/(asce)hz.2153-5515.0000143
Usman, M., Faure, P., Ruby, C., and Hanna, K. (2012). Remediation of PAH-Contaminated Soils by Magnetite Catalyzed Fenton-like Oxidation. Appl. Catal. B: Environ. 117-118, 10–17. doi:10.1016/j.apcatb.2012.01.007
Xiao, X., Ulrich, B. A., Chen, C. P., and Higgins, C. P. (2017). Sorption of Poly- and Perfluoroalkyl Substances (PFASs) Relevant to Aqueous Film-Forming Foam (AFFF)-impacted Groundwater by Biochars and Activated Carbon. Environ. Sci. Technol. 51 (11), 6342–6351. doi:10.1021/acs.est.7b00970
Keywords: PFAS, BTEX, colloidal, activated carbon, in-situ, groundwater, remediation
Citation: McGregor R and Benevenuto L (2021) The Effect of Heterogeneity on the Distribution and Treatment of PFAS in a Complex Geologic Environment. Front. Environ. Chem. 2:729779. doi: 10.3389/fenvc.2021.729779
Received: 23 June 2021; Accepted: 07 September 2021;
Published: 20 September 2021.
Edited by:
Balaji Seshadri, The University of Newcastle, AustraliaReviewed by:
Chin Wei Lai, University of Malaya, MalaysiaCopyright © 2021 McGregor and Benevenuto. This is an open-access article distributed under the terms of the Creative Commons Attribution License (CC BY). The use, distribution or reproduction in other forums is permitted, provided the original author(s) and the copyright owner(s) are credited and that the original publication in this journal is cited, in accordance with accepted academic practice. No use, distribution or reproduction is permitted which does not comply with these terms.
*Correspondence: Rick McGregor, cmlja21AaXJzbC5jYQ==
Disclaimer: All claims expressed in this article are solely those of the authors and do not necessarily represent those of their affiliated organizations, or those of the publisher, the editors and the reviewers. Any product that may be evaluated in this article or claim that may be made by its manufacturer is not guaranteed or endorsed by the publisher.
Research integrity at Frontiers

Learn more about the work of our research integrity team to safeguard the quality of each article we publish.