 F. Lacan
 L. Artigue
 J. K. Klar
 C. Pradoux1
 J. Chmeleff
94% of researchers rate our articles as excellent or good
Learn more about the work of our research integrity team to safeguard the quality of each article we publish.
Find out more
METHODS article
Front. Environ. Chem., 08 September 2021
Sec. Inorganic Pollutants
Volume 2 - 2021 | https://doi.org/10.3389/fenvc.2021.692025
This article is part of the Research TopicAdvances in Metals and Trace Elements Isotopes Measurements, Experiments and Application in Environmental SciencesView all 6 articles
Multi-collector inductively coupled plasma mass spectrometers (MC-ICPMS) are widely used for Fe isotope measurements. The latter may be perturbed by interferences (notably from Cr and Ni) and matrix effects (notably from major elements), caused by elements remaining in the samples after purification. We quantified some of these perturbations and our ability to correct them whenever possible, using Thermo Neptune and Neptune Plus MC-ICPMS with a 57-58Fe double-spike mass bias correction. 54Cr and 58Ni isobaric interference corrections were found to be extremely efficient up to Cr/Fe=0.12 and Ni/Fe=0.04 (g/g natural Fe). Matrix effects were found negligible up to at least Na/Fe=175, Mg/Fe=10, K/Fe=1.5, and Mo/Fe=75 (g/g natural Fe). 28Si2+ interference was found negligible up to Si/Fe=50. Finally, we found that calcium and aluminum could cause significant interferences (e.g., 40Ca16O and 27Al2+), for Ca/Fe ≥ 2.5 and Al/Fe ≥ 2.5. The perturbation intensity relative to the Ca/Fe ratio was found dependent on the measurement conditions (plateau width). While working with samples with potentially high calcium or aluminum contents (such as calcite minerals or tests, bones and teeth, or marine samples and crustal rocks), we recommend to carefully take into account Ca and Al while tuning the instrument and checking the measurement accuracy with isotopic standards (i.e., doping the isotopic standard with Ca and Al levels comparable to those of the samples).
Iron isotopic compositions are nowadays widely used in Earth and planetary sciences, environmental research, and also in biological and medical research (Beard and Johnson, 2004; Abadie et al., 2017; Albarède et al., 2017; Dauphas et al., 2017). They are most commonly expressed as δ56Fe defined as follows:
Almost all of these measurements are now carried out with multi-collector inductively coupled plasma mass spectrometers (MC-ICPMS). While these instruments allow very reliable and accurate measurements when operated in certain conditions, the measurements may suffer from a variety of perturbations, which include spectral interferences and matrix effects.
Samples are usually purified before MC-ICPMS analyses, in order to introduce pure Fe samples (dissolved in a dilute acid) in the instrument. However, even the highest performance purification procedure does not allow the entire elimination of other elements initially present in the sample. Some of these elements may cause spectral interferences and/or matrix effects. A spectral interference is the process by which an ion other than the analyte is detected as if it was the analyte because its mass-to-charge ratio is indistinguishable from that of the analyte. There are three main types of spectral interferences in ICPMS: isobaric interferences, produced by mono-atomic ions (e.g., 54Cr+ and 58Ni+ may interfere with 54Fe+ and 58Fe+, respectively), poly-atomic interference, produced by molecular ions (e.g., 14N40Ar+ or 27Al2+ may interfere with 54Fe+, 16O40Ca+ may interfere with 56Fe+), and doubly charged ion interferences (e.g., 112Cd++ on 56Fe+). A matrix effect is the process by which the instrument behavior varies in response to a variation in the sample composition. It is caused by dissolved ions in the solution (other than that of interest). It can be divided into two types: a signal drift with time due to salt deposition on the cones and/or a modification of the mass bias (instrumental mass fractionation) due to a modification of the ionization environment in the plasma (i.e., of the isotope distribution in the plasma; the so-called space charge effect; Gillson et al., 1988; Barling and Weis, 2012). For instance, the mass bias may suddenly vary between a very well-purified isotopic standard solution containing almost exclusively the analyte and an insufficiently purified sample solution containing significant levels of other compounds. Instrumental mass bias correction is a major aspect of the Fe isotopic ratio measurements because it is typically of the order of 2.5–4.5% per atomic mass unit (this study; Dauphas and Rouxel, 2006), which is about 200–400 times larger than the order of magnitude of the typical targeted accuracy of 0.1‰. Three main methods are commonly used for Fe mass bias corrections: standard bracketing; internal doping with another element of similar mass, usually Ni or Cu; and double-isotope spiking.
Some of the abovementioned perturbations, interferences, and matrix effects may be quantified and corrected for (e.g., Cr and Ni isobaric interferences), but corrections are never perfect. In addition, some perturbations cannot be quantified or corrected (e.g., matrix effects). Therefore, these perturbations degrade the measurement trueness and precision.1 The thresholds above which these degradations become significant need to be determined. They depend on many aspects of the analysis, including the type of instrument and its setting, the type of the introduction system, and the mass bias correction method. Several works have documented these perturbations and thresholds in different conditions, including different instruments [e.g., Micromass IsoProbe (Albarède and Beard, 2004), Thermoelemental Axiom (Dideriksen et al., 2006), Nu Plasma (Millet et al., 2012; Sun et al., 2013; Finlayson et al., 2015; Zheng et al., 2018), and Thermo-Scientific Neptune (Schoenberg and von Blanckenburg, 2005; Dauphas et al., 2009; He et al., 2015)], different introduction systems [liquid, with or without desolvatation (Schoenberg and von Blanckenburg, 2005; Dideriksen et al., 2006; Millet et al., 2012; Sun et al., 2013; Finlayson et al., 2015) (Schoenberg and von Blanckenburg, 2005; Dauphas et al., 2009; He et al., 2015), and laser ablation (Zheng et al., 2018)], and different mass bias correction methods [standard bracketing (Schoenberg and von Blanckenburg, 2005; Dauphas et al., 2009; Sun et al., 2013; He et al., 2015), Ni or Cu doping (Schoenberg and von Blanckenburg, 2005), and double-spiking (Dideriksen et al., 2006; Millet et al., 2012; Finlayson et al., 2015)]. For about a decade, Fe isotope analyses with 57Fe-58Fe double-spike mass bias corrections are increasingly used in some fields, for instance, seawater studies (Conway et al., 2013; Dauphas et al., 2017; Klar et al., 2018; Lacan et al., 2008; Rudge et al., 2009). The latter relies on the combined use of the three Fe isotope ratios (i.e., the combined use of the four isotope measurements). This implies that isobaric interferences on both 54Fe and 58Fe (from 54Cr and 58Ni) can impact the final result, while in the case of standard bracketing or internal doping with another element, the final result may be obtained independently of one or both of these interferences (for instance when looking at the 57Fe/56Fe ratio only with the standard bracketing method, the final result is independent of the 54Fe and 58Fe measurements; or when looking at the 56Fe/54Fe and 57Fe/54Fe ratios, with the Ni doping method, the result is independent of the 58Fe measurement). Consequently, the impact of these perturbations may be different when using double-spike mass bias corrections compared to the other methods. In addition, the contribution of potential interferences cannot be verified in a three-isotope plot when using double-spiking (while this is possible with standard bracketing). However, the double-spike mass bias correction technique has several advantages: it allows to 1) measure the instrumental mass fractionation at the time of sample analysis (not before and after as with standard bracketing), 2) measure the Fe instrumental mass fractionation with Fe itself (not with another element as with Ni or Cu doping), and 3) correct for potential chemical mass fractionation during sample processing (by adding the double-spike to the sample prior the chemical treatments, such as purification procedures, which other techniques do not allow). While some studies have documented thresholds for these isobaric Cr and Ni interferences below which reliable measurements could be obtained with standard bracketing and internal doping mass bias corrections (Schoenberg and von Blanckenburg, 2005; Dauphas et al., 2009; He et al., 2015), these thresholds have not been documented to date to our knowledge for double-spike mass bias corrections. In addition, while Thermo-Scientific Neptune and Neptune Plus MC-ICPMS are the most commonly used instruments nowadays for Fe isotope analyses, the impact of potentially major molecular ion interferences, such as 16O40Ca+ on 56Fe+, or potential matrix effects associated to major elements such as Si or Na, have not been reported for Fe isotope measurements with these instruments to date to our knowledge.
The present work therefore presents for the first time a study of the impact of Cr, Ni, Ca, Si, and Al interferences and Na, Mg, Ca, K, and Mo matrix effects on iron isotope measurements using Thermo-Scientific Neptune and Neptune Plus MC-ICPMS with desolvation and a mass bias correction with a 57Fe-58Fe double-spike. These results document thresholds below which reliable measurements could be obtained, and point toward elements, which require particular attention. They should provide a useful framework for future Fe isotope analyses.
The major part of the analyses was made using the Neptune MC-ICPMS (Thermo-Scientific) of the Observatoire Midi Pyrenees (Toulouse, France), while some measurements (detailed below) were made with the Neptune Plus MC-ICPMS (Thermo-Scientific) of the Observatoire de Recherche Méditerranéen de l’Environnement (Université de Montpellier, France). They were equipped with Ni X skimmer cones, with a standard sampler cone for the Neptune and a Jet sampler cone for the Neptune Plus and operated with high-resolution slits (25 µm). All samples, dissolved in 0.32 mol L−1 HNO3, were introduced via a 75-μL/min PFA MicroFlow nebulizer (Elemental Scientific) and an Apex-IR desolvator (Elemental Scientific). Operation parameters are detailed in Table 1. Collector configurations are given in Table 2.
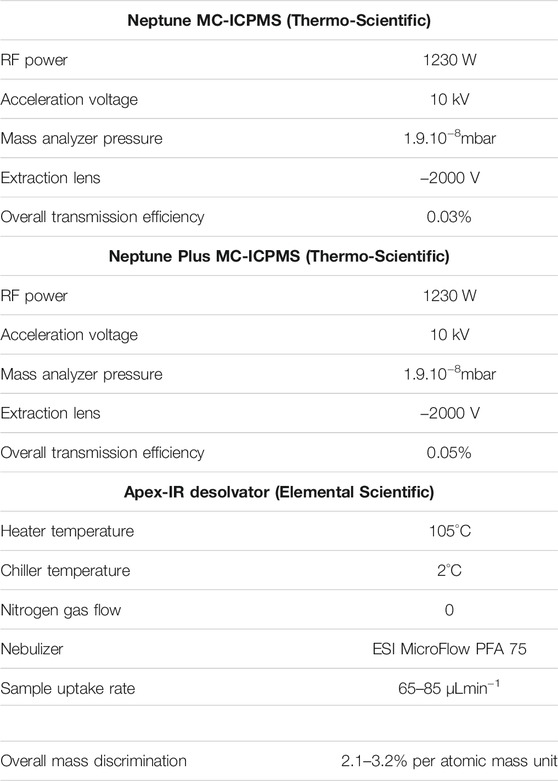
TABLE 1. MC-ICPMS and desolvator operation parameters.
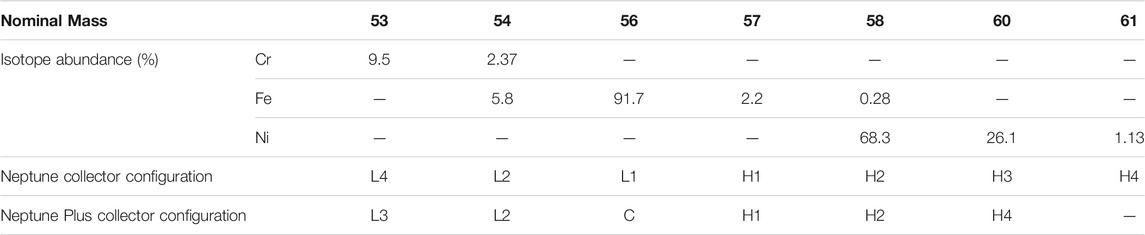
TABLE 2. Faraday cup configuration and isotopic abundances for Fe, Cr, and Ni.
With such instruments, Fe isotope measurements may suffer from poly-atomic ion interferences due to argon oxy-hydroxides (e.g., 40Ar16O and 40Ar16O1H) and argon–nitrogen species (e.g., 40Ar14N). These elements, such as Ar, O, H, and N, were present in all the samples of the present study, either supplied by the argon gas, ambient air, or by the HNO3. The mass resolving power (Weyer and Schwieters, 2003) of this type of instrument does not allow to fully separate the Fe peaks from the interference peaks. However, because the Fe isotopes are slightly lighter than these interferences, their peaks only partially overlap (Figure 1). The light part of the Fe peaks is virtually free of interference, that is, the light peak tails of the interferences do not significantly contribute to the Fe signals (given that Fe to interference intensity ratios are not too small). This has been extensively described previously (Weyer and Schwieters, 2003) and is commonly referred to as measuring on the Fe “shoulder” of the peaks.
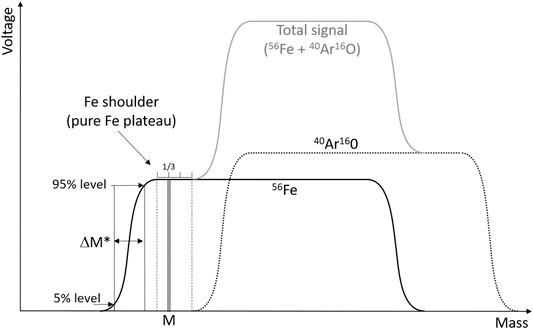
FIGURE 1. Schematic of the peak shapes for 56Fe and the 40Ar16O interference. The instrument is set to perform the measurements at mass M, chosen at 1/3 of the pure Fe plateau (free of interference), that is, the Fe shoulder, which is defined as the flat part of the Fe peak to the left of the 40Ar16O signal. The resolving power, Rpower (5, 95%), is calculated as M/ΔM*. Adapted from Weyer and Schwieters (2003).
We used a 57Fe-58Fe double-spike composed of 0.11, 3.21, 59.2, and 37.5% (mol/mol) of 54Fe, 56Fe, 57Fe, and 58Fe, respectively. The sample-to-spike Fe mass ratio was 2/3 (i.e., the sample double-spike mixture is composed of 40% w/w of sample and 60% w/w), to maximize beam intensities on the four Fe collectors and minimize error propagation (Rudge et al., 2009; Lacan et al., 2010; John, 2012).
Samples were run following the typical sequence: IRMM14—HEM—IRMM14—SAMPLE-1—IRMM14—SAMPLE-2—IRMM14—HEM—IRMM14—SAMPLE-3 … and so on, where “HEM” is an in-house hematite standard (produced at ETH Zurich) of known Fe isotopic composition (δ56Fe = 0.53 ± 0.06‰, 2SD) and negligible contents of other elements (Poitrasson and Freydier, 2005; Lacan et al., 2008; Lacan et al., 2010), which allowed monitoring measurement accuracy.
In between each of the above, the background was measured via the measurement of a 0.32 mol L−1 HNO3 solution in which all samples were dissolved.
Data extraction was performed as follows. The mean background signals (over a sequence, typically 12 h) were subtracted from the raw data of each sample or standard. Cr and Ni isobaric interferences (on 54Fe and 58Fe) were corrected for by estimating 54Cr and 58Ni, from the 53Cr and 60Ni signals, the natural Cr and Ni abundances, and the instrumental isotopic fractionation. The latter was computed for Fe from the background and isobaric interference-corrected signals, using the Siebert et al. iterative calculation (Siebert et al., 2001). Instrumental mass fractionations for Cr and Ni were therefore assumed to be the same as for Fe. The above procedure is circular because it requires the instrumental mass fractionation to estimate the Cr and Ni interferences, but it also requires the Cr and Ni interferences to estimate the instrumental mass fractionation. This problem was circumvented through another iterative calculation. Finally, for each sample, the δ56Fe value was calculated relative to the mean of its two bracketing IRMM14. Precision and accuracy of this method were evaluated through repeated measurements of the pure ETH hematite standard. Considering all its measurements during sessions dedicated to the present study, between June 2015 and October 2018, its mean value was δ56Fe = 0.525 ± 0.054‰ (2SD, N = 89). This is in perfect agreement with data previously reported by different groups (Lacan et al., 2010 and references therein). Average background signals were 0.02% of the sample signals, on average for the four isotopes (in any case between 0.01 and 0.04%).
As mentioned above, the double-spike mass bias correction involves the combined use of the three Fe isotope ratios, that is, the combined use of the four Fe isotopes. A perturbation on any of the four isotope measurements could therefore impact the final result. To determine the impact of interferences and matrix effects, samples were prepared as follows. A 200 ppb [10−9 g (Fe)/g (HNO3)] hematite solution, mixed with the double-spike (300 ppb), was doped with variable amounts of mono-elemental standard solutions of Cr, Ni, Cr + Ni, Al, Si, Na, Mg, K, Ca, Mo, and Na + Mg + K + Ca + Mo. These elements were chosen either because they produce spectral interferences (Cr, Ni, Al, Si, and Ca) or because they might be found at significant levels in the final purified solutions (either because of their high initial abundances in natural samples or because of imperfect chemical separation). Most Fe isotope measurements at LEGOS are performed on seawater samples. Although Na, Mg, Ca, and K are very efficiently separated from Fe through preconcentration and purification procedures [chelating and ion exchange resins, e.g., (Schoenberg and von Blanckenburg, 2005; Borrok et al., 2007; Lacan et al., 2010)], even very small fractions of the initial contents of these elements may result in significant quantities in purified samples. For example, 0.0001% of Na in an open ocean surface seawater sample represents a mass 2000 times greater than its typical Fe content. Other types of samples and other elements may present similar problems. For example, 0.0001% of Ca initially present that tooth samples (enamel or dentin) can represent ∼50 times their iron content (Teruel et al., 2015). Similarly, 0.1% of the calcium initially present in some iron-depleted calcites can represent ten times their iron content (von Blanckenburg et al., 2008). Additionally, Mo was chosen because the efficiency of its separation on the most common Fe purification procedures (using notably AG 1-x4, AG 1-x8, or AG MP-1 ion exchange resins) depends on its oxidation state, which makes this separation more uncertain than for other elements (Lacan et al., 2010). Therefore, although this study has been motivated by the seawater work at LEGOS, it aims at providing a general framework for iron isotope measurements on any kind of samples for which imperfect purification may be expected.
The abovementioned mixtures were measured to assess whether or not the correct isotopic composition of the hematite could be determined. All measurements were performed with resolving powers Rpower (5.95%) = M/ΔM* ≥ 8,000 and plateau width ≥200 ppm [that is sufficient for Fe isotope measurements (Weyer and Schwieters, 2003)]. The doubly charged effect is often negligible as doubly charged ions are rare in the conditions of the plasma (Houk, 1986); therefore, Cd was not investigated.
All results presented below were obtained with the Neptune MC-ICPMS, unless otherwise indicated (for Neptune Plus data). The effect of 54Cr and 58Ni isobaric interferences on the hematite measurements is displayed in Figure 2 and Figure 3. Figure 2 shows that even when the hematite was doped with 11.9% g (Cr)/g (hematite Fe) (i.e., the solution analyzed was 200 ppb hematite Fe + 24 ppb Cr + 300 ppb double-spike; 200 ppb × 11.9 % = 24 ppb), which lead to a 54Cr/54Fe slightly larger than 5% (mol/mol), the correct isotopic composition of the hematite was found. The presence of a small quantity of Ni (leading to 1% 58Ni/58Fe (mol/mol) in the analyzed solution, level to which interference corrections have been validated for standard bracketing measurements (Schoenberg and von Blanckenburg, 2005) did not significantly change the results. This demonstrates that up to this level, the 54Cr interference can be successfully corrected for. This value is similar to the threshold documented earlier with the same type of instrument (Neptune) but with a standard bracketing mass bias correction (Dauphas et al., 2009). Note that these results are obtained, thanks to the interference correction; without correction, significant errors (of the order of 1‰) occur as soon as the Cr content reaches 0.1% g (Cr)/g (hematite Fe), and this error increases dramatically with increasing Cr content (it reaches 39‰ for 11.9% g (Cr)/g (hematite Fe), cf. Figure 2 bottom panel).
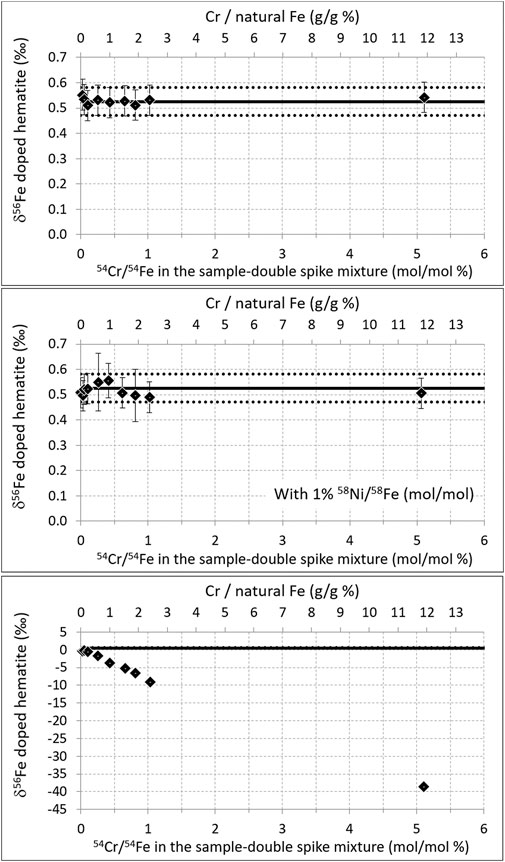
FIGURE 2. Top: δ56Fe of hematite (200 ppb natural Fe) doped with variable amounts of Cr. Middle: same as top but with an addition of Ni leading to 1% 58Ni/58Fe (mol/mol) in all samples. Bottom: same as top but with no Cr interference correction (note the different vertical scale). The level of Cr doping is expressed in two ways: i) the level of Cr (all isotopes) compared to that of natural Fe (i.e., not taking into account the double-spike, top x axis), and ii) the level of 54Cr compared to 54Fe in the analyzed solution, that is, in the sample double-spike mixture (bottom x axis). Diamonds are the averages of duplicate measurements (two Neptune analyses were performed for each data point reported on the plot). Error bars are 2 standard deviations of the duplicate measurements or the long-term internal precision (2SD) of our instrument (0.06‰), whichever the greatest (they are smaller than the symbol size on the bottom panel). The horizontal black lines show the δ56Fe of pure (un-doped) hematite measured during the same analytical session; mean value (solid line) ± 2 standard deviations (dotted lines).
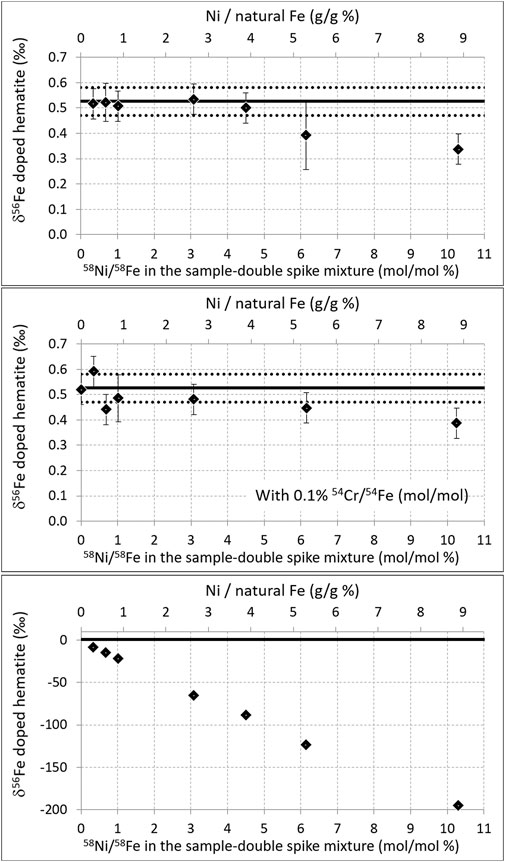
FIGURE 3. Top: same as Figure 2, but for variable amounts of Ni. Middle: same as top but with an addition of Cr leading to 0.1% 54Ni/54Fe (mol/mol) in all samples. Bottom: same as top but with no Ni interference correction (note the different vertical scale).
Figure 3 shows that when the hematite was doped with up to 3.9% g (Ni)/g (hematite Fe) (i.e., 200 ppb hematite + 8 ppb Ni + 300 ppb double-spike; i.e., 58Ni/58Fe ≈ 4.5% mol/mol), the correct hematite isotopic composition was found. Above that threshold, the values obtained are significantly deviated from the true value. Again, this threshold is similar to that documented earlier with a Neptune and a standard bracketing mass bias correction (Dauphas et al., 2009). The presence of a small quantity of Cr (leading to 0.1% 54Cr/54Fe (mol/mol)) in the analyzed solution, again the level to which interference corrections have been validated for standard bracketing measurements (Schoenberg and von Blanckenburg, 2005), did not significantly change the results. As for Cr, these results are obtained, thanks to the interference corrections; without correction, very significant errors (of the order of 8‰) occur as soon as the Ni content reaches 0.3% g (Ni)/g (hematite Fe), and this error increases dramatically with increasing Ni content [it reaches 88‰ for 3.9% g (Ni)/g (hematite Fe), see Figure 3 bottom panel].
Figure 4 shows the effect of Na, Mg, K, and Mo doping (on the 200 ppb natural Fe solution, mixed with 300 ppb double-spike). It shows that below certain doping concentrations (up to 27 ppm Na, 2 ppm Mg, 0.3 ppm K, and 15 ppm Mo), the correct isotopic composition of the hematite was found. This demonstrates that up to these levels and despite the lower ionization energies (and thus higher degrees of ionization) of these elements relative to Fe (Table 3), these matrix effects are negligible, or at least accurately corrected for with the double-spike. Larger concentrations have not been tested. These levels were chosen because they represent the maximum values we encounter with purified seawater samples we usually work on. They correspond to Na/Fe = 135, Mg/Fe = 10, K/Fe = 1.5, and Mo/Fe = 75 (g/g, where Fe is natural Fe). For Na and Mg, these ratios are significantly larger than those documented previously (Na/Fe = 5 and Mg/Fe = 2 g/g, with a 54Fe-58Fe double-spike and a different instrument, Thermoelemental AXIOM MC-ICPMS) (Dideriksen et al., 2006), which allows extending the range within which Na and Mg matrix effects can be neglected. For K and Mo, these thresholds have not been documented before to our knowledge.
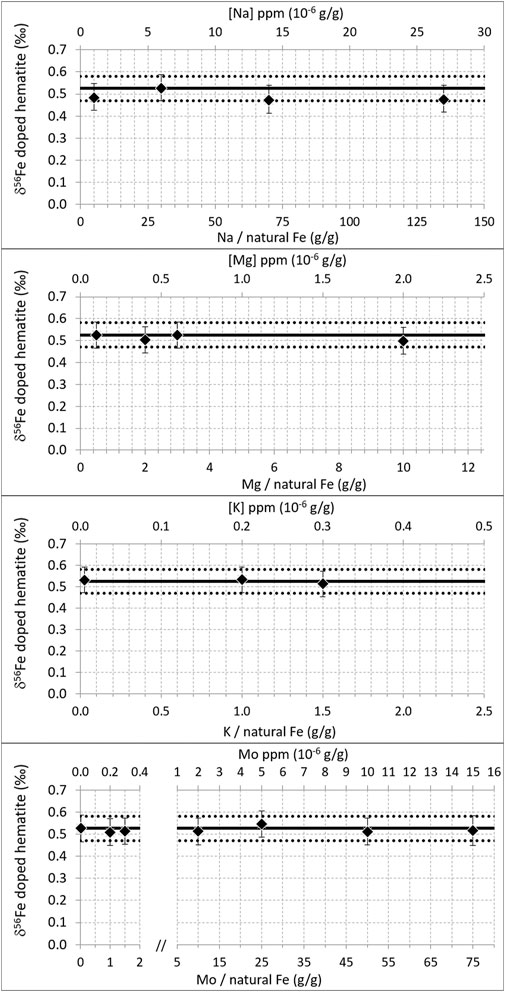
FIGURE 4. δ56Fe of hematite (200 ppb natural Fe) doped with variable amounts of Na, Mg, K, and Mo. Diamonds are the averages of duplicate measurements. Error bars are 2 standard deviations of the duplicate measurements or the long-term internal precision (2SD) of our instrument (0.06‰), whichever the greatest. The horizontal black lines show the δ56Fe of pure (un-doped) hematite measured during the same analytical session; mean value (solid line) ± 2 standard deviations (dotted lines).
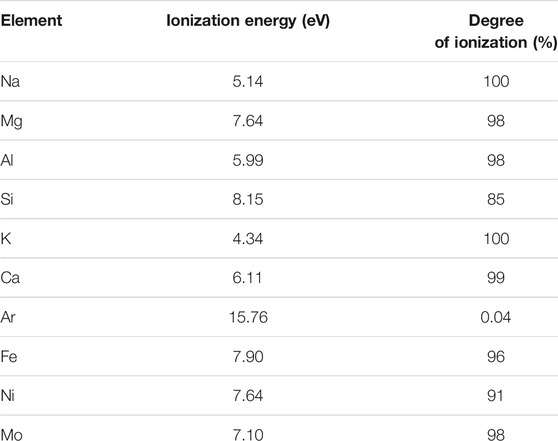
TABLE 3. First ionization energies and degrees of ionization for each element of interest (Houk, 1986). Degree of ionization calculated from Saha equation with T plasma: 7,500 K and ne = 1015 cm−3 (where ne is the electron density) (Boumans, 1966; Houk, 1986).
The effects of calcium doping, as shown in Figure 5, are more significant and more complicated. Calcium may perturb the δ56Fe measurements in two ways. Residual amounts of Ca after sample purification may lead to matrix effects due to its high concentrations in certain natural samples (e.g., rocks, waters, and shells). In addition, similarly to Ar, Ca may also cause poly-atomic interferences on Fe isotopes, as shown previously (Dideriksen et al., 2006). The molecular ions such as 40Ca14N, 40Ca16O, 40Ca16O1H, and 42Ca16O may interfere on 54Fe, 56Fe, 57Fe, and 58Fe, respectively. The weak Ca ionization energy compared to Fe (and thus high degree of ionization, cf. Table 3) potentially reinforces both perturbations.
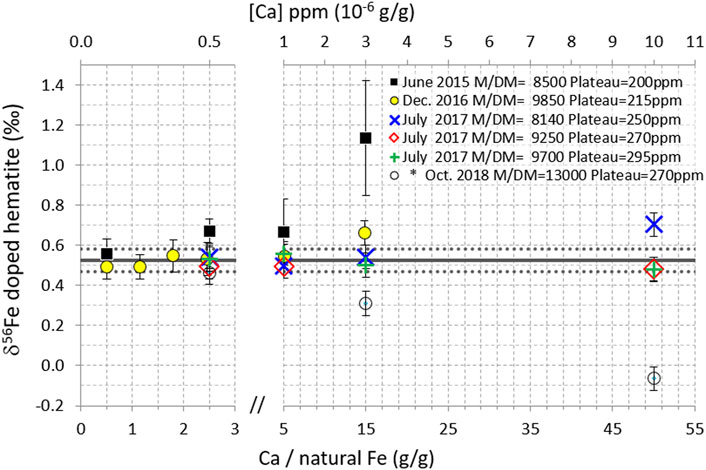
FIGURE 5. δ56Fe of hematite (200 ppb natural Fe) doped with variable amounts of Ca, for five measurement sessions on the Neptune and (*) one session on the Neptune Plus (2018). Data points are the averages of replicate measurements (n = 2–5), except for 2017 data (no replicate). Error bars are 2 standard deviations of the replicate measurements for the 2015–16 data and the long-term internal precision (2SD) of the instrument (0.06‰) for the 2017 data (no replicate) and for the 2018 Neptune Plus data (2SD of replicates being smaller than long term internal precision). The horizontal black lines show the δ56Fe of pure (un-doped) hematite measured during the same analytical sessions; mean value (solid line) ± 2 standard deviations (dotted lines).
Measurements performed in June 2015, together with the other tests presented above, show that with 0.5 ppm Ca (Ca/Fe = 2.5 g/g where Fe is natural Fe), the measurement of the hematite δ56Fe was significantly biased; it was found to be 0.67‰ instead of 0.52‰ ± 0.06 (2SD) (black squares in Figure 5). This evidences a much higher δ56Fe measurement sensitivity to the Ca contents compared to other elements tested for matrix effects (e.g., no perturbation up to Na/Fe = 135 or Mo/Fe = 75 g/g). This observation suggests that the observed perturbations are more likely due to interferences rather than to matrix effects. This confirms previous works (Dideriksen et al., 2006) and is further confirmed by additional information given below. These levels of Ca impurities (Ca/Fe = 2.5 g/g) after purification are not frequent. However, they may be encountered in some cases. For instance, out of 18 marine sediment interstitial water samples purified on AG-MP1 column, we found seven with Ca/Fe (g/g) ratios >1 (with a maximum value of 4.6).
As explained at the beginning of the experimental section, measurements are performed on the peak shoulders, to stay away from the ArO, ArOH, and ArN interferences (cf. Figure 1). This is usually done by looking at the peak shapes produced by pure Fe solutions and by tuning the instrument to maximize the width of the Fe shoulder, that is, the Fe plateau, and the slope of the peak flanks, that is, the mass resolving power. Then the absence of significant interference contributions to the Fe signal is checked by comparing the peak shapes produced by pure Fe solutions (where both Fe and the interferences contribute to the peak shapes) and HNO3 solutions (where only interferences are present) (Weyer and Schwieters, 2003). 40Ca is very slightly heavier than 40Ar (M40Ca = 39.96259 u, M40Ar = 39.96238 u). Therefore, if the Fe plateau is free of the argon molecular ion interference and if calcium molecular ions are not significantly more abundant than argon ones, then calcium should not cause any significant interference on the Fe measurements. However, if the calcium molecular ions are significantly more abundant than the argon ones (because of a large Ca concentration in the sample or because of a large calcium molecular ion formation rate compared to that of argon), then the calcium molecular ion peak tail may be larger at a given mass than to that of the argon molecular ions, despite the fact that 40Ca is slightly heavier than 40Ar. In summary, resolving the argon molecular ion interferences is not a warranty that calcium molecular ion interferences will be resolved. The effects of potential calcium molecular ion interferences need, therefore, to be quantified.
Figure 5 displays the results obtained for the hematite doped with variable Ca amounts, during five different measurement sessions on the Neptune instrument (Neptune Plus data will be discussed next), for which the mass resolving power [Rpower 5–95% (Weyer and Schwieters, 2003)] and plateau width were set to different values (8,500–13,000 and 200–295 ppm, respectively) notably by varying of the “Shape” parameter in the instrument tuning. It shows that during the sessions with the largest mass resolving power and plateau width, the perturbations were the smallest. For instance, with a mass resolving power of 9,700 and a plateau of 295 ppm, no perturbation was detected even with 10 ppm Ca (for 200 ppb natural Fe). This corresponds to Ca/Fe = 50 (g/g where Fe is natural Fe). This is 500 times larger than the threshold documented previously (Ca/Fe = 0.1, with a 54Fe-58Fe double-spike and a different instrument, Thermoelemental AXIOM MC-ICPMS) (Dideriksen et al., 2006).
The relations among mass resolving power, plateau width, and perturbations are further displayed in Figure 6. The latter shows, for the maximum Ca concentration of the 5 different Neptune sessions (3ppm for the 2015 and 2016 tests and 10ppm for the 2017 tests), the magnitude of the perturbation (i.e. the absolute value of the difference between the measured and the expected values) normalized to the Ca concentration, as a function of the mass resolving powers and the plateau widths. For instance, in June 2015, the maximum Ca concentration tested was 3 ppm, and the magnitude of the perturbation for this maximum Ca concentration was 0.6‰; this leads to 0.2‰ perturbation per ppm Ca, for a resolution and plateau width of 8,500 and 200 ppm, respectively. While no relation is seen as a function of mass resolving power, the figure shows that the perturbation decreases with increasing plateau width. The relationship between plateau width and magnitude of the perturbation confirms that the perturbations are caused by interferences and not by matrix effects.
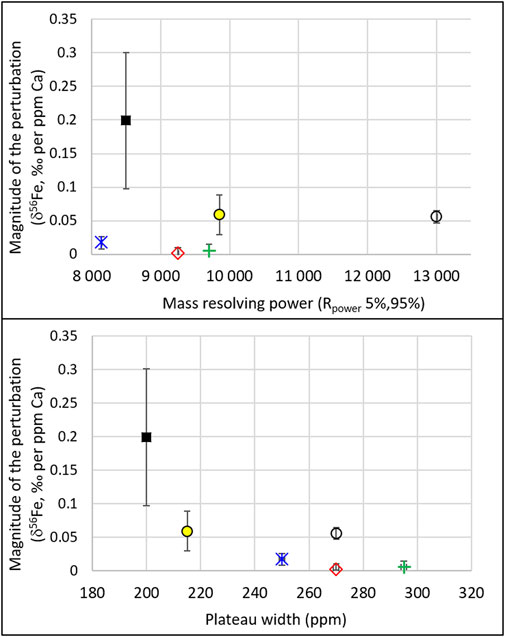
FIGURE 6. For the six different settings presented in Figure 5 (variable resolutions and plateau widths), and for the maximum Ca concentration tested in each of these settings (3 ppm for the 2015 and 2016 tests and 10 ppm for the 2017 and 2018 tests), the magnitude of the perturbation (i.e., the absolute value of the difference between the measured and the expected values) normalized to the Ca concentration is shown as a function of the mass resolving power (top) and plateau width (bottom). Error bars show the uncertainties propagated from those shown (and described) in Figure 5. The Neptune Plus data are represented by the open black circles.
Calcium doping tests were also performed on the Neptune Plus instrument (Figure 5, Figure 6, open black circles). Results significantly differ from those obtained with the Neptune. First, perturbation magnitudes seem to be larger with the Neptune Plus than with the Neptune, for instance, for the same Ca concentration [(Ca) = 10 ppm], and the same plateau width (270 ppm), whereas an insignificant perturbation was measured on the Neptune (hematite δ56Fe = 0.48 instead of 0.53), and a large perturbation was measured on the Neptune Plus (δ56Fe = −0.07 instead of 0.53). Moreover, while the effect of Ca doping on the Neptune systematically led to positive biases, negative ones were obtained with the Neptune Plus (Figure 5). The principal difference between the two systems is the interface (cones and vacuum), named “Jet interface” on the Neptune Plus. Enhanced levels of polyatomic interferences, notably 40Ar14N+, have been reported with the Jet interface compared to the standard interface (Chernonozhkin et al., 2017). High levels of Ca may similarly lead to enhanced levels of 40Ca14N+ with the Jet interface compared to the standard one. This could explain the larger and negative biases observed on the Neptune Plus compared to those observed on the Neptune.
Interferences may also result from homonuclear diatomic ions such as 27Al2+ and 28Si2+, interfering on 54Fe+ and 56Fe+, respectively. This was tested on the Neptune Plus. Results are shown in Figure 7. For silicon, the correct isotopic composition of the hematite was found up to the maximum doping concentration tested here, 10 ppm (Si/Fe = 50 g/g where Fe is natural Fe). This demonstrates that up to this level, this interference is negligible. Such tests have not been previously published to our knowledge.
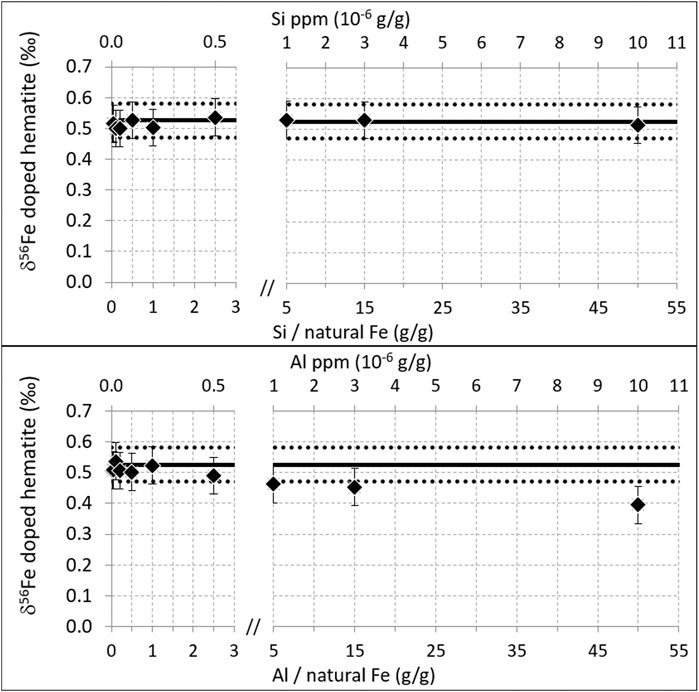
FIGURE 7. Same as Figure 4, for Al and Si. Measurements performed on the Neptune Plus, in October 2018. Resolution 13,000, plateau 270 ppm, natural Fe concentration 200 ppb.
For Al, the correct isotopic composition is found up to [Al] = 500 ppb (Al/Fe = 2.5 g/g where Fe is natural Fe). However, significant perturbations are detected for concentrations equal and above [Al] = 1 ppm (Al/Fe = 5 g/g), with the perturbation magnitude increasing with increasing Al concentration. This effect had been previously shown on a Nu Plasma instrument with a 57-58Fe double-spike (Millet et al., 2012). However, this latter study found significant perturbations (δ56Fe difference of 0.1‰) for much smaller Al contents, Al/Fe = 0.05 (g/g), while here no perturbation is detected up to Al/Fe = 2.5 (50 times higher).
Unlike Cr and Ni isobaric interferences, Ca and Al polyatomic ion interferences cannot be corrected for. While 54Cr and 58Ni interferences can be deduced from the measurement of 53Cr and 60Ni (cf. Experimental section), the intensity of Ca and Al polyatomic ion interferences depend on 1) their concentration, 2) the rate of production of the polyatomic ions, and 3) the precise mass (M in Figure 1) at which the measurements are performed. While the first point could be addressed by its measurement (in dynamic mode), the two last points depend on many uncontrolled and potentially variable parameters, such as the efficiency of the desolvating system, the plasma temperature, environment of the cones (vacuum, size of hole, and distances), or the magnetic field intensity (that varies very slightly). Because Ca and Al polyatomic ion interferences cannot be corrected for, their concentrations in the samples have to be below the indicated thresholds.
We preconize the following procedure. The calcium, aluminum, and iron concentrations should be determined in all purified samples prior to the MC-ICPMS measurements. Then, while tuning the MC-ICPMS (cups alignments and peak shape optimization), in addition to pure Fe and HNO3 solutions, pure Ca and Al solutions, with concentrations at least equal to their maximum values in samples, should be introduced and their peak shape measured, in order to verify that their polyatomic ion interference level at mass M are comparable to (and not larger than) that of the HNO3. Finally, and most importantly, a Fe isotopic standard doped with these Ca and Al levels should be regularly measured, to make sure that these elements do not significantly perturb the measurements. This is especially important for samples with high initial calcium contents, such as calcite minerals or tests, bones and teeth, but also marine samples, including seawater (Heimann et al., 2010; Jaouen et al., 2012; Emmanuel et al., 2014; Labatut et al., 2014; Revels et al., 2015; Klar et al., 2017), or high initial aluminum content such as silicate rocks or atmospheric dust samples.
While samples are usually purified before Fe isotopic composition MC-ICPMS analysis, some elements may remain in the purified samples at significant concentrations, in some circumstances. They may degrade the measurement accuracy. We have tested the effect of the following perturbations on the accuracy of the Fe isotopic composition measurement with a Neptune and a Neptune Plus MC-ICPMS, using a 58Fe-57Fe double-spike mass bias correction:
- Cr and Ni isobaric interferences;
- Na, Mg, K, Ca, and Mo matrix effects;
- Ca polyatomic ion spectral interferences;
- Al and Si homonuclear diatomic ion spectral interferences.
We found that for 200 ppb natural Fe solutions (mixed with 300 ppb of double-spike), the measurements (after Cr and Ni interference and mass bias corrections) were unperturbed up to the following levels (in the following ratios, Fe stands for natural Fe; i.e., the double-spike contribution is not included; results were obtained with the Neptune unless otherwise indicated):
- [Cr] = 24 ppb, that is, Cr/Fe = 0.12 (g/g)
- [Ni] = 8 ppb, that is, Ni/Fe = 0.04 (g/g)
- Na/Fe = 175, Mg/Fe = 10, K/Fe = 1.5, and Mo/Fe = 75 (g/g)
- For Ca, the perturbation was shown to be related to the Fe plateau width, and therefore to be due to Ca polyatomic ion spectral interferences (40Ca14N, 40Ca16O, 40Ca16O1H, and 42Ca16O), rather than to matrix effects. With the Neptune MC-ICPMS, it was found that significant perturbations could occur with only 0.5 ppm Ca (Ca/Fe = 2.5) for a plateau width of 200 ppm, while no perturbation could be detected with 10 ppm Ca (Ca/Fe = 50) for a plateau width of 295 ppm. The Neptune Plus MC-ICPMS was found more sensitive than the Neptune to the Ca polyatomic ion interferences.
- 28Si2+ interference was found insignificant up to Si/Fe = 50 (on the Neptune Plus).
- 27Al2+ interference was found insignificant up to Al/Fe = 2.5, but significant over this threshold (on the Neptune Plus).
These results imply that while working with samples with potentially high calcium or aluminum contents (including purified seawater or silicate rocks), Ca and Al perturbations should carefully be taken into account (in addition to Cr and Ni) while 1) tuning the instrument and 2) checking the measurement accuracy with isotopic standards (i.e., doping the isotopic standard with Ca and Al levels comparable to those of the samples).
FL conceived the study. CP, LA, and JK prepared the samples. FL, CP, LA, and JK performed the MC-ICPMS measurements. JC and RF brought their expertise on MC-ICPMS, and FL wrote the manuscript with contributions from JK, JC, LA, and RF.
The French National Center for Research (CNRS) provided funding for FL, CP, JK, JC, and RF and Toulouse University for LA. This study was fully funded by French public funds.
The authors declare that the research was conducted in the absence of any commercial or financial relationships that could be construed as a potential conflict of interest.
All claims expressed in this article are solely those of the authors and do not necessarily represent those of their affiliated organizations, or those of the publisher, the editors and the reviewers. Any product that may be evaluated in this article, or claim that may be made by its manufacturer, is not guaranteed or endorsed by the publisher.
A. Marquet and C. Duquenoy are thanked for her help within the Midi Pyrenees Observatory ICPMS facility. Delphine Bosch is thanked for her great help in providing access to the clean lab in Montpellier. Two reviewers are thanked for their constructive comments.
1The metrology vocabulary used in the present study refers to the “International vocabulary of metrology—Basic and general concepts and associated terms (VIM)” (2012) and the International Standard ISO 5725-1 (1994).
ISO 5725 uses two terms “trueness” and “precision” to describe the accuracy of a measurement method. “Trueness” refers to the closeness of agreement between the arithmetic mean of a large number of test results and the true or accepted reference value. “Precision” refers to the closeness of agreement between test results (ISO 5725-1, 1994).
The measurement “trueness” is inversely related to systematic measurement error, the latter being estimated by the “measurement bias.” “Measurement accuracy” is sometimes erroneously used instead of “measurement trueness” (VIM 2012).
“Measurement precision is used to define measurement repeatability, […] and measurement reproducibility.” “Sometimes measurement precision is erroneously used to mean measurement accuracy” (VIM 2012).
The measurement “accuracy” is the “closeness of agreement between a measured quantity value and a true quantity value of a measurand” (VIM 2012). A measurement that is characterize at the same time by a good trueness (i.e. small bias, i.e. small systematic error) and a good precision (i.e. a good repeatability for instance) is characterized by a good accuracy.
For the sake of clarity, the term “perturbation” is used here instead of the term “influence quantity” as defined in the 2nd edition of the VIM as follows: “quantity that is not the measurand but that affects the result of the measurement.”
Abadie, C., Lacan, F., Radic, A., Pradoux, C., and Poitrasson, F. (2017). Iron Isotopes Reveal Distinct Dissolved Iron Sources and Pathways in the Intermediate versus Deep Southern Ocean. Proc. Natl. Acad. Sci. USA 114 (5), 858–863. doi:10.1073/pnas.1603107114
Albarède, F., and Beard, B. (2004). Analytical Methods for Non-traditional Isotopes. Rev. Mineral. Geochem. 55 (1), 113–152. doi:10.2138/gsrmg.55.1.113
Albarède, F., Télouk, P., and Balter, V. (2017). Medical Applications of Isotope Metallomics. Rev. Mineral. Geochem. 82 (1), 851–885. doi:10.2138/rmg.2017.82.20
Barling, J., and Weis, D. (2012). An Isotopic Perspective on Mass Bias and Matrix Effects in Multi-Collector Inductively-Coupled-Plasma Mass Spectrometry. J. Anal. Spectrom. 27 (4), 653–662. doi:10.1039/C2JA10382F
Beard, B. L., and Johnson, C. M. (2004). Fe Isotope Variations in the Modern and Ancient Earth and Other Planetary Bodies. Rev. Mineral. Geochem. 55 (1), 319–357. doi:10.2138/gsrmg.55.1.319
Borrok, D. M., Wanty, R. B., Ridley, W. I., Wolf, R., Lamothe, P. J., and Adams, M. (2007). Separation of Copper, Iron, and Zinc from Complex Aqueous Solutions for Isotopic Measurement. Chem. Geol. 242 (3), 400–414. doi:10.1016/j.chemgeo.2007.04.004
Boumans, P. W. J. M. (1966). “Ionization Phenomena and the Determination of Electron Pressure,” in Theory of Spectrochemical Excitation (Boston, MA: Springer), 156–232. doi:10.1007/978-1-4684-8428-1_7
Chernonozhkin, S. M., Costas-Rodríguez, M., Claeys, P., and Vanhaecke, F. (2017). Evaluation of the Use of Cold Plasma Conditions for Fe Isotopic Analysis via Multi-Collector ICP-Mass Spectrometry: Effect on Spectral Interferences and Instrumental Mass Discrimination. J. Anal. Spectrom. 32 (3), 538–547. doi:10.1039/C6JA00428H
Conway, T. M., Rosenberg, A. D., Adkins, J. F., and John, S. G. (2013). A New Method for Precise Determination of Iron, Zinc and Cadmium Stable Isotope Ratios in Seawater by Double-Spike Mass Spectrometry. Analytica Chim. Acta 793, 44–52. doi:10.1016/j.aca.2013.07.025
Dauphas, N., John, S. G., and Rouxel, O. (2017). Iron Isotope Systematics. Rev. Mineral. Geochem. 82 (1), 415–510. doi:10.2138/rmg.2017.82.11
Dauphas, N., Pourmand, A., and Teng, F.-Z. (2009). Routine Isotopic Analysis of Iron by HR-MC-ICPMS: How Precise and How Accurate? Chem. Geol. 267 (3), 175–184. doi:10.1016/j.chemgeo.2008.12.011
Dauphas, N., and Rouxel, O. (2006). Mass Spectrometry and Natural Variations of Iron Isotopes. Mass. Spectrom. Rev. 25 (4), 515–550. doi:10.1002/mas.20078
Dideriksen, K., Baker, J. A., and Stipp, S. L. S. (2006). Iron Isotopes in Natural Carbonate Minerals Determined by MC-ICP-MS with a 58Fe-54Fe Double Spike. Geochim. et Cosmochim. Acta 70 (1), 118–132. doi:10.1016/j.gca.2005.08.019
Emmanuel, S., Schuessler, J. A., Vinther, J., Matthews, A., and von Blanckenburg, F. (2014). A Preliminary Study of Iron Isotope Fractionation in marine Invertebrates (Chitons, Mollusca) in Near-Shore Environments. Biogeosciences 11 (19), 5493–5502. doi:10.5194/bg-11-5493-2014
International Bureau for Weights and Measures (BIPM)International Electrotechnical Committee (IEC)International Federation for Clinical Chemistry and Laboratory Medicine (IFCC)International Laboratory Accreditation Cooperation (ILAC)International Organization for Standardization (ISO)International Union for Pure and Applied Chemistry (IUPAC) (2012). International Vocabulary of Metrology – Basic and General Concepts and Associated Terms (VIM). 3rd edition. Sèvres, France: Joint Committee for Guides in Metrology. Retrieved from www.bipm.org.
Finlayson, V. A., Konter, J. G., and Ma, L. (2015). The Importance of a Ni Correction with Ion Counter in the Double Spike Analysis of Fe Isotope Compositions Using a 57 Fe/ 58 Fe Double Spike. Geochem. Geophys. Geosyst. 16 (12), 4209–4222. doi:10.1002/2015GC006012
Gillson, G. R., Douglas, D. J., Fulford, J. E., Halligan, K. W., and Tanner, S. D. (1988). Nonspectroscopic Interelement Interferences in Inductively Coupled Plasma Mass Spectrometry. Anal. Chem. 60 (14), 1472–1474. doi:10.1021/ac00165a024
He, Y., Ke, S., Teng, F.-Z., Wang, T., Wu, H., Lu, Y., et al. (2015). High-Precision Iron Isotope Analysis of Geological Reference Materials by High-Resolution MC-ICP-MS. Geostand Geoanal. Res. 39 (3), 341–356. doi:10.1111/j.1751-908X.2014.00304.x
Heimann, A., Johnson, C. M., Beard, B. L., Valley, J. W., Roden, E. E., Spicuzza, M. J., et al. (2010). Fe, C, and O Isotope Compositions of Banded Iron Formation Carbonates Demonstrate a Major Role for Dissimilatory Iron Reduction in ∼2.5Ga marine Environments. Earth Planet. Sci. Lett. 294 (1), 8–18. doi:10.1016/j.epsl.2010.02.015
Houk, R. S. (1986). Mass Spectrometry of Inductively Coupled Plasmas. Anal. Chem. 58 (1), 97A–105A. doi:10.1021/ac00292a003
International Organization for Standardization (1994). ISO 5725-1:1994(en) Accuracy (trueness and precision) of measurement methods and results — Part 1: General principles and definitions. Retrieved from https://www.iso.org (Accessed July 5, 2021).
Jaouen, K., Balter, V., Herrscher, E., Lamboux, A., Telouk, P., and Albarède, F. (2012). Fe and Cu Stable Isotopes in Archeological Human Bones and Their Relationship to Sex. Am. J. Phys. Anthropol. 148 (3), 334–340. doi:10.1002/ajpa.22053
John, S. G. (2012). Optimizing Sample and Spike Concentrations for Isotopic Analysis by Double-Spike ICPMS. J. Anal. Spectrom. 27 (12), 2123–2131. doi:10.1039/C2JA30215B
Klar, J. K., James, R. H., Gibbs, D., Lough, A., Parkinson, I., Milton, J. A., et al. (2017). Isotopic Signature of Dissolved Iron Delivered to the Southern Ocean from Hydrothermal Vents in the East Scotia Sea. Geology 45 (4), 351–354. doi:10.1130/G38432.1
Klar, J. K., Schlosser, C., Milton, J. A., Woodward, E. M. S., Lacan, F., Parkinson, I. J., et al. (2018). Sources of Dissolved Iron to Oxygen Minimum Zone Waters on the Senegalese continental Margin in the Tropical North Atlantic Ocean: Insights from Iron Isotopes. Geochim. et Cosmochim. Acta 236, 60–78. doi:10.1016/j.gca.2018.02.031
Labatut, M., Lacan, F., Pradoux, C., Chmeleff, J., Radic, A., Murray, J. W., et al. (2014). Iron Sources and Dissolved-Particulate Interactions in the Seawater of the Western Equatorial Pacific, Iron Isotope Perspectives. Glob. Biogeochem. Cycles 28, 1044–1065. doi:10.1002/2014GB004928
Lacan, F., Radic, A., Jeandel, C., Poitrasson, F., Sarthou, G., Pradoux, C., et al. (2008). Measurement of the Isotopic Composition of Dissolved Iron in the Open Ocean. Geophys. Res. Lett. 35 (24). doi:10.1029/2008GL035841
Lacan, F., Radic, A., Labatut, M., Jeandel, C., Poitrasson, F., Sarthou, G., et al. (2010). High-Precision Determination of the Isotopic Composition of Dissolved Iron in Iron Depleted Seawater by Double Spike Multicollector-ICPMS. Anal. Chem. 82 (17), 7103–7111. doi:10.1021/ac1002504
Millet, M.-A., Baker, J. A., and Payne, C. E. (2012). Ultra-precise Stable Fe Isotope Measurements by High Resolution Multiple-Collector Inductively Coupled Plasma Mass Spectrometry with a 57Fe-58Fe Double Spike. Chem. Geology. 304-305 (305), 18–25. doi:10.1016/j.chemgeo.2012.01.021
Poitrasson, F., and Freydier, R. (2005). Heavy Iron Isotope Composition of Granites Determined by High Resolution MC-ICP-MS. Chem. Geol. 222 (1–2), 132–147. doi:10.1016/j.chemgeo.2005.07.005
Revels, B. N., Ohnemus, D. C., Lam, P. J., Conway, T. M., and John, S. G. (2015). The Isotopic Signature and Distribution of Particulate Iron in the North Atlantic Ocean. Deep Sea Res. Part Topical Stud. Oceanography 116, 321–331. doi:10.1016/j.dsr2.2014.12.004
Rudge, J. F., Reynolds, B. C., and Bourdon, B. (2009). The Double Spike Toolbox. Chem. Geol. 265 (3), 420–431. doi:10.1016/j.chemgeo.2009.05.010
Schoenberg, R., and von Blanckenburg, F. (2005). An Assessment of the Accuracy of Stable Fe Isotope Ratio Measurements on Samples with Organic and Inorganic Matrices by High-Resolution Multicollector ICP-MS. Int. J. Mass Spectrom. 242 (2–3), 257–272. doi:10.1016/j.ijms.2004.11.025
Siebert, C., Nägler, T. F., and Kraners, J. D. (2001). Determination of Molybdenum Isotope Fractionation by Double-Spike Multicollector Inductively Coupled Plasma Mass Spectrometry. Geochem. Geophys. Geosys. 2, 2000GC000124. doi:10.1029/2000gc000124
Sun, J., Zhu, X., Tang, S., and Chen, Y. (2013). Investigation of Matrix Effects in the MC-ICP-MS Induced by Nb, W, and Cu: Isotopic Case Studies of Iron and Copper. Chin. J. Geochem. 32 (1), 1–6. doi:10.1007/s11631-013-0600-z
Teruel, J. d. D., Alcolea, A., Hernández, A., and Ruiz, A. J. O. (2015). Comparison of Chemical Composition of Enamel and Dentine in Human, Bovine, Porcine and Ovine Teeth. Arch. Oral Biol. 60 (5), 768–775. doi:10.1016/j.archoralbio.2015.01.014
von Blanckenburg, F., Mamberti, M., Schoenberg, R., Kamber, B. S., and Webb, G. E. (2008). The Iron Isotope Composition of Microbial Carbonate. Chem. Geol. 249 (1), 113–128. doi:10.1016/j.chemgeo.2007.12.001
Weyer, S., and Schwieters, J. B. (2003). High Precision Fe Isotope Measurements with High Mass Resolution MC-ICPMS. Int. J. Mass Spectrom. 226, 355–368. doi:10.1016/s1387-3806(03)00078-2
Zheng, X.-Y., Beard, B. L., and Johnson, C. M. (2018). Assessment of Matrix Effects Associated with Fe Isotope Analysis Using 266 Nm Femtosecond and 193 Nm Nanosecond Laser Ablation Multi-Collector Inductively Coupled Plasma Mass Spectrometry. J. Anal. Spectrom. 33 (1), 68–83. doi:10.1039/C7JA00272F
Keywords: iron isotopes, MC-ICPMS, double-spike, interferences, matrix effects, calcium, aluminum
Citation: Lacan F, Artigue L, Klar JK, Pradoux C, Chmeleff J and Freydier R (2021) Interferences and Matrix Effects on Iron Isotopic Composition Measurements by 57Fe-58Fe Double-Spike Multi-Collector Inductively Coupled Plasma Mass Spectrometry; the Importance of Calcium and Aluminum Interferences. Front. Environ. Chem. 2:692025. doi: 10.3389/fenvc.2021.692025
Received: 07 April 2021; Accepted: 08 July 2021;
Published: 08 September 2021.
Edited by:
Nathalie Vigier, UMR7093 Laboratoire d’océanographie de Villefranche (LOV), FranceReviewed by:
Emmanuelle Albalat, UMR5276 Laboratoire de géologie de Lyon Terre, planètes et environnement (LGL-TPE), FranceCopyright © 2021 Lacan, Artigue, Klar, Pradoux, Chmeleff and Freydier. This is an open-access article distributed under the terms of the Creative Commons Attribution License (CC BY). The use, distribution or reproduction in other forums is permitted, provided the original author(s) and the copyright owner(s) are credited and that the original publication in this journal is cited, in accordance with accepted academic practice. No use, distribution or reproduction is permitted which does not comply with these terms.
*Correspondence: F. Lacan, ZnJhbmNvaXMubGFjYW5AbGVnb3Mub2JzLW1pcC5mcg==
†Present address: Lise Artigue, GET, CNRS, CNES, IRD, UPS, University of Toulouse, Toulouse, France
Disclaimer: All claims expressed in this article are solely those of the authors and do not necessarily represent those of their affiliated organizations, or those of the publisher, the editors and the reviewers. Any product that may be evaluated in this article or claim that may be made by its manufacturer is not guaranteed or endorsed by the publisher.
Research integrity at Frontiers
Learn more about the work of our research integrity team to safeguard the quality of each article we publish.