 Iva Batić
95% of researchers rate our articles as excellent or good
Learn more about the work of our research integrity team to safeguard the quality of each article we publish.
Find out more
MINI REVIEW article
Front. Energy Res. , 12 February 2025
Sec. Solar Energy
Volume 13 - 2025 | https://doi.org/10.3389/fenrg.2025.1519131
This article is part of the Research Topic Reviews in Energy Research 2024 View all articles
Given the increasing human population on Earth, there is a corresponding increase in the need for energy. One of the ecological and economical methods of meeting such energy needs is through renewable energy sources. Accordingly, this study analyzes the potential for producing electrical energy from solar radiation in Serbia. The Sun is the largest source of renewable energy, and Serbia has very good potential for utilization of solar radiation. In this work, we performed a comparative analysis of the electrical energy production from photovoltaic power plants using different photovoltaic panel technologies; these technologies affect not only the degree of conversion of solar irradiation to electrical energy but also the ecological parameters concerning the use of photovoltaic panels by reducing CO2 emissions. In this work, the following photovoltaic panel technologies are analyzed: monocrystalline, polycrystalline, thin-layer amorphous (a-Si), and cadmium–telluride (CdTe). The software tool used for the analysis was PVsyst.
The global population increase has resulted in increasing need for energy as well as greater energy consumption. Today, energy is mostly produced from non-renewable sources, such as oil, coal, and natural gas, whose supplies are limited, consumed quickly, and concentrated only in a few areas around the world. Oil, coal, and natural gas are currently used to fulfil up to 86.5% of the primary energy demand globally (Babić, 2016). In addition to the extensive economic dependence on fossil energy sources, the problem of protecting the environment from pollution remains a constant concern. The burning of fossil fuels, especially those based on oil and coal, is the one of the main causes of global warming and has resulted in the “greenhouse” effect. This has created problems related to energy provision and environment preservation (obligations to reduce CO2 emissions and reduce the impacts on climate change, as per the Kyoto Protocol) (Babić and Đurišić, 2015; Carvalho, 2012a). Utilization of renewable energy sources (RES) is one of the methods of meeting the energy needs in an ecologically and economically justifiable manner in the global energy development strategy. Serbia has accepted the COP28 Agreement, whereby the RES capacity must be tripled by 2030, and the transition from fossil fuels to RES in the energy systems should be accelerated in this decade to achieve zero emissions by 2050 (Cop 28, 2023). RESs are energy resources used for the production of electrical energy or heat, whose reserves are found in nature and are fully or partially renewable. The Sun is by far the largest source of renewable and unlimited energy for humans and has great potential. The energy from solar radiation that reaches the surface of the Earth is 1.9×10⁸ TWh per year, which is 170 times the energy from the total known coal reserves in the world. This means that the energy from solar radiation is sufficient to produce an average of 1700 kWh of electricity per year on each square meter of the Earth’s surface (Babić, 2016).
Photovoltaic (PV) power systems are used to produce electrical energy from solar irradiation. The quantity of electrical energy that can be obtained from a PV system primarily depends on the radiated solar energy at the location being analyzed. The capacity for solar irradiation on the Earth’s surface depends on several factors, such as latitude, cloud cover, season, and time of day. The actual global horizontal irradiation (GHI) for Europe is shown in Figure 1 (Batić and Đurišić, 2021). From Figure 1, it can be concluded that Serbia has a solar radiation energy potential of over 30% higher than that of Germany, which leads the production of electricity from PV systems in Europe. Figure 2 presents a map of the global potential of solar radiation in the Republic of Serbia. The figure shows that the average annual solar energy irradiation per unit of horizontal surface in the open terrain varies from 1,450 kWh/m2 in the South to approximately 1,250 kWh/m2 in the North of Serbia.
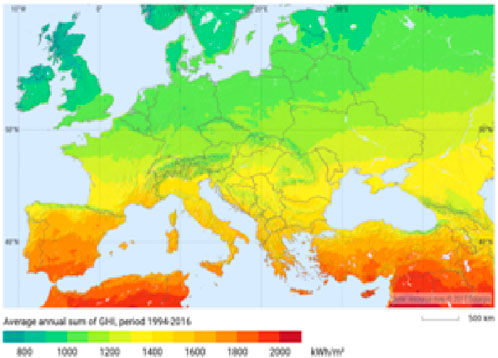
Figure 1. Solar potential of Europe (Batić and Đurišić, 2021).

Figure 2. Solar potential of Serbia (Batić and Đurišić, 2021).
The explosive progresses of PV cell production and technologies have resulted in multiple reductions in the market prices of PV system components (Babić, 2016). Progress regarding technological developments of PV systems has been directed toward the fabrication of more energy efficient and cheaper PV cells, such as thin-film technology, organic PV cells, and perovskite minerals for PV cells (Babić, 2016). The type of PV module used and its operating temperature can impact the electrical performance. Given the various solar cell materials used in PV modules, approximately 6%–20% of the incident solar energy is transformed into electricity. The efficiency of the PV module is also decreased because the remaining solar radiation increases its temperature (Kumar et al., 2020).
This work presents a comparative analysis of the electrical energy production of PV power plants using different PV panel technologies. Differences in the PV panel technologies can affect the degree of conversion of solar radiation to electrical energy. In this work, the following technologies are analyzed and discussed: monocrystalline, polycrystalline, thin-layer amorphous (a-Si), and cadmium–telluride (CdTe). The analyzed PV systems had the same nominal power of 10 kW and were situated in the same geographical location in Belgrade, Serbia, with the same orientation, tilt, and azimuth angle of the PV panels. The geographical coordinates of the PV power plant are N 44°48′14″ and E 20°27′54”. Figure 3 shows the sun path diagram for the geographical location in Belgrade, Serbia. The PV power plants had similar dimensions and nominal power values. The main differences between the plants were regarding the types of PV panels used, which were fabricated by different manufacturers based on different technologies, as mentioned previously.
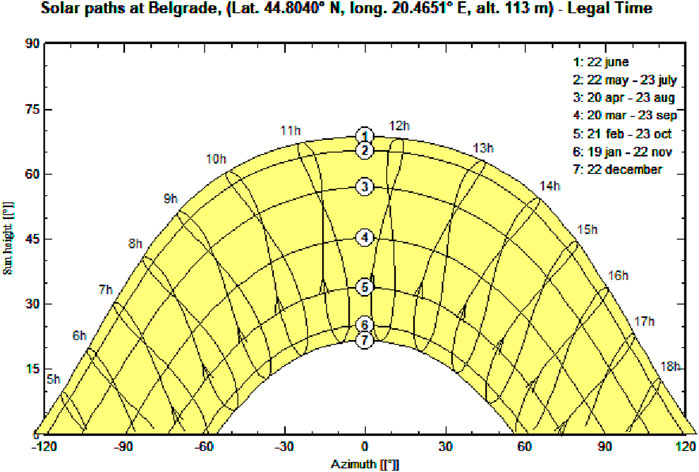
Figure 3. Sun path diagram (Meteonorm, 2024).
The efficiency of a PV power plant can be expressed using different parameters as different indicators of the PV system operation. In this work, detailed calculations of the solar potential of the target location in Belgrade, Serbia, were obtained using the professional software package PVsyst developed by scientists from the University of Geneva in Switzerland. To facilitate comparisons between several PV power plants, the European Joint Research Center introduced a performance index, which is outlined in the IEC EN 61724 norm (PVsyst, 2024). The performance ratio
Since the current–voltage characteristic of a PV module changes with the insolation and temperature, the STCs were established to compare different PV modules. The manufacturers of PV modules provide some basic characteristics related to the STCs. The efficiency coefficient represents the part of the solar energy converted to electricity and is defined for the STCs.
The STCs include the following:
• Solar irradiation on the surface of the panel is 1000 W/m2 (one Sun);
• the temperature of the PV cell is 25°C;
• the coefficient of air mass is 1.5.
These terms are accepted by the International Electrotechnical Commission (IEC) and American Society for Testing and Materials (ASTM). The reference test conditions are used by the PV module manufacturers to define the specific parameters. The PV modules are then tested indoors, where the temperature and intensity can be adjusted artificially (Batić et al., 2023).
The energy potentially produced under the STCs is equal to
Given that the Performance Ratio (PR) is the ratio of electrical energy generated by a PV power plant in a certain time interval, delivered to the power distribution network and the total installed power of PV modules, it can be also defined with Equation 2 (PVsyst, 2024):
where
The reference system yield
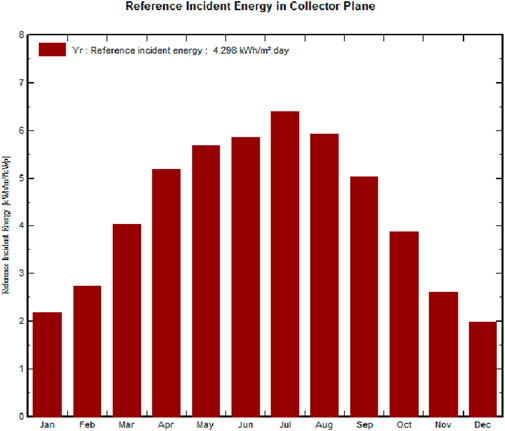
Figure 4. Reference incident energies of PV power plants in Belgrade (PVsyst, 2024).
PV modules from different manufacturers were selected in these analyses. For the monocrystalline and polycrystalline technologies, 230 Wp PV modules from Canadian Solar were analyzed. For the CdTe technology, 390 Wp PV modules from First Solar were analyzed. For the a-Si technology, 48 Wp PV modules from Fuji Electric were analyzed. The technical specifications provided by the manufacturers for the analyzed PV modules are given in Table 1. Each of the four analyzed PV systems has the same rated power and uses the same 2-kW-rated inverter from Fronius International. In these analyses, the best annual performance of 3.69 kWh/kWp/day was obtained for the PV system with monocrystalline technology, followed by the 3.66 kWh/kWp/day performance of the CdTe-based PV system. The lowest value performance was obtained as 3.44 kWh/kWp/day for the a-Si technology.
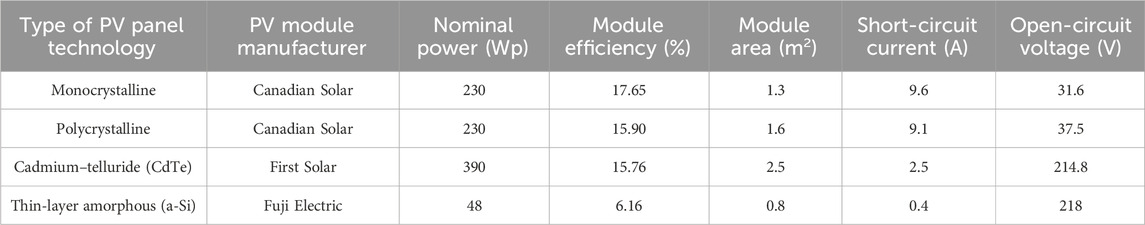
Table 1. Technical specifications provided by the manufacturers for the PV modules.
Figure 5 shows the graphs of the different technologies along with their system yields (
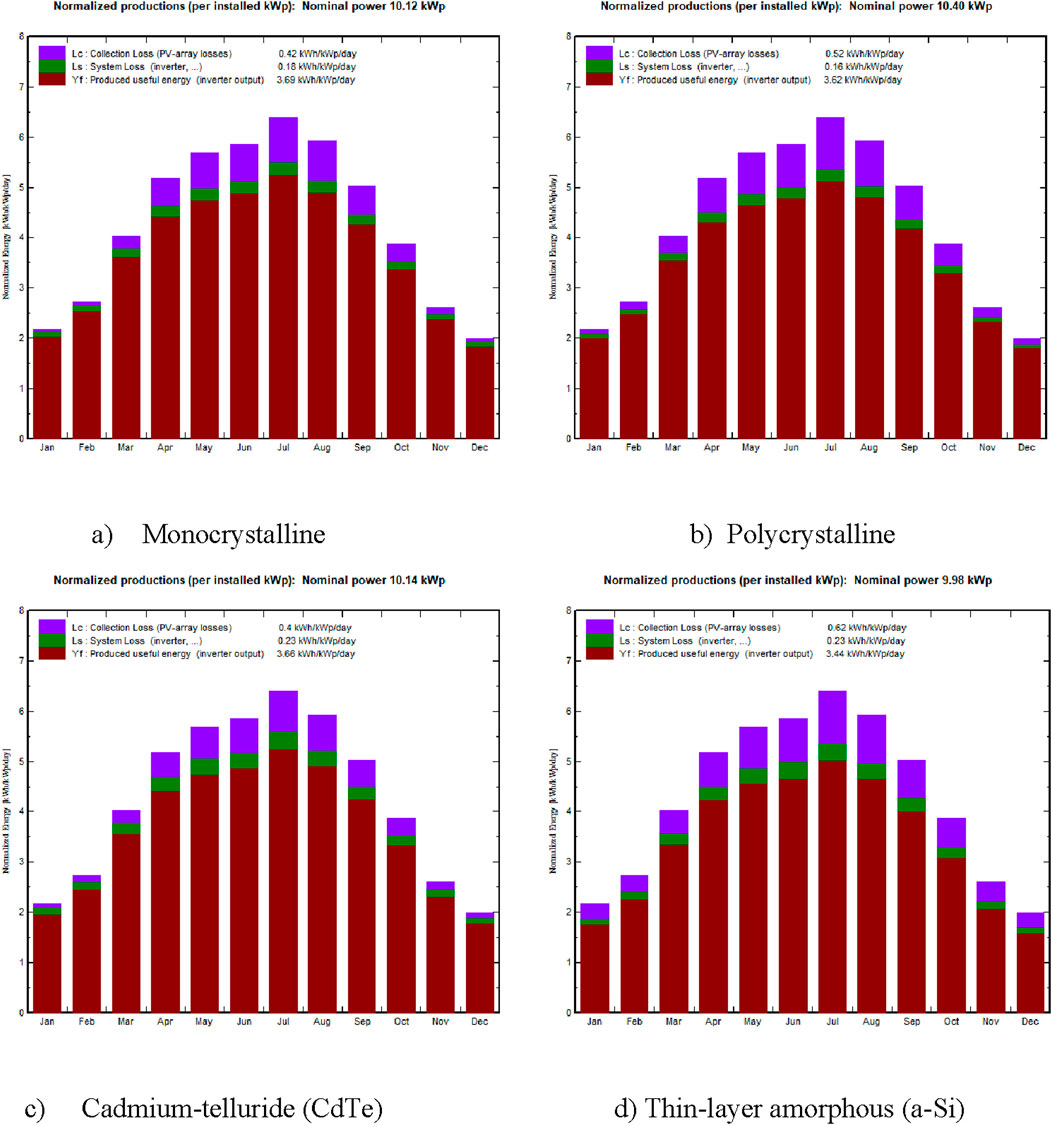
Figure 5. Normalized production per installed kW of different types of technologies (PVsyst, 2024): (A) monocrystalline, (B) polycrystalline, (C) CdTe, and (D) thin-layer amorphous (a-Si).
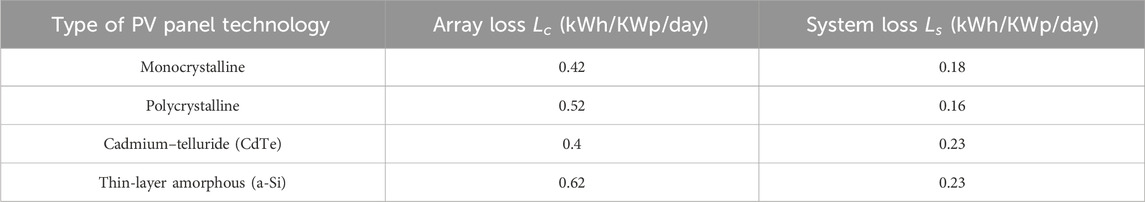
Table 2. Losses in the PV systems.
From the graphs in Figure 5, it is seen that the largest array and system losses are incurred during the summer months. This can be explained by the fact that PV panels are exposed to solar irradiation for longer periods of time and very high temperatures during summer. The lowest array losses are noted as 0.4 kWh/kWp/day and 0.42 kWh/kWp/day for the systems with CdTe and monocrystalline PV panels, respectively. These results are very good and encouraging because monocrystalline PV panels are widely used in Serbia. The CdTe-based PV technology is the leading and foremost technology in the rapidly growing thin-film PV industry (Rawat et al., 2018). The highest array loss is noted as 0.62 kWh/kWp/day for the system with a-Si PV panels. The system losses are lower than the array losses for all of the PV technologies analyzed herein. The lowest system loss of 0.16 kWh/kWp/day was noted for the system with polycrystalline PV panels, and the highest system losses of 0.23 kWh/kWp/day each were noted for the systems with a-Si and CdTe PV panels.
Figure 6 shows the monthly results for the PR, which includes all the losses in the PV systems, namely, optical losses (shading, IAM, and soiling), array losses (PV conversion, aging, module quality, mismatch of PV panels, and wiring), and system losses (inverter efficiency in the grid-connected system). The PR is not dependent on the PV module efficiency. As an example, an amorphous module and a crystalline high-efficiency module both have comparable
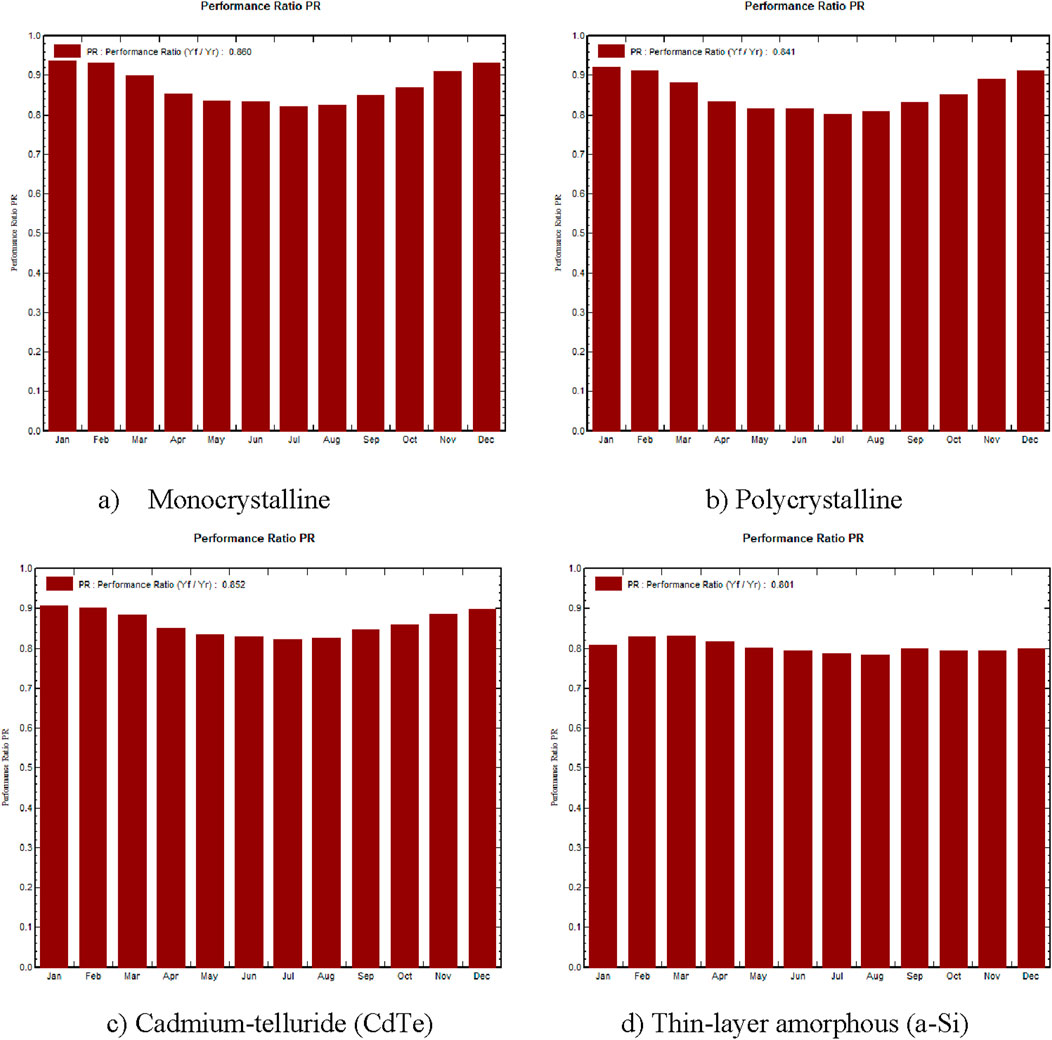
Figure 6. Performance ratios of (A) monocrystalline, (B) polycrystalline, (C) CdTe, and (D) a-Si technologies.
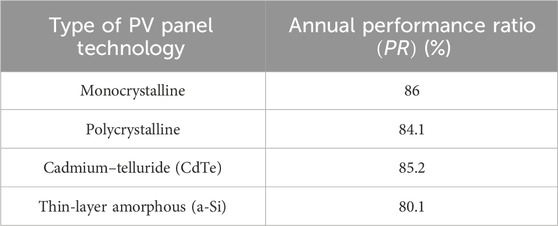
Table 3. Annual performance ratio
As mentioned previously, electrical energy production from conventional fossil energy sources, especially those based on oil and coal, has a negative impact on the environment. The main negative impact of electrical energy production that creates global problems is the emission of greenhouse gases into the atmosphere. Fossil fuels have higher specific emissions of equivalent gases than RESs. Gases like CO2, NOX, and SO2 that are emitted into the atmosphere can have negative impacts on the environment, such as global warming due to the greenhouse effect, occurrence of acid rain, and unfavorable impact on the ecosystem.
CO2 is considered the reference gas for global warming and the greenhouse effect. This greenhouse effect represents warming of the planet Earth and is caused by disruption of the energy balance between the amount of radiation received by the Earth’s surface from the Sun and that which radiates into space; i.e., it is the result of an increase in the amount of radiation that the Earth’s surface cannot emit into space but is absorbed by the greenhouse gases to increase the temperature of the Earth’s atmosphere. When 1 kWh of electrical energy is produced in a thermal power plant, 1 kg of CO2 is emitted into the atmosphere (Babić, 2016).
The use of RESs is very high on the list of priorities of the European Union and occupies a significant place in the European strategy on energy and climate change (Carvalho, 2012b). In 2008, the European Parliament adopted a package of regulations on climate change with the aim of reducing greenhouse gases (European Union, 2017). By ratifying the Treaty on the Establishment of the Energy Community, the Republic of Serbia accepted the obligation to enact and enforce a plan for implementing the directive on promoting electrical energy production from RESs (European Union, 2017).
Nowadays, the focus is on renewable-energy-based power generation systems as the basis for achieving the Sustainable Development Goals (SDGs) (Bošnjaković et al., 2023). The SDGs constitute a set of 17 global goals established by the United Nations in 2015 and aimed at addressing various global challenges, including poverty, inequality, climate change, environmental degradation, and peace and justice. The main aims of the SDGs are to eliminate discrimination and inequality, end poverty, and overcome climate change by 2030 (Nooman AlMallahi et al., 2024). Several SDGs are particularly relevant with respect to PV technologies; PV technologies contribute significantly to increase the share of renewable energy in the global energy mix, making energy more accessible and sustainable, which is directly related to SDG7. By reducing our reliance on fossil fuels and lowering greenhouse gas emissions, PV technologies play crucial roles in combating climate change related to SDG13.
PV systems are find as clean and sustainable sources of energy. The electricity generated from solar energy increased from 72 GW in 2011 to 850 GW in 2021 (Nooman AlMallahi et al., 2024). According to numerous projections on the number of installed PV systems by 2050, it is expected that a significant part of CO2 emissions will be reduced. This goal is very ambitious, but if the integration of PV systems were to continue and if the predicted projections were realized, the reduction of the predicted CO2 emissions would be easily achieved (Guo et al., 2023; Wang et al., 2024). Bošnjaković et al. (2023) analyzed greenhouse gas emissions based on the installed capacity of a power plant; these power plants were divided into four groups, and the CO2 eq./kWh emissions ranged from 12.5 to 126. This variability can be caused by differences in the energy requirements during manufacturing and assembly processes as well as the energy mixtures used to manufacture PV modules (Fthenakis et al., 2008). Additionally, variations in module technology (efficiency) and device lifetimes (varying from 15 to 30 years) can be important factors (Sherwani et al., 2010).
Solar energy is one of the most significant RESs that allows production of clean power while significantly reducing CO2 emissions (Tawalbeh et al., 2021; Shahsavari and Akbari, 2018). According to the IEA tracking report of 2022 (Bojek, 2022), the CO2 emissions for the production of PV systems ranged from 14 to 73 g of CO2 eq./kWh depending on the PV technology, location of the power plant, and electricity mix used for production. This is 10–53 orders of magnitude lower than the emissions reported for the burning of oil (742 g of CO2 eq./kWh). The reported values for CO2 emissions are roughly in the same range as those for concentrated solar power technologies (8–90 g of CO2 eq./kWh) (Bošnjaković et al., 2023). It was also noted that the carbon footprint of a PV system could be further decreased by one order of magnitude through the use of novel manufacturing materials (Tawalbeh et al., 2021). PV power plants emit an average of 48 g of CO2/kWh during their working life, and this is a very coarse global average value.
PV cells are made from different types of semiconductor materials. Most studies in literature have evaluated the greenhouse gas emissions of c-Si cells (monocrystalline and polycrystalline), while thin-film technology has been analyzed to a lesser extent (Bošnjaković et al., 2023). According to Silva and Raadal (2019), the mean estimated values of greenhouse gas emissions for monocrystalline, polycrystalline, and thin films were 61.8, 52.2, and 35.5 g of CO2 eq./kWh, respectively. The average greenhouse gas emission for a-Si technology is 30 g, CdTe technology is 27 g, and CIGS technology is 53 g of CO2 eq./kWh. CdTe thin-film technology has the lowest average value of greenhouse gas emissions because the production of CdTe thin-film modules requires a lower amount of energy compared to other technologies (Fthenakis et al., 2008; Fthenakis and Kim, 2011). Greenhouse gas emissions from PV power plants can decrease over time as the PV modules become more efficient, production of solar cells becomes less energy intensive, and share of renewable energy in the power grid increases (Bojek, 2022).
In the present work, the reduction in CO2 emission expected from a PV installation is estimated. The basis of this calculation is the so-called lifecycle emission (LCE), which represents the CO2 emission associated with a given component or energy amount. This value includes the total lifecycle of a component or energy amount, including production, operation, maintenance, and disposal. The LCE methodology used in most studies is the “cradle-to-gate” approach. It should be noted that there may be differences in the methodologies used by different authors and hence differences in the data obtained.
The electricity produced by a PV installation is expected to replace the same amount of electricity in an existing grid. If the carbon footprint of the PV installation per kWh is smaller than that for the grid electricity production, there will be a net saving of CO2 emissions. Thus, the total carbon balance for a PV installation is the difference between the produced and saved CO2 emissions and depends on four key factors (PVsyst, 2024):
1. E_Grid: production of the PV installation for 1 year.
2. Lifetime: this is the lifetime of the PV installation in years; together with E_Grid, it determines the total amount of energy that will be replaced by the PV installation.
3. Grid LCE: this is given in grams of CO2/kWh and represents the average amount of CO2 emissions per energy unit for the electricity produced by the grid.
4. PV system LCE: this is given in tons of CO2 and represents the total amount of CO2 emissions resulting from the construction and operation of the PV installation.
For the analyzed PV power plants based on different PV technologies, Table 4 shows the calculated values of the CO2 emission reductions. There are four values for these results:
1. Total CO2 emission savings over the expected lifetime of the PV installation (t).
2. Yearly CO2 emission savings (tCO2/year).
3. CO2 emission savings per installed power plant (tCO2/kWp).
4. Yearly CO2 emission savings per installed power plant (tCO2/kWp/year).
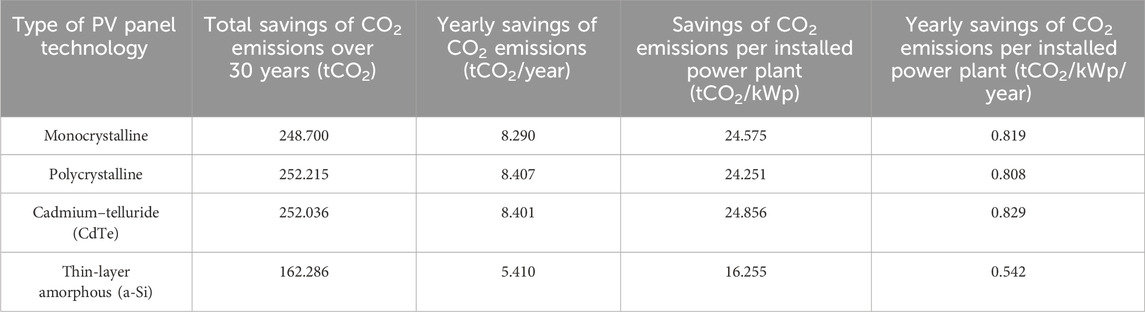
Table 4. Reduction of CO2 emissions over the 30-year period of exploitation of the PV power plant.
The yearly values are averaged over the entire lifetime by taking into account the annual degradation. The obtained values are graphically shown in Figure 7. These values represent the estimated CO2 emission savings expected for the PV installation. This reduction in CO2 emissions is achieved with electrical energy production in the PV power plants by considering that each kWh of energy produced by the PV power plant replaces the average kWh amount of energy from the present thermal power plants in Serbia. The present emission factor for the electrical energy mix in Serbia is 1.099 tCO2/MWh. It is assumed that the expected lifetime of a PV power plant is 30 years, and this is the period of exploitation of the PV power plants used in the calculations.
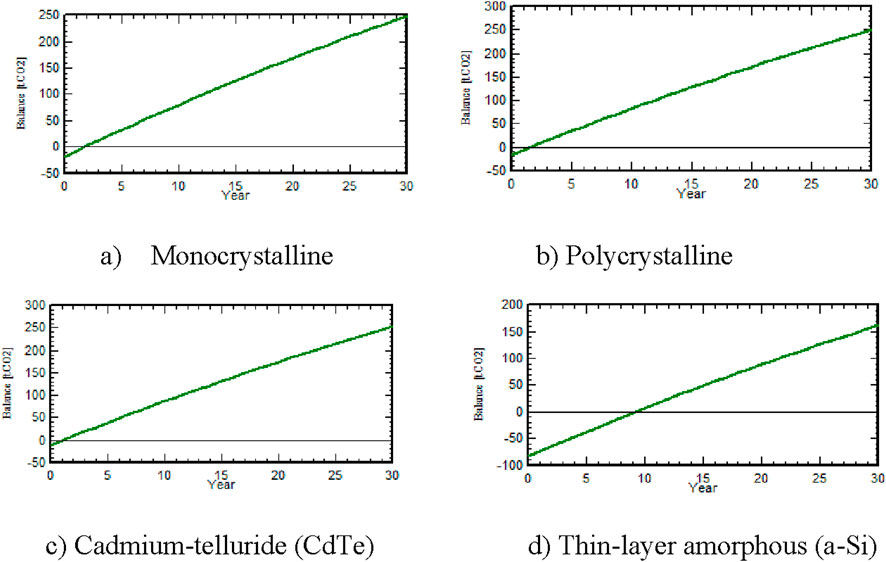
Figure 7. Saved CO2 emissions in PV power systems with (A) monocrystalline, (B) polycrystalline, (C) CdTe, and (D) a-Si technologies.
In terms of CO2 emission reduction, the best performance of 252.215 tCO2 is observed for the PV power plant with polycrystalline panels over the lifetime of the plant and 8.407 tCO2/year savings of CO2 emissions. Very similar reductions in CO2 emissions were obtained for the PV power plant with CdTe panels (252.036 tCO2 over the lifetime of the plant and 8.401 tCO2/year savings of CO2 emissions). The least reduction in CO2 emission was observed for the PV power plant with a-Si panels, with 162.286 tCO2 reduction over the lifetime of the plant and 5.410 tCO2/year savings of CO2 emissions.
This work presents an analysis of the potential for electrical energy production from solar irradiation in Serbia. It is well known that the Sun is the largest source of renewable energy. Serbia has very good potential for receiving solar irradiation, which is over 30% higher than that for Germany that is the leader in electricity production from PV systems in Europe. A comparative analysis of electrical energy production from PV power plants using different PV panel technologies is presented herein. The aim of this research was to determine the manner in which different PV panel technologies impact PV power plant production. Different PV panel technologies can affect the degree of conversion of solar irradiation to electrical energy, and they can also affect the ecological parameters of the use of PV panels by reducing CO2 emissions from the systems. The following PV panel technologies are analyzed in this work: monocrystalline, polycrystalline, a-Si, and CdTe. The software tool used for the analysis was PVsyst.
For the given types of PV systems, the characteristic parameters, comparisons of the obtained values, and impacts on environmental pollution were calculated. By comparing the obtained values, it was observed that all PV systems analyzed herein showed positive results. In this work, the system yield was calculated for each type of PV panel technology, and this yield is characteristic of the corresponding PV system because it depends on the quality and specifications of the panels, weather conditions, and temperature. The best annual performances were obtained for the PV systems implementing monocrystalline and CdTe technologies. The lowest performance was obtained for the system with a-Si panels. The lowest array losses were noted for the systems with CdTe and monocrystalline PV panels, while the highest array loss was noted for the system with a-Si PV panels.
In terms of CO2 emission reduction, the best performance was noted for the PV power plant with polycrystalline panels (252.215 tCO2 over the lifetime of the plant and 8.407 tCO2/year savings of CO2 emissions). A similar reduction in CO2 emission was noted for the PV power plant with CdTe panels (252.036 tCO2 over the lifetime of the plant and 8.401 tCO2/year savings of CO2 emissions). The least reduction in CO2 emission was noted for the PV power plant with a-Si panels (162.286 tCO2 over the lifetime of the plant and 5.410 tCO2/year savings of CO2 emissions). The expected lifetime of a PV power plant is 30 years.
The monocrystalline and polycrystalline technologies are widely used in Serbia, so analyses of their impacts are very useful and precious. The results obtained in this study for these two technologies are excellent and encouraging. By advancing PV technologies, countries around the world, including Serbia, can initiate significant progress toward achieving these and other SDGs to promote a more sustainable and equitable future for all humans.
IB: writing–original draft and writing–review and editing.
The author declares that no financial support was received for the research, authorship, and/or publication of this article.
The author declares that the research was conducted in the absence of any commercial or financial relationships that could be construed as a potential conflict of interest.
The author declares that no Generative AI was used in the creation of this manuscript.
All claims expressed in this article are solely those of the authors and do not necessarily represent those of their affiliated organizations, or those of the publisher, the editors and the reviewers. Any product that may be evaluated in this article, or claim that may be made by its manufacturer, is not guaranteed or endorsed by the publisher.
Babić, I. (2016). Modeling the influence of the solar radiation time profile on the photovoltaic systems operations effects in a power system. University of Belgrade, School of Electrical Engineering. Doctoral dissertation. Available at: https://www.scribd.com/document/332692464/Iva-Babic-Doktorska-Disertacija
Babić, I., and Đurišić, Ž. (2015). Impact of daily variation of solar radiation on photovoltaic plants economy at the open market. Therm. Sci. 19 (3), 837–844. doi:10.2298/tsci141025009b
Batić, I., Batić, M., and Đurišić, Ž. (2023). Impact of air temperature and wind speed on the efficiency of a photovoltaic power plant: an experimental analysis. Therm. Sci. 27 (1A), 299–310. doi:10.2298/tsci220610160b
Batić, I., and Đurišić, Ž. (2021). “Analysis of the photovoltaic systems construction capacities and conditions on the preschool buildings roofs in Serbia,” in 2021 IEEE 48th Photovoltaic Specialists Conference (PVSC), Fort Lauderdale, FL, USA, 0199–0205.
Bošnjaković, M., Santa, R., Crnac, Z., and Bošnjaković, T. (2023). Environmental impact of PV power systems. Sustainability 15 (15), 11888. doi:10.3390/su151511888
Carvalho, M. G. (2012a). EU energy and climate change strategy. Energy 40, 19–22. doi:10.1016/j.energy.2012.01.012
Carvalho, M. G. (2012b). EU energy and climate change strategy. Energy 40, 19–22. doi:10.1016/j.energy.2012.01.012
Cop 28 (2023). COP28 declaration on climate, relief, recovery and peace. Available at: https://www.cop28.com/en/cop28-declaration-on-climate-relief-recovery-and-peace.
European Union (2017). Directive 2009/28/EC of the European parliament and of the council of 23 April 2009 on the promotion of the use of energy from renewable sources and amending and subsequently repealing Directives 2001/77/EC and 2003/30/EC. Available at: https://eur-lex.europa.eu/EN/legal-content/summary/promotion-of-the-use-of-energy-from-renewable-sources.html#:∼:text=This%20directive%2C%20which%20amends%20and%20repeals%20earlier%20Directives,greenhouse%20gas%20%28GHG%29%20emissions%20and%20promote%20cleaner%20transport.
Fthenakis, V. M., and Kim, H. C. (2011). Photovoltaics: life-cycle analyses. Sol. Energy 85, 1609–1628. doi:10.1016/j.solener.2009.10.002
Fthenakis, V. M., Kim, H. C., and Alsema, E. (2008). Emissions from photovoltaic life cycles. Environ. Sci. Technol. 42, 2168–2174. doi:10.1021/es071763q
Guo, X., Dong, Y., and Ren, D. (2023). CO2 emission reduction effect of photovoltaic industry through 2060 in China. Energy 269, 126692. doi:10.1016/j.energy.2023.126692
Kumar, R., Deshmukh, V., and Singh Bharj, R. (2020). Performance enhancement of photovoltaic modules by nanofluid cooling: a comprehensive review. Int. J. Energy Res. 44 (8), 6149–6169. doi:10.1002/er.5285
Meteonorm (2024). Meteonorm software worldwide irradiation data. Available at: https://meteonorm.com/en/.
Nooman AlMallahi, M., Al Swailmeen, Y., Ali Abdelkareem, M., Ghani Olabi, A., and Elgendi, M. (2024). A path to sustainable development goals: a case study on the thirteen largest photovoltaic power plants. Energy Convers. Manag. X 22, 100553. doi:10.1016/j.ecmx.2024.100553
PVsyst (2024). Design and simulation software for your photovoltaic systems. Available at: https://www.pvsyst.com/.
Rawat, R., Kaushik, S. C., Sastry, O. S., Bora, B., and Singh, Y. K. (2018). Long-term Performance Analysis of CdTe PV module in real operating conditions. Mater. Today Proc. 5 (11), 23210–23217. doi:10.1016/j.matpr.2018.11.052
Shahsavari, A., and Akbari, M. (2018). Potential of solar energy in developing countries for reducing energy-related emissions. Renew. Sustain. Energy Rev. 90, 275–291. doi:10.1016/j.rser.2018.03.065
Sherwani, A. F., Usmani, J. A., and Varun, (2010). Life cycle assessment of solar PV based electricity generation systems: a review. Renew. Sustain. Energy Rev. 14, 540–544. doi:10.1016/j.rser.2009.08.003
Silva, M., and Raadal, H. L. (2019). Life cycle GHG emissions of renewable and non-renewable electricity generation technologies part of the RE-invest project. Aalborg, Denmark: Aalborg University.
Tawalbeh, M., Al-Othman, A., Kafiah, F., Abdelsalam, E., Almomani, F., and Alkasrawi, M. (2021). Environmental impacts of solar photovoltaic systems: a critical review of recent progress and future outlook. Sci. Total Environ. 759, 143528. doi:10.1016/j.scitotenv.2020.143528
Keywords: renewable sources, solar energy, photovoltaic panels, environment, CO2 reduction
Citation: Batić I (2025) Impacts of different photovoltaic panel technologies on electrical energy production and CO2 emission reduction. Front. Energy Res. 13:1519131. doi: 10.3389/fenrg.2025.1519131
Received: 29 October 2024; Accepted: 13 January 2025;
Published: 12 February 2025.
Edited by:
Sanjeev K. Sharma, Chaudhary Charan Singh University, IndiaReviewed by:
Mobi Mathew, Rajiv Gandhi Institute of Petroleum Technology, IndiaCopyright © 2025 Batić. This is an open-access article distributed under the terms of the Creative Commons Attribution License (CC BY). The use, distribution or reproduction in other forums is permitted, provided the original author(s) and the copyright owner(s) are credited and that the original publication in this journal is cited, in accordance with accepted academic practice. No use, distribution or reproduction is permitted which does not comply with these terms.
*Correspondence: Iva Batić, aXZhQGV0Zi5ycw==
Disclaimer: All claims expressed in this article are solely those of the authors and do not necessarily represent those of their affiliated organizations, or those of the publisher, the editors and the reviewers. Any product that may be evaluated in this article or claim that may be made by its manufacturer is not guaranteed or endorsed by the publisher.
Research integrity at Frontiers
Learn more about the work of our research integrity team to safeguard the quality of each article we publish.