 Aurel Burciu
 Ionel Bostan1†
 Simona Buta
 Raluca Zoltan
94% of researchers rate our articles as excellent or good
Learn more about the work of our research integrity team to safeguard the quality of each article we publish.
Find out more
ORIGINAL RESEARCH article
Front. Energy Res., 20 February 2025
Sec. Sustainable Energy Systems
Volume 13 - 2025 | https://doi.org/10.3389/fenrg.2025.1515788
This article is part of the Research TopicEnergy Transition: Opportunities and Barriers in Technology, Economics, and PolicyView all articles
This study aims to argue the role of disruptive technologies in reducing Final Energy Consumption (FEC) for 5 EU member states (Romania vs. the Visegrad Group), as well as the EU27 average for the period 2010–2020, in the context of current energy crisis, as a response to sustainable development imperatives. At the time of 2022, it proves once again that the state is needed to optimize the functioning of energy markets. From a theoretical perspective, the study brings two elements of absolute novelty. First, the study proposes a new model to determine two composite indexes related to the level of endowment with disruptive technologies (DEDT - Degree of Endowment for Disruptive Technologies) and the level of knowledge per capita (PCK - Per Capita Knowledge). The determination of DEDT and PCK was based on existing studies, statistical data as well as the authors’ consultation with a panel of experts in the use of digital technologies relevant to reducing FEC. Second, the study argues that even a relatively low annual increase in DEDT and knowledge of the EU-27 population is positively correlated with the reduction of FEC, the increase of GDP (Gross Domestic Product) and the shift of countries/firms towards the green economy and sustainable development. From a pragmatic perspective, the results of the study are of both direct and indirect interest for EU Member States’ policies, as well as for firms and families in their attempt to reduce FEC and to focus their behavior on the SDGs (Sustainable Development Goals).
In the context of Russia’s war in Ukraine (February 2022), the EU’s energy and sustainable development policies have undergone major changes from the ones promoted in the context of the 2008–2010 global crisis and in the period that followed. Various international studies (Baumgartner et al., 2012; Dutta et al., 2024; National Intelligence Council, 2012; World Intellectual Property Indicators, 2016), etc. show the importance of the relationship between innovation-technologies and energy efficiency with reference to the 2008–2010 crisis. At the COP 27 (Conference of the Parties of the United Nations, summit in Egypt (2022), the results achieved in terms of reducing global pollution by 2030 appear to be more modest compared to the targets proposed by the EU and other developed countries a decade ago (Rathi and Lombrana, 2022). This is because some contradictions inevitably arise between the targets set by the EU for reducing global pollution as per the with 17 Goals by 2030 (Un SDG, 2015a; Un SDGs, 2015b) in a context where the war in Ukraine has generated an energy crisis. As is well known, the history of the 2030 Agenda for Sustainable Development under the UN began in 1992 in Rio de Janeiro, Brazil, when 178 countries adopted Agenda 21 as a plan for the sustainable development of the world until 2030 (UN SDG, 2022). At present, the Agenda under the UN targets 17 distinct goals including: Quality Education; Clean Water and Sanitation; Affordable and Clean Energy; Industry, Innovation and Infrastructure; Climate Action, etc. Every 4 years, a group of experts report on the progress made by countries in implementing this agenda and achieving each goal; the report for 2023, explicitly invokes the fact that the war in Ukraine has generated not only suffering and loss of life, but also an energy crisis that is difficult for countries to manage, so as to maintain their progress in implementing the SDGs (Sustainable Development Goals) (UN SDG, 2023).
Through the REPower EU action plan, the European Commission is allocating around 210 billion euro in additional funding (Romania is expected to receive euro 1.4 billion through the National Recovery and Resilience Plan (NRRP) to optimize energy production, distribution and consumption by 2027 (Chiriac, 2022; R-EU a, 2022). This EU plan is designed to support the reorientation of people’s energy consumption while maintaining EU commitments to implement the SDGs.
The basic idea of the present study is to suggest/argue some directions to reduce FEC in 5 EU member countries (Romania, Poland, Hungary, Czech Republic, Slovakia) by using disruptive technologies and knowledge/education by citizens and organizations in the new energy market context after 2020 (after the COVID-19 crisis, the war in Ukraine, etc.). The group of Visegrad countries was formed in 1991 from Poland, Hungary, Czech Republic, Slovakia, later Romania was also invited to collaborate with this group; the aim of the group was mainly to coordinate the policies of the 5 countries and to support each other for EU accession. The motivation for the analysis of the 5 countries vs. the EU average was given by the fact that these countries had a command economy until 1990, a close evolution of economic growth until 2004–2007 when they joined the EU, they have similar energy consumption trends and a comparable degree of digitalization of society. Within the Visegrad Group, improving energy efficiency remains a key objective of government policies; all 5 countries aim to increase the share of renewable energy in total consumption and face some common challenges in particular from 2020 onwards until now (outdated production/transport infrastructure, geo-political vulnerabilities caused by the war in Ukraine, etc.) At the same time, the governments of the 5 countries have adopted relatively different economic policies on reducing fossil fuel import dependency, increasing the digitalization of society/economy, etc. After their accession to the EU (2007), the 5 countries have carried out some major reforms in the direction of aligning their economic policies with the economic and SGDs policies adopted by the EU. The proposed study covers the period 2010–2020 for which it was possible to identify some unitary statistical data on GDP per capita growth, per capita FEC evolution, use of digital technologies, etc. The existing statistical data (presented by us in more detail in Annexes A, B and C) show that GDP per capita in each of the 5 countries is below the EU average, FEC per capita is close to the EU average, and some indicators show a comparable degree of digitization in the 5 countries (IT access, IT use, etc.). In the context of the energy policies applied by the EU from 2020 onwards, of the commitments that the EU has in the framework of the SDGs, the proposed study finally suggests some directions of action for the governments of the 5 countries analyzed, but also for the experts of the European Commission in the direction of the energy transition from traditional fuels to the “green economy.” The European Union’s energy policy is at a critical stage as it seeks to balance economic growth, energy security and environmental sustainability. In this broader context, Romania and the Visegrad Group (Czech Republic, Hungary, Poland and Slovakia) present persuasive case studies for understanding the challenges and opportunities of the EU energy transition. Despite the EU’s carbon neutrality targets for 2050, member states differ significantly in their progress and strategies to reach these goals. Romania and the Visegrad countries face unique structural and economic constraints hindering the rapid uptake of renewable energy and other sustainable practices. In addition, their dependence on fossil fuels, outdated infrastructure and varying levels of integration into EU energy networks create additional challenges. This research investigates how these countries address these barriers and leverage disruptive technologies to advance their energy transitions.
To achieve the purpose of this study, respective to argue on the basis of international statistical data that disruptive/digital technologies play a major role in reducing FEC and that education and knowledge of the population to exploit these technologies supports GDP growth, the achievement of some SDG targets, but also the lowering of FEC for any EU member country (theoretically, some generalizations can be made about policies applied by non-EU countries).
As is well known, some reputable historians argue (Ferguson et al., 2011; Morris, 2010; Rhodes, 2018; Smil, 2017). That the entire civilization of the West and its dominance over the last two centuries vis-à-vis the East and/or other regions of the world is explained not only by competition, institutions and values, but also by continuous innovation in the development of various energy sources. This has become increasingly evident with the Industrial Revolution (1776) and up to the present day. Over more than two centuries, individuals, companies and countries have extracted more and more energy and created more and more material values (Morris, 2010, p. 419). The emergence of large corporations in the US from 1850 onwards also meant the emergence of monopolies in the oil industry (Chandler, 1977) as the profits of oil companies and/or other related industries grew ever larger, so did the first criticisms of large MNCs (Löpfe and Vontobel, 2012). The term modern capitalism, Drucker argues, emerged about 2 decades after Marx, so around 1900 (Drucker, 2010, p. 252); from this point on, we discuss the knowledge society and the role of the educated/trained individual, which should be a universal concept. The integration of mass production and distribution in the US, Chandler argues, led to the emergence of a new social class, namely, “professional managers” (Chandler, 1977, pp. 288–337); for over a century, management and technologies have led to unprecedented increases in labour productivity (Drucker, 2010, pp. 258–259). More importantly, professional managers in major Western countries have gradually become a kind of “visible hand” correcting market imperfections in most sectors of industry and services (Chandler, 1977). The capitalism of the knowldge society is completely different from the capitalism before 1900; knowledge, continuous innovation and investment in employee skills have become essential for performance in any type of organisation (Drucker, 2010, pp. 258–264).
However, when looking at the current situation vs. the historical perspective on energy industries/markets, it appears that at least since the Great Depresion of 1929–1933 and until today the relationship between the state, companies and consumers has become somewhat divergent. The „visible hand” of managers in these industries (oil, gas, electricity, renewable energy, etc.), while still very efficient, is mainly concerned with making the highest possible profits for stakeholders. Since the 1930s, various Western oil companies have been increasingly present in Middle Eastern countries (Rhodes, 2018, pp. 240–248); oil and other “fossil fuel” resources are becoming strategic resources for all countries of the world. The syntagm “visible hand” of the state entered the Economics literature since 1930 with the meaning of direct involvement of the state to correct some imperfections given by the market mechanism (with reference only to certain markets such as: financial market, labour market, energy market, etc.). In our study, we maintain the same role and/or characteristics for the “visible hand” and, in addition, we put in antithesis the “visible hand” of the state versus the “visible hand” of the managers in the energy sector of the main countries of the world. What solutions can be foreseen for energy policies in the world’s major countries? Should the state assume the role of “visible hand” for managing energy markets? What can various empirical studies suggest for informing public energy policies?
The Standard Oil Trust Company, founded in 1882, was one of the great conglomerates that demonstrated the effectiveness of the “visible hand” of managers in running a business (Chandler, 1977, pp. 418–425); the same company quickly became a monopoly in the oil industry, which is why the American state disbanded the corporation in 1910 (Chandler, 1977, p. 423). For more than a century, the world’s leading states have been directly/indirectly involved in optimising the functioning of energy markets (most visibly in the context of the energy crises of the 1970s and 1980s (Fatai et al., 2004); since the 1990s, the aim has been to match countries’ energy policies with the goals proposed in the SDGs, with the EU and other leading countries opting for the so-called Green Deal (Schuelke-Leech, 2021). It can therefore be argued that the state has been directly involved in the functioning of energy markets for the last century, as energy resources are unevenly distributed globally.
Our proposed study provides further arguments for the use of the “visible hand” of the state both at EU level and for each Member State in the governance of energy markets and crisis management. In addition, the study argues quite well that any annual increase/surge in the use of disruptive technologies, together with the improvement of knowledge/education of the population, reflects positively in the reduction of FEC, the increase of GDP at country level and the orientation of countries/firms towards the “green economy” (this implicitly means partially achieving some of the SDGs).
To achieve this goal, based on statistical data for the period 2010–2020, the study proposes an original method to empirically determine two composite indexes called DEDT (Degree of Endowment with Disruptive Technologies) and PCK (Per capita Knowledge) respectively. The study is thematically linked the EU strategy called REPowerEU, as a concrete plan of measures, among others, aimed at reducing energy consumption with 15% from 2023 (R-EU a, 2022).
Nearly a century ago, Schumpeter argued that „creative destruction” brings about major changes in some industries and eliminates others from the market (Schumpeter, 1994; Schumpeter, 1939, pp. 219–271). More recently (Christensen, 1997; Christensen, 2006; Christensen et al., 2008) have put forward the concept of “disruptive innovation” as an equivalent for “creative destruction.” Since 1997, dozens of volumes have been written on the importance of “disruptive innovation” (Christensen et al., 2018); basically, the main idea of the concept is that certain major innovations/inventions generate leading technologies and/or different ways of relating to the market, which is why certain industries and/or economic sectors are driven out of competition.
In the 1980s, Drucker argued quite well that, alongside technical innovations, social innovations have become equally important to economic growth in all Western countries (Drucker, 1986, pp. 30–31). Since the 2000s, as McQuivey argues (McQuivey, 2013), “digital disruption” has become perhaps more important than major technical innovations; “digital disruptors” can emerge in any country/region and manifest themselves rapidly in the market, sometimes within months (McQuivey, 2013). Technical and social innovation within any firm or country has today become directly dependent on the IT&C system as a central element of the networking linking firms to customers, suppliers and other stakeholders (Prahalad and Krishnan, 2008, pp. 110–112). The same idea about the role/importance of digital technologies in relation to GDP growth, decreasing pollution and lowering energy consumption is argued in various studies (Hafner and Luciani, 2022, pp. 615–620; Kouziokas et al., 2019). In other papers on this topic (Lange et al., 2020; Noussan and Tagliapietra, 2020), the relationship between the digitalization of the economy/society, GDP growth and energy efficiency leads to somewhat more nuanced conclusions, in the sense that the increasing use of IT&C by individuals and firms brings additional energy consumption even if it positively influences GDP growth.
In the context of what we have called the knowledge society, each individual must be prepared to adapt his or her own values over time, to try to become a more effective member of society and to gradually accumulate new types of skills (Drucker, 2010, pp. 192–195); this means gradually accumulating new “tacit knowledge.” The distinction between “tacit knowledge” and “explicit knowledge” began in the 1960s, starting with Polanyi’s work (Polanyi, 1967); it has become essential for continuous innovation at the level of organizations and countries. The accumulation of both categories of knowledge requires the continuous education of the population and the adaptation of behaviour to new constraints arising in society. As we will argue in our study, any investment made by an individual and/or by states in the direction of accumulating new “tacit knowledge” in the exploitation of DT seems to be much more beneficial (as opposed to orienting energy policies in the direction of over-taxing energy companies, subsidising the population in the energy poverty category, etc.) for the gradual/beneficial change of the energy consumption pattern, the increase of GDP and the shift to the “green economy” for any country in the world. Some studies (Brounen et al., 2013) argue quite well that energy education of the population has become essential to improve the consumption behaviour of the population, taking into account that households own about 20% of the FEC (the study is based on a sample of 1721 households in the Netherlands at the time of 2012, a nationally representative sample). Government policies on “Energy Certification” of households are gradually changing the energy behaviour of the population and contributing to the reduction of energy waste in the EU (Brounen and Kok, 2011).
The transition from one type of energy to another (from coal to oil, then to atomic energy and more recently to renewable energy) (Ishaq et al., 2022; Madureira, 2021 etc.) in the evolution of Western countries has been permanently accompanied by some costs and adaptation of the population to use new technologies. The same idea is found in the content of other studies even if the authors change the perspective of analyzing the subject (Schnidrig et al., 2023; Shao and Wang, 2022). Therefore, it follows that the governments of the world’s major countries must be prepared to assume an essential role in the process of energy transition and policy implementation within the SDGs. Findings deriving from other studies on this topic (Ali et al., 2023; Hu et al., 2021; Wang et al., 2022) converge to the idea that technological innovations, reliance on disruptive technologies, FDI attraction and economic openness of a country (Hardi et al., 2024; Hu et al., 2021), etc. have together and/or separately beneficial effects on energy efficiency and the achievement of some SDGs targets.
Therefore, it can be argued that assuming the role of „visible hand” of the state has become today essential for reducing FEC and meeting some of the targets of the SDGs (the state can influence the energy market through dozens of instruments such as: education and lifelong learning policies, investments in research and innovation, subsidies to reduce energy consumption, etc.). It goes without saying that the energy education of the population in all Western countries is directly dependent on the general education system and various tools for long life learning of individuals. Over the last 3 decades, theory has linked “organisational learning” to “tacit knowledge”; according to some authors (Busch, 2008, pp. 133–138) their flows and diffusion, transfer, etc. in society are strongly influenced by the cultural specificity of each country. The culture of a country/nation and/or the culture in organisations is however changing relatively slowly; the increasing use of technologies in the last 3 decades is changing traditional paradigms regarding learning and knowledge creation (Nonaka and Nishiguchi, 2001). A large part of the population of the developed countries of the world supports the achievement of global goals under the SDGs; the majority support the adoption of international rules to limit plastic pollution (Nonaka and Nishiguchi, 2001); but voluntary change in people’s energy consumption behaviour appears to be a much more difficult process (Brounen et al., 2013; Brounen and Kok, 2011; IEEFA, 2018; Park et al., 2022; Smallbone et al., 2020; Wangjiraniran et al., 2017; Zhang et al., 2018).
Essentially, by “tacit knowledge” we mean knowledge that a person has accumulated through direct experience, on an intuitive basis, even if it involves the simultaneous accumulation of “explicit knowledge” (Polanyi, 2015, pp. 23–24). This class of “tacit knowledge” represents 80% or more of the stock of knowledge existing in a society/country. More importantly, the advent of the computer and the internet has radically changed the conditions necessary for an educated person to remain efficient and effective in relation to the job they do. The industrial revolution and modern capitalism, argue several authors (Chandler, 1977; Drucker, 1994), have led to the emergence of professional managers and continuous/systematic innovation; this means a redefinition of knowledge and learning processes at individual and group level. New digital technologies force employees to accumulate new types of tacit knowledge on a daily basis. In the same context, different types of organisations are forced to identify new strategies and organisational structures. The productivity achieved by an employee in relation to his or her job depends increasingly on skills that are not quantifiable (at the level of the individual) and are accumulated in particular through self-education of the employee in the use of various types of digital technologies. What prospects can be envisaged in this new context of post-capitalist society? What prospects can be seen in relation to the voluntary change of one’s consumption pattern?
In the context of Russia’s war in Ukraine, EU Member States and other countries of the world are forced to adjust their general policies in relation to SDGs, green education and the reduction of FEC. More and more governments in the world’s major countries are accusing energy MNCs (producers, distributors, oil, gas and electricity market intermediaries) of making exorbitant profits that are made on the spur of the moment, not by the “visible hand” of top management. In fact, in relation to the energy markets at a global level, a kind of “competition” has arisen between the “visible hand” of the managers of energy companies and the “visible hand” of the state in the main countries of the world. This complex/uneven relationship between government policies and energy company strategies is “historically” shaped (Rhodes, 2018; Smil, 2003), but it has become much more visible by 2023, especially when we take into account the targets proposed by countries through the SDGs.
The US administration warned in October 2022 the top 6 largest oil companies in the US that their excessive profits are in clear contradiction with the interests of US consumers (Rushe and Aratani, 2022). In the same vein, several voices in the European Parliament and the European Commission are calling for the introduction of tax surcharges for oil and gas companies that have made excessive profits in the context of the energy crisis (Timmins, 2022). Therefore, the “visible hand” of the state can manifest itself in several directions (surcharging excessive profits of companies in the sector, subsidising consumption of the population, subsidising a faster switch to renewable energy, subsidising education to change the energy consumption pattern of the population, etc.) both at EU level and in the case of public policies applied by other countries of the world. The direction suggested by the present study on the “visible hand” at EU level and for Member States is to support directly (financial) and indirectly (rules/regulations) the education of the population to exploit digital technologies and increase the stock of various DTs in the consumption of the population.
There are obviously some DTs that are not digital. They can, however, induce major and rapid changes in certain industrial sectors as well as in household consumption (e.g., LED bulbs, EV batteries, solar panels, etc.). According to (Hafner and Luciani, 2022) and other authors (Moita and Monte, 2022) the increase in the storage capacity of electric batteries has generated a disruptive “wave” in various industries and in public consumption (Hafner and Luciani, 2022, pp. 240–251; IEEFA, 2018; Tamaki et al., 2017). The disruptive strategies applied by Tesla in the EV industries, as well as in the solar panel industry, are examples of areas where we find non-digital innovation/DT (Adams et al., 2014; Hafner and Luciani, 2022; Tamaki et al., 2017).
There are several studies on the relationship between technologies, the evolution of GDP per capita and the evolution of FEC per capita across main countries (Andrieu et al., 2022; Asghar, 2008; Bianco et al., 2009; Fatai et al., 2004; Ha, 2022; Lange et al., 2020; Noussan and Tagliapietra, 2020; Soava et al., 2018; Vlăducu, 2020; Zhou et al., 2019), concluding that energy consumption patterns differ significantly from country to country as well as the use of technology in economic activity. A study of 7 developed OECD countries (Canada, France, Germany, Italy, Japan, the United Kingdom and the United States), reveals that there are similarities but also differences in the relationship between FEC and GDP growth and that some conclusions based on descriptive statistics lead to contradictory results (Zachariadis, 2007). Also along these lines, some studies (Qin, 2020) link energy market volatility to global/regional market developments; other studies examine the relationship between IT&C and carbon emissions (Zhou et al., 2019). Another conclusion of such studies is that in developed economies (Payne, 2009) the FEC increases only up to a certain level (energy consumption does not exceed a reasonable comfort level for households, firms or institutions), while GDP per capita stabilizes or continues to increase very slightly (the situation is slightly different when production/output and not GDP is included in the analysis). In the same vein, the literature discusses three thresholds against which energy consumption per inhabitant can be assessed at country level (technological threshold, physical threshold, economic threshold) (González-Eguino, 2015). Access to electricity and other types of energy differs greatly from one group of countries to another; in some countries such as Ethiopia, Sudan and others (which have the lowest rankings under the GII - Global Innovation Index, as GDP per capita, etc.) there is a 30%–50% access rate to electricity. Therefore, the issue of energy poverty and the 3 three thresholds in such countries is dependent on the access of the population to different types of energy (Carley and Lawrence, 2014). In some situations (e.g., Luxembourg with a GDP per capita of more than 100,000 USD) an increase in FEC per capita is observed in parallel with the increase in GDP per capita (this means energy decay and should be limited by law). Other papers (Avram et al., 2018; Dumitru et al., 2019) highlight the need to improve the regulatory framework for Europe regarding the reporting of firms’ achievement of targets that connect consumption behavior, CSR (Corporate Social Responsibility), targets derived from SDGs with countries’ energy policies. Some more recent studies show that new technologies can be disruptive also in social relations, institutions, values and fundamental concepts (Hopster, 2021; Sherule and Dudhe, 2021).
The aspects raised in this section of the study highlight that the issue of changing energy consumption behaviour is directly/indirectly linked to the use of disruptive technologies, education, GDP growth and the orientation of countries/firms towards the green economy. The analytical perspective from which the relationship can be approached, however, differs quite a lot from one study to another. A study of OECD member states (Lange et al., 2020) shows that a 1% increase in “internet users” requires a 0.026% increase in electricity consumption (both variables in the study increase, but it remains to be seen how this affects GDP, pollution reduction, etc.).
One of the objectives of the study is to identify some measures and/or instruments to reduce the FEC that are relatively easy to apply and dependent on the energy consumption behavior of individuals, firms and the energy policies promoted by the governments of the 27 EU Member States.
In synthesis, the authors used a research methodology based on the following characteristics:
- Depth of scope: explanatrory;
- Research approach: deductive;
- Methodological choise: quantitative;
- Type of data: secondary;
- Time approach: longitudinal.
The present research is therefore quantitative, longitudinal in nature, based on secondary data collected from international rankings and statistical databases. In addition, the authors designed and applied a questionnaire to 24 experts in the use of digital technologies and optimization of energy consumption in Romania.
Between the various stages of the research strategy, we show that, after selecting some relevant studies existing in the literature and the necessary statistical data, the authors constructed a questionnaire (see structure in Supplementary Appendix C). For the design of the questionnaire in Supplementary Appendix C, the authors went through several stages, namely:
• In the first stage (S1) of the empirical research (July-August 2022), the authors used an initial review of the international literature on the relationship between FEC, GDP and other macroeconomic indicators, including energy market trends and policies applied by the EU and Member States to manage FEC in relation to SGDs.
At this stage of the study to identify the necessary bibliographic references (85 sources), we investigated databases such as Scopus, Web of Science, Science Direct, IEEE Explore, MDPI, Elsevier, Emerald and Google Academic, using keywords such as final energy consumption, digital technology, disruptive technology, knowledge, sustainable development, etc. The same investigation method was applied for the selection of relevant studies/articles (55 articles and 5 international statistical databases, from the final bibliography, text and final references), as well as for the selection of authors/volumes (25 books) that are relevant on the topic under study. Initially, on an empirical basis and/or by cross-analysis of the 9 mentioned databases, we identified more than 120 articles and studies that directly or indirectly referred to the relationship between digital/disruptive technologies and FEC, as well as the relationship between knowledge and FEC. Subsequently, we selected from the total of 120 articles only those (55) considered relevant for the purpose of the study and the basic idea deduced from the research flowchart (Figure 1).
• In the second (S2: August-September 2022) pre-testing phase, the authors consulted online only 4 experts out of the sample of 24 experts on the types of digital technologies that would be most relevant in relation to reducing FEC, as well as on the annual procurement costs for each type of DT. The main criterion for the selection of the items was their importance at the time of the study and for the perspective of the next 2 decades as potential influence on the reduction of the FEC and support of SDGs;
• In the third stage (S3: September - October 2022) the authors acquired the most relevant statistical data, from various sources; these data were normalised according to (OECD, European Union, and Joint Research Centre - European Commission, 2008; El Gibari et al., 2019); this stage led to the synthetic data in Supplementary Appendix A; based on these primary statistical data, intermediate statistical data in Supplementary Appendix B were calculated/synthesised;
• In the fourth stage (S4: October-November 2022) the authors designed the final structure of the questionnaire from Supplementary Appendix C and administered online this “evaluation worksheet” on the opinion of 24 experts (50% from the South of Romania and 50% from the North of Romania) on the weight of each type of DT and associated costs according to the purchasing power in Romania (equivalent PPS - Purchasing Power Standard for EU). Based on international literature, statistical data (Supplementary Appendices A, B) and 24 experts’ opinions and data from Supplementary Appendix C, we have determined the relative importance of some DTs and the associated costs for each type at the level of purchasing power in Romania. Subsequently, 8 DTs and 4 types of knowledge considered to be the most relevant (theoretically and pragmatically) for the energy consumption behavior of the population were selected;
• In the fifth stage (S5: December 2022 to the present) the authors identified other relevant sources in the international literature on the proposed topic, determined two composite indices (DEDT and PCK) and analysed/applied in depth the predicted relationship between the evolution of FEC, GDP/SDGs objectives and the two indices in the 5 countries analysed as well as compared to the EU27 average. In this last stage of documenting and drafting the study, we have used some more up-to-date bibliographical references, as can be seen in the Table 1.
Figure 1. The logic flowchart of the study. Source: elaborated by the authors.
Table 1. Additional studies on the relationship between education, technologies and energy consumption in modern society.
As can be deduced from the literature on the subject, there are some similarities, but also important differences, between the patterns of energy consumption behavior for the main countries of the world (Asghar, 2008; Fatai et al., 2004; Hafner and Luciani, 2022; Yu Z et al., 2017). Therefore, we assume that there are similarities and differences regarding the same behavior in the 5 selected countries (one versus the other) as well as compared to the EU27 average. Thus:
H1. The relationship between FEC and GDP per capita is expected to emerge slightly differently across countries and compared to the EU-27 average for the period 2010–2020.
To our knowledge, there are no similar studies that capture the beneficial relationship (in the sense that it is beneficial for public energy policies and the implementation of the SDGs) between increasing the DT endowment of a country’s population while simultaneously reducing FEC, increasing GDP and achieving SDG-derived targets. The DEDT composite index, through the estimation method proposed by the authors, plays literally the role of a variable that correlates with the annual increase in GDP per capita, the transition to the “green economy” and the annual reduction in FEC per capita (even if there is no direct causal relationship between the three variables). Therefore:
H2. There is a beneficial/positive association relationship between the annual increase in DEDT and the annual reduction in FEC at EU-27 level as well as for the countries studied.
Educating the population to reduce FEC and move towards the green economy, achieving targets under the SDGs remains a major guideline by which the EU can implement RePower EU and at the same time maintain its commitments under the SDGs. Therefore, a third hypothesis of the study can be formulated:
H3. There is a beneficial/positive association relationship between the annual increase in PCK and the annual reduction in FEC at EU-27 level as well as for the 5 countries studied.
In Figure 1 we present the flowchart of the study, which shows the basic idea of the study, the steps followed, the argumentation and the results obtained.
Our proposed study would supplement the existing literature on this topic (through the original method of calculating the two indices and the identified relationship with FEC, GDP, etc.), while providing a clear source of inspiration for governmental experts in energy policy, companies, citizens, etc.
In order to test the research hypotheses (research questions), we assess the competitive position and energy situation of the 5 countries compared to the EU-27 for the period studied (Section 4.1). We then determine the two indexes DEDT and PCK and construct linear regressions model to capture the relationship between the evolution of the two indexes and the evolution of the FEC per capita (Section 4.2 of study). Based on intermediary calculations, we determined the average annual rate of increase/decrease for each variable considered, and then, in order to refine/finetune the results obtained, we resorted to applying the main types of statistical tests on the relationship identified between DEDT/PCK and FEC in each country studied, as well as for the EU average (Section 4.3). In Section 5 of the study we present the most important results that we have obtained, the status of the confirmation of the hypotheses and suggest some discussions arising from the study. In the conclusion part of the study (Section 6) we show implications and potential beneficiaries, limitations and future research directions. To achieve the proposed research goal, we used various software applications (SPSS, Excel, etc.) and performed evaluations/calculations to empirically identify the correlation and/or association between the pattern of energy consumption and the evolution of the two proposed composite indexes (DEDT and PCK).
The five countries studied by us show some similarities and small differences, simultaneously, with respect to their socio-economic development up to 1989, then for the period 1990–2004/2007, and after their accession to the EU.
For this purpose, we mention selectively some known socio-economic characteristics of the 5 countries analyzed:
- Have similar socio-economic characteristics until 1990 but also after EU accession;
- Have close/comparable GDP per capita values (but significantly below the EU average);
- Have different degrees of dependence on energy resources such as oil and natural gas (Romania has fossil fuel reserves; Poland has coal reserves, Slovakia is dependent on nuclear energy; Hungary and the Czech Republic are dependent on oil and gas imports from Russia);
- Comparable energy consumption (FEC) across the 5 countries and versus EU average;
- The five countries have similar degrees of digitization and position compared to the EU average.
Existing statistical data (Supplementary Table S1) show an upward, positive trend for each of the five selected countries, as well as for the EU 27 (both GDP per capita and total GDP show a positive trend over the whole period 2010–2020; population in selected countries and in the EU 27 shows a slight decrease over the same period). Comparing the five countries against each other, the Czech Republic and Slovakia have a slightly higher GDP per capita (from around 13,000 to around 16,000 euro), while the other three countries have a lower GDP per capita (below 9000 euro). All five countries are in the group that joined the EU in 2004/2007 and rank below the EU-27 average on most indicators showing the standard of living. As we will see later, the result of our study partly correlates with conclusions derived from other studies (Yu et al., 2019; Yu Z et al., 2017) on the relationship between FEC, GDP and some macroeconomic indicators.
The analysis of statistical data for selected entities on the evolution of the FEC over the period 2010–2020 is presented in Supplementary Table S2 (assessment is also made against the existing situation at EU27 level). Similar studies (Vlăducu, 2020) argue that, compared to developed EU countries, Romania has a major potential to reduce the FEC (due to its energy-intensive industrial structure inherited in the 1990s, type of buildings, transport infrastructure, etc.). In contrast, the situation in the other four selected countries is slightly different from that in Romania and the EU27 average. Studies on the subject (Bianco et al., 2009; Fatai et al., 2004; Soava et al., 2018; Vlăducu, 2020) show that the relationship between GDP and FEC is fairly well defined by the Kuznets-type relationship as a theoretical regression model. As shown in Supplementary Table S2, within EU27 energy consumption per capita decreased significantly in 2020 compared to 2010 (from 2.2 toe to 1.98 toe); only the Czech Republic and Slovakia record the same trend of decreasing FEC, while Romania, Hungary and Poland show a slight increase in energy consumption. The data in Supplementary Tables S6, S7 show two of the main factors influencing the energy consumption pattern (renewable share in FEC and GDP per unit of energy used). Climatic conditions, certain aspects of a nation’s culture, the degree of education/higher education of the population, the industrial structure, the degree of dependence on imports for certain energy resources, etc. directly and indirectly influence the pattern of energy consumption and, consequently, the relationship between FEC and the various variables that can be taken into account.
In our study, we take into account various studies (Adams et al., 2014; Andrieu et al., 2022; Hafner and Luciani, 2022; Park et al., 2022; Soava et al., 2018) showing the relationship between innovation/DT and FEC, but we propose our own method to determine DEDT and PCK and then show the implications of DT for FEC reduction, GDP growth and the achievement of some SDGs targets for selected countries.
The study of (Fatai et al., 2004) shows that there are different relationships between the FEC and GDP for developed countries such as New Zealand or Australia (countries where the state is directly involved in steering the energy market and implementing the Kyoto Protocol on pollution reduction; we are talking about the “visible hand” of the state in this market) compared to countries such as Indonesia, the Philippines or Thailand (countries where lower population incomes force governments to implement different policies). Also in the same vein, the (Al-Hinti et al., 2009) concludes that there are different patterns in the relationship between FEC and GDP for 10 Middle Eastern countries (countries such as UAE, Saudi Arabia and Kuwait which are major oil exporters) compared to Egypt, Syria, Jordan, Tunisia, etc. (which have modest oil reserves). In addition, the cost of various energy sources to the FEC differs greatly across-countries, which is why any major crisis in this area changes the pattern of the relationship between the two variables - in the context of the two major crises of the 1970s and 1980s, the FEC fell sharply as a result of excessive price increases (Fatai et al., 2004; Yu et al., 2019).
We are considering factors/variables that would support EU policy to reduce FEC and that simultaneously fit into the EU policy on the transition to the “green economy” and pollution reduction as per the SDGs (Rathi and Lombrana, 2022). Our study identifies DTs and knowledge to exploit them as two main factors for optimizing energy consumption in the EU. To operationalize the two factors at the level of applied EU policies and/or governments, we propose the determination of two composite indexes as follows:
• DEDT (Degree of Endowment with Disruptive Technology): variable showing the degree/level of endowment with digital technologies and other DTs relative to the whole population in selected countries (as a percentage of total population, for each year from 2010 to 2020)
• PCK (Per Capita Knowledge): variable showing the level of general knowledge used by employees in firms together with the population (education and/or self-education of the population) to reduce FEC and awareness of the need for SDGs (assessed as a percentage of total population only for 3 items in Supplementary Table 2 and only for the period 2013–2020).
In Table 2 we present a number of 8 DTs that are included in the proposed theoretical model as direct/indirect influencing factors for FEC reduction (see details in Supplementary Table S1). We used a group of experts in the field of digital technologies (12 experts) and energy equipment (another 12 experts) from the Northern and Southern regions of Romania. Their consultation took place in October - November 2022 based on a questionnaire designed by the authors, which was in turn based on studies/articles from international literature and various sources of statistical data. On the basis of the data in Supplementary Appendix A (sample primary statistical data for Romania and EU 27, together with the same statistical data for Hungary, Poland, Czechia and Slovakia), together with the existing studies on this topic, the questionnaire in Supplementary Appendix C (structure of both tables) was constructed/administered to the experts. In Supplementary Table S1 presents the 8 items in detail and at the end of the annex the source of statistical data and international literature is selectively presented (e.g., statistical data under IGI, World Bank, UNCTAD, ILO, UIS, IEA, etc.). For some items such as ICT access, ICT use, mobile phones, etc. it was possible to assess the degree of endowment with such technologies quite accurately. On the other hand, for items such as household robots (only smart robots that have just been introduced into consumption), LED light bulbs or batteries for EVs, it was quite difficult to assess the degree of endowment of the population. Some studies on the expanding use of robots (Feaster, 2018; Huang et al., 2022; Park et al., 2022) in various firms argue quite well that robots provide higher productivity and reduced energy consumption. By analogy with the impact of robots at the firm level, it can be presumed that various types of “smart robots” have a similar effect at the householder level; new AI (Artificial Intelligence) - based programming techniques (Feaster, 2018; Ford, 2016; Zeng et al., 2018) are leading to an unprecedented rise of robots in all developed countries. In the case of item 5, Supplementary Table S1, i.e., LED bulbs, which have been introduced into consumption since 2009, it was necessary to use several sources of documentation to obtain a sufficiently accurate assessment of the degree of endowment (examples (Baumgartner et al., 2012; MIa, 2022; Un SDG, 2015a; Un SDGs, 2015b; Valentová et al., 2012; Weinold, M., 2020; Weisbuch, 2020; Zissis et al., 2021)). In the case of item 6 in the same table, i.e., EV batteries, we have considered only electric vehicles (EVs) and the fact that in the EU out of about 240 million registered cars, less than 1% are EVs. However, this disruptive technology has been selected in our study as it has a very high potential for growth in consumption in the coming period (Andrieu et al., 2022; Schuelke-Leech, 2021; Tamaki et al., 2017).
Table 2. DT with implications for the reduction of FEC in the five selected countries and at EU level; shares in consumption and prices, according to experts panel (Romania, 2022).
At the end of Supplementary Appendix A, for both tables, we have referenced the main sources of statistical data/information as well as ways of calculating the indicators/technologies and/or knowledge that have been retained by the authors. All items in Supplementary Appendix A have been normalised according to (OECD, European Union, and Joint Research Centre - European Commission, 2008), except for the Skills item which remains in the table structure but has not been included in the PCK calculation. Based on the data in Supplementary Appendix C, we present in Table 1 a synthetic name/version of the variables considered for the DEDT, their abbreviation and the resulting values as averages for each item.
On the basis of the data in Table 2, text, we proceeded to determine the composite index called DEDT from the following relation (Equation 1):
where:
AWA = Arithmetic weighted average
x1, x2, … xk - indicators that make up a variable under consideration;
p1, p2, … pk-the weight of each indicator in the total value of the variable.
In order to give a clear picture of the absolute novelty elements brought by our study, some mentions are necessary regarding the evaluation method applied by the authors. The determination of the DEDT composite index required two analysis/calculation steps. In a first calculation step, based on relation (1), we determined the standard value of the DEDT of 91.88 euro at the time of September 2022 in relation to the purchasing power in Romania at that time (compared to the other four selected countries and vs. EU-27). Starting from this standard DEDT value of 91.88 euro (equivalent for 100% degree of endowment with all 8 items at national level, based on experts’ opinions), we took into account the official Purchasing Power Standard (PPS) index at EU level and calculated the standard DEDT value for the other four countries and the EU27 average (standard value, theoretically, as a function of PPS in euro: EU27: 124.95; Hungary: 93.71; Poland: 95.55; Czechia: 116.68; Slovakia: 90.04).
In the second step of the analysis, also based on relation (1), taking into account the actual share of each item or type of technology in the population’s endowment (summary presented in Supplementary Tables S1A, B, keeping the name of each item given in full in Supplementary Table S1, and taking into account the complete statistical data for the period 2010–2020; data of the Supplementary Table S3 highlight the beginning and the end of the period only), we calculated the value of the DEDT composite index for each year of the period and for each country vs. the EU27 average. For reasons related to the need to concentrate the information in the content of such studies, in Supplementary Table S3 we present the population endowment percentages for each of the 8 items at the beginning of the period (2010) and at the end of the period (2020) for each entity.
With regard to the first 3 DT items (full name and abbreviation used can be found in Supplementary Tables 1A, B), international statistical data show a slight upward trend for the whole period 2010–2020 for each entity (e.g., for EU27: “access to IT&C” (ICTa) increased by about 2% per year for each entity, i.e., from about 70% in 2010 to about 80% in 2020; the percentage of “internet users” (ICTu) increased from about 40% in 2010 to about 76% in 2020, i.e., an average annual increase of about 10%; only for the item “mobile phones” (mT) the degree of ownership remained relatively constant, i.e. 1.2 per inhabitant; the evolution for the 3 items does not differ significantly from the EU27 for the 5 countries studied). Concerning „household robots” (item 4, hR) and “batteries for EVs” (item 6, BEV) it is sufficient to mention that these technologies have just been introduced in consumption and the degree of population endowment remained below 1% throughout the period studied, below the level of the residual factor. Only in the case of item 5, “LED light bulbs” (LED), is there an almost exponential evolution of the population’s endowment over the whole period (in the case of EU27: the percentage of endowment increased from 8% in 2010 to 72% in 2020, which means an average annual increase of almost 50%; approximately, the average annual increase was similar in each of the 5 countries, although the starting point in 2010 was around 4%–5% for each entity). With regard to items 7 and 8, i.e., “satellite telecommunications” (sT) and “sensors” (Se), the level of per capita endowment was estimated at around 60% and 80% of mobile phone ownership respectively, with a stable trend over the period 2010–2020 for each entity studied.
Taking into account the above, the values determined for the DEDT composite index are given in full in Table 3, text, as following.
Table 3. DEDT composite index values, for the period 2010–2020, in euro-PPS per capita (by share in consumption/endowment, according to Table 2, from text).
For the purpose of our study, the values of the DEDT composite index for the beginning and the end of the period are enough to be pointed (Romania: 51.45 in 2010 and 61.65 in 2020; Hungary: 55.1 in 2010 and 59.6 in 2020; Poland: 56.1 in 2010 and 70.1 in 2020; Czechia: 69.4 in 2010 and 81.7 in 2020; Slovakia 48.44 in 2010 and 67.26 in 2020; EU27 average: 74.4 in 2010 and 92.1 in 2020).
In Table 5, within text, we present four types of general knowledge (given by the existing education in the five countries) that are directly associated with the exploitation of DT to reduce FEC voluntarily by the population. Also, in relation to the selection and inclusion of the four items in the study, we have drawn on several sources of documentation (as per the endnote in Supplementary Appendix A) and the opinions of the 24 experts. It should be noted that item 4, i.e., skills in Table 5, is calculated at international level as a score, which means a relative position of one country to another, which is why it was not taken into account in the PCK estimation (for the assessment of this item see points 4 of the endnotes in Supplementary Appendix A).
Starting from the standard value of the PCK (equivalent for 100%, based on expert opinion), according to the PPS at EU level, the standard values for the 4 countries and the EU27 average were calculated (standard index according to PPS in euro: EU27: 767.31; Hungary: 575.48; Poland: 586.76; Czech Republic: 716.5; Slovakia: 552.91). In the second step of the analysis, similarly to the way we proceeded for the determination of the DEDT, also for reasons of information concentration, the summary data in Supplementary Table S4 are presented only for the beginning of the period (2013) and the end of the period (2020). The evolution of the three indicators over the period 2013/2014-2020 (as long as international statistical data are available) shows that at EU27 level there has been a moderate increase for knowledge intensive employment (Kie) and research talent (Rt), while the item firms offering training (Fot) has remained relatively stable. The same trend was observed for each of the 5 countries studied for both Kie and Rt (for Fot, Slovakia and the Czech Republic slightly exceed the EU average, while the other 3 countries remain at around 70% of the EU average).
Taking into account the above, we calculated the PCK composite index values, shown in full in Table 5, text, as following.
The values of the composite PCK index, in 2013, for the EU27 is 126.7 euro PPS per capita; and in 2020, the same index is 147.8 euro PPS per capita; for the period 2014–2019 there is a fluctuation in the value of the index. The corresponding values of the composite index remain significantly below the EU27 average for Romania, Hungary and Slovakia, while for the Czech Republic the same values are about 15% above the EU27 average. The cumulative interpretation of the data in Tables 3, 5, both from text (resulting values for DEDT and PCK, using the empirical method proposed by the authors) leads to the conclusion that there is a strong conditionality between the knowledge and/or education of a country’s population, the evolution over time of the stock of disruptive technologies, the energy consumption pattern of the population and the country’s orientation towards the green economy.
On the basis of the data in Table 3 above, together with Supplementary Table S2, we proceeded to construct a second-order polynomial regression model in order to empirically identify the relationship between the evolution of the DEDT and the evolution of the FEC per capita for the period 2010–2020. In Figure 2 we provide a first perspective of analysis on the relationship and then formulate some preliminary conclusions.
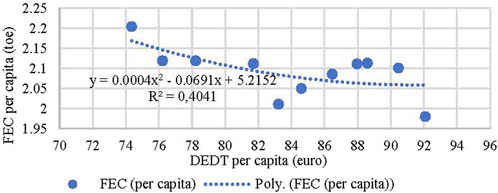
Figure 2. Relationship between FEC and DEDT per capita: EU 27 (2010–2020). Source: Authors’ design.
As can be deduced from Figure 2, at EU27 level the general trend that can be inferred is that as the amount of DEDT per capita increases (e.g., from 74 euro to 92 euro per capita DEDT value, the FEC decreases from 2.2 toe to about 1.9 toe per capita) there is a reverse, decreasing trend for the FEC. With reference to the selected countries, it can be concluded that the Czech Republic, Romania and Slovakia follow a trend relatively comparable to the EU27 average, while Poland and Hungary deviate from the EU27 trend. This statement/mention is supported by the data presented in Figure 3 below (in which we show a country that is close to the EU27 trend, i.e., Romania, and a country that is moving away from the same trend, i.e., Poland).
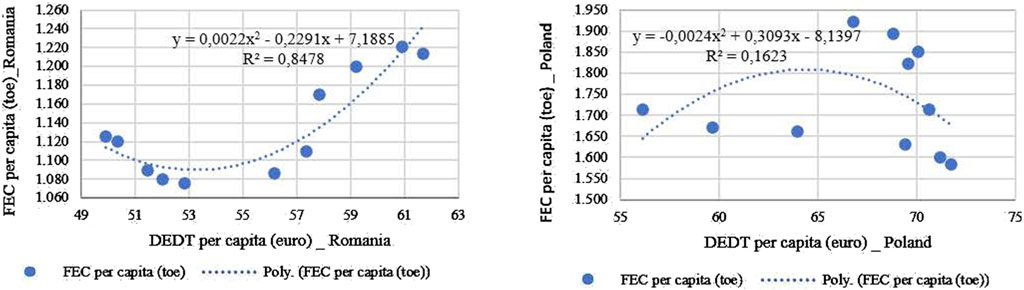
Figure 3. Relationship between FEC and DEDT per capita Romania and Poland: EU 27 (2010–2020). Source: Authors’ design.
Based on what we have presented in Figures 2, 3, and taking into account the data in Supplementary Appendices A, B, it is quite clear that there is a beneficial relationship for a number of “n” years (one or more decades) between the increased usage of disruptive technologies in a country and the gradual reduction of the FEC in the same country, along with other obvious benefits such as improvement of the business environment, achievement of targets under the SDGs, etc. This is even though the relationship we have highlighted between FEC and DEDT per capita manifests itself slightly differently from one case to another and even in cases where a strictly statistical/direct correlation between variables cannot be evidenced (in Section 4 of the study, Table 6, we provide further arguments to support this claim). Simply stated, depending on the depth of the analysis of the relationship between the two variables (FEC and DEDT), different conclusions can be drawn regarding the influence between the variables, but these conclusions converge towards the idea of an inverse relationship over time (increasing DEDT is associated with decreasing FEC).
These preliminary results are supported by the conclusions derived from other studies on the importance of digital technologies, in particular IoT and various AI techniques, for GDP growth, meeting some SDGs targets, expanding the use of renewable energy (Supplementary Table S6), energy consumption behavior, use of GDP per unit of energy (Supplementary Table S7), etc. (Adrian-Nicolae and Stancu, 2021; Albastroiu, 2021; Borozan and Pekanov Starcevic, 2018; Dincă et al., 2022; Hafner and Luciani, 2022; Pop et al., 2022; Tantau et al., 2019; Vlăducu, 2020; Zeng et al., 2018).
Based on the data in Table 5 above (text), together with Supplementary Table S2, we proceeded to construct a second-order polynomial regression model to empirically identify the relationship between the evolution of PCK and the evolution of FEC per capita for the period 2013–2020. In the case of this composite index, it is necessary to mention in advance that it is somewhat less representative to argue the basic idea of our study (it is composed of only 3 items, the skills variable has not been taken into account, and the analysis period is only 7 years). However, as shown in Figure 4, it is found that there is a beneficial correlation (in the sense that it is beneficial for public energy policies and the implementation of the SDGs) between the gradual increase in the level of knowledge obtained through education/self-education of the population and the target of reducing the FEC. This conclusion of our study is consistent with what various studies on this topic argue, in the sense of the existence of an association between knowledge and energy consumption behavior of the population (Borozan and Pekanov Starcevic, 2018; Hafner and Luciani, 2022; Pop et al., 2022; Tantau et al., 2019).
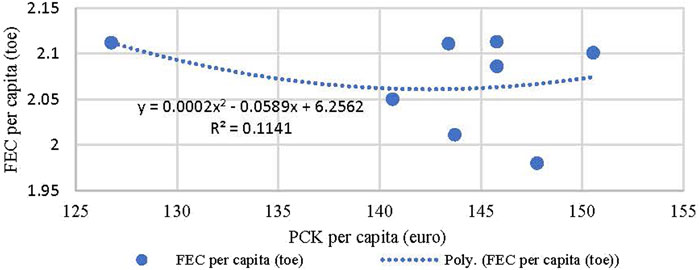
Figure 4. Relationship between FEC and PCK per capita: EU 27 (2013–2020).
As can be seen from Figure 4, even in the case of PCK we find an inverse relationship with the evolution of FEC per capita (which is, however, somewhat more moderate than the previous variable) in the case of the EU 27 (at a value of around 128 euro PCK per capita corresponds to FEC per capita of around 2.2 toe, whereas at a value of 145 euro PCK per capita there is a little more than 2 toe FEC value). Thus, we highlight/emphasize the idea that for both composite indices proposed to be empirically determined by us (PCK and DEDT) we identify for the EU 27 approximately the same type of association/relationship between the evolution over time of each index compared to the evolution of the FEC per capita (if at least 1 decade is analysed). This similarity in the manifestation over time between the two indices and the FEC for the EU 27 is explained by several specific features that are found in the functioning of the whole “trading bloc” for the last 2 decades (industrial and consumption traditions, relatively unified energy policies at EU level, quality education for the 440 million inhabitants, generalisation of positive practices from one EU Member State to another EU Member State, etc.). When translating the analysis of the association relationship between the same two variables to only one of the 5 countries considered in our study, the strictly statistical/direct manifestation between PCK and/or DEDT versus FEC may be slightly different. With reference to the five countries and the PCK index, the situation resulting from this method of analysis is partly comparable with those shown for the relationship between DEDT and FEC (Romania, Poland and Slovakia are close to the EU27 trend, while the Czech Republic and Hungary show a slightly different pattern). In Figure 5, which follows, we present as an example, the relationship between the evolution of PCK and the evolution of FEC for Slovakia (convergence to the EU27 trend) and the Czech Republic (departure from the EU27 trend).
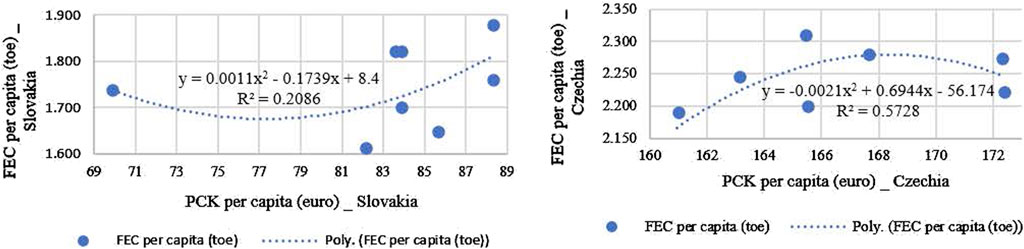
Figure 5. Relationship between FEC and PCK per capita Slovakia and Czech Republic (2013–2020). Source: Authors’ design.
In the next section, we further investigate the relationship between the evolution of the FEC and the two proposed indexes, DEDT and PCK, in order to identify other arguments in support of the basic idea of the proposed study (through the analysis of the average annual rates and regression analysis).
Referring to the 3 hypotheses formulated at the beginning of the study, we note that hypothesis H1 is partially verified (the conclusion that there are more differences than similarities between the energy consumption pattern in selected countries and the EU27 average), but Hypothese H2 and Hypothese H3 are fully confirmed with reference to the situation of the two composite indices estimated by us. In the case of hypothesis H1, it is somewhat surprising that only three countries (Romania, Poland and Hungary) show a relatively close (but not identical) pattern of FEC consumption when comparing the three countries with each other. In contrast, the trend for Romania, Poland and Hungary for FEC is in the opposite direction to the EU27 trend. This preliminary observation on the energy situation in the three countries is supported by several historical explanations (development of energy-intensive industries in some Eastern European countries, particularly Romania; inefficient and fluctuating energy policies applied by governments, i.e., a less efficient “visible hand” of the state; somewhat lower GDP per capita). Another quite important factor influencing the pattern of energy consumption in selected countries is how the share of renewables in total CEE (Central and Eastern European) countries and energy consumption per unit of GDP per year has evolved (summary in Supplementary Tables S6, S7).
With reference to the Czech Republic and Slovakia, it can be seen that the FEC consumption pattern for the period analyzed is relatively close when comparing one country with the other (but not identical); the same FEC pattern for the two countries follows the direction/trend seen at EU27 level (background explanation for the two countries: more efficient energy policies applied by governments, higher GDP per capita, more modern industrial structure in the 1990s, etc.). Including with reference to these countries, the statistics in Supplementary Tables S6, S7, show that there were significantly different realities regarding the share of renewable resources and energy consumption per unit of GDP in 2013–2020 compared to the present. It goes without saying that in EU Member States where the share of renewable energy in the FEC is above the EU average, those countries will experience a different pattern in the relationship between digital technologies, energy consumption and the green economy (a large share of renewable energy generation equipment incorporates a high degree of digital/disruptive technologies). Various existing studies on this topic (Christensen, 1997; Dragomir et al., 2022; Moita and Monte, 2022) highlight the importance of renewable resource policies in Europe and/or the relationship between renewable resources and sustainable development, use of disruptive technology, etc.
Existing studies in the international literature approach the relationship between digital technologies - FEC reduction - economic growth in some countries, but from different analytical perspectives. In a study on the sustainable development of in four South Asian countries, period 2011–2022 (Sadiq and Ali 2024) concludes that digital technologies are essential for meeting some targets under the SDGs and orienting countries towards renewable energy. In another study (Xu et al., 2023), a mechanism to calculate 2 indices (GTI- Green Technology Innovation; ERI - Environmental Regulation Index) is proposed based on which the relationship between “green technology,” renewable energy and other variables that should be considered by the G20 group of countries to achieve the “net-zero emission goal” is analyzed. Other authors (Ali et al., 2022; Rauf et al., 2023) argue quite well the idea that green technology/innovation affects not only energy consumption efficiency, CO2 emissions, but also economic growth and the achievement of some of the targets in the SDGs for the BRICS countries. To the best of our knowledge, our proposed study differs significantly from other existing studies on the complex relationship that can be glimpsed between knowledge and technology vs. change in energy consumption behavior simultaneously with GDP growth and green economy orientation in the 5 countries analyzed.
These partial findings of our study are supported by different assessments of the variables considered (correlation analysis, regression analysis, etc.), as follows. Next, we proceeded to compare the average annual growth/decline rates for the four indicators included in the analysis, starting from the relationships:
a) for determining the average rate of change, the relation (Equation 2):
where:
- I is the evolution index for n years (increase/decrease);
- X1, Xn, variables considered
b) for determining the average rate of evolution, the relation (Equation 3):
where:
- I is the average rate of change (increase/decrease).
Based on the relationships (1)-(3) and based on Tables 2–5, we performed Supplementry Table S5 data (Supplementary Appendix B). Based on the data in Supplementry Table S5, in Figure 6 we present a clear summary of the evolution of the two proposed composite indexes, DEDT and PCK, as well as the evolution of GDP and FEC per capita over the period studied.
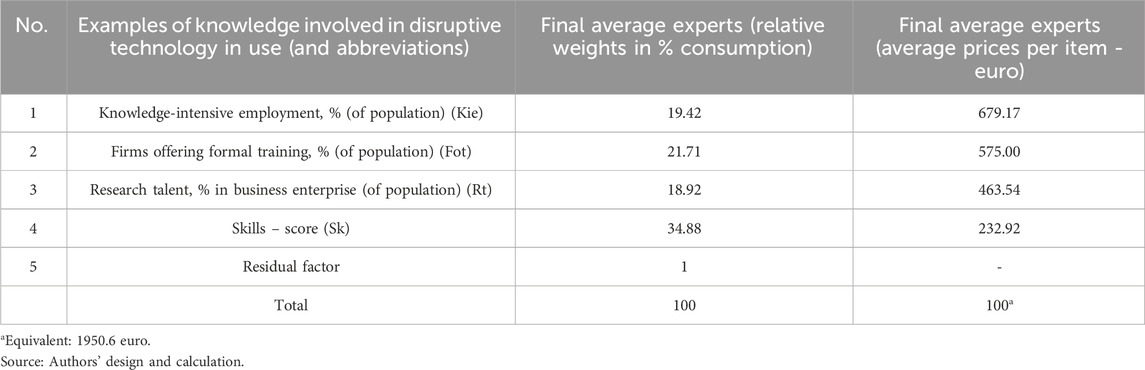
Table 4. Knowledge to reduce FEC in the five countries analysed and at EU level; shares in consumption and prices, according to experts panel (Romania, 2022).
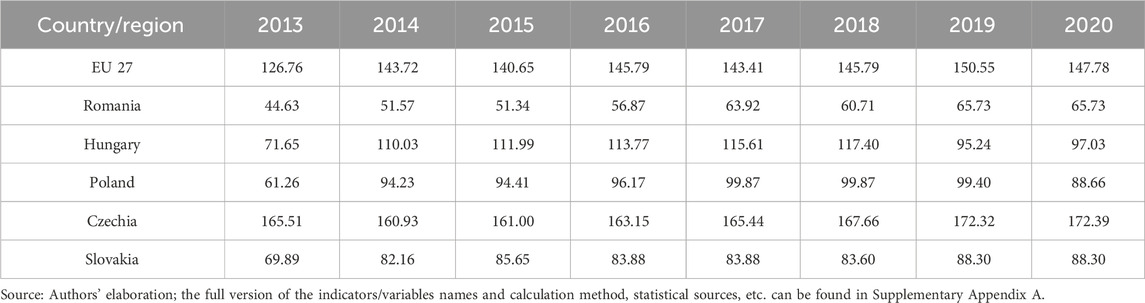
Table 5. PCK composite index values, for the period 2013–2020, in euro-PPS per capita (by share in consumption/endowment, according to Table 4).
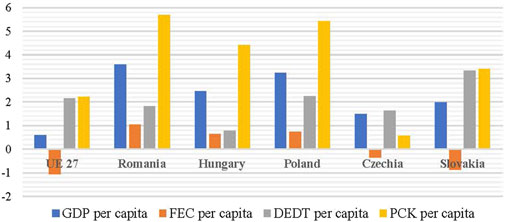
Figure 6. Average annual rate of increase/decrease per capita of GDP, FEC and DEDT_2010–2020, PCK_2013–2020. Source: authors’ calculations based on data in Table 5 (Supplementary Appendix B).
The summary in Figure 6 shows that, at EU27 level, there is an inverse correlation/association between the evolution of the FEC compared to the evolution of the other three variables (GDP per capita, DEDT per capita and PCK per capita). More precisely, it results that for the EU as a whole, an increase of about 2.2% in DEDT and PCK per capita results in a reduction of almost −1% (the Pareto principle is checked, as a potential influence between two variables, one of which is the main variable, changes by 80% and the other by 20%). The same summary shows that the energy consumption pattern for the Czech Republic and Slovakia follows the same direction/trend as the situation found at EU27 level. In contrast, for Romania, Poland and Hungary, the situation with respect to FEC appears to be significantly different for each country compared to the average trend at EU level (FEC per capita increases slightly, i.e., by about 0.5%, while each of the other three variables, GDP, DEDT, and PCK calculated per capita, increases somewhat more).
In order to identify further explanations for the pattern of energy consumption in the five selected countries vs. the EU27 average, we further proceeded to perform a regression analysis for each entity, but taking into account the evolution of DEDT as the independent (main) variable. The results obtained are summarized in Table 6, text, based on the following relationship (Equation 4):
where:
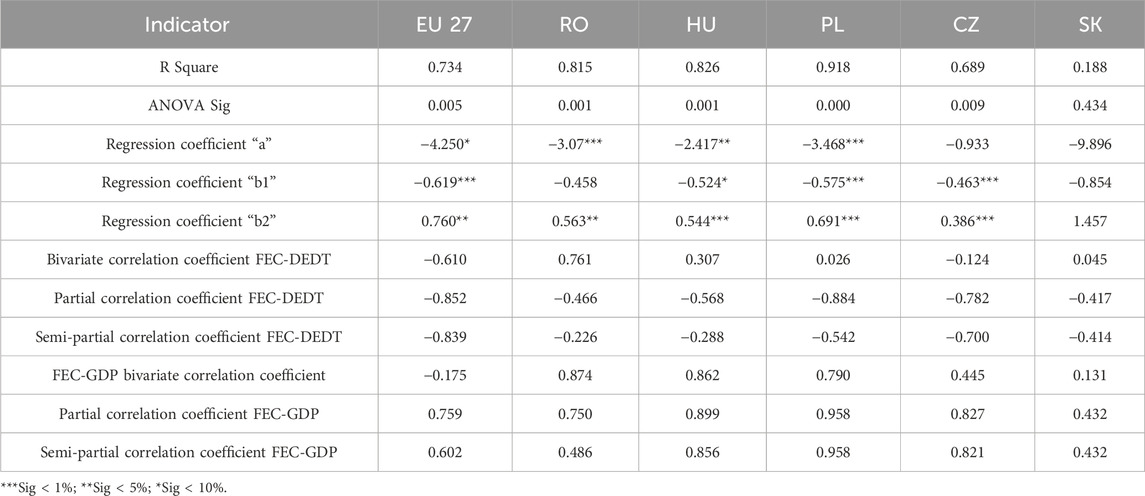
Table 6. Regression analysis for FEC and DEDT at country level vs. EU 27.
a - the free term of the relationship;
b1 - regression coefficient for DEDT;
b2 - regression coefficient for GDP.
From the regression analysis in Table 6, text, on the correlation/association between DEDT and other variables considered for the five countries and EU27, a negative regression coefficient b1 is obtained at the level of each country/region, indicating an inverse relationship between the dependent variable FEC and the independent variable DEDT, when the influence of the independent variable GDP is cancelled. For Hungary, Poland, the Czech Republic and the EU the values are also statistically significant (Sig values of maximum 10%). For Romania and Slovakia, the values recorded are not statistically significant, but confirm the correlation between DEDT and other variables of the study.
In Poland, a 1% increase in DEDT leads to a 0.575% reduction in FEC, when the influence of the independent variable GDP is cancelled out. Looking at the Romanian case, the link between FEC and DEDT is strong and positive (bivariate correlation coefficient FEC-DEDT = 0.761). If we cancel the influence of GDP on DEDT, the link between FEC and DEDT becomes negative (semipartial correlation coefficient FEC-DEDT = −0.226), of weak intensity. Also, for Romania, when we cancel the influence of GDP on both DEDT and FEC, the link between FEC and DEDT remains negative and increases in intensity (partial correlation coefficient FEC-DEDT = −0.466).
The data presented in Table 6, text, on the regression analysis between FEC and DEDT, as well as the various possible interpretations/connections referred to above, hold as a possible influence/correlation also when performing the regression analysis between FEC and PCK.
In order to find new explanations for the pattern of energy consumption in the five selected countries vs. the EU27 average, we perform a similar regression analysis for each entity, based on PCK as the independent (main) variable. The results are summarized in Table 7, text, based on the following relationship (Equation 5):
where:

Table 7. Regression analysis for FEC and PCK at country level vs. EU 27.
a - the free term of the relationship;
b1 - regression coefficient for PCK;
b2 - regression coefficient for GDP;
Again, it is useful to note that in the case of the PCK index our empirical analysis is based on only 3 indicators that can be identified at the international level and only for the period 2013–2020. The conclusions provided by the descriptive statistics for FCK vs. FEC evolution remain quite similar to those described by us on the relationship between DEDT and FEC evolution.
The regression coefficient b1 is negative for most countries/regions, indicating an inverse relationship between the dependent variable FEC and the independent variable PCK, when the influence of the independent variable GDP is cancelled out. Only for Slovakia and the EU27 the values are statistically significant at Sig values of 5% maximum. For the other four countries included in the study, even if the relationship between the two variables is not based on statistically significant values, the inverse relationship between variables is confirmed for each entity (an increase in PCK is associated with a reduction in FEC at annual level). At EU27 level, a 1% increase in PCK leads to a 0.546% reduction in FEC, when the influence of the independent variable GDP is cancelled out.
Looking at the bivariate/partial/semi-partial correlation coefficients for the EU27 we can see that:
- The link between FEC-PCK is negative but weak (bivariate correlation coefficient FEC-PCK = −0.271);
- If we cancel the influence of GDP on PCK, the link between FEC and PCK increases in strength (Semi-partial correlation coefficient FEC-PCK = −0.783), but remains weak;
- If we cancel the influence of GDP on both PCK and FEC, the relationship between FEC and PCK remains negative and increases in strength (Partial correlation coefficient FEC-PCK = −0.840).
Based on our data on the regression analysis between PCK and FEC evolution for the 5 countries and the EU 27, it follows that any expansion/increase in the stock of knowledge available to the population is highly beneficial associated with the assumption/need to change the energy consumption pattern of the same entity. In addition, any augmentation/amplification of the general knowledge (education level of the population) implicitly constitutes a general framework to improve the knowledge needed to exploit various disruptive technologies, which have become essential for GDP growth, meeting targets under the SDGs, etc.
Therefore, the reasoning in the structure of the proposed study, as well as the various perspectives of strictly statistical analysis between the two composite indices (DEDT and PCK) show us clearly enough that there is an inverse association/influence relationship between the annual increase of each indicator and the reduction of the FEC. This idea and/or conclusion confirms once again Hypothese H2 and Hypothese H3 (in connection with those mentioned above for the hypotheses). The partial confirmation of H1 and full confirmation of H2 and H3 at the same time provide the necessary arguments for the purpose of the study. However, hypothesis H1 also has a confirmation under historical account (Rhodes, 2018; Smil, 2017) in the sense that for more than a century the “visible hand” of the state has increasingly manifested itself in the management of energy markets in major countries of the world. As mentioned above, various other studies on energy policies at EU level or in other regions/countries of the world (Bhattacharyya, 2011; Rhodes, 2018) directly/indirectly highlight the role of the state (the visible hand of the state) in optimising energy production, distribution and consumption in modern society. The work on this topic (Bhattacharyya, 2011, pp. 285–292; Nersesian, 2016) shows that the state needs to be involved in the management of energy markets, as in most cases such markets are dominated by monopolies or semi-monopolies. Hypothesis H1 is further confirmed by the realities in Europe (and other regions of the world) in 2022–2023 in the context of the energy crisis, the changing architecture of political/military relations between the world’s major countries, etc. Both at US and EU-27 level various political leaders have severely criticised “the visible hand of the managers” in the major corporations operating in the international energy market (EP, 2023; Rushe and Aratani, 2022; Timmins, 2022). In the case of the US, even before 1975, the state set up the so-called SPR (“strategic petroleum reserve”) to intervene, as appropriate, in the energy market (Rushe and Aratani, 2022). Globally, oil company profits are estimated to have been around $4 trillion in 2022, up from 1.4 trillion USD the previous year. This clearly shows that “the visible hand of the managers” can manifest itself completely unethically in any energy market and exploit in the interests of small groups any context of energy crisis (EP, 2023). In the case of the EU, it is estimated that the introduction of an additional tax on non-gas electricity producers and suppliers would mean around 140 billion euro additional revenue to the public budget (Timmins, 2022). Therefore, the European Commission and/or Member State governments have various energy policy instruments at their disposal to counterbalance the non-ethical influence of managers in energy companies (there is a dispute in 2023 between “The visible hand of the state” vs. “the visible hand of the managers” on energy markets).
As a result of the proposed study, it is argued that different governmental scenarios/policies (Member States’ as well as EU level) can be constructed to simultaneously target the EU’s sustainable development goals (Un SDG, 2015; Un SDGs, 2015) and to reduce the FEC. In essence, it follows that various current investments in DEDT and PCK (investments made by governments through RNRP and other programs to finance pollution reduction, to achieve the knowledge economy, etc. alongside investments made by individuals to improve skills, use digital technologies, purchase new DTs of the type listed in Table 2, within text) have beneficial implications for GDP growth and simultaneous FEC reduction. Such implications include:
• It is possible that some of the policies already in place through the RNRP to support the population to purchase household appliances (e.g., e-vouchers for replacing energy-intensive appliances) will be complemented by more effective policies to extend access to the Internet (ITC access and ITC use).
• It is entirely possible that the policy of e-vouchers granted by governments for the purchase of an EV by individuals could be coupled with firm regulations (laws) requiring each person benefiting from this facility to periodically take back the used batteries (these then becoming „mini storage spaces” for electricity at producers, distributors, etc., as various studies suggest) (Andrieu et al., 2022; Tamaki et al., 2017).
• Both at EU 27 level and through policies promoted by Member States, a common strategy should be applied to increase the level of DT endowment and continuous education of the population (for changing energy consumption behaviour and environmental protection) in direct connection with the achievement of targets proposed by each country under the SDGs. Our study shows that the most effective course of action for countries and/or individuals is to invest in the continuous education of the population in order to raise awareness in the medium term of the direct/indirect benefits that various types of disruptive technologies can bring in reducing pollution and reducing FEC (including by gradually increasing the share of renewable energy in total FEC).
Following an in-depth assessment of the relationship that can be seen between the evolution of FEC vs. the evolution of GDP vs. the use of technologies in selected countries, it is worth highlighting the beneficial influence relationships between the three variables of the model. However, this conclusion of our study cannot and should not be generalized with reference to the situation in other EU Member States. Unlike other similar studies, in this case we have presented an original method for calculating the two composite indices (DEDT and PCK) and argued on the basis of statistical analyses that there is a somewhat paradoxical relationship between the increasing use of disruptive/digital technologies by the population, households and organizations and the decrease in the FEC in the context of the EU Member States’ shift towards the green economy.
The results of the present study need to be adapted (by decision-makers on energy policies, sustainable development, etc.) to the specificities of each EU Member State. However, at the same time, we believe that the theoretical scenario constructed on the basis of statistical data on the evolution of FEC vs. GDP vs. digital technologies for these countries remains of interest also for the macroeconomic strategies promoted by other EU Member States. This is because an annual increase, however modest (e.g., by 1%) of DEDT has known benefits in terms of increased labor productivity, GDP growth, access to knowledge by the population, SDGs objectives benefits confirmed by other studies on this subject. This 1% annual increase in DEDT should lead to a 4% reduction in FEC (but this theoretical influence remains dependent on the evolution of PCK, cultural values, consumption behavior of the population, state energy policy, etc.).
Also in this sense, when other variables are included in the various theoretical models and empirical studies on the subject (technologies used, as in our study; the tourism industry as a factor influencing GDP; endowment with natural factors, as in the case of Middle Eastern countries, etc.), the various conclusions must be interpreted with caution.
In the case of the present study, the inclusion of the “DT” (disruptive technologies) variable in the proposed theoretical model leads to conclusions that are of interest for EU policies on reducing FEC and moving to the green economy and SDGs targets, as well as for the governments of the 27 Member States. This is because the study suggests quite clearly and argumentatively directions and instruments through which macroeconomic strategies that are, by their very content, partly contradictory in the context of the year 2023 marked by a global energy crisis could be correlated/harmonized. It goes without saying, however, that some criticisms can also be made and some limitations of the present study identified.
First of all, a limitation of the study derives from the fact that the “quality” of each of the 8 selected DTs (Supplementry Table S1) and of the 4 types of knowledge needed to exploit digital technologies (Supplementry Table S2) was not included in our analysis. By the quality of each variable we mean, as the case may be, the technical quality of the various 5G networks and equipment (for example, the internet speed in Romania is one of the highest in the European countries). Secondly, another limitation of the study is the fact that some DT (smart home robots, EV batteries, etc.) have relatively recently entered the consumer market (which is why international statistical data are uneven and/or incomplete) and their disruptive nature is only now becoming apparent. Other limitations of the study, derive from the fact that the analysis does not include the share of “renewable energy” in the total FEC, does not include the skills item, etc.
Further, based on the absolute novelty elements brought by the present study, other similar studies can be designed/planned which are of major interest for energy and SDGs-related policies in all major countries of the world. It is well known that some historians argue the rise of the Western world globally by pointing to competition, innovation, education and also climate/geography as determinants of economic progress at the social group level. Our proposed study is therefore of interest to other researchers who are concerned with the scientific underpinning of energy policies in the context of political, military or commercial conflicts currently manifesting themselves internationally. For example, we believe that a study based on the same empirical calculation of DEDT and PCK for the Nordic countries (Norway, Sweden, Denmark, Finland and Iceland) and Ireland compared to the 5 countries analysed in this study should lead to conclusions of maximum interest, both theoretically and pragmatically (the 5 Nordic countries are of medium size, much higher GDP per capita, but located in completely different climatic conditions). Also for the purpose of suggesting future studies, we remind that the level of taxes and other social norms imposed by governments through law can directly contribute to change the energy consumption behavior of the population and firms (e.g., countries like Sweden, Denmark, Norway, etc. enforce the highest carbon taxes on firms/organizations). Therefore, the rules imposed by the law and the pollution taxes can be two distinct variables that have an effect on the knowledge and technologies used by different entities to reduce annual energy consumption.
The original contributions presented in the study are included in the article/Supplementary Material, further inquiries can be directed to the corresponding author.
AB: Conceptualization, Methodology, Writing–original draft. IB: Methodology, Writing–review and editing. RK: Investigation, Resources, Writing–review and editing. SB: Data curation, Formal Analysis, Resources, Writing–review and editing. RZ: Data curation, Methodology, Resources, Writing–review and editing. IC: Conceptualization, Software, Writing–review and editing.
The author(s) declare that no financial support was received for the research, authorship, and/or publication of this article.
The authors declare that the research was conducted in the absence of any commercial or financial relationships that could be construed as a potential conflict of interest.
The author(s) declare that no Generative AI was used in the creation of this manuscript.
All claims expressed in this article are solely those of the authors and do not necessarily represent those of their affiliated organizations, or those of the publisher, the editors and the reviewers. Any product that may be evaluated in this article, or claim that may be made by its manufacturer, is not guaranteed or endorsed by the publisher.
The Supplementary Material for this article can be found online at: https://www.frontiersin.org/articles/10.3389/fenrg.2025.1515788/full#supplementary-material
Adams, F. P., Bromley, B. P., and Moore, M. (2014). “Assessment of disruptive innovation in emerging energy technologies,” in 2014 IEEE electrical power and energy conference, 110–115. doi:10.1109/EPEC.2014.20
Adrian-Nicolae, B., and Stancu, S. (2021). Usage of neural-based predictive modeling and iiot in wind energy applications. Amfiteatru Economic 23, 412. doi:10.24818/EA/2021/57/412
Albastroiu, I. (2021). Challenges of IoT technologies for businesses and consumers. Amfiteatru Economic 23, 321. doi:10.24818/EA/2021/57/321
Al-Hinti, I., Al-Ghandoor, A., Hakim, A. H., Vasant, P., and Barsoum, N. (2009). Analysis of final energy consumption patterns in 10 arab countries. AIP Conf. Proc., 123–128. doi:10.1063/1.3223916
Ali, N., Phoungthong, K., Khan, A., Abbas, S., Dilanchiev, A., Tariq, S., et al. (2023). Does FDI foster technological innovations? Empirical evidence from BRICS economies. PLOS ONE 18 (3), e0282498. doi:10.1371/journal.pone.0282498
Ali, N., Phoungthong, K., Techato, K., Ali, W., Abbas, S., Dhanraj, J. A., et al. (2022). FDI, green innovation and environmental quality nexus: new insights from BRICS economies. Sustainability 14 (4), 2181. doi:10.3390/su14042181
Andrieu, B., Vidal, O., Le Boulzec, H., Delannoy, L., and Verzier, F. (2022). Energy intensity of final consumption: the richer, the poorer the efficiency. Environ. Sci. and Technol. 56 (19), 13909–13919. doi:10.1021/acs.est.2c03462
Asghar, Z. (2008). Energy-GDP relationship: a causal analysis for the five countries of South Asia. Appl. Econ. Int. Dev. 8 (1). Available at: https://papers.ssrn.com/sol3/papers.cfm?abstract_id=1308260.
Avram, V., Calu, D. A., Dumitru, V. F., Dumitru, M., Glăvan, M. E., and Jinga, G. (2018). The institutionalization of the consistency and comparability principle in the European companies. Energies 11 (12), 3456. doi:10.3390/en11123456
Baumgartner, T., Wunderlich, F., Jaunich, A., Sato, T., Bundy, G., Grießmann, N., et al. (2012). Lighting the way: perspectives on the global lighting market.
Bianco, V., Manca, O., and Nardini, S. (2009). Electricity consumption forecasting in Italy using linear regression models. Energy 34 (9), 1413–1421. doi:10.1016/j.energy.2009.06.034
Borozan, D., and Pekanov Starcevic, D. (2018). Unveiling the factors affecting final electricity consumption: does the regional component matter? Int. J. Energy Sect. Manag. 12 (2), 202–220. doi:10.1108/IJESM-10-2017-0011
Brounen, D., and Kok, N. (2011). On the economics of energy labels in the housing market. J. Environ. Econ. Manag. 62 (2), 166–179. doi:10.1016/j.jeem.2010.11.006
Brounen, D., Kok, N., and Quigley, J. M. (2013). Energy literacy, awareness, and conservation behavior of residential households. Energy Econ. 38, 42–50. doi:10.1016/j.eneco.2013.02.008
Busch, P. (2008). Testing for tacit knowledge [chapter]. Tacit knowledge in organizational learning. IGI Glob. doi:10.4018/978-1-59904-501-6.ch004
Carley, S., and Lawrence, S. (2014). “Energy-based economic development,” in Energy-based economic development. Editors S. Carley, and S. Lawrence (London: Springer), 1–14. doi:10.1007/978-1-4471-6341-1_1
Chandler, A. D. (1977). The visible hand: The managerial revolution in American business (16. print). Cambridge, MA: Belknap Press of Harvard Univ. Press.
Chiriac, C. (2022). România va primi 1.39 miliarde de euro pentru proiecte în energie. Revista Capital. Available at: https://www.capital.ro/romania-va-primi-139-de-miliarde-de-euro-pentru-proiecte-in-energie-parlamentul-european-va-vota-planul-repowereu.html.
Christensen, C. M. (1997). The innovator’s dilemma: when new technologies cause great firms to fail. Boston: Harvard Business School Press.
Christensen, C. M. (2006). The ongoing process of building a theory of disruption. J. Prod. Innovation Manag. 23 (1), 39–55. doi:10.1111/j.1540-5885.2005.00180.x
Christensen, C. M., Horn, M. B., and Johnson, C. W. (2008). Disrupting class: how disruptive innovation will change the way the world learns. McGraw-Hill.
Christensen, C. M., McDonald, R., Altman, E. J., and Palmer, J. E. (2018). Disruptive innovation: an intellectual history and directions for future research. J. Manag. Stud. 55 (7), 1043–1078. doi:10.1111/joms.12349
Dincă, V. M., Busu, M., and Nagy-Bege, Z. (2022). Determinants with impact on romanian consumers’ energy-saving habits. Energies 15, 4080. doi:10.3390/en15114080
Dragomir, V. D., Gorgan, C., Calu, D.-A., and Dumitru, M. (2022). The relevance and comparability of corporate financial reporting regarding renewable energy production in Europe. Renew. Energy Focus 41, 206–215. doi:10.1016/j.ref.2022.03.002
Drucker, P. F. (2010). The essential Drucker: Selecţie din lucrările de management ale lui Peter F. Drucker. Bucureşti: Meteor Press.
Dumitru, V.-F., Jinga, G., Stănilă, O. G., and Dumitru, M. (2019). The impact of the European Directive 2014/95/EU on the energy companies’ disclosures. Proc. Int. Conf. Bus. Excell. 13 (1), 268–276. doi:10.2478/picbe-2019-0024
Dutta, S., Lanvin, B., Wunsch-Vincent, S., and León, L. R. (2024). Global innovation index 2022: (Subtitle)/. Unknown. Geneva, Switzerland: World Intellectual Property Organization, 2022. doi:10.34667/TIND.46596
El Gibari, S., Gómez, T., and Ruiz, F. (2024). Building composite indicators using multicriteria methods: a review. J. Bus. Econ. 89 (1). doi:10.1007/s11573-018-0902-z
EP (2023). Windfall tax on massive oil profits. European Parliament. Parliamentary question - E-000602/2023. Available at: https://www.europarl.europa.eu/doceo/document/E-9-2023-000602-ASW_EN.html.
Fatai, K., Oxley, L., and Scrimgeour, F. G. (2004). Modelling the causal relationship between energy consumption and GDP in New Zealand, Australia, India, Indonesia, the Philippines and Thailand. Math. Comput. Simul. 64 (3–4), 431–445. doi:10.1016/S0378-4754(03)00109-5
Feaster, S. (2018). The seven technology disruptions Driving the global energy transition: a primer. Institute of financial analyses, IEEFA organization.
Ferguson, N., Mironescu, D., and Mironescu, A. (2011). Civilizaţia: vestul şi restul. Iaşi: Polirom.
Ford, M. (2016). Rise of the robots: technology and the threat of a jobless future. Illustrated edition. Basic Books.
González-Eguino, M. (2015). Energy poverty: an overview. Renew. Sustain. Energy Rev. 47, 377–385. doi:10.1016/j.rser.2015.03.013
Ha, L. T. (2022). Are digital business and digital public services a driver for better energy security? Evidence from a European sample. Environ. Sci. Pollut. Res. 29 (18), 27232–27256. doi:10.1007/s11356-021-17843-2
M. Hafner, and G. Luciani (2022). The Palgrave handbook of international energy economics (Palgrave Macmillan). doi:10.1007/978-3-030-86884-0
Hardi, I., Ray, S., Attari, M. U. Q., Ali, N., and Idroes, G. M. (2024). Innovation and economic growth in the top five southeast asian economies: a decomposition analysis. Ekonomikalia J. Econ. 2 (1), 1–14. doi:10.60084/eje.v2i1.145
Hopster, J. (2021). What are socially disruptive technologies? Technol. Soc. 67, 101750. doi:10.1016/j.techsoc.2021.101750
Hu, X., Ali, N., Malik, M., Hussain, J., Fengyi, J., and Nilofar, M. (2021). Impact of economic openness and innovationson the environment: a new lookinto asean countries. Pol. J. Environ. Stud. 30 (4), 3601–3613. doi:10.15244/pjoes/130898
Huang, G., He, L.-Y., and Lin, X. (2022). Robot adoption and energy performance: evidence from Chinese industrial firms. Energy Econ. 107, 105837. doi:10.1016/j.eneco.2022.105837
IEEFA. (2018). The seven technology disruptions Driving the global energy transition: a primer. The institute for energy economics and financial analysis.
Ishaq, M., Ghouse, G., Fernández-González, R., Puime-Guillén, F., Tandir, N., and Santos De Oliveira, H. M. (2022). From fossil energy to renewable energy: why is circular economy needed in the energy transition? Front. Environ. Sci. 10, 941791. doi:10.3389/fenvs.2022.941791
Kouziokas, G. N., Chatzigeorgiou, A., and Perakis, K. (2019). “Final energy consumption forecasting by applying artificial intelligence models,” in Operational research in the digital era – ICT challenges. Editors A. Sifaleras, and K. Petridis (Springer International Publishing), 1–10. doi:10.1007/978-3-319-95666-4_1
Lange, S., Pohl, J., and Santarius, T. (2020). Digitalization and energy consumption. Does ICT reduce energy demand? Ecol. Econ. 176, 106760. doi:10.1016/j.ecolecon.2020.106760
Löpfe, P., and Vontobel, W. (2012). Reiche Multis - arme Bürger: Die unsoziale Kehrseite der masslosen Unternehmensgewinne. Verlag, Zürich, Schweiz: Orell Füssli.
Madureira, N. L. (2021). Energy paradoxes. Front. Energy Res. 9, 686140. doi:10.3389/fenrg.2021.686140
McQuivey, J. (2013). Digital disruption: unleashing the next wave of innovation. Forrester Research: Amazon Publishing.
MIa. (2022). Led lighting market—growth, trends, covid-19 impact, and forecasts (2022—2027) [Reportlinker].
Moita, R., and Monte, D. (2022). The limits in the adoption of batteries. Energy Econ. 107, 105776. doi:10.1016/j.eneco.2021.105776
Morris, I. (2010). Way the West rules – for now. traducere Ed. Farrar, Straus and Giroux. Available at: https://www.amazon.co.uk/Why-West-Rules-Patterns-History/dp/1846682088.
National Intelligence Council (U.S.) (2012). in Global trends 2030: alternative worlds: a publication of the national intelligence Council (National Intelligence Council). Available at: https://www.dni.gov/files/documents/GlobalTrends_2030.pdf.
I. Nonaka, and T. Nishiguchi (2001). Knowledge emergence: social, technical, and evolutionary dimensions of knowledge creation (Oxford University Press).
Noussan, M., and Tagliapietra, S. (2020). The effect of digitalization in the energy consumption of passenger transport: an analysis of future scenarios for Europe. J. Clean. Prod. 258, 120926. doi:10.1016/j.jclepro.2020.120926
OECD, European Union, and Joint Research Centre - European Commission (2008). Handbook on constructing composite indicators: methodology and user guide. OECD. doi:10.1787/9789264043466-en
Park, W. Y., Shah, N., Shiraishi, K., and Vine, E. (2022). Improving energy performance metrics to maximize the benefits of disruptive technologies. Energy Res. and Soc. Sci. 89, 102678. doi:10.1016/j.erss.2022.102678
Payne, J. E. (2009). On the dynamics of energy consumption and output in the US. Appl. Energy 86 (4), 575–577. doi:10.1016/j.apenergy.2008.07.003
Polanyi, M. (2015). Personal knowledge: towards a post-critical philosophy. University of Chicago Press.
Pop, R.-A., Dabija, D.-C., Pelău, C., and Dinu, V. (2022). Usage intentions, attitudes, and behaviors towards energy-efficient applications during the covid-19 pandemic. J. Bus. Econ. Manag. 23 (3), 668–689. doi:10.3846/jbem.2022.16959
Prahalad, C. K., and Krishnan, M. S. (2008). The new age of innovation: driving cocreated value through global networks. McGraw-Hill.
Qin, X. (2020). Oil shocks and financial systemic stress: international evidence. Energy Econ. 92, 104945. doi:10.1016/j.eneco.2020.104945
Rathi, A., and Lombrana, L. (2022). A breakthrough on climate compensation and 7 other takeaways from COP27. Bloomberg. Available at: https://www.bloomberg.com/news/articles/2022-11-20/a-breakthrough-on-climate-compensation-and-7-other-takeaways-from-cop27.
Rauf, A., Ali, N., Sadiq, M. N., Abid, S., Kayani, S. A., and Hussain, A. (2023). Foreign direct investment, technological innovations, energy use, economic growth, and environmental sustainability nexus: new perspectives in BRICS economies. Sustainability 15 (18), 14013. doi:10.3390/su151814013
R-EU a (2022). REPowerEU: a plan to rapidly reduce dependence on Russian fossil fuels and fast forward the green transition*. Bruxelles: European Commission. Available at: https://ec.europa.eu/commission/presscorner/detail/en/ip_22_3131.
Rhodes, R. (2018). Energy: a human history (First Simon&Schuster hardcover edition). New York: Simon and Schuster.
Rushe, D., and Aratani, L. (2022). Biden implores US oil companies to pass on record profits to consumers. United Kingdom: The Guardian.
Sadiq, M. N., and Ali, N. (2024). Digital financial inclusion and environmental sustainability nexus: Evidence from South Asian economies, Pakistan Journal of Commerce and Social Sciences (PJCSS). Lahore: Johar Education Society, Pakistan (JESPK) 18 (1), 134–156.
Schnidrig, J., Cherkaoui, R., Calisesi, Y., Margni, M., and Maréchal, F. (2023). On the role of energy infrastructure in the energy transition. Case study of an energy independent and CO2 neutral energy system for Switzerland. Front. Energy Res. 11, 1164813. doi:10.3389/fenrg.2023.1164813
Schuelke-Leech, B.-A. (2021). Disruptive technologies for a green new deal. Curr. Opin. Environ. Sci. and Health 21, 100245. doi:10.1016/j.coesh.2021.100245
Schumpeter, J. (1939). Business cycles. A theoretical, historical and statistical analysis of the capitalist process. McGraw Hill Book Company.
Shao, M., and Wang, L. (2022). Financing energy transition in COVID-19 for energy efficiency: does mitigation of energy price risk that essential? Front. Environ. Sci. 10, 982322. doi:10.3389/fenvs.2022.982322
Sherule, A. J., and Dudhe, R. (2021). “Disruptive technologies in energy and environment,” in 2021 international conference on computational intelligence and knowledge economy (ICCIKE), 37–41. doi:10.1109/ICCIKE51210.2021.9410785
Smallbone, A., Jia, B., Atkins, P., and Roskilly, A. P. (2020). The impact of disruptive powertrain technologies on energy consumption and carbon dioxide emissions from heavy-duty vehicles. Energy Convers. Manag. X 6, 100030. doi:10.1016/j.ecmx.2020.100030
Smil, V. (2003). Energy at the crossroads: global perspectives and uncertainties, 1. MIT Press paperback ed.
Soava, G., Mehedintu, A., Sterpu, M., and Raduteanu, M. (2018). Impact of renewable energy consumption on economic growth: evidence from European union countries. Technol. Econ. Dev. Econ. 24 (3), 914–932. doi:10.3846/tede.2018.1426
Tamaki, R., Matoba, T., Kachi, N., and Tsukamoto, H. (2017). The paradigm disruptive new energy storage Shuttle BatteryTM technology. Evol. Institutional Econ. Rev. 14 (1), 207–224. doi:10.1007/s40844-016-0065-y
Tantau, A., and Santa, A.-M. I.Bucharest University of Economic Studies, Buchares, and t, Romania (2019). Best practices for a sustainable energy sector at European union level chances and challenges for Romania. Www. Amfiteatrueconomic. Ro. 21 (52), 697. doi:10.24818/EA/2019/52/697
UN SDG (2022). The sustainable development goals report 2022. United Nation. Available at: https://unstats.un.org/sdgs/report/2022/.
Un Sdg, U. (2023). Times of crisis, times of change science for accelerating transformations to sustainable development (2023). United nation. Available at: https://unstats.un.org/sdgs/report/2023/.
Valentová, M., Quicheron, M., and Bertoldi, P. (2012). LED projects and economic test cases in Europe. Luxembourg: Publications Office.
Vlăducu, L. V. (2020). Analysis of the correlation between the Gross Domestic Product and the final consumption of electricity. Proc. Int. Conf. Bus. Excell. 14 (1), 59–73. doi:10.2478/picbe-2020-0007
Wang, H., Hu, X., and Ali, N. (2022). Spatial characteristics and driving factors toward the digital economy: evidence from prefecture-level cities in China. J. Asian Finance, Econ. Bus. 9 (2), 419–426. doi:10.13106/JAFEB.2022.VOL9.NO2.0419
Wangjiraniran, W., Pongthanaisawan, J., Junlakarn, S., and Phadungsri, D. (2017). Scenario analysis of disruptive technology penetration on the energy system in Thailand. Energy Procedia 142, 2661–2668. doi:10.1016/j.egypro.2017.12.208
Weinold, M. (2020). A long overdue end to flicker: the 2020 EU lighting efficiency regulations. Camb. J. Sci. and Policy 1. doi:10.17863/CAM.51909
Weisbuch, C. (2020). Review—on the search for efficient solid state light emitters: past, present, future. ECS J. Solid State Sci. Technol. 9 (1), 016022. doi:10.1149/2.0392001JSS
World Intellectual Property Indicators (2016). Available at: https://www.wipo.int/edocs/pubdocs/en/wipo_pub_941_2016.pdf.
Xu, D., Abbas, S., Rafique, K., and Ali, N. (2023). The race to net-zero emissions: can green technological innovation and environmental regulation be the potential pathway to net-zero emissions? Technol. Soc. 75, 102364. doi:10.1016/j.techsoc.2023.102364
Yu, H., Cheng, Q., and Chen, R. (2019). The final energy consumption characteristics of the G7 and BRICS nations. IOP Conf. Ser. Mater. Sci. Eng. 677 (3), 032031. doi:10.1088/1757-899X/677/3/032031
Yu, Z., Streimikiene, D., Balezentis, T., and Dapkus, R. (2017). Final energy consumption trends and drivers in Czech republic and Latvia. Amfiteatru Econ. 19 (46), 866–889.
Zachariadis, T. (2007). Exploring the relationship between energy use and economic growth with bivariate models: new evidence from G-7 countries. Energy Econ. 29 (6), 1233–1253. doi:10.1016/j.eneco.2007.05.001
Zeng, Y., Dong, P., Shi, Y., and Li, Y. (2018). On the disruptive innovation strategy of renewable energy technology diffusion: an agent-based model. Energies 11 (11), 3217. doi:10.3390/en11113217
Zhang, C.-Y., Yu, B., Wang, J.-W., and Wei, Y.-M. (2018). Impact factors of household energy-saving behavior: an empirical study of Shandong Province in China. J. Clean. Prod. 185, 285–298. doi:10.1016/j.jclepro.2018.02.303
Zhou, X., Zhou, D., Wang, Q., and Su, B. (2019). How information and communication technology drives carbon emissions: a sector-level analysis for China. Energy Econ. 81, 380–392. doi:10.1016/j.eneco.2019.04.014
Keywords: energy policy, sustainable development, final energy consumption, disruptive technology, knowledge
Citation: Burciu A, Bostan I, Kicsi R, Buta S, Zoltan R and Condratov I (2025) Towards a sustainable approach of energy policy in the EU: empirical evidence for Romania vs. the Visegrad Group based on the relationship among disruptive technology, knowledge and final energy consumption. Front. Energy Res. 13:1515788. doi: 10.3389/fenrg.2025.1515788
Received: 23 October 2024; Accepted: 23 January 2025;
Published: 20 February 2025.
Edited by:
Luan Santos, Federal University of Rio de Janeiro, BrazilReviewed by:
Najabat Ali, Soochow University, ChinaCopyright © 2025 Burciu, Bostan, Kicsi, Buta, Zoltan and Condratov. This is an open-access article distributed under the terms of the Creative Commons Attribution License (CC BY). The use, distribution or reproduction in other forums is permitted, provided the original author(s) and the copyright owner(s) are credited and that the original publication in this journal is cited, in accordance with accepted academic practice. No use, distribution or reproduction is permitted which does not comply with these terms.
*Correspondence: Aurel Burciu, YXVyZWwuYnVyY2l1QHVzbS5ybw==
†ORCID: Aurel Burciu, orcid.org/0000-0003-1628-2316; Ionel Bostan, orcid.org/0000-0002-7653-7192; Rozalia Kicsi, orcid.org/0000-0001-6712-4284; Simona Buta, orcid.org/0000-0001-9370-6923; Raluca Zoltan, orcid.org/0009-0006-1065-0885; Iulian Condratov, orcid.org/0000-0003-2860-5944
Disclaimer: All claims expressed in this article are solely those of the authors and do not necessarily represent those of their affiliated organizations, or those of the publisher, the editors and the reviewers. Any product that may be evaluated in this article or claim that may be made by its manufacturer is not guaranteed or endorsed by the publisher.
Research integrity at Frontiers
Learn more about the work of our research integrity team to safeguard the quality of each article we publish.