
94% of researchers rate our articles as excellent or good
Learn more about the work of our research integrity team to safeguard the quality of each article we publish.
Find out more
ORIGINAL RESEARCH article
Front. Energy Res., 24 March 2025
Sec. Sustainable Energy Systems
Volume 13 - 2025 | https://doi.org/10.3389/fenrg.2025.1515479
 Sachin Gorakshnath Chavan1,2†*
 Premaratne Samaranayake3†*
 Yi-Chen Lan3‡
 Chelsea Maier1,2
 Weiguang Liang1
 Christopher I. Cazzonelli1,2
 Zhong-Hua Chen1,4,5
 David T. Tissue1,2,5
Introduction: Energy management in protected cropping is imperative to sustainably produce food. Optimal energy consumption in a protected cropping facility strongly depends on infrastructure control settings and meteorological conditions. This study aimed to optimise glasshouse energy management by investigating energy consumption under different shading, light-altering and ventilation conditions.
Methods: We compared energy consumption used in heating and cooling under two light-altering films and four different ventilation and shade screen positions. The light-altering glasshouse films, namely, light shifting film (LSF) - Luminescent Light Emitting Agriculture Film (LLEAF), and light blocking film (LBF) - low emissivity film ULR 80 (ultra-low reflectivity with 80% light transmission) were compared to a light diffusing hazed glass as the control.
Results: The mean combined energy consumption was significantly higher in summer compared to winter. The light treatment and ventilation/shade screen position combinations influenced total heating and cooling energy consumption mostly in summer. The LBF achieved the most efficient total energy consumption, particularly when ventilation was open and shade screens closed during winter, and when both ventilation and shade screens were closed during summer.
Discussion: Regardless of the season, cooling energy use was more dependent on the rooftop rather than the outside air temperature, indicating that incoming radiation is the major contributor to glasshouse warming during winter. Therefore, the minimization of energy consumption in protected cropping requires combined management of ventilation settings and light-altering methods to match the seasonal photoperiod and outside temperature environment.
The focus on sustainable food production is growing, especially in the investigation and implementation of protected cropping techniques to boost output in response to the rising needs of the agri-food supply chain. The key factors that emphasize the need for sustainable food production include the growth of the world population leading to increased fresh food demand, climate change impacting food production and supply, the sustainability of economic development and social wellbeing, declining arable land, and biotic as well as abiotic stresses to crops (Lambin and Meyfroidt, 2011; Torrellas et al., 2012; Food and Agriculture Organization, 2016; Bambara and Athienitis, 2019; Geilfus and Geilfus, 2019; Fedoroff, 2015; Gonzalez Guzman et al., 2022; Shabala et al., 2020; Wang et al., 2023). In response to global food demand, the production of horticultural produce such as tomatoes, capsicums, cucumbers, lettuce, and eggplants has seen a significant rise (Torrellas et al., 2012; Del Borghi et al., 2014; Bambara and Athienitis, 2019; Geilfus and Geilfus, 2019; Gruda et al., 2019; Chavan et al., 2022). Protected cropping enhances crop yield and quality by providing significant protection against detrimental weather conditions such as drought, flooding, extreme temperatures, and pressures from pests and diseases (Adem et al., 2020; Smagghe et al., 2023). In high-tech protected cropping facilities, the climate is controlled to establish an optimal growth environment, enabling crops to fully realize their genetic potential to maximize yields (Mahajan and Singh, 2006; Diouf et al., 2020; Maier et al., 2022). However, in high-tech protected cropping facilities, high ongoing operational expenses, primarily labour and energy consumption for maintaining climate conditions, adversely influence adoption of protected cropping practices by small-to-medium enterprises.
Energy consumption in protected cropping facilities is mainly cooling and heating during crop cycles. Depending on the facility’s location, heating or cooling will dominate energy consumption. For instance, cooling is the most significant energy use in most regions of Australia due to high solar radiation and temperature, whereas heating is the most significant energy use in the Netherlands where the winter season is longer and temperatures are cooler (Rabbi et al., 2019; Lin et al., 2022). Shading screens are effective in reducing excess radiation, promoting cooling during the daytime and improving the nighttime climate (Montero et al., 2013). Ventilation methods help in the removal of trapped heat from greenhouses by replacing the warm inside air with cold outside air and for a naturally ventilated greenhouse, it is recommended that the total area of vent openings should be between 15% and 30% of the floor area as a further increase in vent openings gives marginal increase in performance (Ganguly and Ghosh, 2010) which may come at the cost of losing CO2. A simulation study indicates that the configuration of vents influences the microclimate patterns within a greenhouse, as well as the spatial and temporal variations of its internal climate. Additionally, the size of the vent openings impacts the time required for dehumidification, as well as the air temperature and relative humidity during this process (He et al., 2015). The shading methods coupled with ventilation or evaporative cooling can improve the overall microclimate and the distribution of microclimatic parameters (Ahemd et al., 2016). Several researchers have compared energy use between open-field cultivation and protected cropping under different climate conditions across the globe (Stanhill, 1980; Khoshnevisan et al., 2014; Golzar et al., 2018). Many recent studies investigated the impact of various covering materials on greenhouse crop production and developed models of protected cropping energy, which has led to promising results to effectively manage energy consumption (He et al., 2023; Maier et al., 2023; Lee et al., 2012; Shen et al., 2018; Liu et al., 2010; Moghaddam et al., 2011; Lin et al., 2022; Lin et al., 2024).
Various innovative covering materials have been developed to reduce energy consumption and increase yield and nutritional value using high-transmission light-diffusing glass, wavelength selective photovoltaics, energy-generating photovoltaics (PV) and light-altering greenhouse covers (Cossu et al., 2016; Loik et al., 2017; Ezzaeri et al., 2018; Hassanien et al., 2018; Aroca-Delgado et al., 2019). It is emphasised that a better understanding of greenhouse covering materials with an energy-efficient focus is an opportunity for better yield and higher-nutrient vegetable production in response to global climate challenges (He et al., 2022). Some covering materials change light quality and quantity incident to the crop which can impact yield; however other covering materials optimized for crop production can increase energy consumption (Tani et al., 2014; Alsadon et al., 2016; Ahmadi et al., 2018; Ezzaeri et al., 2018; Mormile et al., 2019; Chavan et al., 2020; He et al., 2021; Zhao et al., 2021). For example, the commercially available (Solar Gard Saint-Gobain) Light blocking film (LBF) ULR-80 increases energy-, water-, and fertilizer-use efficiency, without affecting fruit quality (Chavan et al., 2020; Chavan et al., 2023). However, the energy savings were accompanied by yield reduction in both eggplant and capsicum crops in a cultivar-dependent manner (Chavan et al., 2020; Chavan et al., 2023; Lin et al., 2022). To understand their impact on energy consumption in protected cropping and whether covering materials designed for reducing energy consumption are effective in greenhouse operations requires additional investigation. Key passive climate controls within a protected cropping environment include the use of ventilation components and shade screens (Gruda et al., 2019; Rabbi et al., 2019). Given the range of covering materials that can impact light transmission and crop microclimate conditions differently, optimal ventilation and shading strategies should be determined for each covering material (Samaranayake et al., 2020; Samaranayake et al., 2021). There is still insufficient knowledge on the energy analysis and conservation in protected cropping in relation to the optimal shade screen and ventilation management protocols to utilise for different light-altering covering materials.
In this study the energy used to maintain greenhouse temperature setpoints using selected ventilation and shading configurations under different light-altering covering materials across the summer and winter seasons was assessed. The objectives were to (i) examine the differences across a temperature profile captured under different light-altering glasshouse films, (ii) determine the optimum shade screen and ventilation control configuration under each light-altering covering material for the summer and winter seasons, and (iii) provide guidelines to develop an optimal energy consumption strategy in protected cropping. Two light-altering covering materials and a control (diffused glass) with four ventilation/shade screen configurations were deployed within a high-tech greenhouse and tested during the summer and winter seasons of the south pacific climate. The differential impact of ventilation/shade screen settings on energy consumption according to the growing season and influence by the light-altering cover films can pave standard operating procedures to minimise energy consumption and enhance productivity.
The study was conducted at the National Vegetable Protected Cropping Centre (NVPCC) in a Venlo-style state-of-the-art research, education, and training greenhouse facility located in the Hawkesbury Campus of Western Sydney University, Richmond NSW, Australia (33.60oS, 150.75oE) to investigate the effect of two different light-altering film treatments on overall cooling energy consumption. We compared a control and two different light-altering glasshouse films under optimum ventilation and shading conditions using six 105-m2 greenhouse compartments (two compartments for each configuration). The light-altering glasshouse films used in this research included (i) light blocking film (LBF) on the roof and walls, and (ii) light shifting film (LSF) on the roof and walls. The control consisted of a diffuse glass roof and transparent glass walls without additional film. The NVPCC greenhouse uses the Priva control system (Priva, Netherlands) with a sensor box in each compartment positioned at the gutter level to trigger ventilation and mechanical cooling methods. The energy consumption in six compartments was evaluated under four combinations of ventilation and shade screen positions (closed and open) during the day (08:00–17:00 h). Daily and average energy consumption were compared across light treatments as a basis for developing an optimal cooling strategy for energy management.
The light-altering glasshouse films, namely, light shifting film (LSF) - Luminescent Light Emitting Agriculture Film (LLEAF), and light blocking film (LBF) – low emissivity film ULR 80 (ultra-low reflectivity with 80% light transmission) were compared to a light diffusing hazed glass as the control. LSF predominantly absorbs light from the green section and emits light in the red section of the light spectrum, which is more efficiently used in photosynthesis. The LBF is a commercially available window glazing material with low thermal emissivity (0.87). LBF blocks the light that mainly contributes to heat but transmits PAR. The HD1AR glass in the control compartments consists of 70% haze in roof glass and 5% haze in wall glass (Glasimport Greenhouses BV, Bovendijk 35, 2295 RV, Kwintsheul, Netherlands).
The current study builds on our previous study involving the reduction of cooling energy consumption by regulating the settings (opening/closing) of either shade screens (curtains) or ventilation during the day. The temperature of each compartment at three levels: rooftop (7 m from the floor), mechanical cooler (4.2 m from the floor), and gutter (1.5 m from the floor) was measured. The detailed schematic of the temperature sensors inside the experimental compartments is described in (Samaranayake et al., 2021). We extend this research design in the current study to investigate differences among covering materials in regulating the temperature difference between gutter level and rooftop level. The strategy was used to determine the optimum timeframes for reducing cooling energy via opening and closing of ventilation and shade screens.
The study utilised six research compartments (C1-C6), each configured as per the schematic shown in Figure 1A. The orientation as described in more detail by (Lin et al., 2022). Two replicates of each light-altering configuration were allocated such that one compartment was located in the southeast (SE) direction (C2, C4, and C6) and the other in the northwest (NW) direction (C1, C3, and C5). Unlike other regions where maximising light interception is crucial, greenhouses in Australia are typically oriented north-south to minimise shading effects caused by structural shadows due to Australia’s high light levels. An east-west orientation can create consistent shadows in the same part of the crop throughout the day, potentially affecting productivity and plant health. In southern Australia, while an east-west orientation might allow slightly more light, cooling and ventilation needs are more critical (NSW, 2007). Figure 1B illustrates the light transmission characteristics of the respective films. Continuous ventilation systems, measuring 10 m × 1 m when fully open, spanned the length of each compartment (Figures 1C, D). These vents, coupled with Harmony 5,045 shade screens (Svensson, Sweden), which reduce photosynthetically active radiation (PAR) by 50% in direct light and 54% in diffuse light, were utilized across all compartments.
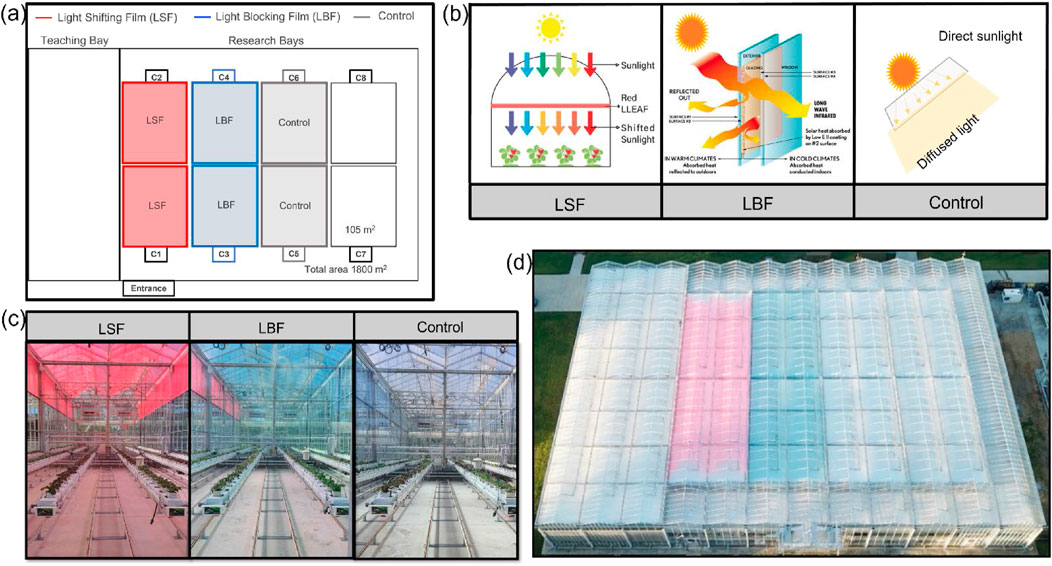
Figure 1. Research design and experimental configuration. (a) Schematic diagram of six compartments (C1-C6) inside the facility. (b) Light transmission diagrams for respective light-altering glasshouse films, (c) Side view of LSF, LBF, and control configuration, and (d) Roof-top view of light-altering glasshouse films.
The research compartments implement cooling via mechanical coolers consisting of a fan that pulls air over a coil fed with 6°C water via a cold-water storage tank, chilled by a chiller (Supplementary Figure S1). Each cooler has a capacity of 30 kW at 28°C air temperature, 80% RH (relative humidity), and 6°C cooling water lifted to 16°C. The 6°C water is added to the circulation system of the fan with a modulating valve. The amount of 6 °C water added to the system depends on the desired temperature of the room.
The experiments were conducted over four time periods (3–4 days each) from 13 to 26 June 2021 (winter season) and 17–29 January 2022 (summer season). These days were selected because weather conditions were similar during each experimental period - cool (winter) and warm (summer) seasons. Four periods are based on a combination of opening and closing of the shade screen and ventilation, namely, Period 1 (P1, shade screen open and ventilation open), Period 2 (P2, shade screen open and ventilation closed), Period 3 (P3, shade screen closed and ventilation closed) and Period 4 (P4, shade screen closed and ventilation open) (Tables 1; Supplementary Table S1). Temperature and energy consumption data were captured from 08:00 to 17:00 each day throughout the entire experiment across four periods. During periods in which ventilation was fully open, the system could override the open setting to close the ventilation in the event of a storm as a protective strategy. These settings are similar to those used in earlier experiments (Samaranayake et al., 2021) to test the impact of ventilation and shade screen opening and closing under normal glass in a closed facility.
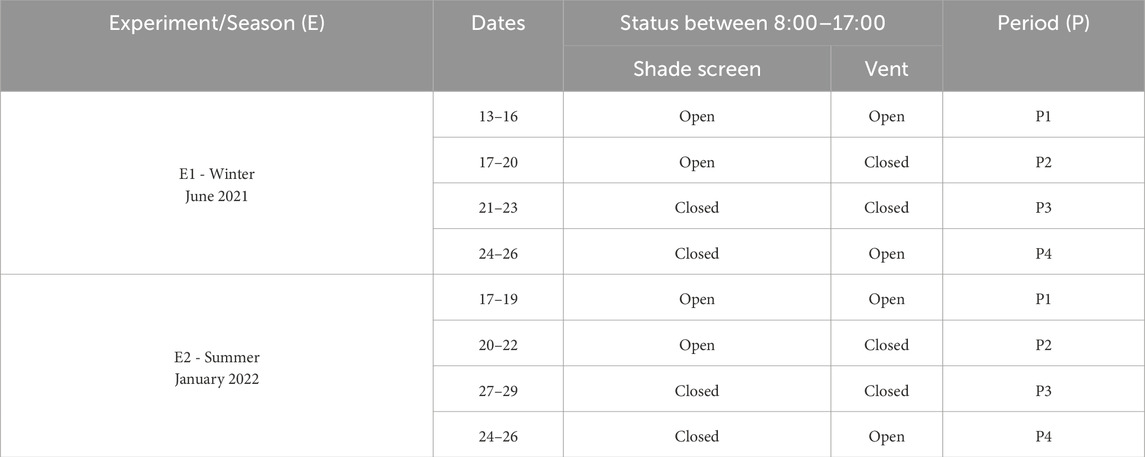
Table 1. Experimental periods defined according to the shade screen and ventilation status in each period in C1-C6 greenhouse compartments in experiment 1 (E1) and experiment 2 (E2) conducted during winter and summer, respectively.
The research compartments were set to maintain temperatures within ranges at particular times of day (Table 2). To be specific, the temperature was set to activate heating if it reached 21°C or below between 08:00 and 17:00 (the first time bracket). During the second time bracket (17:00 to 00:00), the heating was set to activate at 15°C or below. In the third time bracket (00:00 to 08:00), 16°C was the set temperature to activate the heating. Regarding the cooling strategy, temperatures were set to 25°C, 17°C, and 18°C for the respective time brackets. No humidity control was utilised during the experiment because there were no crops. In general, when temperatures fell below heating temperatures, heating was activated. When temperatures rose above cooling temperatures, mechanical coolers were activated.
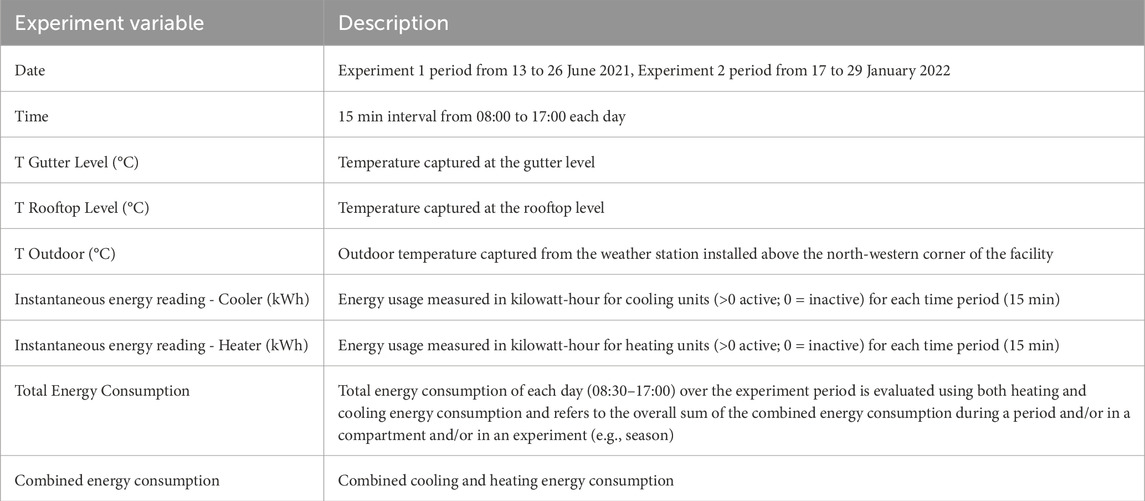
Table 2. Summary of variables for experiment 1 (E1) and experiment 2 (E2) in the greenhouse compartment.
The compartment temperatures were monitored with a temperature sensor connected with the Priva system, they were located at the growing gutter level of the room, and data were logged every 5 min. In addition, Hobo pendant temp/light data loggers (UA-002-08, Onset, MA, United States) were used to monitor temperature at the rooftop, mechanical coolers, and gutter levels. The data loggers recorded the temperature every 15 min. Outside temperatures were also monitored on the southwestern side of the glasshouse facility. Table 2 presents the dates of each period in the winter and summer seasons, shade screen and ventilation status in each period and the corresponding descriptions for this study.
Experimental data for temperature and energy consumption were mainly used for the analysis. The daily sums of combined energy consumption, cooling energy consumption and heating energy consumption in each compartment (C1-C6) during each experimental period were evaluated, without crops, using the recorded instantaneous energy reading. A summary of energy consumption across treatments, periods and seasons is shown in Table 3.
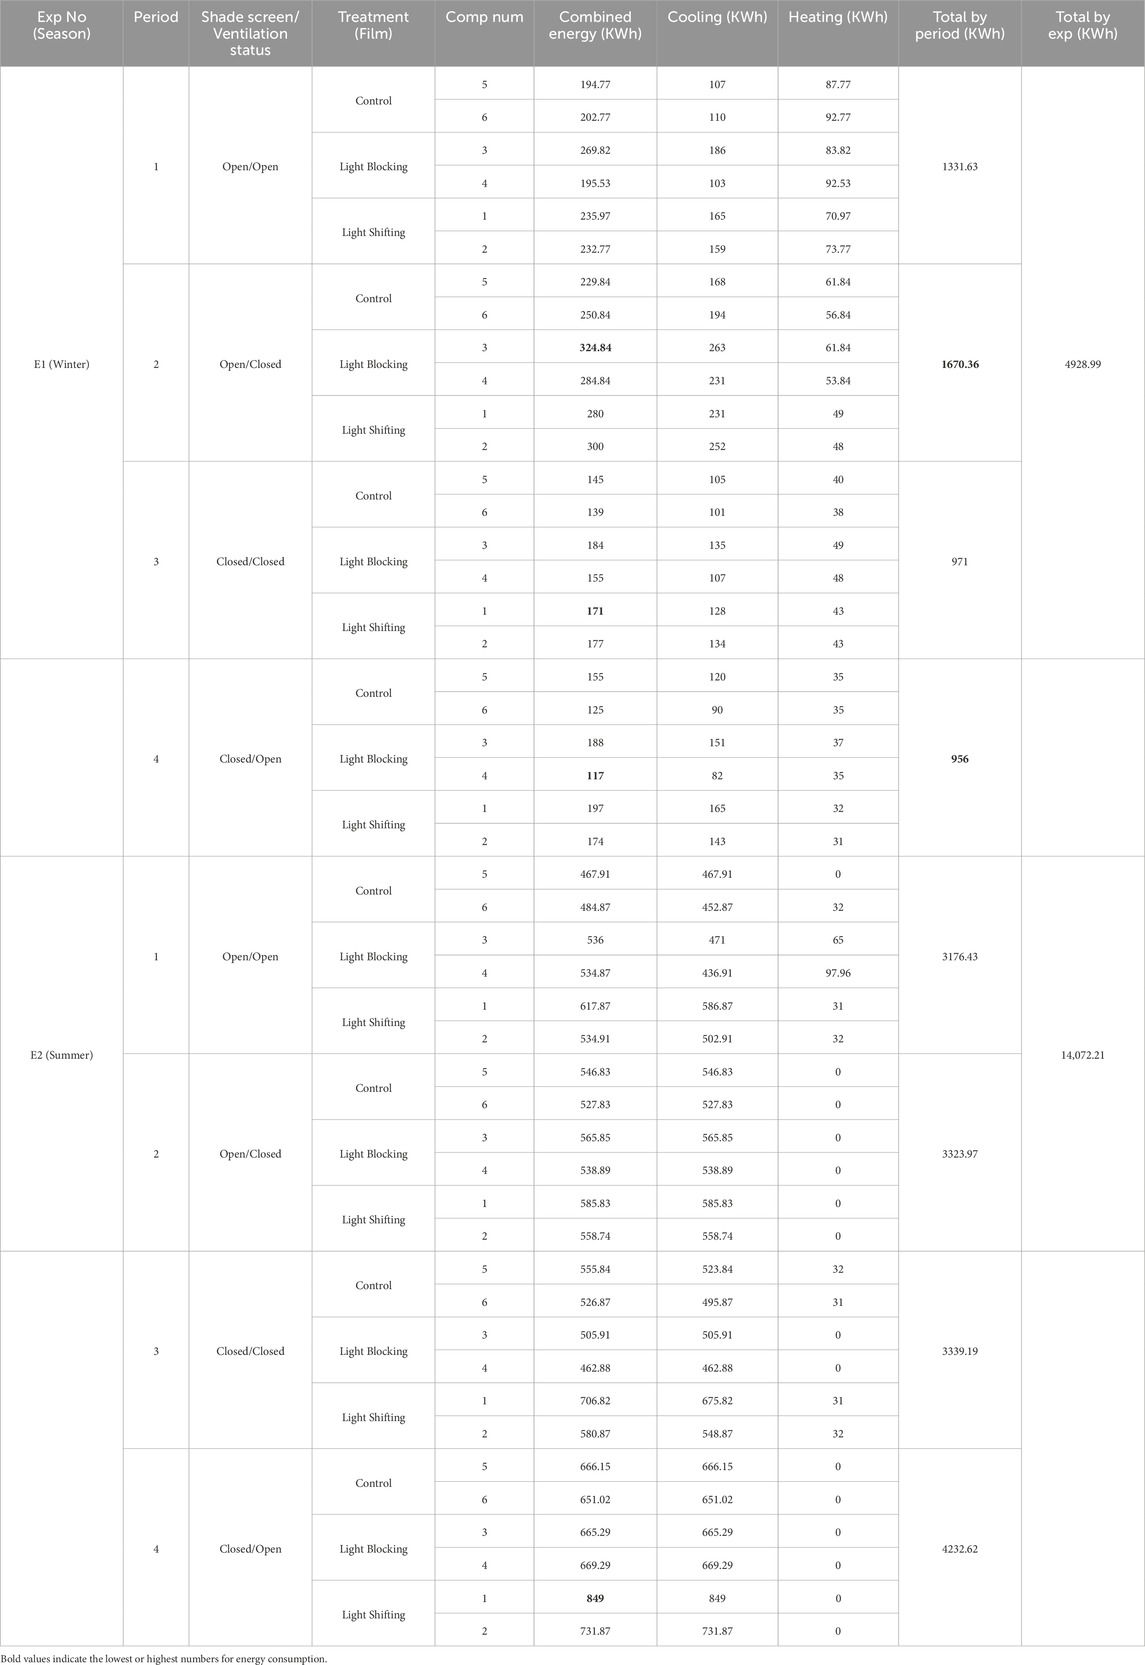
Table 3. The total/sums of cooling, heating and combined energy consumption (kWh) across different statuses of ventilation and shade screens (Periods) and six greenhouse compartments in winter (E1) and summer (E2) experiments.
Descriptive statistics and analysis of variance (ANOVA) of combined energy consumption (cooling and heating) and air temperatures (at gutter, mechanical cooler, rooftop levels and outdoor) under all combinations of shade screen/ventilation settings (P1-P4) and glasshouse films (two light treatments and one control) in winter (June 2021) and Summer (January 2022) seasons are shown in Tables 4, 5. The selection of all combinations of shade screen/ventilation settings for further analysis of the energy profile is based on the need for a comparative analysis of the energy consumption across all combinations, particularly the possible shift of the best ventilation settings when the temperature profile changes from very low in winter to very high in the summer season. Furthermore, this provides an opportunity to explore possible shift of the best combination of ventilation settings of P4 (shade screen closed and ventilation open) in winter for energy consumption under standard lighting conditions (Samaranayake et al., 2020) when light treatments are introduced across two seasons (winter and summer).
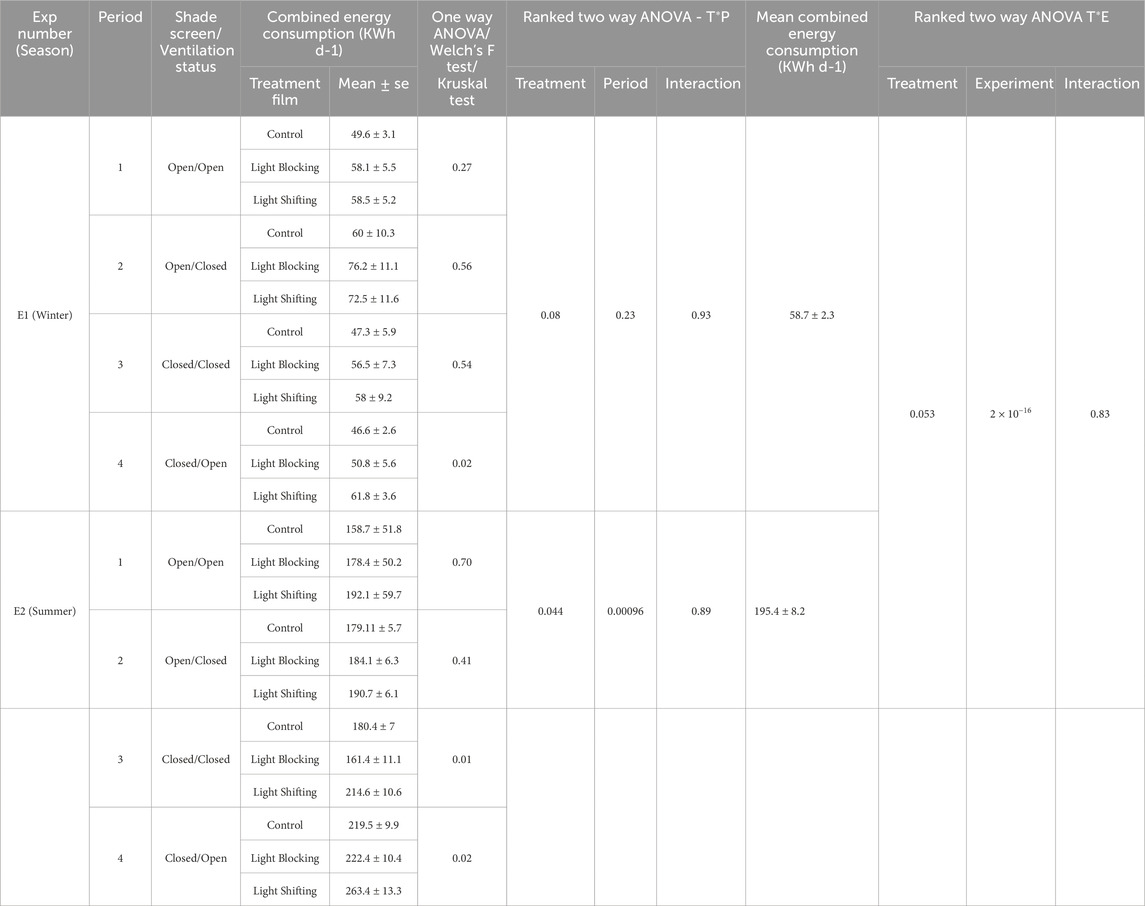
Table 4. Descriptive statistics and analysis of variance (ANOVA) of combined energy consumption in winter experiment 1 (E1) and summer experiment 2 (E2).
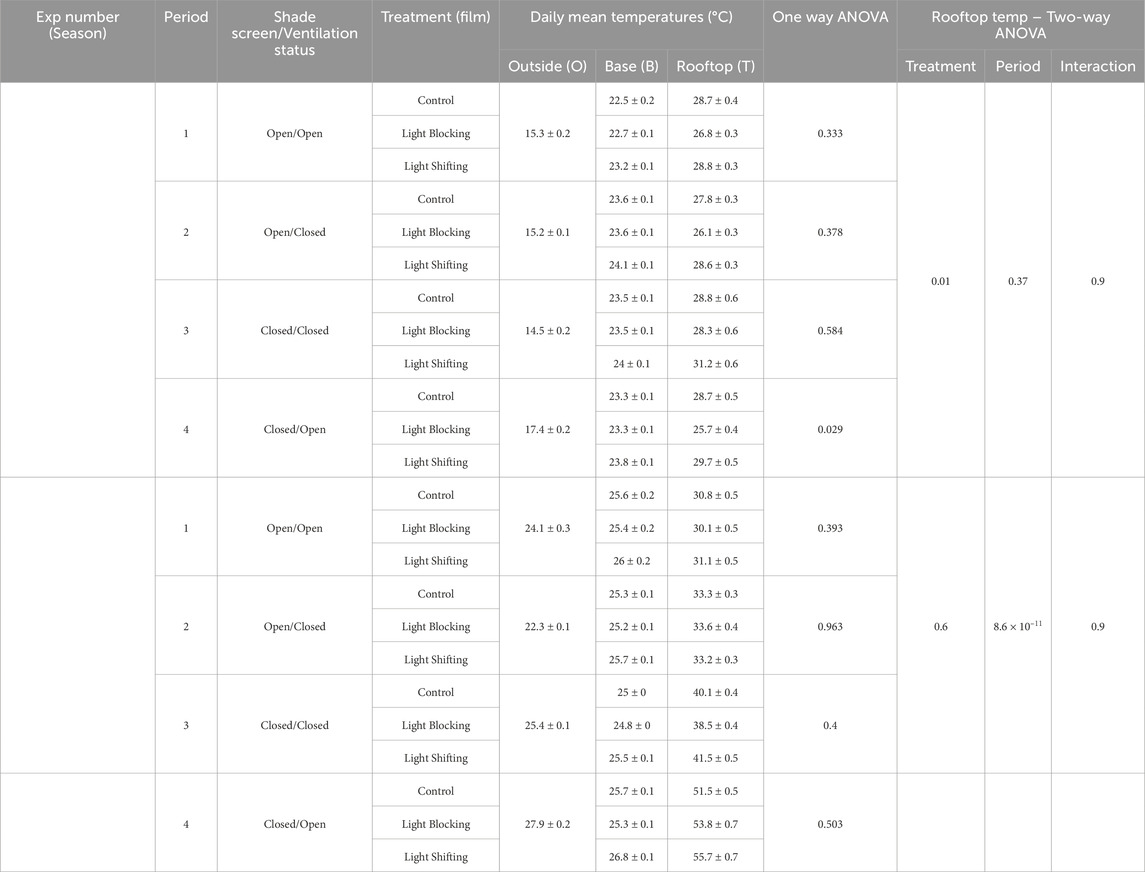
Table 5. Descriptive statistics and analysis of variance (ANOVA) of air temperatures at base, rooftop and outside during winter experiment 1 (E1) and summer experiment 2 (E2).
Statistical analyses were performed using R statistical programming software R Core Team (2024). Linear regression examined the bivariant relationship among parameters over LSF, LBF and Control. p ≤ 0.05 was considered as statistical significance. Levene’s test from the car package was used to test the homogeneity of variance. Welch’s t-test for unequal variances was used for parameters showing unequal variance. Shapiro-Wilk test for normality was used to test the normal distribution. Parameters with non-normal distribution were then analysed using a non-parametric equivalent of one-way analysis of variance (ANOVA), the Kruskal–Wallis Test. Non-parametric two-way ANOVA was performed using the ranked transformation method. Other packages used included lubridate (for effective use of dates in plots), sciplot (for plotting), tidyverse and dplyr (for data manipulation), HIEv (for data download from local sever), and doBy (for calculating means and standard errors). The effects impact of light treatments and experiments and their interactions on energy consumption and temperature parameters were analysed using one-way and two-way ANOVA functions in the car package. The Tukey post hoc test was performed using TukeyHSD function in agricolae package. Linear modelling function in R was used for correlation analysis. The significance levels were non-significant (ns), *, **, and *** indicated p > 0.05, p ≤ 0.05, p ≤ 0.01, and p ≤ 0.001, respectively.
The total energy consumption (sum of the combined cooling and heating energy consumption) of each experimental period (shade screen-ventilation settings) was evaluated using the recorded instantaneous energy reading (Table 3). In winter, the period sum of energy consumption was highest in P2 at 1,670 kWh and lowest in P4 at 956 kWh (Table 3). Among individual light treatments in each period, both the maximum (324 KWh in P2) and minimum (117 KWh in P4) energy consumptions were observed only under the LBF. The most energy-efficient setup for winter was found to be P4 covered with the LBF. The highest energy consumption in winter was more than 2.75 times the lowest (Table 3).
In contrast, the summer experiment showed an opposite trend. The P4, which was the most energy-efficient in winter, had the highest period sum of energy consumption in summer at 4,232 kWh. All other periods (P1, P2, and P3) had lower and similar energy consumption levels, ranging from 3,176 kWh to 3,339 kWh (Table 3). Among individual light treatments in each period, the highest energy consumption (849 kWh) occurred with the shade screen closed and ventilation open (P4) under the LSF. In contrast, the lowest energy consumption (462.88 kWh) was observed when both the shade screen and ventilation were closed (P3) under the LBF. Interestingly, the ventilation setting P4 (shade screen closed and ventilation open) was more effective in reducing total energy consumption in winter, yet less effective in summer (Table 3).
It is worth noting that the light treatment and ventilation settings (periods) significantly affected the net SW and long-wave radiation in both winter and summer experiments. While periods P3 and P4 (shade screen closed in both periods) had significantly lower short-wave radiation than periods P1 and P2 (shade screen opened in both periods), LBF significantly reduced the short-wave radiation in all periods (−68% to −73%, p < 0.001) (Supplementary Table S2; Supplementary Figure S2). Moreover, compartment numbers C1, C3 and C5 (located on the northwest side of the facility) exhibited generally high total energy consumption compared to C2, C4 and C6 (located on the southeast side of the facility) depending on the period and light treatment (Table 3; Supplementary Figures S3, S4). For instance, the orientation effect was stronger in LBF in winter and in LSF in summer.
Overall, total energy consumption (across all periods and light treatments) during summer (14,072 kWh) was almost 3-fold higher than winter (4,928 kWh) and the LBF film with both shade/ventilation closed (P3) was more effective in reducing energy consumption in summer rather than LBF film with shade closed and ventilation open in winter.
The daily sum of combined energy consumption was compared by comparing “treatment” (light-altering glasshouse film) and “season” as well as “treatment” and “period” (shade screen-ventilation settings) factors (Table 4). The summer season showed a significantly higher mean energy consumption (increasing from 58.7 KWh to 195.4 KWh (+233%), p < 0.001) compared to winter (Table 4; Figure 2). When comparing energy consumption between treatment and period in each season, the summer season showed a statistically significant effect of light treatment (p < 0.04) and period (p < 0.009) on the mean energy consumption. In contrast, during the winter season there was no significant difference in daily energy consumption between treatment and period. Moreover, the lowest daily energy consumption was recorded (46.6 KWh) in P4 under Control while the highest energy consumption was recorded (76.2 KWh) in P2 under the LBF during the winter season (Table 4).
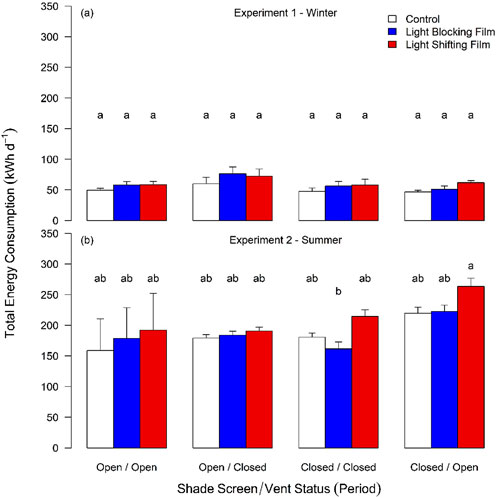
Figure 2. Effect of light-altering films on the total (combined) energy consumption across seasons and periods. Bar plot depicting combined energy consumption during Period 1 (Shade screen open and Ventilation open), Period 2 (Shade screen open and Ventilation closed), Period 3 (Shade screen closed and Ventilation closed) and Period 4 (Shade screen closed and Ventilation open) – Under light shifting film, Under light blocking film, and Under control film in (a) Experiment 1 (Winter), (b) Experiment 2 (Summer). Values are means ± standard errors.
When comparing energy consumption among treatments in each period, a significant increase (+33%, p = 0.02) in energy consumption (evident from one-way ANOVA) was observed for the LSF in P4 during winter (despite a non-significant impact of light treatment evident from two-way ANOVA; p < 0.08) and in P3 (+19%; p < 0.01) and P4 (+20%; p < 0.02) during summer (Table 4; Figure 2). The LSF exhibited the largest mean combined energy consumption compared to LBF and Control glass, except in P2 during winter (Table 4). Within individual periods, light treatment significantly affected energy consumption in P4 (shade screen closed and ventilation open) during winter. In fact, the daily energy consumption under control treatments was the lowest across all periods, compared to that of the LBF and LSF. This could be attributed to the low rooftop temperature during the winter season relative to summer. Similarly, in summer, the daily energy consumption under the control treatment was the lowest across all periods except P3, compared to that of the LBF and LSF. Moreover, the impact of compartment orientation on mean total energy consumption was not statistically significant (Supplementary Figures S3, S4). Overall, while the mean combined energy consumption was significantly higher in summer compared to winter, the treatment and ventilation settings combined reduced energy consumption only in summer.
Winter mean rooftop level temperatures ranged between 25.7°C and 31.2°C and the summer mean rooftop level temperatures ranged between 30.1°C and 55.7°C indicating the maximum mean rooftop level temperatures in summer were significantly higher compared to winter (Table 5; Figures 3, 4). The rooftop level temperatures using “treatment” (light-altering glasshouse film) versus “period” (shade screen-ventilation settings) factors displayed a significant effect of the light treatment on rooftop temperatures only during winter and ventilation settings (period) only during summer (Table 5). During winter, the LBF significantly reduced rooftop level temperatures (−10%, p = 0.03) in Period 4 (Table 5). In contrast, there was a significant increase in rooftop temperatures (p < 3.8 × 10⁻⁶) from periods 1 to 4 during summer, that is the period 4 rooftop temperature was 75% higher than Period 1 (Table 5). There was a significant effect of light treatment on both energy consumption and rooftop-level temperature in period 4 during winter, and a significant effect of the period on both energy consumption and rooftop temperatures during summer. Therefore, there was a significant effect of light treatment on (i) energy consumption under ventilation settings of shade screen closed and ventilation open (P4) and (ii) rooftop temperatures during winter.

Figure 3. Correlation between daily mean outside air temperatures and daily mean rooftop air temperatures. (a) shows the effect of seasons. Experiments 1 and 2 are depicted in sky blue and orange, respectively and periods (shade screen/ventilation status) 1, 2, 3 and 4 are shown using circle, triangle, plus and cross symbols respectively. (b) shows the effect of light treatments. Experiments 1 and 2 are shown using circle and square symbols, respectively and light treatments light shifting film (LSF), light blocking film (LBF) and control are shown in red, blue and grey respectively.
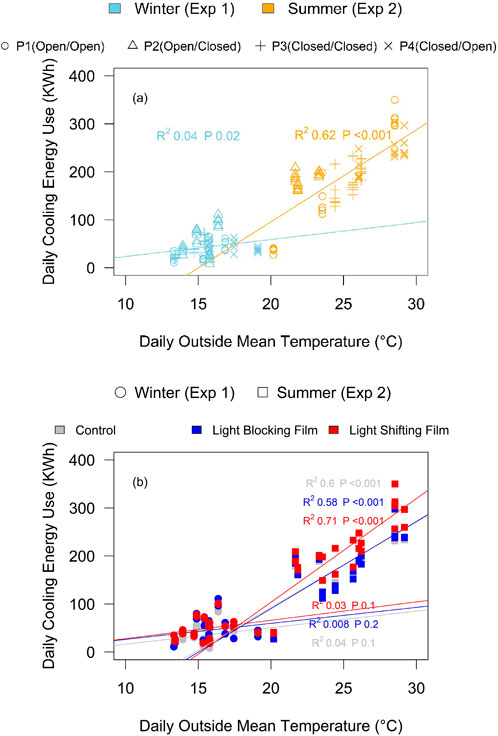
Figure 4. Correlation between daily cooling energy use and daily mean outside temperatures. (a) shows the effect of seasons. Experiments 1 and 2 are depicted in sky blue and orange, respectively and periods (shade screen/ventilation status) 1, 2, 3 and 4 are shown using circle, triangle, plus and cross symbols respectively. (b) shows effect of light treatments. Experiments 1 and 2 are shown using circle and square symbols, respectively and light treatments light shifting film (LSF), light blocking film (LBF) and control are shown in red, blue and grey respectively.
Next, we analysed the relationships between daily energy consumption, outdoor temperature and rooftop temperature were considered across periods (shade screen-ventilation settings) and light treatments during both winter and summer seasons. Daily outside and rooftop mean air temperatures showed a significant positive correlation during summer (R2 = 0.60, p < 0.001) but not during winter (R2 = 0.02, p < 0.06) (Figure 3A). However, the correlation between daily outside and rooftop mean air temperatures was unaffected by the light treatment during both winter and summer seasons (Figure 3B). Daily cooling energy consumption showed a significant positive correlation with daily outside mean air temperatures during summer (R2 = 0.62, p < 0.001) but not winter (R2 = 0.04, p < 0.02) (Figure 4A). While the daily cooling energy consumption showed a stronger correlation with outside mean air temperature under the LSF (R2 = 0.71, p < 0.001) compared to the LBF (R2 = 0.58, p < 0.001) or control (R2 = 0.6, p < 0.001) during summer, there was no significant correlation between the daily cooling energy consumption and outside mean air temperatures across light treatments during winter (Figure 4B). The daily cooling energy consumption showed a significant positive correlation with daily rooftop mean air temperatures during both summer (R2 = 0.41, p < 0.001) and winter (R2 = 0.31, p < 0.02) (Figure 5A). The correlation between daily cooling energy consumption and the rooftop air temperatures appeared to be unaffected by the light treatment during summer yet the daily cooling energy consumption showed a stronger correlation with rooftop mean air temperatures when using the LSF (R2 = 0.46, p < 0.001) and control (R2 = 0.45, p < 0.001) when compared to the LBF during winter (R2 = 0.29, p < 0.001; Figure 5B). In summary, there was a large increase in mean rooftop temperature, and hence higher cooling energy consumption, with a small increase in outside temperature across all periods, indicating incoming radiation contributed to heating. Furthermore, the light treatments slightly modified the relationships between daily cooling energy consumption, daily mean rooftop temperature, and daily outside temperature (Figures 3–5).
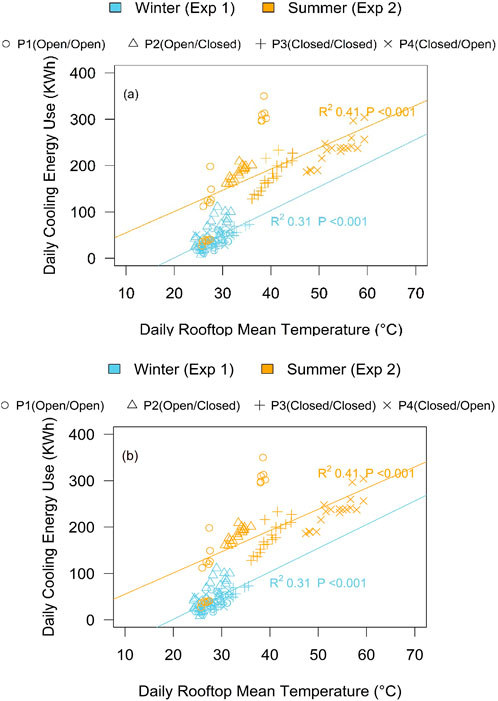
Figure 5. Correlation between daily cooling energy use and mean outside rooftop temperatures. (a) shows the effect of seasons on the correlation between daily cooling energy use and daily rooftop mean temperatures Experiments 1 and 2 are shown using circle and square symbols, respectively and light treatments light shifting film (LSF), light blocking film (LBF) and control are shown in red, blue and grey respectively. (b) shows correlation between daily cooling energy use and daily rooftop mean temperatures. Experiments 1 and 2 are shown using circle and square symbols, respectively and light treatments light shifting film (LSF), light blocking film (LBF) and control are shown in red, blue and grey respectively.
To ascertain if diurnal changes affected the relationship between energy consumption, outside temperature and rooftop-temperature during winter, we compared P2 and P4, previously identified as the worst and best configurations, respectively in terms of combined energy consumption (Samaranayake et al., 2021). P2 had the least favourable combination of ventilation settings with the highest daily energy consumption and second highest rooftop temperature, whereas P4 was the most favourable combination of ventilation settings, exhibiting the lowest daily energy consumption and the lowest rooftop temperature (Tables 4, 5; Figure 6).
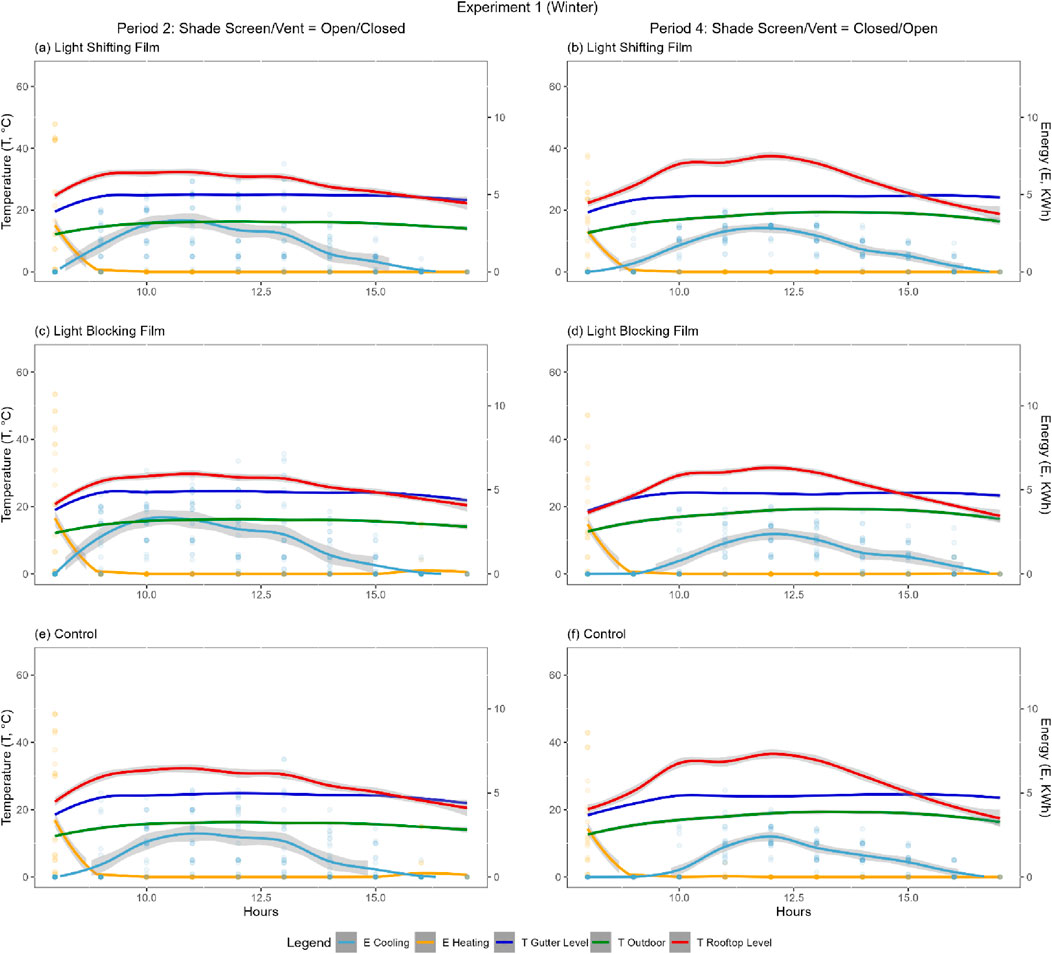
Figure 6. Temperature and energy use in Period 2 and Period 4 under light shifting film, light blocking film, and control in Winter. Temperature and energy use in Period 2 (Shade screen open and Ventilation closed) and Period 4 (Shade screen closed and Ventilation open) – (a, b) Under light shifting film, (c, d) Under light blocking film, and (e, f) Under control in Experiment 1 (winter season). Air temperatures collected at the gutter level, rooftop level, and outside are depicted in blue, red, and green lines respectively. Energy use on cooling and heating are depicted over time using sky blue and orange colour shaded regions.
Periods 2 and 4 showed stable ambient gutter level and outdoor temperatures with negligible diurnal changes, but rooftop level temperatures peaked in the middle of the day with corresponding diurnal changes in cooling energy use (Figure 6) indicating the accumulation of heat could be due to incoming radiation. P2 showed slightly higher combined energy use than P4. This could be attributed to the open shade screen and closed ventilation status of P2 which allowed incoming radiation and heat retention respectively in contrast to the closed shade screen open ventilation status of P4 which blocks incoming radiation and heat escape respectively. Furthermore, light treatment significantly affected the rooftop level temperatures and cooling energy use in P4 but not in P2 (Tables 4, 5; Figure 6). In P4, LSF showed significantly higher energy consumption (Table 4, One-Way ANOVA p = 0.02) than LBF which could be explained by significantly high rooftop temperatures (Table 5, One-Way ANOVA p = 0.029) in LSF compared to LBF. Overall, there is a strong relationship between combined daily energy consumption and rooftop temperature, particularly the lowest daily energy consumption correlates with a low rooftop-level temperature in P4 in winter.
We considered all four periods (shade screen and ventilation settings) for further analysis of diurnal changes in the correlation between energy consumption and rooftop-level temperature in summer as both light treatment and period significantly affected the energy consumption (Table 4) and the rooftop temperature (Table 5). While P1 exhibited the lowest daily energy consumption and rooftop temperature, P4 exhibited the highest daily energy consumption and rooftop temperature in summer (Table 4; Figure 2) emphasising the strong correlation between energy consumption and rooftop temperature (Figure 5). Despite stable ambient gutter level and outdoor temperatures with negligible diurnal changes, rooftop temperatures were significantly higher in P4 compared to P2 and peaked during morning hours with corresponding diurnal changes in cooling energy only in P4 (Figure 7). The P4 rooftop temperatures were generally high in the morning hours (from the monitored start time 8 am to 12 pm) and started to decline after midday. Furthermore, energy consumption was generally high in all periods under LSF with statistically significant increases in P3 (p = 0.01) and P4 (p = 0.02). In summary, compared to all other periods, P4 with closed shade screen and open ventilation exhibited the highest rooftop temperatures and consequently high energy consumption for cooling during the summer season which has higher outside temperatures.
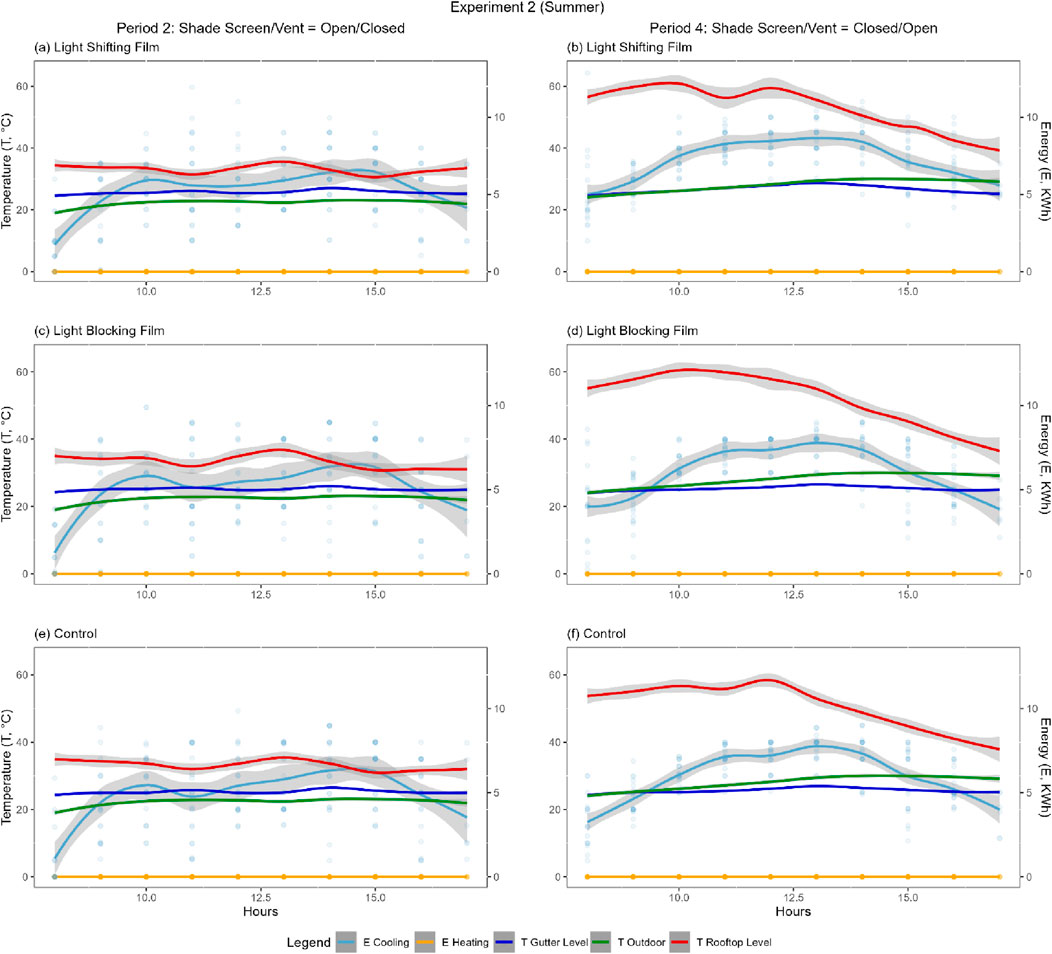
Figure 7. Temperature and energy use in Period 2 and Period 4 under light shifting film, light blocking film, and control in Summer. Temperature and energy use in Period 2 (Shade screen open and Ventilation closed) and Period 4 (Shade screen closed and Ventilation open) – (a, b) Under light shifting film (LBF), (c, d) Under light blocking film, and (e, f) Under control film in Experiment 2 (Summer season). Air temperatures collected at the gutter level, rooftop level, and outside are depicted in blue, red, and green lines respectively. Energy use on cooling and heating are depicted over time using sky blue and orange colour shaded regions.
This study investigated energy consumption under different light-altering methods and ventilation settings across winter and summer in a high-tech glasshouse in a subtropical climate of Eastern Australia. The overall energy consumption strongly depended on light-altering methods, ventilation settings and meteorological conditions (external temperature). Since cooling energy consumption in protected cropping is found to be a significant portion of total energy consumption in many regions in Australia, the optimal energy cost efficiency can be best achieved during the winter season, compared to that of the summer season. The LBF was identified as the most effective for optimising total energy consumption in winter with ventilation settings of ventilation open and shades closed, and in summer with both ventilation and shades closed. In conclusion, during the summer, the most efficient combination involves LBF light treatment with both ventilation and shades closed. In contrast, for winter, the optimal configuration is LBF light treatment with ventilation open and shades closed (Table 3). Given that LBF light treatment is the most effective for optimising total energy consumption in both winter and summer, the impact of ventilation settings can be considered a significant aspect of control for reducing cooling energy consumption, particularly in summer, and achieving overall energy consumption (Rabbi et al., 2019; Samaranayake et al., 2021). We concluded that the combined effect of light-altering methods and ventilation settings on optimal energy consumption is much higher than the sum of individual effects. The sum of combined effects can be used as a guide for developing a framework for selecting the right combinations of ventilation settings and light-altering methods under different meteorological conditions for optimum energy consumption during crop cycles.
While combining shading with cooling methods can lower greenhouse air temperature (−5°C–10°C), increase relative humidity (+15–20%), and reduce solar radiation (−30%–50%) in sunny regions, shading materials act as insulators, maintaining greenhouse air temperature 5°C higher than outside and saving 15%–20% on heating energy in cold regions (Montero et al., 2013; Ahemd et al., 2016). In the current study, the summer recorded significantly higher energy consumption relative to winter, and light treatment and ventilation settings' impact on energy consumption was further modified by significant outside temperature differences between the summer and winter seasons. In winter, both ventilation settings (periods) and light treatment showed slight differences in total (overall sum) energy consumption (Table 3); however, these differences were masked by within-treatment variation between compartments potentially due to their orientation (SE and NW) when mean energy consumption was compared using two-way ANOVA (Table 4). The impact of orientation can be explained by high heating due to the afternoon radiation in compartments C1, C3 and C5 compared to C2, C4 and C6 (Soussi et al., 2022).
Despite the non-significant impact of either the light treatment or period (shade screen ventilation setting) on mean combined energy consumption in winter (Table 4), the total (overall sum) of the energy consumption showed significantly higher energy consumption under open shade screen and closed vents (Table 3) that allow heat accumulation due to incoming radiation and heat-trapping, respectively. Thus, the effect of shade screen ventilation settings on energy consumption was more prominent than the light-altering film treatment during the winter season, which could be attributed to less influence of the low outside temperature on the overall temperature of the facility. In contrast, both the mean and absolute total energy consumption (Tables 3, 4) significantly increased from periods P1 to P4, and mean energy consumption was significantly higher under the LSF in P3 and P4 during summer (Table 4). Thus, P4 with the highest energy consumption allows heat transfer through open vents and heat build-up via closed shade screens in hot summer conditions, and high energy consumption under LSF during summer can be potentially due to the North to South sequence of LSF, LBF and Control compartment locations which leads to a more light reception in LSF (Lin et al., 2022). Noteworthily, compartment 4 fitted with LBF recorded the lowest energy consumption in P4 and P3 of winter and summer respectively. Low energy consumption under LBF (when not affected by afternoon heating, e.g., compartment 3) is in line with previous studies in eggplant (brinjal) that have demonstrated low energy consumption under LBF (Chavan et al., 2020; Lin et al., 2022). Furthermore, the inability of ventilation settings to reduce energy consumption in summer can be explained by the physical phenomenon of no effect of pushing hot air out of the room when the inside temperature is already above the outside temperature at different dates and times of the summer season. This observation is aligned with the concept of heat transfer, particularly the concept of “natural convection” and “thermal equilibrium” where the effectiveness of ventilation depends on the temperature difference between the inside and outside. When the temperatures are similar, or the inside temperature is higher, the ventilation system cannot efficiently expel heat (Ganguly and Ghosh, 2010; Kreith et al., 2011).
In addition, a significant reduction in net short-wave (SW) under LBF did not correlate with combined energy consumption. However, despite a significant blockage in net SW radiation by LBF the energy on cooling was not reduced under LBF. This could be explained by the transfer of heat through the convection of the glass and ventilation (Lin et al., 2022). The best combination of ventilation and shade screen settings for optimal energy consumption depended on the season and the effect of light treatment on energy consumption noted in this research is aligned with the notion of improving light transmission and solar energy capture while promoting energy-saving (He et al., 2021). Overall, there was a shift in the effect of the period on energy consumption in summer compared to winter. P4, the best period in terms of efficient energy consumption in winter became the least effective period with the highest energy consumption in summer (Tables 3, 4; Figure 2). This could be attributed to the following factors, (i) very high outside temperature during summer (e.g., the higher average temperature of 17.4 in winter, compared to 27.9 in summer), leading to significantly high rooftop temperature in all periods (e.g., 55.7 in P4), and (ii) less effectiveness of ventilation settings in high outside temperature.
Since summer energy consumption is significantly higher than that in winter and much of the total energy is attributed to cooling (even in the winter season), temperature profile (particularly the warmer temperatures) plays a significant role in the energy consumption. The roof vent affects the temperature and air velocity at the roof level and vent closure increases the roof temperatures as the air becomes stagnant above the height of the roof vent (Akrami et al., 2020). In the current study, the rooftop temperature and hence cooling energy use positively correlated with outside air temperatures in summer but not winter suggesting that outside temperatures contributed to an increase in the rooftop temperatures in summer but not in winter (Figures 3, 4). However, daily cooling energy use positively correlated with rooftop-level temperatures in both winter and summer (Figure 5) suggesting that rooftop-level temperatures were key drivers of energy consumption. Hence, the cooling energy consumption in the winter season may have been due to the incoming radiation and high rooftop temperatures preserved during the nighttime. This in conjunction with the lowest energy consumption recorded during P4 in winter suggests that mild outside air temperatures lead to heat build-up at the rooftop level and periodic ventilation opening during winter can release this heat build-up which demands cooling.
In addition, it is worth noting that open ventilation and closed shade screen in P4 during summer allowed extremely high rooftop temperatures because of the heat transfer from outside hot air to inside the glasshouse since early morning but not during P1 with open ventilation and open shade screen (Figure 7). This suggests the potential role of closed shade screens in contributing to extremely high rooftop temperatures in P4 during summer. Furthermore, while light-altering films did not affect the correlation between the rooftop temperature and outside air temperatures, periods significantly affected this correlation in only summer further confirming that overall light-altering films have no effect in either winter or summer, but periods affected rooftop temperature and hence energy consumption in summer. Taken together, significantly high energy consumption in summer compared to that in winter and the significant effect of light treatment on energy consumption in summer could be attributed to the high rooftop temperature of the facility in summer, influenced by high outside temperature.
An optimal strategy for energy management using multi-temperature acquisition points for opening/closing of ventilation and shade screens under each configuration could be used to improve the overall energy consumption efficiency of the selected protected cropping facility (Chavan et al., 2020; Samaranayake et al., 2020). The current study extends previous experiments that demonstrate the use of shade nets to improve microclimate, crop production, and crop quality while saving energy (Kittas et al., 2012; Zhang et al., 2022).
Since cooling energy consumption is a significant proportion of total energy consumption, the potential saving of cooling using the optimal conditions of light-altering methods and ventilation settings could be significant. Furthermore, significant cost savings can be achieved over a crop cycle using the optimal settings, by selecting an appropriate timeframe (i.e., start and end dates) for the crop cycle, depending on the meteorological conditions. The temperature profile significantly impacts the ventilation settings and light-altering methods that affect energy consumption. Therefore, selecting optimum ventilation settings and light-altering methods for minimal energy use requires considering the weather season. In this context, selecting the optimum settings in conjunction with the facility’s temperature profiles across varying meteorological conditions can inform the development of guidelines for scheduling crop cycles. Overall, these research findings can be used to develop a protected cropping operational framework of light-altering methods, and ventilation settings for optimum energy consumption, aligned with specific requirements of crop cycles and expected meteorological conditions.
The current study demonstrates optimal glasshouse energy management strategies by investigating energy consumption under different shading, light-altering and ventilation conditions. Key findings of this research study include (i) the effect of light treatment and shade screen ventilation settings on energy consumption changes with the seasons, and (ii) the significant role of rooftop level temperature as the primary driver of energy consumption in both winter and summer. These findings form a basis for selecting the best combination of light treatment methods and ventilation settings (opening or closing of ventilation and shade screens), using the most reliable temperature measurements within the facility, to reduce energy costs during 6–9 months of cropping cycles. However, there was a limitation to this research in that each experimental setting is run only for 3–4 days in two seasons (winter and summer).
The raw data supporting the conclusions of this article will be made available by the authors, without undue reservation.
SC: Data curation, Formal Analysis, Investigation, Methodology, Validation, Visualization, Writing–original draft, Writing–review and editing. PS: Conceptualization, Formal Analysis, Investigation, Methodology, Supervision, Validation, Visualization, Writing–original draft, Writing–review and editing. Y-CL: Conceptualization, Investigation, Methodology, Supervision, Validation, Writing–original draft, Writing–review and editing. CM: Investigation, Methodology, Validation, Writing–original draft, Writing–review and editing. WL: Investigation, Methodology, Validation, Writing–original draft, Writing–review and editing. CC: Funding acquisition, Validation, Writing–original draft, Writing–review and editing. Z-HC: Conceptualization, Funding acquisition, Investigation, Validation, Writing–original draft, Writing–review and editing. DT: Conceptualization, Funding acquisition, Investigation, Methodology, Project administration, Resources, Supervision, Validation, Writing–original draft, Writing–review and editing.
The author(s) declare that financial support was received for the research, authorship, and/or publication of this article. The study is funded by Horticulture Innovation Australia projects (MT13041, VG16070, VG17003, LP18000) and the Future Food Systems Cooperative Research Centre (Grant ID - P2-012).
We thank Terry Lin (Western Sydney University) for providing the Priva climate parameter description.
The authors declare that the research was conducted in the absence of any commercial or financial relationships that could be construed as a potential conflict of interest.
The authors declare that no Generative AI was used in the creation of this manuscript.
All claims expressed in this article are solely those of the authors and do not necessarily represent those of their affiliated organizations, or those of the publisher, the editors and the reviewers. Any product that may be evaluated in this article, or claim that may be made by its manufacturer, is not guaranteed or endorsed by the publisher.
The Supplementary Material for this article can be found online at: https://www.frontiersin.org/articles/10.3389/fenrg.2025.1515479/full#supplementary-material
Adem, G. D., Chen, G., Shabala, L., Chen, Z.-H., and Shabala, S. (2020). GORK channel: a master Switch of plant Metabolism? Trends Plant Sci. 25, 434–445. doi:10.1016/j.tplants.2019.12.012
Ahemd, H. A., Al-Faraj, A. A., and Abdel-Ghany, A. M. (2016). Shading greenhouses to improve the microclimate, energy and water saving in hot regions: a review. Sci. Hortic. 201, 36–45. doi:10.1016/j.scienta.2016.01.030
Ahmadi, L., Hao, X., and Tsao, R. (2018). The effect of greenhouse covering materials on phytochemical composition and antioxidant capacity of tomato cultivars. J. Sci. Food Agric. 98, 4427–4435. doi:10.1002/jsfa.8965
Akrami, M., Javadi, A. A., Hassanein, M. J., Farmani, R., Dibaj, M., Tabor, G. R., et al. (2020). Study of the effects of vent configuration on Mono-span greenhouse ventilation using Computational Fluid Dynamics. Sustainability 12, 986. doi:10.3390/su12030986
Alsadon, A., Al-Helal, I., Ibrahim, A., Abdel-Ghany, A., Al-Zaharani, S., and Ashour, T. (2016). The effects of plastic greenhouse covering on cucumber (Cucumis sativus L.) growth. Ecol. Eng. 87, 305–312. doi:10.1016/j.ecoleng.2015.12.005
Aroca-Delgado, R., Pérez-Alonso, J., Callejón-Ferre, Á.-J., and Díaz-Pérez, M. (2019). Morphology, yield and quality of greenhouse tomato cultivation with flexible photovoltaic rooftop panels (Almería-Spain). Sci. Hortic. 257, 108768. doi:10.1016/j.scienta.2019.108768
Bambara, J., and Athienitis, A. K. (2019). Energy and economic analysis for the design of greenhouses with semi-transparent photovoltaic cladding. Renew. Energy 131, 1274–1287. doi:10.1016/j.renene.2018.08.020
Chavan, S. G., Chen, Z.-H., Ghannoum, O., Cazzonelli, C. I., and Tissue, D. T. (2022). Current Technologies and Target crops: a review on Australian protected cropping. Crops 2, 172–185. doi:10.3390/crops2020013
Chavan, S. G., He, X., Maier, C., Alagoz, Y., Anwar, S., Chen, Z.-H., et al. (2023). An energy-saving glasshouse film reduces seasonal, and cultivar dependent Capsicum yield due to light limited photosynthesis. Ann. Agric. Sci. 68, 21–35. doi:10.1016/j.aoas.2023.04.001
Chavan, S. G., Maier, C., Alagoz, Y., Filipe, J. C., Warren, C. R., Lin, H., et al. (2020). Light-limited photosynthesis under energy-saving film decreases eggplant yield. Food Energy Secur 9, e245. doi:10.1002/fes3.245
Cossu, M., Yano, A., Li, Z., Onoe, M., Nakamura, H., Matsumoto, T., et al. (2016). Advances on the semi-transparent modules based on micro solar cells: first integration in a greenhouse system. Appl. Energy 162, 1042–1051. doi:10.1016/j.apenergy.2015.11.002
Del Borghi, A., Gallo, M., Strazza, C., and Del Borghi, M. (2014). An evaluation of environmental sustainability in the food industry through Life Cycle Assessment: the case study of tomato products supply chain. J. Clean. Prod. 78, 121–130. doi:10.1016/j.jclepro.2014.04.083
Diouf, I., Derivot, L., Koussevitzky, S., Carretero, Y., Bitton, F., Moreau, L., et al. (2020). Genetic basis of phenotypic plasticity and genotype × environment interactions in a multi-parental tomato population. J. Exp. Bot. 71, 5365–5376. doi:10.1093/jxb/eraa265
Ezzaeri, K., Fatnassi, H., Bouharroud, R., Gourdo, L., Bazgaou, A., Wifaya, A., et al. (2018). The effect of photovoltaic panels on the microclimate and on the tomato production under photovoltaic canarian greenhouses. Sol. Energy 173, 1126–1134. doi:10.1016/j.solener.2018.08.043
Fedoroff, N. (2015). Food in a future of 10 billion. Agric. Food Secur. 4, 11. doi:10.1186/s40066-015-0031-7
Food and Agriculture Organization (2016). Database on arable land. Kwintsheul, Netherlands: Glasimport Greenhouses BV. Available online at: https://data.worldbank.
Ganguly, A., and Ghosh, S. (2010). A review of ventilation and cooling Technologies in Agricultural greenhouse Application. Iran. J. Energy Environ. 2.
Geilfus, C.-M., and Geilfus, C.-M. (2019). Protected cropping in horticulture. Control. Environ. Hortic. Improv. Qual. Veg. Med. Plants, 7–17. doi:10.1007/978-3-030-23197-2_2
Golzar, F., Heeren, N., Hellweg, S., and Roshandel, R. (2018). A novel integrated framework to evaluate greenhouse energy demand and crop yield production. Renew. Sustain. Energy Rev. 96, 487–501. doi:10.1016/j.rser.2018.06.046
Gonzalez Guzman, M., Cellini, F., Fotopoulos, V., Balestrini, R., and Arbona, V. (2022). New approaches to improve crop tolerance to biotic and abiotic stresses. Physiol. Plant. 174, e13547. doi:10.1111/ppl.13547
Gruda, N., Bisbis, M., and Tanny, J. (2019). Impacts of protected vegetable cultivation on climate change and adaptation strategies for cleaner production–a review. J. Clean. Prod. 225, 324–339. doi:10.1016/j.jclepro.2019.03.295
Hassanien, R. H. E., Li, M., and Yin, F. (2018). The integration of semi-transparent photovoltaics on greenhouse roof for energy and plant production. Renew. Energy 121, 377–388. doi:10.1016/j.renene.2018.01.044
He, K., Chen, D., Sun, L., Liu, Z., and Huang, Z. (2015). The effect of vent openings on the microclimate inside multi-span greenhouses during summer and winter seasons. Eng. Appl. Comput. Fluid Mech. 9, 399–410. doi:10.1080/19942060.2015.1061553
He, X., Chavan, S. G., Hamoui, Z., Maier, C., Ghannoum, O., Chen, Z.-H., et al. (2022). Smart glass film reduced Ascorbic Acid in red and orange capsicum fruit cultivars without impacting Shelf Life. Plants 11, 985. doi:10.3390/plants11070985
He, X., Maier, C., Chavan, S. G., Zhao, C.-C., Alagoz, Y., Cazzonelli, C., et al. (2021). Light-altering cover materials and sustainable greenhouse production of vegetables: a review. Plant Growth Regul. 95, 1–17. doi:10.1007/s10725-021-00723-7
He, X., Solis, C. A., Chavan, S. G., Maier, C., Wang, Y., Liang, W., et al. (2023). Novel transcriptome networks are associated with adaptation of capsicum fruit development to a light-blocking glasshouse film. Front. Plant Sci. 14, 1280314. doi:10.3389/fpls.2023.1280314
Khoshnevisan, B., Shariati, H. M., Rafiee, S., and Mousazadeh, H. (2014). Comparison of energy consumption and GHG emissions of open field and greenhouse strawberry production. Renew. Sustain. Energy Rev. 29, 316–324. doi:10.1016/j.rser.2013.08.098
Kittas, C., Katsoulas, N., Rigakis, V., Bartzanas, T., and Kitta, E. (2012). Effects on microclimate, crop production and quality of a tomato crop grown under shade nets. J. Hortic. Sci. Biotechnol. 87, 7–12. doi:10.1080/14620316.2012.11512822
Lambin, E. F., and Meyfroidt, P. (2011). Global land use change, economic globalization, and the looming land scarcity. Proc. Natl. Acad. Sci. 108, 3465–3472. doi:10.1073/pnas.1100480108
Lee, S., Kim, S.-H., Woo, B.-K., Son, W.-T., and Park, K.-S. (2012). A study on the energy efficiency improvement of greenhouses—with a focus on the theoretical and experimental analyses. J. Mech. Sci. Technol. 26, 3331–3338. doi:10.1007/s12206-012-0802-z
Lin, T., Goldsworthy, M., Chavan, S., Liang, W., Maier, C., Ghannoum, O., et al. (2022). A novel cover material improves cooling energy and fertigation efficiency for glasshouse eggplant production. Energy 251, 123871. doi:10.1016/j.energy.2022.123871
Lin, T., Maier, C. R., Liang, W., Klause, N., He, J., Tissue, D. T., et al. (2024). A light-blocking greenhouse film differentially impacts climate control energy use and capsicum production. Front. Energy Res. 12. doi:10.3389/fenrg.2024.1360536
Liu, Y., Høgh-Jensen, H., Egelyng, H., and Langer, V. (2010). Energy efficiency of organic pear production in greenhouses in China. Renew. Agric. Food Syst. 25, 196–203. doi:10.1017/s1742170510000037
Loik, M. E., Carter, S. A., Alers, G., Wade, C. E., Shugar, D., Corrado, C., et al. (2017). Wavelength-selective solar photovoltaic systems: Powering greenhouses for plant growth at the food-energy-water Nexus. Earths Future 5, 1044–1053. doi:10.1002/2016EF000531
Mahajan, G., and Singh, K. (2006). Response of greenhouse tomato to irrigation and fertigation. Agric. Water Manag. 84, 202–206. doi:10.1016/j.agwat.2006.03.003
Maier, C. R., Chavan, S. G., Klause, N., Liang, W., Cazzonelli, C. I., Ghannoum, O., et al. (2023). Light blocking film in a glasshouse impacts Capsicum annuum L. yield differentially across planting season. Front. Plant Sci. 14, 1277037. doi:10.3389/fpls.2023.1277037
Maier, C. R., Chen, Z.-H., Cazzonelli, C. I., Tissue, D. T., and Ghannoum, O. (2022). Precise phenotyping for improved crop quality and management in protected cropping: a review. Crops 2, 336–350. doi:10.3390/crops2040024
Moghaddam, P. R., Feizi, H., and Mondani, F. (2011). Evaluation of tomato production systems in terms of energy use efficiency and economical analysis in Iran. Not. Sci. Biol. 3, 58–65. doi:10.15835/nsb346279
Montero, J., Muñoz, P., Sánchez-Guerrero, M. C., Medrano, E., Piscia, D., and Lorenzo, P. (2013). Shading screens for the improvement of the night time climate of unheated greenhouses. Span. J. Agric. Res. 13, 90–102. doi:10.5424/sjar/2013111-411-11
Mormile, P., Rippa, M., Graziani, G., and Ritieni, A. (2019). Use of greenhouse-covering films with tailored UV-B transmission dose for growing ‘medicines’ through plants: rocket salad case. J. Sci. Food Agric. 99, 6931–6936. doi:10.1002/jsfa.9980
NSW (2007). Orientation and siting a greenhouse. Available online at: https://www.dpi.nsw.gov.au/agriculture/horticulture/greenhouse/structures-and-technology/siting (Accessed February 19, 2025).
Rabbi, B., Chen, Z.-H., and Sethuvenkatraman, S. (2019). Protected cropping in warm climates: a review of humidity control and cooling methods. Energies 12, 2737. doi:10.3390/en12142737
R Core Team (2024). R: a language and environment for statistical computing_. Vienna, Austria: R Foundation for Statistical Computing. Available online at: https://www.R-project.org/.
Samaranayake, P., Liang, W., Chen, Z.-H., Tissue, D., and Lan, Y.-C. (2020). Sustainable protected cropping: a case study of seasonal impacts on greenhouse energy consumption during capsicum production. Energies 13, 4468. doi:10.3390/en13174468
Samaranayake, P., Maier, C., Chavan, S., Liang, W., Chen, Z.-H., Tissue, D. T., et al. (2021). Energy minimisation in a protected cropping facility using multi-temperature acquisition points and control of ventilation settings. Energies 14, 6014. doi:10.3390/en14196014
Shabala, S., Chen, G., Chen, Z.-H., and Pottosin, I. (2020). The energy cost of the tonoplast futile sodium leak. New Phytol. 225, 1105–1110. doi:10.1111/nph.15758
Shen, Y., Wei, R., and Xu, L. (2018). Energy consumption prediction of a greenhouse and Optimization of daily average temperature. Energies 11, 65. doi:10.3390/en11010065
Smagghe, F., Spooner-Hart, R., Chen, Z.-H., and Donovan-Mak, M. (2023). Biological control of arthropod pests in protected cropping by employing entomopathogens: efficiency, production and safety. Biol. Control 186, 105337. doi:10.1016/j.biocontrol.2023.105337
Soussi, M., Chaibi, M. T., Buchholz, M., and Saghrouni, Z. (2022). Comprehensive review on climate control and cooling systems in greenhouses under hot and arid conditions. Agronomy 12, 626. doi:10.3390/agronomy12030626
Stanhill, G. (1980). The energy cost of protected cropping: a comparison of six systems of tomato production. J. Agric. Eng. Res. 25, 145–154. doi:10.1016/0021-8634(80)90055-4
Tani, A., Shiina, S., Nakashima, K., and Hayashi, M. (2014). Improvement in lettuce growth by light diffusion under solar panels. J. Agric. Meteorol. 70, 139–149. doi:10.2480/agrmet.d-14-00005
Torrellas, M., Antón, A., Ruijs, M., Victoria, N. G., Stanghellini, C., and Montero, J. I. (2012). Environmental and economic assessment of protected crops in four European scenarios. J. Clean. Prod. 28, 45–55. doi:10.1016/j.jclepro.2011.11.012
Wang, N.-H., Zhou, X.-Y., Shi, S.-H., Zhang, S., Chen, Z.-H., Ali, M. A., et al. (2023). An miR156-regulated nucleobase-ascorbate transporter 2 confers cadmium tolerance via enhanced anti-oxidative capacity in barley. J. Adv. Res. 44, 23–37. doi:10.1016/j.jare.2022.04.001
Zhang, M., Yan, T., Wang, W., Jia, X., Wang, J., and Klemeš, J. J. (2022). Energy-saving design and control strategy towards modern sustainable greenhouse: a review. Renew. Sustain. Energy Rev. 164, 112602. doi:10.1016/j.rser.2022.112602
Keywords: temperature, light-altering film, greenhouse control systems, energy consumption, cooling energy, heating energy, ventilation, seasons
Citation: Chavan SG, Samaranayake P, Lan Y-C, Maier C, Liang W, Cazzonelli CI, Chen Z-H and Tissue DT (2025) Optimal energy-efficient shade screen and ventilation control settings for a greenhouse covered with light-altering films. Front. Energy Res. 13:1515479. doi: 10.3389/fenrg.2025.1515479
Received: 22 October 2024; Accepted: 13 March 2025;
Published: 24 March 2025.
Edited by:
Solomon Giwa, Olabisi Onabanjo University, NigeriaReviewed by:
Giovanni Ciampi, Università degli Studi della Campania Luigi Vanvitelli, ItalyCopyright © 2025 Chavan, Samaranayake, Lan, Maier, Liang, Cazzonelli, Chen and Tissue. This is an open-access article distributed under the terms of the Creative Commons Attribution License (CC BY). The use, distribution or reproduction in other forums is permitted, provided the original author(s) and the copyright owner(s) are credited and that the original publication in this journal is cited, in accordance with accepted academic practice. No use, distribution or reproduction is permitted which does not comply with these terms.
*Correspondence: Sachin Gorakshnath Chavan, cy5jaGF2YW5Ad2VzdGVybnN5ZG5leS5lZHUuYXU=; Premaratne Samaranayake, cC5zYW1hcmFuYXlha2VAd2VzdGVybnN5ZG5leS5lZHUuYXU=
‡Present address: Yi-Chen Lan, College of Science and Engineering, Fu Jen Catholic University, New Taipei City, Taiwan
†These authors have contributed equally to this work and share first authorship
Disclaimer: All claims expressed in this article are solely those of the authors and do not necessarily represent those of their affiliated organizations, or those of the publisher, the editors and the reviewers. Any product that may be evaluated in this article or claim that may be made by its manufacturer is not guaranteed or endorsed by the publisher.
Research integrity at Frontiers
Learn more about the work of our research integrity team to safeguard the quality of each article we publish.