
94% of researchers rate our articles as excellent or good
Learn more about the work of our research integrity team to safeguard the quality of each article we publish.
Find out more
ORIGINAL RESEARCH article
Front. Energy Res., 25 November 2024
Sec. Sustainable Energy Systems
Volume 12 - 2024 | https://doi.org/10.3389/fenrg.2024.1513860
This article is part of the Research TopicClean Energy and Low-carbon TransportationView all 6 articles
Achieving the dual goals of improving water quality and reducing carbon emissions requires a systematic study of the combined effects of economic and environmental policies on industrial systems. A CGE-IWCR model is developed to examine the long-term evolution of industrial economic and environmental responses in the Yangtze River Economic Belt (YREB) under varying levels of carbon and water pollution taxes. The CGE-IWCE model offers several advantages: i) under the dual tax (carbon and water pollution tax) interventions, it can effectively forecast industrial CO2 and water pollution emissions driven by both macro and local factors from 2025 to 2060; ii) it quantitatively captures the interactions between various policy interventions, thereby providing guidance for comprehensive regional policy formulation. It is discovered that in the double-tax scenario, various combinations of carbon and water pollution taxes significantly impact direct carbon emissions and direct water pollution emissions, and from local consumption, imports, and exports in industrial sectors. Among them, the dual pressure of high carbon and water pollution taxes, which significantly raise production costs. In addition, increasing the carbon tax from 10 ¥/tonne to 50 ¥/tonne, the water pollution equivalent (WPE) reduction rate rises from 20.79% to 52.67% with the increase in the carbon tax from 2050 to 2060, when the water pollution tax is low. Between 2025 and 2060, the carbon tax plays a significant role in influencing the total industrial output change rate in YREB. from 2025 to 2060, the water pollution tax will play a more significant role in CO2 reduction in YREB’s industrial sector. The results will offer decision-making support for water pollution reduction and carbon mitigation in the YREB’s industrial sector, quantitatively identify the interactions between the dual taxes, and provide new insights for analyzing the impacts of pollution reduction and carbon mitigation policies.
China’s ecological environment quality has steadily improved, and carbon emission intensity has decreased (Fang et al., 2020; Song et al., 2022). However, the nation continues to face significant challenges in achieving both fundamental ecological improvements and the dual strategic goals of carbon peaking and carbon neutrality (Woon et al., 2023; Zhao et al., 2022). The demand for multi-objective governance in environmental protection is becoming more pronounced, while the tension between economic development and pollution reduction has intensified, further complicating the achievement of these strategic goals (Adejumo, 2020; Androniceanu et al., 2021; Armeanu et al., 2019; Simionescu et al., 2021). During the 14th Five-Year Plan period, these dual strategic goals will significantly affect the national energy structure and industrial development pathways (Hepburn et al., 2021; Li et al., 2019). The coordinated implementation of economic and environmental policies by the government serves as a powerful tool for promoting green transformation and optimizing resource allocation (Erkul and Türköz, 2024; Jiang et al., 2024; Mukhlynina, 2020). The implementation of each economic and environmental policy produces multifaceted effects. For example, carbon and water pollution taxes can effectively drive regional pollution reduction and carbon mitigation, but they may also hinder industrial growth and regional economic development (Guo and Huang, 2022; Kyei and Chitiga-Mabugu, 2021). Additionally, the simultaneous implementation of both taxes may further intensify these pressures. It is essential to coordinate the economic and environmental impacts to strike an optimal balance between economic development and environmental protection.
Previously, a substantial body of literature has previously explored the comprehensive effects of economic and environmental policies on both the economy and the environment (Sajwani et al., 2023; Yang et al., 2022). Economic policies influence the economic system not only through direct market regulation but also indirectly by affecting industries, resource allocation, and technological innovation, which in turn impact the environmental system (Lin and Zhou, 2022). For example, Noubissi et al. (2024) investigated the economic and environmental impacts of environmental protection policies across 36 OECD countries from 1994 to 2018, demonstrating that environmental taxes significantly reduce CO2 emissions in the manufacturing and transport sectors. Luo et al. (2023) explored the impact of industrial restructuring on greenhouse gas emission intensity in China, revealing that between 1994 and 2008, restructuring increased CO2 emission intensity, particularly in high-emission sectors, while its suppression of non-CO2 emissions was limited. Zhang et al. (2018) analyzed the impact of industrial restructuring on carbon emission reduction in China, using a dynamic factorization model to assess changes during five Five-Year Plan periods from 2006 to 2030. The findings indicate that industrial restructuring positively contributes to carbon emission reduction, with the effect varying across industries and sectors. Shafi et al. (2023)investigates the impact of green tax incentives, such as investment tax credits and income deductions, on environmental sustainability and climate change in developing countries. Chen et al. (2020) examined the impact of international cooperation, measured by political globalization, on CO2 emissions growth in 36 OECD countries from 1970 to 2016, finding that political globalization significantly reduces CO2 emissions growth, with robust effects across different sub-indices and controls. Environmental policies impact the environmental system not only through direct measures such as restricting resource use, setting emission standards, and enforcing pollution control, but also indirectly by shaping consumer behavior, influencing market demand, and promoting international cooperation, which in turn affect the economic system. Zhao et al. (2023) analyzed the impact of China’s National Plan for the Sustainable Development of Resource-based Cities on urban carbon emissions using panel data from 59 cities in four provinces. Zhu et al. (2022) developed an analytical model to examine the interaction between Renewable Electricity Standard and Renewable Energy Certificates policies, focusing on their effects on renewable energy investment and carbon emissions in electricity generation firms. Wang et al. (2015) employed a life cycle assessment to evaluate the environmental consequences of stricter sewage discharge standards for municipal wastewater treatment plants in China. Li et al. (2023) investigated the synergistic control of water pollution within China’s river basins, emphasizing the spatial spillover effects of environmental regulation across 27 provincial-level regions. Lazzarini et al. (2018) examined the effectiveness of eco-labels and guidelines in helping consumers choose environmentally sustainable foods, given that food production and consumption contribute significantly to households’ environmental impact. Chou et al. (2021) evaluated the impact of the China-US trade conflict on China’s international trade and its implications for climate policy, using the Global Trade Analysis Project model and input-output analysis to assess carbon emissions in trade. Nguyen et al. (2018) investigated the relationship between economic activities and water pollution in Vietnam from 2000 to 2011, focusing on total suspended solids and biological oxygen demand as key water quality indicators. Carbon and water pollution taxes can be categorized as both economic and environmental policies, as they exhibit the dual characteristics of environmental policy objectives (emission reduction) and economic policy instruments (behavioral regulation through market and price mechanisms). Multidimensional assessment, comparison, and forecasting of the impacts of economic and environmental policies provide a robust foundation for evaluating their overall effects. Such studies enable policymakers to develop a more comprehensive understanding of the short-term and long-term impacts of policies on various economic and environmental sectors, thus facilitating more informed decision-making.
However, most previous studies focused on using economic or mathematical methods to evaluate the impacts of economic and environmental policies. These methods often employ mathematical models or data analysis to quantify the specific effects of policies on factors like environmental pollution, carbon emissions, and economic growth. These approaches often fail to capture the complexity of the interactions and relationships between economic and environmental policies, which may lead to more complex and integrated effects on both the economy and the environment. When analyzing policy impacts using economic and mathematical models, the environmental and economic benefits of policies are typically examined in isolation. This approach overlooks the systemic connections that policies have in real-world environments. Additionally, many economic and mathematical models are based on static data or assumptions, making it difficult to dynamically capture the changing trends of policies across different economic cycles.
This paper develops an input-output CGE model for pollution reduction and carbon mitigation (CGE-IWCR) to examine the long-term evolution of industrial economic and environmental responses in the Yangtze River Economic Belt (YREB) under varying levels of carbon and water pollution taxes. The CGE-IWCE model combines the computable general equilibrium (CGE) model, the environmental input-output (EIO) model, and factor analysis to capture the interactions between carbon and water pollution taxes driven by policy measures across different sectors within an input-output framework. Specifically, (i) it forecasts the long-term economic and environmental impacts driven by macro and local factors in the absence of dual tax (carbon and water pollution tax) interventions, based on relevant socio-economic sectors. (ii) It simulates the evolution of overall and sector-specific economic and environmental responses under varying levels of dual tax interventions. (iii) It quantifies the interactions between dual taxes and their impacts on the industrial economy and environment. The YREB industrial system was chosen as a case study for applying the CGE-IWCE model for several compelling reasons: (i) The YREB faces significant challenges related to both water pollution and carbon emissions, requiring coordinated mitigation efforts. (ii) The water pollution system and the carbon emission system in the YREB industrial sector are intricately connected, and the CGE-IWCE model provides a comprehensive understanding of the interactions between these systems. (iii) The significance of the YREB within China gives the study’s findings national relevance. The results will offer decision-making support for water pollution reduction and carbon mitigation in the YREB’s industrial sector, quantitatively identify the interactions between the dual taxes, and provide new insights for analyzing the impacts of pollution reduction and carbon mitigation policies.
To investigate the interactive effects of carbon and water pollution taxes on the economy and environment, a computable general equilibrium model for input-output of water pollution reduction and carbon reduction (CGE-IWCR) was developed. This model integrates the computable general equilibrium (CGE) model, environmental input-output model (EIO), and factor analysis to address the limitations of each individual approach. The development of the CGE-IWCE model is necessary to address practical problems that cannot be solved using any of these three methods individually. For instance, traditional economic analysis methods are unable to quantitatively capture the interactions between multiple policy interventions. The CGE model also fails to systematically describe regional interactions through supply chains. Additionally, while the CGE model can forecast the potential effects of policy adjustments or external changes on the broader economy, the environmental input-output model is limited to addressing static, time-specific economic-environmental conditions. Consequently, the CGE-IWCE model offers several advantages: (a) under the “dual carbon” goals, it can effectively forecast regional emissions driven by both macro and local factors from 2025 to 2060; (b) it quantitatively captures the interactions between various policy interventions, thereby providing guidance for comprehensive regional policy formulation.
The CGE-IWCE model is applied to the Yangtze River Economic Belt (YREB) industrial system, with the application process illustrated in Figure 1 and sector classification outlined in Table 1. A CGE model specific to YREB was developed to evaluate the potential economic-environmental impacts under different policy scenarios. The long-term economic-environmental responses of the YREB industrial system from 2025 to 2060 were then simulated under carbon and water pollution tax interventions. Output from the CGE model (e.g., changes in sectoral carbon and water pollution emissions, as well as final demand categories such as household and government consumption, and capital formation) was used to rebalance the input-output table containing YREB commodity trade information via the RAS simulation method. Next, the environmental input-output model was applied to analyze the evolution of demand-driven carbon and water pollution emissions. Finally, factor analysis was used to explore the interaction between different policies and their effects on economic output and pollution reduction in the YREB industrial system. Carbon and water pollution taxes were selected as representative policies to reflect key economic-environmental issues.
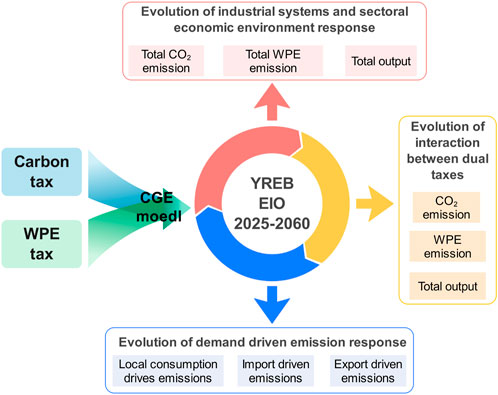
Figure 1. Development of computable general equilibrium model for input-output of water pollution reduction and carbon reduction (CGE-IWCR).
The original computable general equilibrium (CGE) model was developed from the input-output model, with a stronger emphasis on the role of prices (Bagheri et al., 2024; Fabregat-Aibar et al., 2022). The core principle of the CGE model is based on Walras’ general equilibrium theory (Akkemik et al., 2024; Teng et al., 2023). This theory describes a condition where all factors and goods are in equilibrium, meaning optimal demand matches optimal supply (Shen and Zhao, 2022). It assumes that all economic agents within the system optimize their behavior (Yeo and Oh, 2023). Producers aim to minimize costs and achieve zero net profits under technical constraints, while consumers maximize utility within budget constraints (Nishiura et al., 2024). It explains how different economic entities make supply and demand decisions based on the prices of goods and factors. In general equilibrium, the quantities and prices of goods and factors are simultaneously and endogenously determined. Substitution elasticities are applied in the production, income, and expenditure modules, as well as in the trade model, to capture the substitution potential between different inputs. Specifically, the CGE model comprises six modules: production, income and expenditure, trade, market closure, and pollution reduction modules. Notably, the pollution reduction module illustrates the economic and environmental impacts of different carbon and water pollution tax combinations in the Yangtze River Economic Belt.
The production function describes how inputs are combined to transform resources and raw materials into goods and services. The specific form of the production function depends on the elasticity of substitution between inputs. In the study, a seven-layer nested constant elasticity of substitution (CES) production function are employed. The CES function captures the substitution between capital, labor, energy, and materials in production, driven by their relative prices (Equation 1).
where
The income-expenditure module outlines the changes in various economic entities, including governments, firms, and the global economy. The Stone-Geary utility function is applied as the consumption function, as shown in Equation 2.
where
The trade module explains the substitution relationship between imported (or exported) goods and domestic goods under the Armington assumption. It generally describes how the constant elasticity of transformation (CET) function optimizes the allocation of domestic products between the domestic market and exports, aiming to maximize export profits (Equations 3, 4).
where
The market-clearing module ensures simultaneous equilibrium in both goods and factor markets.
The pollution reduction and carbon mitigation module estimate CO2 emissions and water pollution equivalents (WPE) (Equation 5) and applies the respective carbon and water pollution taxes. WPE is an indicator that measures the overall environmental harm posed by different pollutants, based on their harmful characteristics and the technical-economic feasibility of treatment. WPE serves as a comprehensive metric to quantify the impact of various pollutants on the environment, thereby providing a scientific basis for environmental protection. A higher WPE indicates greater environmental harm from a pollutant. The modules assume that carbon and water pollution emissions mainly arise from fossil energy consumption by various economic entities and industries. An ad valorem tax rate is introduced in this module to link carbon and water pollution emissions with the production module (Equations 6–11).
where WPE represents the water pollution equivalents.
To address uncertainties in various socioeconomic policy adjustments, a multilevel factor analysis method was employed to account for the variability of multiple factors in a multilevel design, and to analyze the complex relationships between factors (such as different tax rates) and model outputs (Lyu and Fan, 2021; Wang et al., 2022). Factor analysis offers significant advantages in exploring main and interaction effects, making it the only effective method for testing such interactions. Key influencing factors are identified by assessing the variation range of the dependent variable caused by individual factors, while interaction effects are identified by evaluating how the effects of one factor change when other factors fluctuate. The factor design process involves four main steps: (1) selecting input factors, (2) sequentially calculating system responses, (3) conducting analysis of variance related to the selected factors, and (4) identifying the significance of each factor and the impact of interaction effects on system responses. Taking 22 factorial design as an example, the calculations for the summations of squares of single-factor and two-factor interactions are represented by Equations 12–14.
where factor A and B denote the emission reduction pathways; I and J represent the levels of factors A and B, respectively;
This paper designs a multilevel factor experiment consisting of 108 tests (4*3*32), involving low (L), medium (M), and high (H) levels for three parameters. The carbon tax levels are set at 10 ¥/tonne (low), 30 ¥/tonne (medium), and 50 ¥/tonne (high), while the water pollution tax levels are set at 1,400 ¥/tonne equivalent (low), 7,700 ¥/tonne equivalent (medium), and 14,000 ¥/tonne equivalent (high). The business as usual (BAU) scenario represents the state of the Yangtze River Economic Belt without carbon or water pollution tax intervention. The scenario design is as follows:
To assess the impact of pollution reduction and carbon mitigation policies in the Yangtze River Economic Belt, a network balancing method utilizing biproportional scaling (RAS) method was employed to rebalance the system (Yue et al., 2023; Zhai et al., 2024). Specifically, the outputs of the multilevel factor CGE model were integrated with the RAS method to generate a new, balanced environmental input-output table for the Yangtze River Economic Belt (Equation 15). The rebalancing process includes the following steps: (i) determining changes in GDP, industrial carbon emissions, and water pollution emissions in the Yangtze River Economic Belt from 2025 to 2060; (ii) rebalancing the input-output table based on GDP changes under various interactive carbon and water pollution tax policies; (iii) adjusting final demand by considering changes in industrial carbon emissions and water pollution in the Yangtze River Economic Belt.
where
The environmental input-output model is employed to represent the implicit flow of resources and emissions within the system (Luu et al., 2024; Rinaldi et al., 2023). The model comprises the total input vector for sectors, the primary input vector, the intermediate transaction matrix, the final demand vector, and the total output vector for sectors (Cámara and Llop, 2020). It adheres to the following row and column balance conditions (Equations 16, 17):
where
where
The rapid and sustained economic growth in the Yangtze River Economic Belt (YREB) has resulted in significant environmental and resource challenges, particularly regarding high-intensity CO2 emissions. Major industrial projects, including those in petrochemicals, steel, machinery, and automobiles, are concentrated in the YREB. Although these projects contribute to economic development, they have also become major sources of pollution. The excessive consumption of fossil fuels has resulted in elevated CO2 emissions, putting immense pressure on the YREB’s carbon reduction efforts. Furthermore, the YREB’s industrial sector is a major source of industrial water pollution in China, with pollutant emissions such as COD, NH3-N, and TP consistently exceeding the national average. Different industrial sectors emit varying types of pollutants. For instance, the paper and textile industries primarily release organic pollutants, whereas the chemical industry mainly emits inorganic salts. Although the Chinese government has introduced multiple pollution reduction and carbon mitigation initiatives, the results have been less than significant. In response to the global climate crisis, China has shown a strong commitment to combating climate change. The government has pledged to reduce CO2 emissions per unit of GDP by 60%–65% by 2030, compared to 2005 levels, and to achieve carbon neutrality by 2060. Therefore, achieving coordinated economic growth and pollution reduction through effective policy planning is essential for both short-term and long-term comprehensive development.
Previous studies on carbon and water pollution emissions in the YREB by scholars have focused primarily on carbon emission accounting, scenario analysis, decoupling status and driving factors, spatial correlation, regional differences, and their contributions. The successful implementation of carbon and pollution taxes in many countries has demonstrated their effectiveness in reducing emissions. However, studies examining the economic and environmental impacts of introducing carbon and water pollution taxes in the YREB’s industrial system remain limited. As a result, the interaction between economic and environmental policies and their impact on the YREB industrial system has not been comprehensively studied.
The data supporting this study include: (a) policy data related to the implementation of YREB policies; (b) data used to construct the regional social accounting matrix (SAM), including regional input-output tables and relevant financial information; (c) 2017 carbon and water pollution emission data (COD, NH3-N, and TP) collected by sector.
Figure 2 shows the economic and environmental dynamics of the industrial system under the BAU scenario, where no carbon tax or water pollution tax is implemented. The X-axis represents the time range from 2018 to 2060, the Y-axis indicates the total output of the industrial system, and the Z-axis shows the equivalent emissions of carbon and water pollutants from the industrial system. Figure 2A illustrates that CO2 emissions from the industrial sector rose from 3,521.3 Mt in 2018 to a peak of 4,086.52 Mt in 2035, followed by a decline to 2,616.37 Mt by 2060. This indicates that although technological advancements can reduce emissions to some extent, total emissions in the industrial sector are expected to continue rising in the short term under the BAU scenario. Around 2030, the growth rate of CO2 emissions slows down but continues to rise overall. Specifically, the average annual growth rate from 2030 to 2040 is approximately 1.2%, compared to 1.5% from 2018 to 2030. Industrial growth gradually slows over time. However, after 2030, total industrial output continues to rise, indicating that the industrial sector remains a major driver of economic growth. Specifically, total industrial output grows from 5,102.92 billion¥ in 2018 to 214,091 billion¥ by 2060, representing an increase of over two-fold, with an average annual growth rate of about 3.47%. The average annual growth rate is 4.41% between 2018 and 2030, 3.72% between 2030 and 2045, and 2.48% between 2045 and 2060. As energy-saving and emission-reduction technologies are implemented, and policies—particularly those targeting highly polluting industries—become stricter, industrial growth slows progressively. This growth is accompanied by industrial restructuring and upgrading, with a shift toward high-value-added, low-emission industries. Table 2 presents the trend of changes in industrial CO2 emission intensity across various periods. Between 2018 and 2060, CO2 emission intensity decreases from 0.0690 Mt/billion¥ to 0.0124 Mt/billion¥, representing an 82% reduction. This demonstrates continuous improvement in energy efficiency within the industrial sector, with carbon emissions per unit of output consistently decreasing. After 2030, the rate of decline in CO2 emission intensity accelerates notably, suggesting the potential for further adoption of energy-saving and emission-reduction technologies. The ongoing decline in CO2 emission intensity indicates significant progress in industrial energy efficiency, driven by the adoption of energy-saving technologies and more efficient production processes.
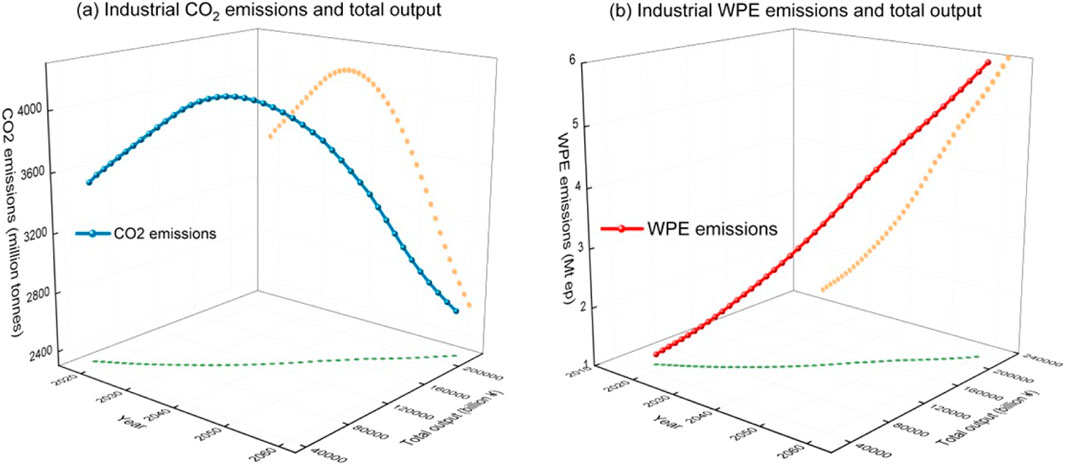
Figure 2. Economic environmental dynamic changes in industrial systems under BAU scenario. (A) Industrial CO2 emission and total output (B) Industrial WPE emission and total output.
As illustrated in Figure 2B, water pollution equivalent (WPE) emissions rose from 1.18 Mt in 2018 to 5.96 Mt by 2060, a nearly fivefold increase. This sustained growth indicates that industrial water demand and pollution treatment capacity have lagged behind the pace of production expansion. In the mid-term (around 2030), the growth of WPE emissions slows but continues to rise. From 2030 to 2045, WPE emissions exhibit an average annual growth rate of 4.21%, lower than the 5.17% seen between 2018 and 2030. After 2045, the growth rate stabilizes at approximately 2.68%, possibly due to bottlenecks in emissions treatment and pollution control in specific industrial sectors. Although emissions growth slows between 2030 and 2060, it remains on an upward trajectory, suggesting that current emissions reduction measures and policies are only temporarily effective, lacking sustainable long-term impact. Table 2 shows that WPE emissions intensity rises from 0.023 tonnes/104 ¥ in 2018 to 0.028 tonnes/104 ¥ by 2060, implying that advancements in water pollution treatment technology have been less consistent compared to carbon reduction technologies. Despite increased industrial output, emissions per unit of production continue to rise, indicating that technological advancements and policy interventions have not adequately reduced the water-related environmental cost of economic growth. The reduction in WPE emission intensity has been slower compared to CO2 emission intensity, likely due to delays in advancements in water pollution treatment technologies, especially in industrial wastewater treatment and water resource recovery. As technologies mature and see broader application, future emission intensity is expected to decline further. However, continued innovation in water pollution treatment technologies and stronger policy interventions will be necessary.
Figure 3 illustrates the dynamic changes in CO2 and WPE emissions driven by local consumption, exports, and imports in the BAU scenario. Figure 3A indicates that CO2 emissions fluctuate under the influence of local consumption, exports, and imports, with local consumption contributing the most to carbon emissions. This underscores the crucial role of the Yangtze River Economic Belt’s internal market in future carbon emissions control. Specifically, CO2 emissions from local consumption increase from 5810.33 Mt in 2018–7292.08 Mt by 2037, a 25.5% rise, before dropping to 4554.57 Mt by 2060, representing a 37.5% decline. This trend reflects the increasing demand for industrial products driven by local consumption, followed by a decrease in emissions attributed to technological improvements and emissions reduction strategies. Export-driven CO2 emissions rise from 1846.02 Mt in 2018 to 1957.52 Mt by 2032, then drop to 963.61 Mt by 2060. This suggests that international demand for the Yangtze River Economic Belt’s industries shows limited growth or that optimization in export structure has helped curb carbon emissions. Import-driven CO2 emissions increase from 1408.71 Mt in 2018 to 1854.64 Mt by 2039, before falling to 1220.96 Mt by 2060. This suggests that local industries’ reliance on external goods grows, but emissions pressure eases as the composition of imported goods adjusts. Figure 3B illustrates a significant rise in WPE emissions driven by local consumption, exports, and imports, with local consumption causing the most substantial pressure. From 2018 to 2060, WPE emissions driven by local consumption, exports, and imports all exhibit rapid growth. WPE emissions from local consumption rise from 1.17 Mt ep in 2018 to 6.85 Mt ep by 2060, nearly a 5.9-fold increase. WPE emissions rise rapidly between 2018 and 2035, with an average annual growth rate of 5.2%. After 2035, the growth rate slows, with the average annual rate dropping to below 1% between 2050 and 2060. This trend suggests that early economic and industrial expansion places considerable pressure on water resources, but with advancements in pollution control technologies and policy implementation, emissions growth is gradually contained. Export-driven WPE emissions increase from 0.63 Mt ep in 2018 to 2.89 Mt ep by 2060, an approximate 3.6-fold increase. This suggests that while export industries continue to expand, fluctuating international market demand and the implementation of pollution control measures gradually curb export-driven WPE emissions. Import-driven WPE emissions rise rapidly between 2018 and 2035, with an average annual growth rate of 4.5%. This reflects growing local industrial demand for external products, leading to increased water pollution. However, over time, adjustments in the composition of imported goods and the implementation of environmental control measures have helped slow the growth rate of water pollution emissions.
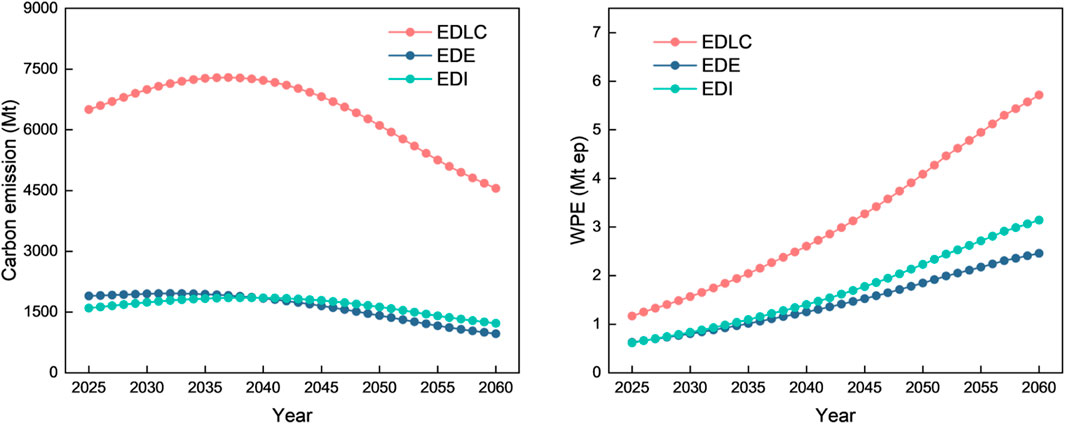
Figure 3. Dynamic changes in CO2 and WPE emissions driven by local consumption and import/export under BAU scenario. (Note: Emissions driven by local consumption (EDLC), Emissions driven by exports (EDE), Emissions driven by imports (EDI), equivalent (ep)).
Figure 4 illustrates the dynamic evolution of CO2 and WPE emissions across different industrial sectors under the BAU scenario. As depicted in Figure 4A, CO2 emissions in the coal production sector exhibit a steady decline under the BAU scenario. Specifically, CO2 emissions from coal production decline from 225.79 Mt in 2025 to 68.6 Mt by 2060, reflecting a total reduction of about 69.6%. This downward trend indicates the reduced use of coal due to the energy transition, with clean energy replacing coal, resulting in a notable reduction in emissions from the coal sector. CO2 emissions from the oil and gas sectors also decline, with emissions from oil production dropping from 24.68 Mt in 2025 to 10.9 Mt by 2060, and from gas production falling from 29.9 Mt to 4.49 Mt in the same period. The reduction in emissions from refined oil and gas reflects the shift away from fossil fuels and the transition towards a low-carbon energy structure. CO2 emissions in the steel sector gradually increase from 1019.16 Mt in 2025 to 1262.39 Mt by 2040, a rise of approximately 23.77%, before decreasing to 975.6 Mt by 2060. This trend is closely tied to increased industrial and infrastructure demand. Despite the adoption of some emission reduction technologies in the steel industry, persistent industrial demand maintains significant pressure on emissions. CO2 emissions in the chemical industry also decline, dropping from 598.88 Mt in 2025 to 501.2 Mt by 2060, a reduction of roughly 16.3%. The high energy consumption and emissions-intensive nature of the chemical industry present considerable challenges for future emission reductions. As shown in Figure 4B, WPE in the coal production sector rise initially before declining between 2025 and 2060. Emissions increase from 0.91 Mt ep in 2025 to 1.2 Mt ep by 2040, then drop to 0.87 Mt ep by 2060. This indicates that although CO2 emissions from coal production are controlled in the short term, the sector continues to exert pressure on water pollution, particularly in wastewater treatment associated with resource extraction. WPE emissions from the steel sector also rise significantly, from 5.54 Mt ep in 2025 to 24.94 Mt ep by 2060, a roughly 3.5-fold increase. As steel production expands, WPE emissions increase, highlighting growing pressure on both carbon emissions and water pollution in the sector. Water pollution emissions in the chemical industry follow a similar trajectory, rising from 4.64 Mt ep in 2025 to 16.22 Mt ep by 2060, representing a 3.5-fold increase. The chemical sector’s production activities place a high demand on water resources, with wastewater typically containing high concentrations of pollutants.
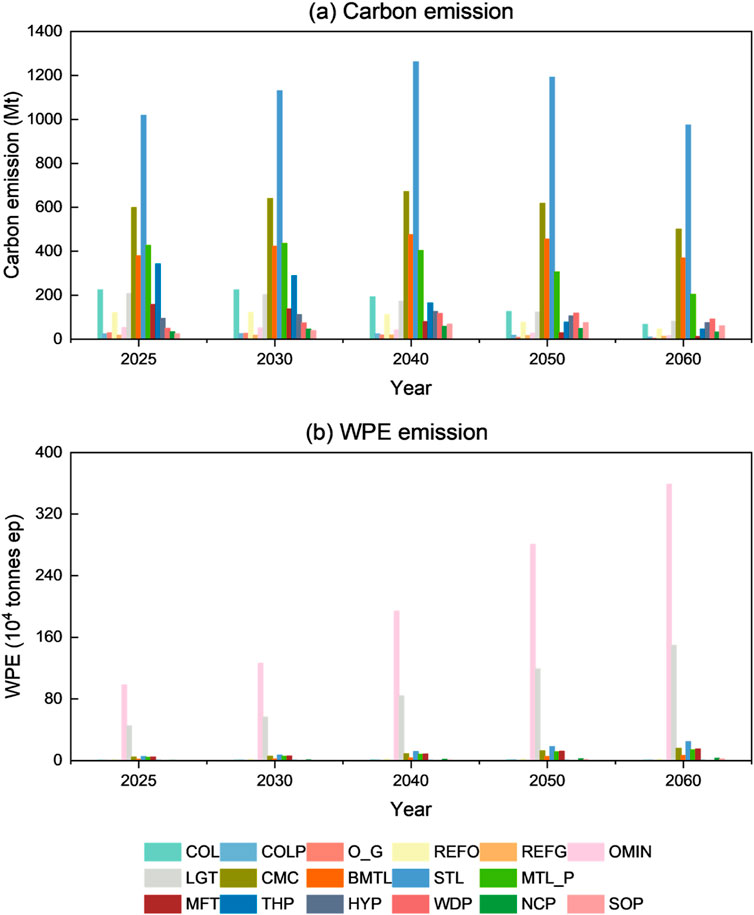
Figure 4. Dynamic changes in CO2 and WPE emissions of various industrial sectors under BAU scenario. (A) Carbon emission (B) WPE emission.
Figure 5 illustrates the dynamic evolution of CO2 and WPE reduction rates under the double-tax scenario. In the double-tax scenario, various combinations of carbon and water pollution taxes significantly impact carbon emissions and water pollution in industrial sectors. Under the low carbon tax and low water pollution tax combination S11 (Ctax10 Wtax1400), CO2 emissions are reduced by 2.64% in 2025 and by 9.29% in 2060. WPE emissions in this scenario decline by 9.20% in 2025 and further drop to 22.36% by 2060. This low-tax combination has a limited impact on carbon and water pollution reductions, indicating that mild tax interventions do not sufficiently drive industrial sectors to reduce emissions in the short term, though long-term cumulative effects are apparent. In the low carbon tax and high-water pollution tax combination S13 (Ctax10 Wtax14000), CO2 emissions show a more notable reduction, dropping by 3.80% in 2025 and by 18.70% in 2060. Water pollution emissions decline by 33.48% in 2025, with a further reduction reaching 54.53% by 2060. This indicates that a higher water pollution tax is highly effective in curbing water pollution and also has a synergistic effect on reducing carbon emissions. In the medium carbon tax and low water pollution tax combination S21 (Ctax30 Wtax1400), CO2 emissions are reduced more significantly, with a 7.17% decrease in 2025 and a 19.11% reduction by 2060. However, WPE emissions show a relatively smaller reduction, decreasing by 9.61% in 2025 and by 22.72% in 2060. This suggests that although a medium carbon tax rate effectively reduces carbon emissions, a higher water pollution tax rate is necessary to achieve significant reductions in water pollution. In the high carbon tax and high-water pollution tax combination S33 (Ctax50 Wtax14000), the reduction effects on both carbon and water pollution emissions are most significant. Carbon emissions drop by 12.64% in 2025 and by 23.48% in 2060. WPE emissions decline by 33.48% in 2025 and by 54.53% in 2060. This highest tax rate combination demonstrates that the dual pressure of carbon and water pollution taxes has a substantial suppressive effect on emissions in industrial sectors, particularly in reducing water pollution.
Figure 6 illustrates the dynamic changes in total industrial output under the double-tax scenario. In the double-tax scenario, different combinations of carbon and water pollution taxes have a substantial impact on total industrial output. In the low carbon tax and low water pollution tax combination S11 (Ctax10 Wtax1400), total industrial output decreases by 1.38% in 2025 and further drops by 3.93% by 2060. In the medium carbon tax and high-water pollution tax combination S23 (Ctax30 Wtax14000), the decline in industrial output becomes more severe, with a 5.97% decrease in 2025 and a drop to 14.65% by 2060. The high-water pollution tax significantly raises production costs in the Yangtze River Economic Belt, particularly in water-intensive industries, where the cost burden increases considerably. This accelerates the decline in total output, as the combined tax rates further amplify the suppressive effect on industrial production in the Yangtze River Economic Belt. In the high carbon tax and high-water pollution tax combination S33 (Ctax50 Wtax14000), the decline in industrial output is most pronounced, with a decrease of 6.43% in 2025 and 14.91% by 2060. This is attributed to the dual pressure of high carbon and water pollution taxes, which significantly raise production costs. The high costs linked to carbon and water pollution emissions compel industries to either reduce production or undergo transformation, resulting in a significant drop in total output. Therefore, tax policy design should strike a balance between emission reduction targets and economic development, ensuring that environmental objectives are achieved while maintaining economic stability.
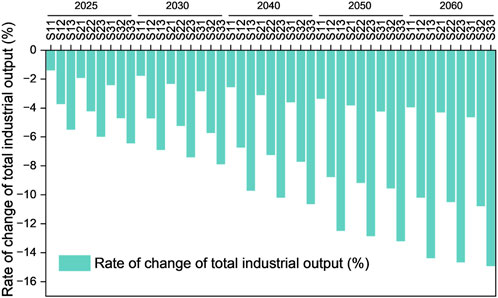
Figure 6. Dynamic evolution of total output change rate of industrial sector under the dual tax scenario.
Figure 7 illustrates the significant impact of various combinations of carbon and water pollution taxes on carbon and water pollution emissions driven by local consumption, exports, and imports under the double-tax scenario. As depicted in Figure 7A, in the low carbon tax and low water pollution tax combination S11 (Ctax10 Wtax1400), carbon emissions driven by local consumption decrease by 3.31% in 2025 and by 11.56% by 2060. Export and import-driven carbon emissions decrease by 3.00% and 3.23% in 2025, and by 9.31% and 12.11% by 2060, respectively. This tax rate combination exerts a relatively mild suppressive effect on carbon emissions driven by local consumption, exports, and imports, with more significant long-term impacts. In the medium carbon tax and high-water pollution tax combination S23 (Ctax30 Wtax14000), carbon emissions from local consumption decrease by 9.83% in 2025 and by 25.88% by 2060. Export and import-driven carbon emissions fall by 8.52% and 9.71% in 2025, and by 23.78% and 28.44% by 2060, respectively. This combination has a more significant effect on reducing carbon emissions related to local consumption and trade. The high-water pollution tax encourages industries to focus more on water pollution management, indirectly promoting carbon reductions. Additionally, the increased carbon tax puts greater pressure on energy-intensive industries. In international trade, higher tax rates push industries to reduce the export and import of carbon-intensive products, further lowering emissions. As shown in Figure 7B, under the low carbon tax and low water pollution tax combination S11, WPE emissions driven by local consumption decrease by 2.77% in 2025 and by 10.21% by 2060. However, WPE emissions driven by exports and imports increase by 1.46% and 1.81% in 2025, and slightly decrease by 1.97% and 1.31% by 2060. The low water pollution tax has limited effectiveness in controlling water pollution, suggesting that a low tax rate is inadequate to motivate industries to actively regulate water resource usage. In the medium carbon tax and high-water pollution tax combination S23, WPE emissions from local consumption drop by 11.04% in 2025 and by 33.73% by 2060. Meanwhile, WPE emissions driven by exports and imports rise by 3.14% and 1.99% in 2025 but fall by 5.60% and 20.16% by 2060, respectively. This combination demonstrates that a higher water pollution tax has a significant impact on WPE emissions from local consumption and imports, while export-related water pollution rises initially but is gradually brought under control over time.
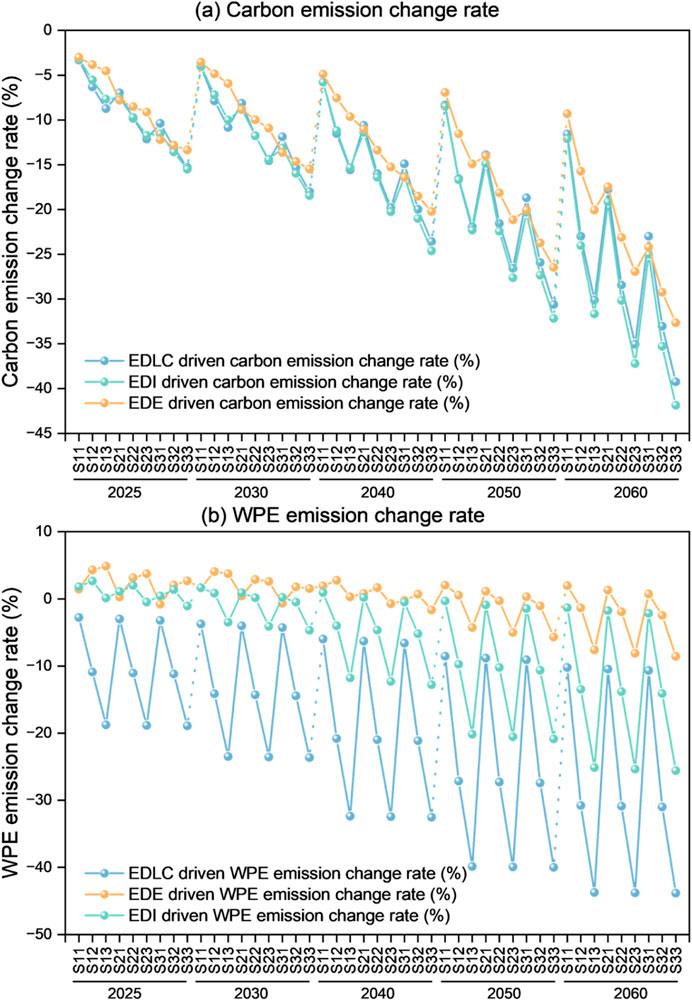
Figure 7. Dynamic evolution of CO2 and WPE emission reduction rates driven by local consumption, import and export under the dual tax scenario. (A) Carbon emission change rate (B) WPE emission change rate.
Figure 8 illustrates the dynamic evolution of CO2 and WPE reduction rates across different industrial sectors under the double-tax scenario. Figures 9A–C compare the effects of different carbon and water pollution tax combinations on sectoral CO2 emissions. The CO2 emission change rate represents the relative change in CO2 emissions in each sector under the double-tax scenario compared to the BAU scenario. In the low carbon tax and low water pollution tax combination S11 (Ctax10 Wtax1400), CO2 emissions from coal production rise by 17.65%, refined natural gas by 40.44%, and thermal power generation by 12.84% by 2060. Other sectors exhibit reductions in CO2 emissions, with the mining sector achieving the largest decrease at 31.75%. These results indicate that the metal products sector achieves notable emission reductions under lower tax rates, whereas coal production, refined natural gas, and thermal power generation sectors experience increases in CO2 emissions, highlighting the difficulty of emission reductions in these sectors. In the high carbon tax and high-water pollution tax combination S33 (Ctax50 Wtax14000), CO2 emissions from coal production increase by 53.55%, refined natural gas by 133.69%, and thermal power generation by 39.71% by 2060. Other sectors experience reductions, with the mining sector seeing the largest decrease at 31.75%. Over time, the cumulative effects of tax policy become more evident. Industrial sectors implement more emission reduction measures to reduce tax burdens, particularly in high tax rate scenarios, where most sectors see more substantial CO2 reductions. Figures 9D–F compare the effects of different carbon and water pollution tax combinations on WPE emissions across various sectors. Under the low carbon tax and low water pollution tax combination S11, WPE emissions from coal production increase by 19.65%, refined petroleum by 9.62%, and refined natural gas by 49.48% by 2060, while WPE emissions from other mining sectors decrease by 34.35%. Water-intensive industries, such as refined natural gas and refined petroleum, are more sensitive to water pollution taxes, resulting in larger increases in WPE emissions. In contrast, coal mining and light industries exhibit smaller reductions in water pollution. Over time, most sectors demonstrate increasingly significant reductions in WPE emissions. Under the high carbon tax and high-water pollution tax combination S33, WPE emissions from coal production decrease by 3.24% in 2025, but rise to 63.97% by 2060. WPE emissions from refined natural gas increase by 182.45% by 2060, while other mining sectors see reductions from 53.14% in 2025 to 78.96% by 2060. The long-term impact of water pollution taxes on high-pollution industries is substantial. Overall, water pollution emissions exhibit a downward trend, particularly under high tax rate scenarios, where reduction rates become more significant. Higher water pollution tax rates place strong pressure on water-intensive industries, resulting in more substantial reductions in WPE emissions.
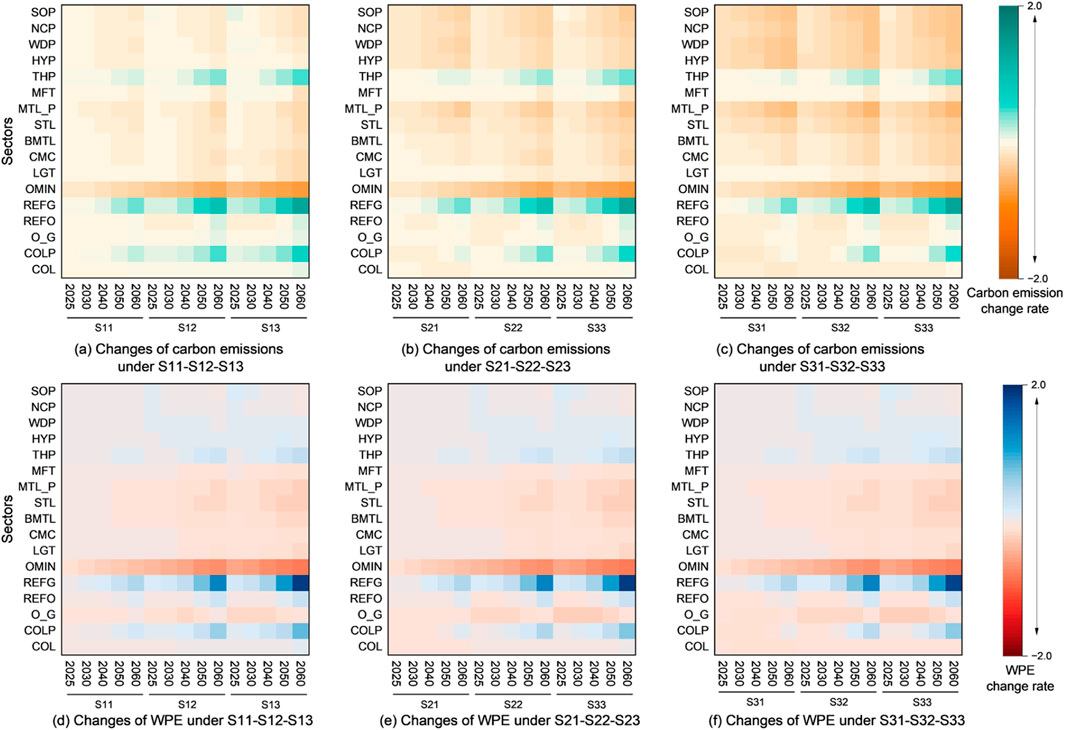
Figure 8. Dynamic evolution of CO2 and WPE emission reduction rates in various industrial sectors under the dual tax scenario. (A) Changes carbon emissions under S11-S12-S13 (B) Changes carbon emissions under S21-S22-S23 (C) Changes carbon emissions under S31-S32-S33 (D) Changes WPE under S11-S12-S13 (E) Changes WPE under S21-S22-S23 (F) Changes WPE under S31-S32-S33.
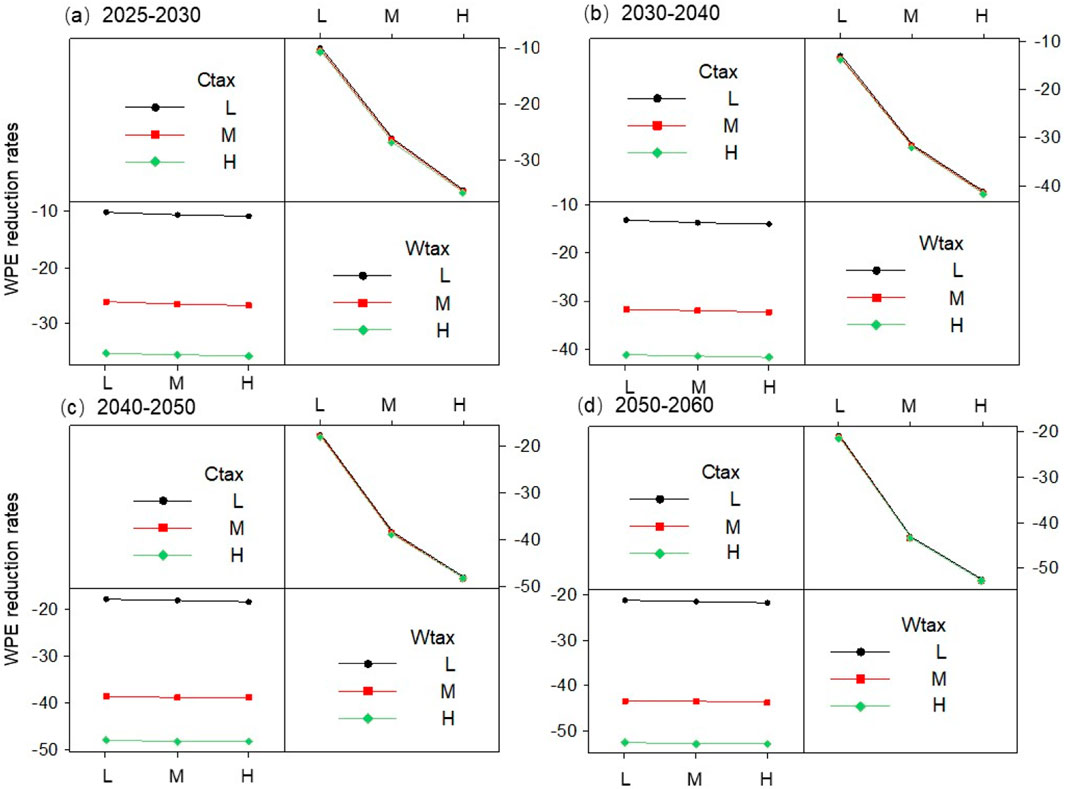
Figure 9. Evolution of the response of double tax interaction to water pollution reduction. (A) 2025–2030 (B) 2030–2040 (C) 2040–2050 (D) 2050–2060.
YREB is a critical region for carbon and water pollution emissions in China, primarily driven by industrial activities. To address these issues in the long term, multiple carbon and water pollution policies have been implemented. Factor analysis is useful for evaluating the effects of these policies on industrial carbon emissions, water pollution emissions, and overall industrial output. Interaction plots between two factors demonstrate how one factor influences the system when another factor is also at play. Observing industrial carbon emissions, water pollution emissions, and total industrial output over time helps reveal the long-term impact of dual taxes on the economic and environmental performance of the YREB’s industrial system. Parallel trends in the curves of different factors suggest that there is no interaction between them. For example, from 2025 to 2030, when the water pollution tax (Wtax) is low, the reduction in WPE in YREB’s industrial sector increases as the carbon tax (Ctax) rises. The response of WPE reduction rates to the interaction between carbon and water pollution taxes is depicted in Figure 9. Between 2025 and 2030, when the water pollution tax is low, the WPE reduction rate increases from 9.99% to 35.22% as the carbon tax rises from 10 ¥/tonne to 50 ¥/tonne. When the water pollution tax is high, the WPE reduction rate rises from 10.8% to 35.71% with the increase in the carbon tax. From 2030 to 2040, when the water pollution tax is low, the WPE reduction rate rises from 13% to 41.17% as the carbon tax increases. When the water pollution tax is high, the WPE reduction rate rises from 13.83% to 41.63% with the increase in the carbon tax. From 2040 to 2050, when the water pollution tax is low, the WPE reduction rate increases from 17.35% to 48.12% with the rise in the carbon tax. When the water pollution tax is high, the WPE reduction rate rises from 18.07% to 48.49% with the carbon tax increase. From 2050 to 2060, when the water pollution tax is low, the WPE reduction rate rises from 20.79% to 52.67% with the increase in the carbon tax. When the water pollution tax is high, the WPE reduction rate rises from 21.35% to 52.94% as the carbon tax increases. However, across all time periods, regardless of the carbon tax level, increasing the water pollution tax from 1,400 ¥/tonne to 14,000 ¥/tonne has little impact on the WPE reduction rate in YREB’s industrial sector. This indicates that between 2025 and 2060, the carbon tax plays a more significant role in reducing WPE in YREB’s industrial sector.
The evolution of the interaction between carbon and water pollution taxes on CO2 reduction responses is depicted in Figure 10. Between 2025 and 2030, when the carbon tax is low, the CO2 reduction rate in YREB’s industrial sector increases from 2.85% to 12.02% as the water pollution tax rises from 1,400 ¥/tonne to 14,000 ¥/tonne. When the carbon tax is high, the CO2 reduction rate in YREB rises from 4.24% to 13.07% as the water pollution tax increases. From 2030 to 2040, when the carbon tax is low, the CO2 reduction rate rises from 3.76% to 14.55% as the water pollution tax increases. When the carbon tax is high, the CO2 reduction rate rises from 6.26% to 16.45% as the water pollution tax increases. From 2040 to 2050, when the carbon tax is low, the CO2 reduction rate rises from 5.55% to 18.57% as the water pollution tax rises. When the carbon tax is high, the CO2 reduction rate rises from 10.47% to 22.29% as the water pollution tax increases. From 2050 to 2060, when the carbon tax is low, the CO2 reduction rate increases from 7.86% to 16.03% as the water pollution tax rises. When the carbon tax is high, the CO2 reduction rate rises from 15.74% to 28.72% as the water pollution tax rises. However, across all time periods, regardless of the water pollution tax level, increasing the carbon tax from 10 ¥/tonne to 50 ¥/tonne has minimal impact on the CO2 reduction rate in YREB’s industrial sector. This suggests that from 2025 to 2060, the water pollution tax plays a more significant role in CO2 reduction in YREB’s industrial sector.
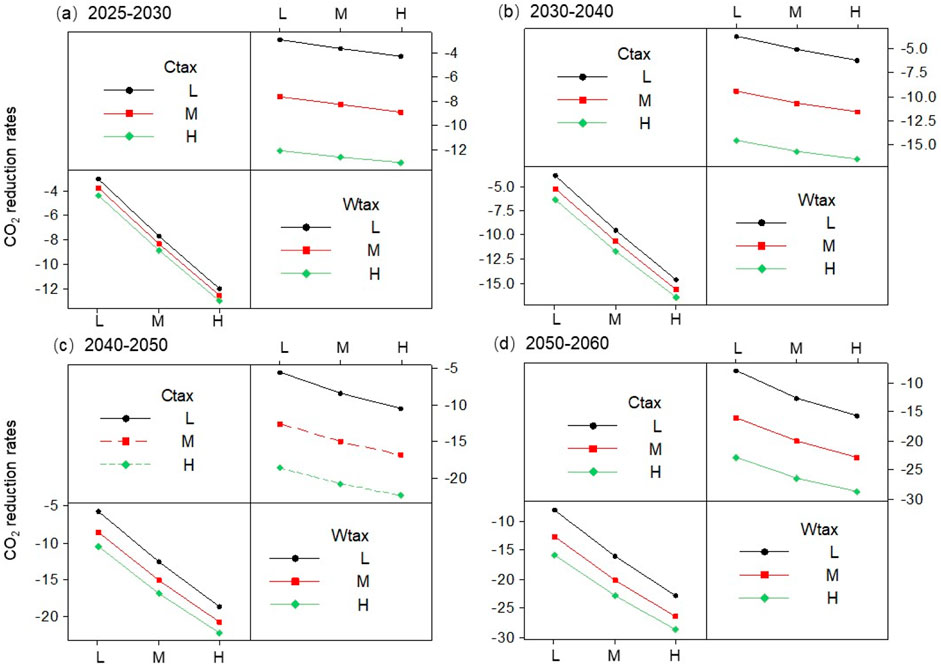
Figure 10. Evolution of the response of double tax interaction to CO2 reduction. (A) 2025–2030 (B) 2030–2040 (C) 2040–2050 (D) 2050–2060.
The evolution of the interaction between dual taxes and the change rate in industrial total output is depicted in Figure 11. From 2025 to 2030, when the water pollution tax is low, YREB’s total industrial output change rate rises from 1.53% to 6.04% as the carbon tax increases from 10 ¥/tonne to 50 ¥/tonne. When the water pollution tax is high, YREB’s total industrial output change rate increases from 2.57% to 7% as the carbon tax rises. From 2030 to 2040, when the water pollution tax is low, the total industrial output change rate rises from 2.1% to 8.14% as the carbon tax increases. When the water pollution tax is high, the total industrial output change rate rises from 3.17% to 9.1% as the carbon tax increases. From 2040 to 2050, when the water pollution tax is low, the total industrial output change rate rises from 2.91% to 11.01% as the carbon tax increases. When the water pollution tax is high, the total industrial output change rate rises from 3.9% to 11.84% as the carbon tax increases. From 2050 to 2060, when the water pollution tax is low, the total industrial output change rate rises from 3.61% to 13.32% as the carbon tax increases. When the water pollution tax is high, the total industrial output change rate rises from 4.39% to 13.96% as the carbon tax increases. However, across all time periods, regardless of the carbon tax level, increasing the water pollution tax from 1,400 ¥/tonne to 14,000 ¥/tonne has minimal impact on the total industrial output change rate in YREB. This suggests that between 2025 and 2060, the carbon tax plays a significant role in influencing the total industrial output change rate in YREB.
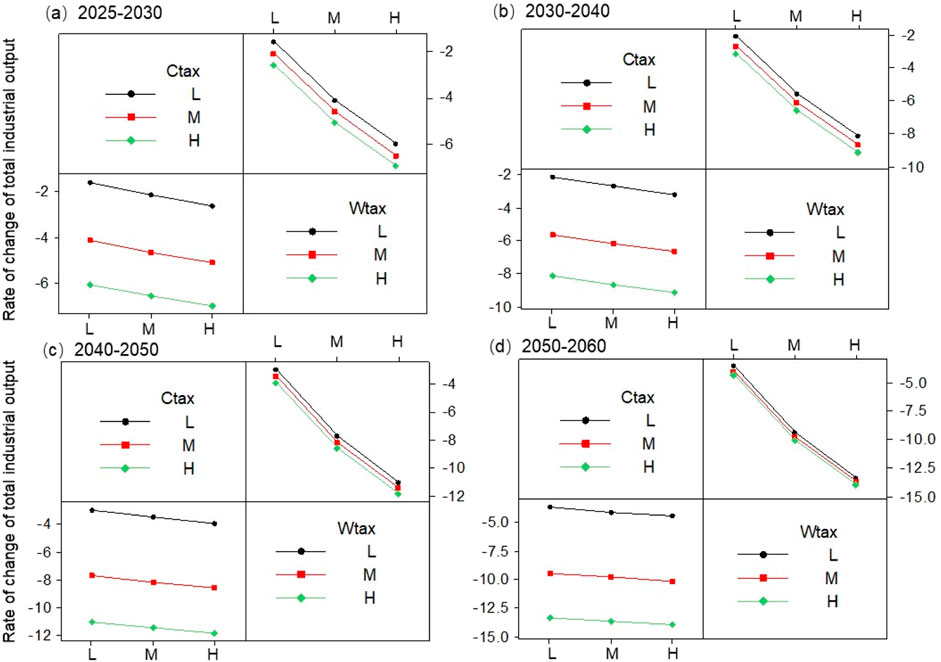
Figure 11. Evolution of the response of industrial total output change rate to the interaction of dual taxes. (A) 2025–2030 (B) 2030–2040 (C) 2040–2050 (D) 2050–2060.
In this study, a computable general equilibrium model for input-output of water pollution reduction and carbon reduction (CGE-IWCR) model has been developed to examine the long-term evolution of industrial economic and environmental responses in the Yangtze River Economic Belt (YREB) under varying levels of carbon and water pollution taxes. The CGE-IWCE model combines the computable general equilibrium (CGE) model, the environmental input-output (EIO) model, and factor analysis to capture the interactions between carbon and water pollution taxes driven by policy measures across different sectors within an input-output framework. Specifically, (i) it forecasts the long-term economic and environmental impacts driven by both macro and local factors in the absence of dual tax (carbon and water pollution tax) interventions, based on relevant socio-economic sectors. (ii) It simulates the evolution of overall and sector-specific economic and environmental responses under varying levels of dual tax interventions. (iii) It quantifies the interactions between dual taxes and their impacts on the industrial economy and environment.
It is discovered that the ongoing decline in CO2 emission intensity indicates significant progress in industrial energy efficiency, driven by the adoption of energy-saving technologies and more efficient production processes in the YREB. The reduction in water pollution equivalent (WPE) emission intensity has been slower compared to CO2 emission intensity, likely due to delays in advancements in water pollution treatment technologies, especially in industrial wastewater treatment and water resource recovery. In the double-tax scenario, various combinations of carbon and water pollution taxes significantly impact direct carbon emissions and direct water pollution emissions, and from local consumption, imports, and exports in industrial sectors. Among them, the dual pressure of high carbon and water pollution taxes, which significantly raise production costs. The high costs linked to carbon and water pollution emissions compel industries to either reduce production or undergo transformation, resulting in a significant drop in total output. In addition, increasing the carbon tax from 10 ¥/tonne to 50 ¥/tonne, the WPE reduction rate rises from 20.79% to 52.67% with the increase in the carbon tax from 2050 to 2060, when the water pollution tax is low. Between 2025 and 2060, the carbon tax plays a significant role in influencing the total industrial output change rate in YREB. from 2025 to 2060, the water pollution tax plays a more significant role in CO2 reduction in YREB’s industrial sector.
A key distinction of our research compared to previous studies is the stronger emphasis placed on the interactions between long-term economic and environmental policies in the coordinated management of industrial water pollution reduction and carbon mitigation within the YREB. However, some limitations will be addressed in future research. First, beyond the consideration of carbon and water pollution taxes in economic and environmental policies, future studies will incorporate the comprehensive effects of additional tax measures on the industrial system. Second, this study focuses solely on water pollutants such as COD, NH3-N, and TP; future research will expand to include a broader range of water pollutants. Finally, uncertainty analysis will be incorporated into the CGE-IWCR model in future studies.
The original contributions presented in the study are included in the article/supplementary material, further inquiries can be directed to the corresponding authors.
JW: Writing–original draft, Writing–review and editing, Data curation, Methodology, Software, Validation. JL: Conceptualization, Data curation, Writing–review and editing. YF: Writing–review and editing, Investigation, Methodology, Software. JS: Resources, Visualization, Writing–review and editing. YY: Supervision, Validation, Visualization, Writing–review and editing. SS: Resources, Supervision, Validation, Writing–original draft. MZ: Conceptualization, Data curation, Funding acquisition, Writing–review and editing.
The author(s) declare that financial support was received for the research, authorship, and/or publication of this article. This research was supported by Humanities and Social Science Research Youth Fund project of Ministry of Education (23YJCZH034); National Natural Science Foundation of China (52400234).
Author SS was employed by State Grid Integrated Energy Group Co., Ltd. Author YY was employed by BGRIMM Technology Group.
The remaining authors declare that the research was conducted in the absence of any commercial or financial relationships that could be construed as a potential conflict of interest.
The author(s) declare that no Generative AI was used in the creation of this manuscript.
All claims expressed in this article are solely those of the authors and do not necessarily represent those of their affiliated organizations, or those of the publisher, the editors and the reviewers. Any product that may be evaluated in this article, or claim that may be made by its manufacturer, is not guaranteed or endorsed by the publisher.
AGR, Agriculture related sectors; COL, Coal production; COLP, Coal processing; O_G, Oil and gas production; REFO, Refined oil; REFG, Refined gas; OMIN, Other mining products; LGT, Light industry; CHC, Chemicals; BMTL, Building materials; STL, Steelmaking; MTL&P, Metal and tile products; MFT, Manufacturing; THP, Thermal power; HYP, Hydropower; WIP, Wind power; NCP, Nuclear power; SOP, Solar power; CST, Construction; TSPT, Transportation; SER, Service.
Adejumo, O. O. (2020). Environmental quality vs economic growth in a developing economy: complements or conflicts. Environ. Sci. Pollut. Res. 27, 6163–6179. doi:10.1007/s11356-019-07101-x
Akkemik, K. A., Borges, J. T., and Dang, P. T. (2024). Assessing carbon tax using a CGE model with firm heterogeneity: an application to Vietnam. J. Environ. Manage. 365, 121585. doi:10.1016/j.jenvman.2024.121585
Androniceanu, A.-M., Căplescu, R. D., Tvaronavičienė, M., and Dobrin, C. (2021). The interdependencies between economic growth, energy consumption and pollution in europe. Energies 14, 2577. doi:10.3390/en14092577
Armeanu, D. Ş., Gherghina, Ş. C., and Pasmangiu, G. (2019). Exploring the causal nexus between energy consumption, environmental pollution and economic growth: empirical evidence from central and eastern europe. Energies 12, 3704. doi:10.3390/en12193704
Bagheri, S., Baky-Haskuee, M., Yazdani, S., and Hayati, B. (2024). Investigating the economic impacts of inter-basin water transfer projects with a water- embedded multi - regional computable general equilibrium approach. Water Resour. Manag. 38, 3875–3895. doi:10.1007/s11269-024-03844-6
Cámara, Á., and Llop, M. (2020). Defining sustainability in an input–output model: an application to Spanish water use. Water 13, 1. doi:10.3390/w13010001
Chen, T., Gozgor, G., Koo, C. K., and Lau, C. K. M. (2020). Does international cooperation affect CO2 emissions? Evidence from OECD countries. Environ. Sci. Pollut. Res. 27, 8548–8556. doi:10.1007/s11356-019-07324-y
Chou, J., Yang, F., Wang, Z., and Dong, W. (2021). The impact on carbon emissions of China with the trade situation versus the U.S. Sustainability 13, 10324. doi:10.3390/su131810324
Erkul, A., and Türköz, K. (2024). Green growth governance and total factor energy efficiency: economic growth constraint and policy implementation in OECD countries. Renew. Energy 235, 121278. doi:10.1016/j.renene.2024.121278
Fabregat-Aibar, L., Niñerola, A., and Pié, L. (2022). Computable general equilibrium models for sustainable development: past and future. Environ. Sci. Pollut. Res. 29, 38972–38984. doi:10.1007/s11356-021-18030-z
Fang, Z., Gao, X., and Sun, C. (2020). Do financial development, urbanization and trade affect environmental quality? Evidence from China. J. Clean. Prod. 259, 120892. doi:10.1016/j.jclepro.2020.120892
Guo, J., and Huang, R. (2022). A carbon tax or a subsidy? Policy choice when a green firm competes with a high carbon emitter. Environ. Sci. Pollut. Res. 29, 12845–12852. doi:10.1007/s11356-020-12324-4
Hepburn, C., Qi, Y., Stern, N., Ward, B., Xie, C., and Zenghelis, D. (2021). Towards carbon neutrality and China’s 14th Five-Year Plan: clean energy transition, sustainable urban development, and investment priorities. Environ. Sci. Ecotechnology 8, 100130. doi:10.1016/j.ese.2021.100130
Jiang, T., Gao, H., Chen, G., Dai, X., Xu, W., and Wang, Z. (2024). The complexity of environmental policy implementation in China: a set-theoretic approach to environmental monitoring policy dynamics. Front. Environ. Sci. 11. doi:10.3389/fenvs.2023.1335569
Kyei, C. K., and Chitiga-Mabugu, M. (2021). Welfare impacts of introducing water pollution tax in the Olifants river basin in South Africa: a revisited analysis using a top-down micro-accounting approach. Agrekon 60, 253–263. doi:10.1080/03031853.2021.1937245
Lazzarini, G. A., Visschers, V. H. M., and Siegrist, M. (2018). How to improve consumers’ environmental sustainability judgements of foods. J. Clean. Prod. 198, 564–574. doi:10.1016/j.jclepro.2018.07.033
Li, J.-F., Gu, A.-L., Ma, Z.-Y., Zhang, C.-L., and Sun, Z.-Q. (2019). Economic development, energy demand, and carbon emission prospects of China’s provinces during the 14th Five-Year Plan period: application of CMRCGE model. Adv. Clim. Chang. Res. 10, 165–173. doi:10.1016/j.accre.2019.09.003
Li, M., Zou, S., and Jing, P. (2023). Spatial spillover effect of water environment pollution control in basins—based on environmental regulations. Water 15, 3745. doi:10.3390/w15213745
Lin, B., and Zhou, Y. (2022). Measuring the green economic growth in China: influencing factors and policy perspectives. Energy 241, 122518. doi:10.1016/j.energy.2021.122518
Luo, J., Wang, H., Ling, Y., and Zhang, M. (2023). Study of the impact of industrial restructuring on the intensity of greenhouse gas emissions: empirical data from China. Environ. Dev. Sustain. 26, 25485–25502. doi:10.1007/s10668-023-03690-3
Luu, L. Q., Gibon, T., Cellura, M., Sanseverino, E. R., and Longo, S. (2024). Integrated hybrid multi-regional input-output for assessing life cycle air emissions of the Italian power system. Energy 290, 130109. doi:10.1016/j.energy.2023.130109
Lyu, X. D., and Fan, Y. R. (2021). Characterizing impact factors on the performance of data assimilation for hydroclimatic predictions through multilevel factorial analysis. J. Environ. Inf. doi:10.3808/jei.202100463
Mukhlynina, M. (2020). On the implementation of the state environmental policy in law-making and law-enforcement activities in Russia. E3S Web Conf. 169, 05008. doi:10.1051/e3sconf/202016905008
Nguyen, H. T., Aviso, K. B., Kojima, N., and Tokai, A. (2018). Structural analysis of the interrelationship between economic activities and water pollution in Vietnam in the period of 2000–2011. Clean. Technol. Environ. Policy 20, 621–638. doi:10.1007/s10098-018-1492-8
Nishiura, O., Krey, V., Fricko, O., van Ruijven, B., and Fujimori, S. (2024). Integration of energy system and computable general equilibrium models: an approach complementing energy and economic representations for mitigation analysis. Energy 296, 131039. doi:10.1016/j.energy.2024.131039
Noubissi, E. D., Nkengfack, H., Messie Pondie, T., and Ngounou, B. A. (2024). Economic impact of the carbon tax: evaluation of the reduction in 2 emissions. Nat. Resour. Forum 48, 859–886. doi:10.1111/1477-8947.12348
Rinaldi, L., Rocco, M. V., and Colombo, E. (2023). Assessing critical materials demand in global energy transition scenarios based on the Dynamic Extraction and Recycling Input-Output framework (DYNERIO). Resour. Conserv. Recycl. 191, 106900. doi:10.1016/j.resconrec.2023.106900
Sajwani, H. A., Soudan, B., and Olabi, A. G. (2023). Comprehensive review of socio-economic costs and benefits, policy frameworks, market dynamics, and environmental implications of microgrid development in the UAE. Energies 17, 70. doi:10.3390/en17010070
Shafi, M., Ramos-Meza, C. S., Jain, V., Salman, A., Kamal, M., Shabbir, M. S., et al. (2023). The dynamic relationship between green tax incentives and environmental protection. Environ. Sci. Pollut. Res. 30, 32184–32192. doi:10.1007/s11356-023-25482-y
Shen, J., and Zhao, C. (2022). Carbon trading or carbon tax? A computable general equilibrium–based study of carbon emission reduction policy in China. Front. Energy Res. 10. doi:10.3389/fenrg.2022.906847
Simionescu, M., Păuna, C. B., and Niculescu, M.-D. V. (2021). The relationship between economic growth and pollution in some new European union member states: a dynamic panel ARDL approach. Energies 14, 2363. doi:10.3390/en14092363
Song, M., Tao, W., and Shen, Z. (2022). Improving high-quality development with environmental regulation and industrial structure in China. J. Clean. Prod. 366, 132997. doi:10.1016/j.jclepro.2022.132997
Teng, Q., Zhang, Y.-F., Jiang, H.-D., and Liang, Q.-M. (2023). Economy-wide assessment of achieving carbon neutrality in China’s power sector: a computable general equilibrium analysis. Renew. Energy 219, 119508. doi:10.1016/j.renene.2023.119508
Wang, F., Huang, G. H., Li, Y. P., and Cheng, G. H. (2022). Development of a stepwise-clustered multi-catchment hydrological model for quantifying interactions in regional climate-runoff relationships. Water Resour. Res. 58. doi:10.1029/2021WR030035
Wang, X.-H., Wang, X., Huppes, G., Heijungs, R., and Ren, N.-Q. (2015). Environmental implications of increasingly stringent sewage discharge standards in municipal wastewater treatment plants: case study of a cool area of China. J. Clean. Prod. 94, 278–283. doi:10.1016/j.jclepro.2015.02.007
Woon, K. S., Phuang, Z. X., Taler, J., Varbanov, P. S., Chong, C. T., Klemeš, J. J., et al. (2023). Recent advances in urban green energy development towards carbon emissions neutrality. Energy 267, 126502. doi:10.1016/j.energy.2022.126502
Yang, W., Zhang, Y., and Hu, Y. (2022). Heterogeneous impact of economic policy uncertainty on provincial environmental pollution emissions in China. Sustainability 14, 4923. doi:10.3390/su14094923
Yeo, Y., and Oh, I. (2023). Evaluating the impacts of renewable energy promotion policies on sustainable development: a computable general equilibrium model approach. J. Clean. Prod. 421, 138360. doi:10.1016/j.jclepro.2023.138360
Yue, W., Li, Y., Su, M., Chen, Q., and Rong, Q. (2023). Carbon emissions accounting and prediction in urban agglomerations from multiple perspectives of production, consumption and income. Appl. Energy 348, 121445. doi:10.1016/j.apenergy.2023.121445
Zhai, M., Wu, Y., Gu, Y., Liu, L., Su, S., and Zang, H. (2024). A multidimensional factorial enviro-economic model: approaches of retrospective decomposition and prospective projection for energy systems. Energy 287, 129193. doi:10.1016/j.energy.2023.129193
Zhang, J., Jiang, H., Liu, G., and Zeng, W. (2018). A study on the contribution of industrial restructuring to reduction of carbon emissions in China during the five Five-Year Plan periods. J. Clean. Prod. 176, 629–635. doi:10.1016/j.jclepro.2017.12.133
Zhao, C., Chen, G., Wang, P., Ding, T., and Wang, X. (2023). Does sustainable development in resource-based cities effectively reduce carbon emissions? An empirical study based on annual panel data from 59 prefecture-level cities in China. Sustainability 15, 8078. doi:10.3390/su15108078
Zhao, X., Ma, X., Chen, B., Shang, Y., and Song, M. (2022). Challenges toward carbon neutrality in China: strategies and countermeasures. Resour. Conserv. Recycl. 176, 105959. doi:10.1016/j.resconrec.2021.105959
Keywords: carbon and water pollution tax, pollution reduction and carbon reduction, CGE model, Yangtze river economic belt, eco-environmental policy
Citation: Wang J, Li J, Fu Y, Sun J, Yang Y, Su S and Zhai M (2024) Development of an input-output CGE model for collaborative management of water pollution reduction and carbon mitigation. Front. Energy Res. 12:1513860. doi: 10.3389/fenrg.2024.1513860
Received: 19 October 2024; Accepted: 12 November 2024;
Published: 25 November 2024.
Edited by:
Fangtong Liu, Jinan University, ChinaReviewed by:
Yuan Ma, Tsinghua University, ChinaCopyright © 2024 Wang, Li, Fu, Sun, Yang, Su and Zhai. This is an open-access article distributed under the terms of the Creative Commons Attribution License (CC BY). The use, distribution or reproduction in other forums is permitted, provided the original author(s) and the copyright owner(s) are credited and that the original publication in this journal is cited, in accordance with accepted academic practice. No use, distribution or reproduction is permitted which does not comply with these terms.
*Correspondence: Yueqing Yang, eXVlcWluZzA0MjFAMTYzLmNvbQ==; Shuai Su, MTg4MTA4MDMxNzNAMTYzLmNvbQ==
Disclaimer: All claims expressed in this article are solely those of the authors and do not necessarily represent those of their affiliated organizations, or those of the publisher, the editors and the reviewers. Any product that may be evaluated in this article or claim that may be made by its manufacturer is not guaranteed or endorsed by the publisher.
Research integrity at Frontiers

Learn more about the work of our research integrity team to safeguard the quality of each article we publish.