- 1Nanjing Suyi Industrial Co., Ltd., Technology Information Network Branch, Nanjing, China
- 2Nanjing Suyi Industrial Co., Ltd., Nanjing, China
- 3Nanjing Huaqun Energy Group Co., Ltd., Nanjing, China
To cope with the uncertainty brought by the large-scale integration of renewable energy under the goal of carbon neutrality, it is necessary to tap and utilize flexible and adjustable resources from both the source and the load side at the same time. Hence, a flexible low-carbon optimal scheduling method for distribution networks is proposed in this paper, which takes into account the participation of heat storage industrial loads in demand response. Firstly, the model of the gas turbine equipped with a flexible carbon capture device is established, and the non-convex constraint introduced by the adjustable flue gas diversion ratio is convexified. Then the model of the fused magnesium load, a representative of heat storage industrial loads, is established for its participation in demand response. The segment linearization and convexification methods are performed on the conditional productivity constraints of the fused magnesium load. On this basis, a mixed-integer linear programming model for flexible and low-carbon optimal dispatch of the distribution network is developed by using the stochastic optimization theory and solved by commercial solvers. The proposed method is verified to be able to ensure the economic operation of the distribution network while reducing carbon emissions and promoting renewable energy consumption.
1 Introduction
As energy shortages and global warming issues have become increasingly severe, the major countries of the world have signed the Paris Agreement. Since the power industry is a major source of carbon emissions, these countries are vigorously promoting the deployment of renewable energy sources (RES) to relieve the pressure of decarbonization and achieve the anticipated emission reduction targets (Xu et al., 2023; Xu and Yi, 2023). However, the uncertainty, volatility, and anti-peak characteristics of the RES output pose a huge challenge to the stable operation of the system (Cheng et al., 2023; Tan et al., 2019). Since the distribution network is integrated with various types of distributed RES, how to ensure the continuity and reliability of power supply is a particularly evident challenge (Zhang et al., 2024; Zhang et al., 2023; Huang et al., 2020).
To address the challenges of integrating RES, gas turbines and demand response are becoming attractive measures (Zhang and Zhu, 2024; Condessa et al., 2023; de Chalendar et al., 2023). Gas turbines are an ideal choice as backup power sources for RES due to their high efficiency and relatively low carbon emissions. However, to achieve the emission reduction and the carbon neutrality targets, even gas turbines need further decarbonization. Gas turbines installed with flexible carbon capture technology (FCCGT) have high commercial maturity and do not require large-scale retrofits to the existing gas turbine, which is a promising technology to reduce carbon emissions (Fan et al., 2023). It is proposed in (Wilkes et al., 2021) that the quick-response capability of gas turbines is indispensable for providing system flexibility. When combined with post-combustion carbon capture technology, gas turbines offer critical support for the transition to a future low-carbon society. Integrating flexible combined-cycle gas turbines with carbon capture and storage technology is investigated and analyzed in (Chyong et al., 2023) for constructing low-carbon power systems. A laddered carbon trading-based operation model is proposed in (Gao et al., 2024) for an integrated electricity-gas system considering the complex combustion properties of hydrogen mixed gas turbine. In (Wang et al., 2022), the liquid storage carbon capture and power to gas technologies are applied to construct a coordinated heat and power operation model, which takes into account the carbon trading cost. Besides, due to the large thermal inertia of the heat storage industrial loads (HSIL), their operating power can be rapidly adjusted upward or downward with little impact on the production process, which play an important role in the demand-side management of the distribution network. Through demand response (DR) technology, HSIL can be flexibly dispatched within a certain range, which improves the matching degree of load demand and RES output and enhance the stability of the distribution system (Boldrini et al., 2024; Shao et al., 2021). Hence, exploiting the DR potential of HSIL helps balance the power supply and demand to enable the increase of RES integration, which indirectly contributes to carbon emission reduction (Wang J. et al., 2023). As one of the representative HSIL, magnesium load using an electric arc furnace (MLEAF) has a simple production process, but can provide significant regulation capability due to its thermal inertia. Therefore, modelling the DR participation of MLEAF with a low complexity has become a research focus in recent years. A novel adaptive Proportional-Integral-Derivative controller has been developed to regulate the melting current of MLEAF within desired parameters, resulting in significant energy savings (Wang W. et al., 2023). Based on a comprehensive analysis of the characteristics of electrical arc furnace, a refined model of MLEAF is developed in (Wang et al., 2024). Besides, a low-carbon dispatch method is proposed in (Zhao et al., 2024) to consider the demand regulation of MLEAF and the fluctuation of wind power generation, which achieves stable and reliable operation of the power system through the integration of thermal power plants and the introduction of battery energy storage systems.
However, there are still many challenges about how to effectively integrate FCCGT and the DR capacity of HSIL to relieve the distribution network dispatch pressure:
1) The uncertainty and anti-peak characteristics of RES output place higher requirements on the response speed and flexibility of the distribution network. If the RES output is low during load peaks, it will inevitably lead to an increase in FCCGT and carbon emissions, requiring the capture and processing of more CO2. In this case, the power consumption of the carbon capture (CC) device of FCCGT increases accordingly, bringing extra load to the load peaks. This phenomenon is called “peak-on-peak,” which severely damages the power balance of the distribution network.
2) The large-scale utilization of flexible resources from both the supply and demand sides increases the complexity of the distribution network optimal dispatch model. Unreasonable modeling methods and solving algorithms not only fail to improve the economic efficiency of the dispatch plan but may even threaten the safety of distribution network operation and load power supply (Qi et al., 2023; Gabrielli et al., 2022). For example, the HSIL equipment’s working temperature has impacts on the production output and quality, so the changes in temperature need strict limits. If these impacts and limits are ignored in the DR model, the actual response willingness of HSIL may be much lower than expected, which brings greater pressure in turn to the distribution network operation (Wang et al., 2024; Yue et al., 2024).
To solve the problems above, a flexible low-carbon optimal dispatch model is proposed for the distribution network in this paper, which contains the models of FCCGT and a representative HSIL, i.e., MLEAF. The contributions of this model are listed below:
1) The model of FCCGT with storage tanks is constructed, where the non-linear constraints related to the adjustable flue gas diversion ratio is convexified by the McCormick envelope method.
2) The model for the DR participation of MLEAF is proposed, where 0-1 auxiliary variables are introduced to construct the piece-wise function-based production output constraints and the resulting bilinear terms are convexified.
3) Based on the models of FCCGT and MLEAF, a mixed-integer linear stochastic optimization model is established with typical forecast error scenarios of RES and load to realize the low-carbon dispatch of the distribution network, which can be solved by commercial solvers such as CPLEX.
The rest of the paper is organized as follows. In Section 2, the operation mechanism is analyzed and the linearized model is constructed for FCCGT. In Section 3, the DR model of MLEAF is established where the production output constraints are convexified. Then the flexible low-carbon optimal dispatch model of the distribution network is detailed with its objective function and constraints in Section 4. Numerical tests are performed on a modified IEEE 33-bus system and the results are discussed in Section 5. The conclusions are summarized in Section 6.
2 FCCGT operation mechanism and mathematical model
2.1 FCCGT structure and operation mode
Based on the combustion process, CC technologies can be classified into oxy-fuel combustion, pre-combustion capture, and post-combustion capture. Based on the operating modes, they can be divided into slipstream mode, storage mode, and integrated flexible operation mode.
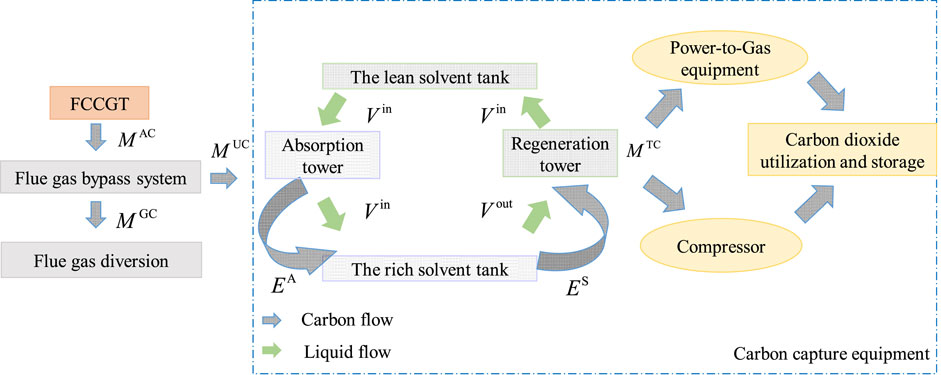
Considering the commercial and technological maturity, the post-combustion capture technology with integrated flexible operation mode is adopted by FCCGT, which is realized by installing a flue gas bypass system and a solvent storage tank on the gas turbine (Song et al., 2024). The operation process of FCCGT is shown in Figure 1.
FCCGT controls the flue gas bypass system to feed a certain proportion of the flue gas generated by the gas turbine into the absorption tower. In this tower, the flue gas reacts with an ethanolamine (MEA) solution to obtain a CO2-rich solution, which is stored in the rich solution storage tank. The rich solution pump is then adjusted to control the rich solution fed to the regeneration tower, where the rich solution is heated with extracted steam to cause counter-reaction to separate CO2 from the MEA. The separated CO2 is partially used as feedstock of a power-to-gas facility to produce methane for the natural gas network, while the remaining CO2 is compressed for storage. The regenerated lean MEA solution is pumped back into the lean solution storage tank and recirculated to the absorption tower for reuse. This integrated flexible operation allows FCCGT to efficiently capture and utilize the CO2 generated by the gas turbine.
Compared to gas turbines equipped with traditional CC device, the unique features of FCCGT are:
1. Flexible and controllable flue gas diversion ratio: By adjusting the flue gas bypass system, the proportion of flue gas entering the CC device can be controlled, allowing a balance between operating costs and carbon emissions.
2. Flexible carbon capture based on solution storage tanks: The CC amount is decoupled with the CC power consumption, which leads to a wider range of net power output of FCCGT. Such CO2 processing flexibility serves as a supplementary resource to promote the consumption of RES power and contribute to the power balance of the distribution network.
Due to these distinctive features, a targeted model needs to be established for FCCGT.
2.2 The mathematical model of FCCGT
According to Figure 1, the model reflecting the power output and real-time CC amount of FCCGT is expressed as follows:
where t is the index of time.
According to (Equation 1), by controlling the inflow and outflow of the rich solution storage tank, the amount of CO2 flowing into the absorption tower
Since the CO2 is stored in the solution in the state of MEA compound, the variables related to the mass of CO2 in (Equation 1) should be converted the volume of MEA solution, which is then used to model the volumetric constraints of the solution storage tanks. The conversion between CO2 mass and MEA volume is shown as:
where
Then the volumetric constraints of the solution storage tanks can be modeled as follows:
where
Besides, the solution storage tanks should not flow in and out MEA simultaneously, and the inflow and outflow have upper limits, which are expressed as follows.
where
2.3 The convexification of the FCCGT model
The bilinear term
where ωt is an auxiliary variable used to replace
3 The demand response model for MLEAF
MLEAF utilizes the heat generated by the alternating current arc to heat the dolomite ore to a molten state to obtain magnesium oxide crystals, so MLEAF is a representative high-energy-consuming HSIL. The MLEAF can control its load power by adjusting the electrodes with an electrode controller, which regulates the current within the furnace. Even if regulated with a small percentage of the rated power, MLEAF can effectively supplement the regulation capacity required by the distribution network, serving as a flexible DR resource. The specific model is described as follows.
3.1 The MLEAF model
Based on the production principles and operating modes of the MLEAF, its DR model for day-ahead optimal dispatch is constructed, which consists of the following constraints.
(1) Constraints of MLEAF regulatable capacity
where
(2) The constraints of regulation times of MLEAF
During a complete production cycle, the regulation times for each MLEAF should not exceed the predetermined upper limits to avoid adverse impact on the product purity. The relevant constraints are shown as follows:
where
(3) The constraints of the MLEAF production output
To ensure that the MLEAF production output still meets requirements after participating in the DR project, the following constraints are constructed:
where
where λ1、λ2 and λ3 are the MLEAF yield under the power decrease state, nominal state, and power increase state.
3.2 Linearization of MLEAF production output constraints
The MLEAF production output constraints given by Equations 9, 10 are conditional constraints, which cannot be solved by common commercial solvers directly. To address this problem, auxiliary variables are first used to perform piecewise linearization of (Equation 10):
where λm,t is the output yield of the m-th MLEAF at time t.
Based on (Equations 9, 11) can be rewritten as:
Similarly with (Equation 1), the bilinear term in (Equation 12) can also be convexified using McCormick envelopes:
where om,t is an auxiliary variable used to replace the bilinear term λm,tPm,t in (Equation 12).
Although λm,t is discrete, it still has minimum and maximum values, which are λ1 and λ3, respectively. The minimum and maximum values Pm,t of are
Finally, the MLEAF production output constraints are composed of (Equations 11, 13, 14).
4 Flexible low-carbon optimal dispatch model of the distribution network
In the day-ahead optimal dispatch, the power curves of RES output and load is firstly forecasted. Then the historical forecast error data are used to construct forecast error scenarios. By combining the forecasted power curves with the forecast error scenarios, the day-ahead stochastic scenarios of RES output and load are obtained with their corresponding probabilities. On the basis of the scenarios, a flexible low-carbon stochastic optimal dispatch model is established for the distribution network by taking into account the CC amount and power consumption decoupling of FCCGT and the DR potential of MLEAF. The objective function and constraints of this dispatch model are detailed as below.
4.1 Typical scenario generation method
The scenario generation method in (Zhang et al., 2021) is adopted here, whose procedures are given below.
Step 1: Organize the historical forecast error data of RES and load power as a matrix.
Step 2: Compute the eigenvectors of the forecast error matrix. Based on the eigenvectors, the minimum volume enclosing ellipsoid of the historical error data points are determined.
Step 3: The circumscribed polyhedron of the ellipsoid is obtained by an expansion method. Then the coordinates of the vertices of the circumscribed polyhedron are the derived typical forecast error scenarios.
Step 4: Add each typical forecast error scenario to the base forecast power of RES and load to obtain their typical scenarios, which are used in the objective and constraints of the proposed Flexible low-carbon optimal dispatch model.
4.2 Objective function
The objective function of the proposed dispatch model is to minimize the total operation cost of the distribution network.
(1) The start-up and shut-down cost of the FCCGT
where i is the index of FCCGT.
(2) The operational cost of the FCCGT
where k is the index of the typical scenarios. Nsce is the total number of typical scenarios. pk is the weight coefficient of scenario k.
(3) The cost of purchasing power from the superior power grid
where
(4) The subsidy cost for the DR incentive of MLEAF
where NM is the total number of MLEAFs. cm1 and cm2 are the unit subsidies for increment and decrement responses of MLEAF, respectively.
(5) The carbon tax cost
This paper considers the implementation of a carbon tax policy in the distribution network and calculates the carbon tax cost associated with CO2 emissions as follows:
where
(6) The penalty cost for wind and solar power curtailment
where
(7) The load shedding cost
where
Based on (Equations 15–21), the total cost of the distribution network is calculated by Equation 22 as follows:
4.3 Constraints
(1) Constraints of FCCGT
The relevant constraints have been given by Equations 1–6.
(2) Constraints of MLEAF
The relevant constraints have been given by Equations 7–14.
(3) Power balance constraints
where
(4) Transmission capacity constraints of power lines
where Klb is the power flow distribution factor of bus b to line l (Cai et al., 2022). flmax is the maximum transmission power of line l.
(5) Wind and solar curtailment and load-shedding constraints
(6) Power output and ramp constraints of FCCGT
where URi and DRi are the maximum upward and downward ramp rate of the i-th FCCGT.
(7) Minimum duration constraints of on and off states of FCCGT
where
5 Numerical tests
5.1 Basic settings
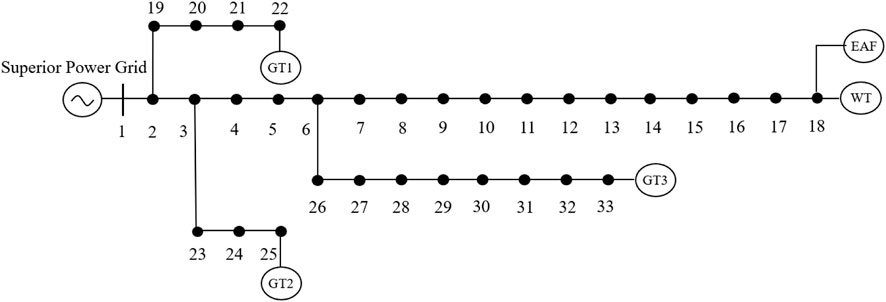
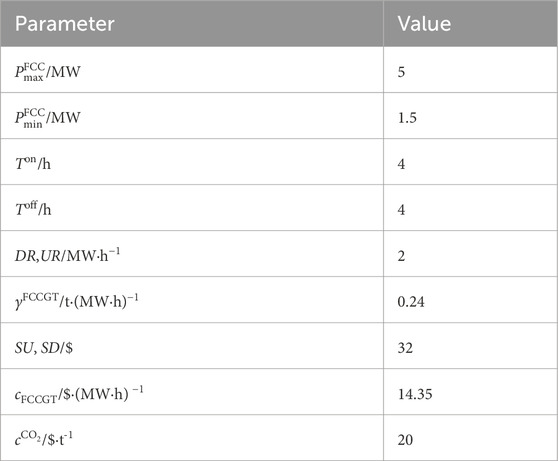
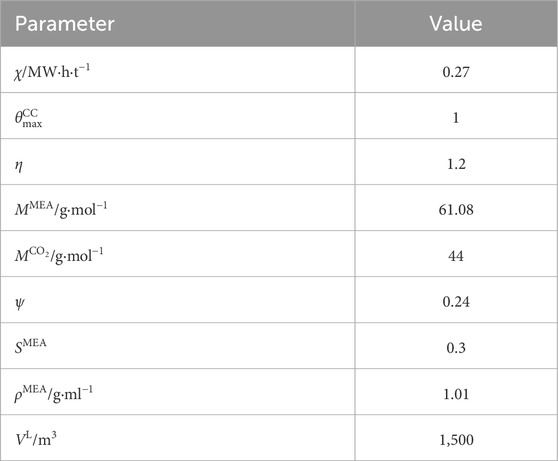
A modified IEEE 33-bus standard system is designed as the test distribution system, whose network structure is shown in Figure 2. This designed system includes three identical FCCGTs, i.e., GT1-GT3, which are connected to buses 22, 25, and 33, respectively. The technical parameters of GT1-GT3 are shown in Table 1. The three FCCGTs have the same type of CC devices, with the parameters listed in Table 2.
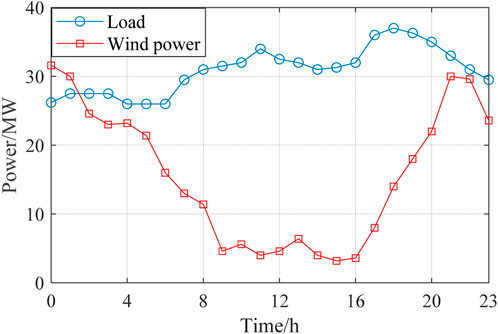
The wind farm is connected to Bus 18, with its forecasted power output shown in Figure 3. The penalty price for curtailing wind power is 100 $/MW·h. Apart from MLEAF, the forecasted power of all the other loads in the distribution network is also shown in Figure 3. The ratio of load at each bus to the total load is the same with that in the original IEEE 33-bus standard system, which can be found in (Yang et al., 2021) and not elaborated here.
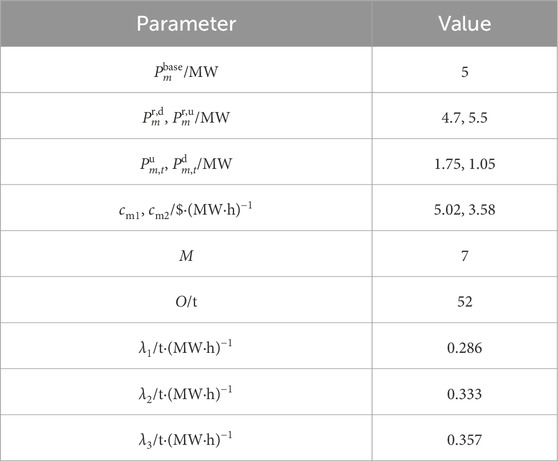
The MLEAF is connected to Bus 18. When not participating in DR project, the MLEAF daily power curve is a horizontal line with its value equal to the rated power. The relevant parameters are shown in Table 3.
The electricity price for purchasing power from the superior power grid adopts time-of-use pricing, where the peak, flat and valley periods are divided according to the load curve shape shown in Figure 3. The corresponding prices for each period are shown in Table 4. The average carbon emission factor for purchased electricity is 0.65 t/MW h.
Based on the parameters above, three different scenarios are designed for comparative analysis to verify that the incorporation of FCCGT and DR of MLEAF can improve the economic efficiency, low-carbon attribute and flexibility of the distribution network. These scenarios are as follows.
Scenario 1: GT1-GT3 are equipped with CC devices without solution storage tanks and with a fixed flue gas diversion ratio. The MLEAF does not participate in the DR project.
Scenario 2: GT1-GT3 are FCCGTs with adjustable flue gas diversion ratios. The MLEAF does not participate in the DR project.
Scenario 3: GT1-GT3 are FCCGTs with adjustable flue gas diversion ratios. The MLEAF takes part in the DR project. This scenario corresponds to the flexible low-carbon optimal dispatch model proposed in Section 4.
All three scenarios are modeled with the YALMIP toolbox and solved by the CPLEX solver on the MATLAB platform.
5.2 Comparison and analysis of dispatch results for the three scenarios
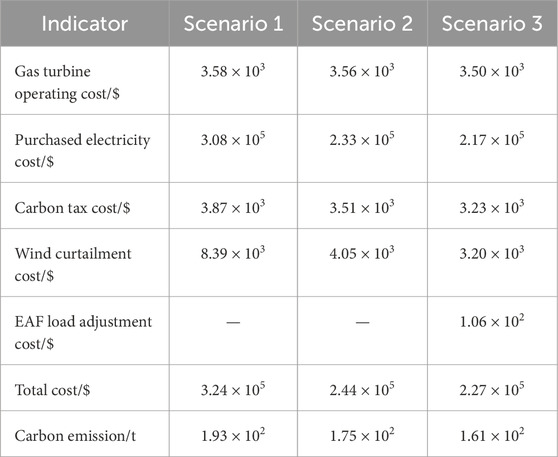
The dispatch costs are shown in Table 5.
According to Table 5, it can be found that.
1) In Scenario 2, the carbon emission is reduced by 18 t compared to Scenario 1. The wind power curtailment penalty is decreased by 4,340 $. The total cost is decreased by 8,000 $. This indicates that the FCCGT has higher flexibility than gas turbines equipped with CC devices without solution storage tanks, which improves CC efficiency and promotes the utilization of renewable energy.
2) In Scenario 3, carbon emission is reduced by 14 t compared to Scenario 2. The total cost is decreased by 9.7 × 10⁴ $ and 1.7 × 10⁴ $ compared to Scenario 1 and Scenario 2, respectively. This indicates that, incorporating the DR of MLEAF into the distribution network dispatch can significantly improve the energy utilization efficiency, effectively reduce the peak loads and lower the carbon emission.
In summary, the effectiveness of the proposed flexible low-carbon optimal dispatch model is validated by comparing the total costs, carbon emissions and wind curtailment of the three scenarios.
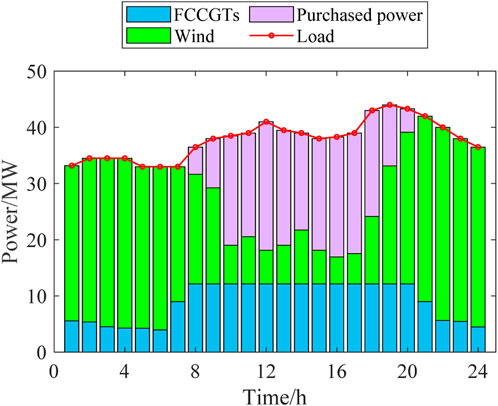
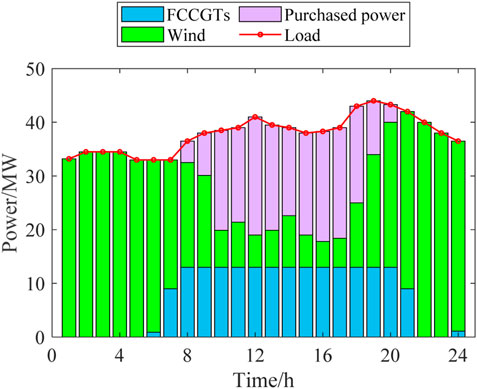
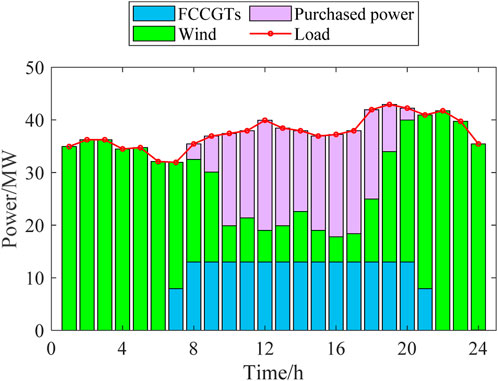
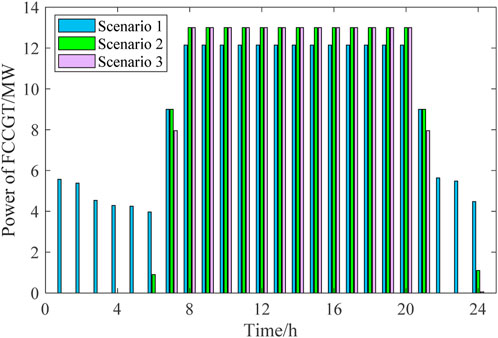
The dispatch schemes of the three scenarios are shown in Figures 4–6.
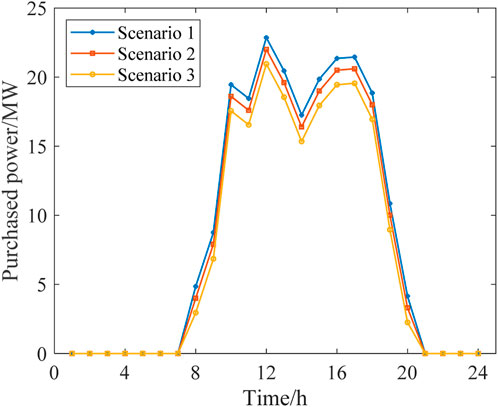
According to Figures 4–7, the outputs of all the power sources during the peak load periods are compared between the three scenarios. It can be found that the proposed model can optimize the output of FCCGTs and the wind farm, so the distribution network can effectively interact with the superior power grid to achieve the “peak shaving and valley filling” effect. More specifically, during peak periods, the external power purchase is decreased by utilizing MLEAF to reduce its own load. During off-peak periods, the consumption of wind power is increased through reasonable dispatching, which also reduces the external power purchase. Since the carbon emission factor of purchased electricity is higher than that of gas turbines and wind power, the proposed model results in a decrease in the total daily carbon emissions, which proves its low-carbon property.
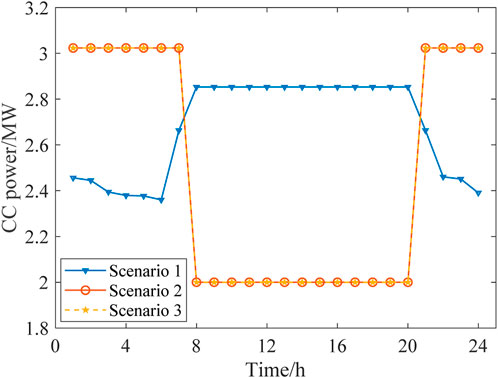
According to Figures 8, 9, the fixed gas diversion ratio in Scenario 1 results in a nearly constant high CC power during peak periods, which further leads to a shortage in the feed-in power of the FCCGTs and exacerbates the power generation deficit. In Scenarios 2 and 3, CO2 that cannot be processed during peak periods is stored in the solution tanks and processed later in the off-peak periods. In this way, the CC power consumption during peak periods is reduced to zero, which allows FCCGTs to provide more feed-in power during peak periods and more CO2 processing load during off-peak periods. Such flexibility promotes RES power consumption and achieves peak-shaving and valley-filling effects.
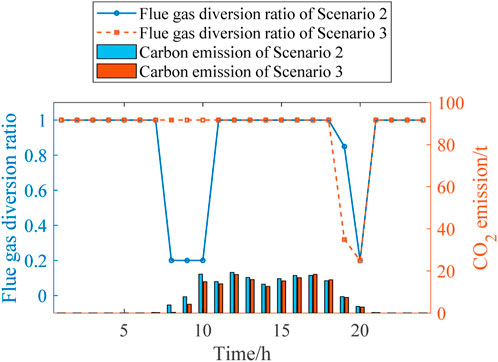
According to Figure 10, during the peak period from 18:00 to 20:00, the gas diversion ratio in Scenario 3 is higher than that in Scenario 2. This is because the DR of the MLEAF alleviates the power output pressure of FCCGTs during peak periods. More specifically, MLEAF actively responds to the distribution network’s peak shaving instructions and reduces its load demand, so the required power output and the corresponding CO2 generated by FCCGTs are both lowered. Therefore, FCCGTs can provide more CC power to process the smaller amount of carbon emission, which results in the higher flue gas diversion ratio in Scenario 3.
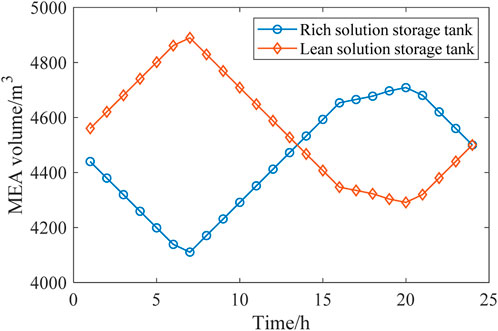
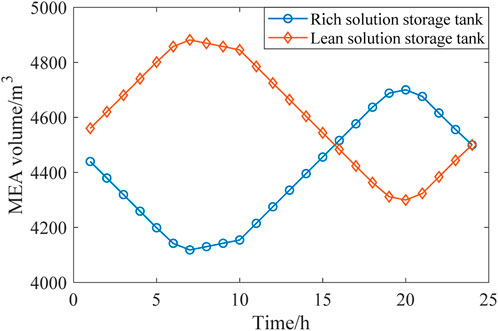
According to Figure 11, the solution volumes in the rich and lean solution tanks vary with time to react with the operation condition of the distribution network. During the peak periods, the MEA solution volume in the rich solution tank increases, which indicates that CC power is reduced in these periods and CO2 is stored temporarily for later processing. During the valley periods, MEA flows out of the rich solution tank to release CO2 and then flows into the lean solution tank, which indicates that the CC power increases to process the CO2 temporarily stored in peak periods.
Through the coordinated operation of the rich and lean solution tanks, the CC amount and the CC power consumption are decoupled, contributing to the flexible low-carbon economic dispatch of the distribution network.
From the comparison of Figures 11, 12, it can be observed that compared to Scenario 2, Scenario 3 additionally considers the flexibility brought by the DR of MLEAF. Therefore, the CC devices can operate more efficiently across different load periods, which better balances the operating efficiency and energy consumption of the FCCGTs. With the flexibility from both the generation and load sides, the overall efficiency and stability of the distribution network is improved, which means lower operation costs and smaller environmental impact.
6 Conclusion
A novel flexible low-carbon optimal dispatch model is proposed in this paper for the distribution network, which coordinates FCCGTs and the DR of MLEAF to achieve balances between the operation efficiency, carbon emissions, RES power curtailment and load shedding amount. The correctness and advantages of the proposed model is verified by designed numerical tests. The specific conclusions are as follows:
1) By modelling the flexibility provided by the solution tanks and flue gas diversion system of FCCGTs, the carbon emission and processing is effectively controlled by the CC devices, which improves the utilization efficiency of fossil energy in the optimal dispatch of the distribution network.
2) The cooperation of the FCCGTs and the DR of MLEAF avoids the frequent start and stop of FCCGTs and alleviates the pressure peak regulation. Under this condition, the distribution network can operate in more stable and efficient mode, which realizes the environmental sustainability and economic benefits.
Data availability statement
The original contributions presented in the study are included in the article/supplementary material, further inquiries can be directed to the corresponding author.
Author contributions
WW: Funding acquisition, Methodology, Software, Supervision, Writing–original draft, Writing–review and editing. HH: Conceptualization, Data curation, Software, Supervision, Writing–review and editing. XZ: Data curation, Project administration, Resources, Validation, Writing–review and editing. JT: Conceptualization, Formal Analysis, Validation, Writing–review and editing. SS: Conceptualization, Supervision, Validation, Writing–review and editing.
Funding
The author(s) declare that financial support was received for the research, authorship, and/or publication of this article. The financial aid received from Jiangsu Provincially Managed Industrial Projects (JC2024003) is gratefully acknowledged.
Conflict of interest
Authors WW, HH, and SS were employed by Nanjing Suyi Industrial Co., Ltd. Author XZ was employed by Nanjing Suyi Industrial Co., Ltd. Author JT was employed by Nanjing Huaqun Energy Group Co., Ltd.
Generative AI statement
The author(s) declare that no Generative AI was used in the creation of this manuscript.
Publisher’s note
All claims expressed in this article are solely those of the authors and do not necessarily represent those of their affiliated organizations, or those of the publisher, the editors and the reviewers. Any product that may be evaluated in this article, or claim that may be made by its manufacturer, is not guaranteed or endorsed by the publisher.
References
Boldrini, A., Koolen, D., Crijns-Graus, W., Worrell, E., and van den Broek, M. (2024). Flexibility options in a decarbonising iron and steel industry. Renew. Sustain. Energy Rev. 189, 113988. doi:10.1016/j.rser.2023.113988
Cai, J., Hao, L., Xu, Q., and Zhang, K. (2022). Reliability assessment of renewable energy integrated power systems with an extendable Latin hypercube importance sampling method. Sustain Energy Techn 50, 101792. doi:10.1016/j.seta.2021.101792
Cheng, L., Zang, H., Wei, Z., and Sun, G. (2023). Secure multi-party household load scheduling framework for real-time demand-side management. IEEE T Sustain Energ 14 (1), 602–612. doi:10.1109/tste.2022.3221081
Chyong, C. K., Reiner, D. M., Ly, R., and Fajardy, M. (2023). Economic modelling of flexible carbon capture and storage in a decarbonised electricity system. Renew. Sust. Energ Rev. 188, 113864. doi:10.1016/j.rser.2023.113864
Condessa, G. Á., Ismail, K. A. R., Hunt, J. D., Ponce Júnior, N., Velásquez, R. M. G., Borges, V. L., et al. (2023). Electricity generation potential from natural gas pressure reduction turbines in Brazil. Energ Effic. 16 (8), 97. doi:10.1007/s12053-023-10176-8
de Chalendar, J. A., McMahon, C., Fuentes Valenzuela, L., Glynn, P. W., and Benson, S. M. (2023). Unlocking demand response in commercial buildings: empirical response of commercial buildings to daily cooling set point adjustments. Energ Build. 278, 112599. doi:10.1016/j.enbuild.2022.112599
Deng, L., Sun, H., Li, B., Sun, Y., Yang, T., and Zhang, X. (2021). Optimal operation of integrated heat and electricity systems: a tightening McCormick approach. Engineering 7 (8), 1076–1086. doi:10.1016/j.eng.2021.06.006
Fan, W., Ju, L., Tan, Z., Li, X., Zhang, A., Li, X., et al. (2023). Two-stage distributionally robust optimization model of integrated energy system group considering energy sharing and carbon transfer. Appl. Energ 331, 120426. doi:10.1016/j.apenergy.2022.120426
Gabrielli, P., Campos, J., Becattini, V., Mazzotti, M., and Sansavini, G. (2022). Optimization and assessment of carbon capture, transport and storage supply chains for industrial sectors: the cost of resilience. Int. J. Greenh. Gas. Con 121, 103797. doi:10.1016/j.ijggc.2022.103797
Gao, X., Wang, S., Sun, Y., and Zhai, J. (2024). Low-carbon operation of integrated electricity-gas system with hydrogen injection considering hydrogen mixed gas turbine and laddered carbon trading. Appl. Energ 374, 123902. doi:10.1016/j.apenergy.2024.123902
Huang, Y., Chen, S., Chen, Z., Hu, W., and Huang, Q. (2020). Improved probabilistic load flow method based on D-vine copulas and Latin hypercube sampling in distribution network with multiple wind generators. IET Generation, Transm. and Distribution 14 (5), 893–899. doi:10.1049/iet-gtd.2019.1126
Qi, X., Zhao, T., Liu, X., and Wang, P. (2023). Three-Stage stochastic unit commitment for microgrids toward frequency security via renewable energy deloading. IEEE T Smart Grid 14 (6), 4256–4267. doi:10.1109/tsg.2023.3263273
Shao, C., Feng, C., Shahidehpour, M., Zhou, Q., Wang, X., and Wang, X. (2021). Optimal stochastic operation of integrated electric power and renewable energy with vehicle-based hydrogen energy system. IEEE T Power Syst. 36 (5), 4310–4321. doi:10.1109/tpwrs.2021.3058561
Song, J., Zhang, Z., Mu, Y., Wang, X., Chen, H., Pan, Q., et al. (2024). Enhancing environmental sustainability via interval optimization for low-carbon economic dispatch in renewable energy power systems: leveraging the flexible cooperation of wind energy and carbon capture power plants. J. Clean. Prod., 442. doi:10.1016/j.jclepro.2024.140937
Tan, W. S., Shaaban, M., and Ab Kadir, M. Z. A. (2019). Stochastic generation scheduling with variable renewable generation: methods, applications, and future trends. IET Generation, Transm. and Distribution 13 (9), 1467–1480. doi:10.1049/iet-gtd.2018.6331
Wang, J., Wang, Q., and Sun, W. (2023a). Quantifying flexibility provisions of the ladle furnace refining process as cuttable loads in the iron and steel industry. Appl. Energ 342, 121178. doi:10.1016/j.apenergy.2023.121178
Wang, W., Chai, T., Wang, H., and Wu, Z. (2023b). Signal-compensation-based adaptive PID control for fused magnesia smelting processes. IEEE T Ind. Electron 70 (9), 9441–9451. doi:10.1109/TIE.2022.3212392
Wang, Y., Gao, S., Jia, W., Ding, T., Zhou, Z., and Wang, Z. (2022). Data-driven distributionally robust economic dispatch for park integrated energy systems with coordination of carbon capture and storage devices and combined heat and power plants. IET Renew. Power Gen. 16 (12), 2617–2629. doi:10.1049/rpg2.12436
Wang, Y., Yang, Z., Zhao, X., Liu, H., Wang, D., and Liu, C. (2024). Fine-grained modeling and coordinated scheduling of source-load with energy-intensive electro-fused magnesium loads. IEEE Access 12, 47702–47712. doi:10.1109/access.2024.3381781
Wilkes, M. D., Mukherjee, S., and Brown, S. (2021). Transient CO 2 capture for open-cycle gas turbines in future energy systems. Energy 216, 119258. doi:10.1016/j.energy.2020.119258
Xu, D., Xiang, S., Bai, Z., Wei, J., and Gao, M. (2023). Optimal multi-energy portfolio towards zero carbon data center buildings in the presence of proactive demand response programs. Appl. Energ 350, 121806. doi:10.1016/j.apenergy.2023.121806
Xu, J., and Yi, Y. (2023). Multi-microgrid low-carbon economy operation strategy considering both source and load uncertainty: a Nash bargaining approach. Energy (Oxford) 263, 125712. doi:10.1016/j.energy.2022.125712
Yang, M., Li, J., Li, J., Yuan, X., and Xu, J. (2021). Reconfiguration strategy for DC distribution network fault recovery based on hybrid particle swarm optimization. Energies 14 (21), 7145. doi:10.3390/en14217145
Yue, X., Liao, S., Xu, J., Ke, D., Wang, H., Yang, J., et al. (2024). Collaborative optimization of renewable energy power systems integrating electrolytic aluminum load regulation and thermal power deep peak shaving. Appl. Energ 373, 123869. doi:10.1016/j.apenergy.2024.123869
Zhang, B., Hu, W., Ghias A, M. Y. M., Xu, X., and Chen, Z. (2023). Multi-agent deep reinforcement learning based distributed control architecture for interconnected multi-energy microgrid energy management and optimization. Energ Convers. Manage 277, 116647. doi:10.1016/j.enconman.2022.116647
Zhang, S., Qiu, G., Liu, Y., Ding, L., and Shui, Y. (2024). Data-Driven distributionally robust optimization-based coordinated dispatching for cascaded hydro-PV-PSH combined system. Electronics-Switz. 13 (3), 667. doi:10.3390/electronics13030667
Zhang, W., and Zhu, T. (2024). Flexible resource demand response scheduling strategy under 5G-V2X. Sustain. Energy, Grids Netw. 39, 101441. doi:10.1016/j.segan.2024.101441
Zhang, Y., Liu, Y., Shu, S., Zheng, F., and Huang, Z. (2021). A data-driven distributionally robust optimization model for multi-energy coupled system considering the temporal-spatial correlation and distribution uncertainty of renewable energy sources. Energy 216, 119171. doi:10.1016/j.energy.2020.119171
Zhao, X., Wang, Y., Liu, C., Cai, G., Ge, W., Zhou, J., et al. (2024). Low carbon scheduling method of electric power system considering energy-intensive load regulation of electrofused magnesium and wind power fluctuation stabilization. Appl. Energ 357, 122573. doi:10.1016/j.apenergy.2023.122573
Nomenclature
Abbreviations
RES renewable energy sources
CC carbon capture
FCCGT gas turbines installed with flexible CC technology
HSIL heat storage industrial loads
DR demand response
MLEAF magnesium load using an electric arc furnace
Indices
t index of time
i index of FCCGT
w index of wind farms
v index of photovoltaic power stations
b index of load buses
l index of line
m index of MLEAF
Variables
λm,t yield rate of the m-th MLEAF at time t
Parameters
T total time slots in a dispatching cycle
λ1, λ2, λ3 the MLEAF yield rates under the power decrease/nominal/increase state
Nsce total number of scenarios
pk weight coefficient of scenario k
NM total number of MLEAFs
cm1, cm2 unit subsidy of increment/decrement response of MLEAF
Nw the number of wind farms
Nv the number of photovoltaic power stations
URi,DRi upward/downward ramp rate of FCCGT i
Keywords: heat storage industrial loads, demand response, carbon capture devices, flexible low-carbon optimal dispatch, renewable energy
Citation: Wang W, Huang H, Zhang X, Tan J and Sun S (2024) Flexible low carbon optimal dispatch of distribution networks considering the demand response of heat storage industrial loads. Front. Energy Res. 12:1507604. doi: 10.3389/fenrg.2024.1507604
Received: 08 October 2024; Accepted: 06 November 2024;
Published: 20 November 2024.
Edited by:
Haifeng Qiu, Nanyang Technological University, SingaporeReviewed by:
Yu Huang, Nanjing University of Posts and Telecommunications, ChinaLingling Wang, Shanghai Jiao Tong University, China
Yucui Wang, North China Electric Power University (Baoding), China
Copyright © 2024 Wang, Huang, Zhang, Tan and Sun. This is an open-access article distributed under the terms of the Creative Commons Attribution License (CC BY). The use, distribution or reproduction in other forums is permitted, provided the original author(s) and the copyright owner(s) are credited and that the original publication in this journal is cited, in accordance with accepted academic practice. No use, distribution or reproduction is permitted which does not comply with these terms.
*Correspondence: Wendi Wang, c3k1ODQyNzg4NzRAMTYzLmNvbQ==
 Wendi Wang
 Hao Huang1