- 1School of Electrical Engineering and Automation, Harbin Institute of Technology, Harbin, China
- 2Economic and Technological Research Institute of State Grid Fujian Electric Power Co., Ltd., Fuzhou, China
- 3State Grid Economic and Technological Research Institute Co., Ltd., Beijing, China
Modern power systems are developing rapidly, with distributed energy, energy storage devices, adjustable loads, and other flexible resources consolidated through microgrids, virtual power plants, and integrated source–network–load–storage systems. This consolidation under various balancing zone models facilitates synergistic operations and has become critical to enhancing distributed power consumption and ensuring the reliability of electricity supply. Therefore, in light of the challenges of inadequate economic efficiency, reduced accommodation of renewable energy, and poorer operational reliability in distribution networks, this study proposes a category selection and flexibility resource scheduling method that considers the differences in multiple balancing zone models and modes. Firstly, the approach establishes a multi-dimensional characteristic evaluation index and multiple balancing zone operation models. The characteristic evaluation indicators are then utilized to assess the unique properties of the balancing zone system and eliminate unreasonable operating modes. Finally, through analyzing the effectiveness and differences of various balancing zone operation modes, an optimal operation mode is selected, and a scheduling plan is formulated. We conclude that the scheduling plan optimization method considering the operation mode can realize a reasonable choice of operation modes and achieve benefit optimization.
1 Introduction
In the developing industry of new power system construction, power system structures have undergone significant transformation. They have been faced with the challenges of operational mode diversification, probabilistic supply–demand balance, bidirectional power flow, complex energy coupling, and the gradual decentralization of flexible resources. As the power sector worldwide undergoes a swift transition, market mechanism-based operation of the power system is a given, yet direct DG (distributed generation) participation in market operations reveals certain limitations due to its inherent traits of small capacity, intermittency, and unpredictability. However, aggregating DG into a cohesive entity has emerged as a viable solution, offering a promising approach for addressing these issues (Mashhour and Moghaddas-Tafreshi, 2009).
Much research has been conducted on the optimal scheduling of flexible resources with various balancing zone models.
Microgrids are combinations of closely interconnected loads and distributed energy sources and are located at well-defined boundaries within the electrical range. They act as a single controllable entity in relation to the grid, capable of being either connected to the main grid or disconnected and operating independently in island mode (Olivares et al., 2014). The continuous integration of renewable energy sources into microgrids makes the optimal scheduling of microgrids challenging (Zhang and Tang, 2024). Many studies have proposed solutions for this problem. In Ma et al. (2011), an enhanced bacterial foraging algorithm was employed to optimize the scheduling of flexible resources within a multivariate hybrid microgrid incorporating wind, photovoltaic, and energy storage resources. Their analysis comprehensively assessed the impact of wind and solar energy’s uncertain and intermittent characteristics and the charge–discharge dynamics of energy storage devices on microgrid resource scheduling. A coordinated optimization strategy based on model predictive control (MPC) was designed by Abdelghany et al. (2013) to achieve multi-objective optimal operation of grid-connected wind microgrids by considering equipment operating cost, lifetime deterioration, and system economic benefits. Yang et al. (2024) considered frequency security and stability problems in microgrid planning and proposed a frequency constraint optimization method involving long-term and short-term uncertainties. By constructing a flexible power trading market, the system’s overall efficiency can be enhanced while respecting individual interests and privacy which is also a new method for the optimal scheduling of islanded multi-microgrids (Zhao et al., 2022). In the development of microgrid optimal scheduling, the operational strategy of microgrids has increasing emphasis placed on the flexible orchestration and utilization of these resources to optimize system performance (Torbaghan et al., 2018).
A virtual power plant (VPP) is a simple collection of distributed energy sources that integrate geographically dispersed power sources and flexible loads for coordinated and optimized control and participation in the power market through advanced communication, control, and other technologies and energy management systems (Peng et al., 2023). There has been much research on modeling the aggregation characteristics of various types of resources in VPP models. Considering market clearing procedures, VPP operational profitability, and the interests of distributed energy resource (DER) aggregators, a three-tier hierarchical structure for VPP has been devised to formulate bidding strategies for the higher-level market operator and delineate dynamic pricing incentive curves collaboratively with subordinate DER proprietors (Zhongkai et al., 2021).
Xin et al. (2013) proposed a distributed generation control strategy for diverse VPP types, enabling the collaborative aggregation of distributed generators by coordinating their output and thereby forming virtual power plants within distribution networks. Bagchi et al. (2018) constructed a VPP model that can comprehensively consider the aggregation characteristics and capacities of multiple generation devices, energy storage systems, and loads. This approach facilitates a thorough evaluation of the operational features of an entire VPP. An innovative multi-timescale economic dispatch strategy for VPP is proposed in Yi et al. (2019), which effectively solves the problem of many small-capacity flexible loads participating in the electricity market by aggregating and disaggregating delayable loads. In addition, Hu et al. (2022) designed a corresponding multi-armed bandits (MAB) online learning control method based on the framework of a synchronous VPP with a grid-configuration inverter, showing that a VPP can also provide adjustable inertia support to the grid like a conventional synchronous power plant (Hu et al., 2022).
In the context of global energy transition, there has been much research on the scheduling of resources in integrating source–grid–load–storage (SGLS). Such an integrated energy system is of great significance for effectively integrating large-scale new energy sources and guaranteeing the stable operation of modern power systems (Ma et al., 2024). In facing the requirements of China’s novel energy consumption patterns and the trading demands of participants in its power market, a SGLS continuous trading mechanism, alongside a multi-time-scale trading simulation approach, is proposed by Dou et al. (2022). This would improve current SGLS coordinated optimal scheduling methods with their unsatisfactory efficiency and effectiveness by an SGLS coordinated optimal scheduling model.
Fu et al. (2024) combined convolutional neural networks, modal decomposition, and long- and short-term memory neural networks to achieve the short-term forecasting of load. Yang et al. (2021) examined the complementarity of peak regulation resources on source, network, load, and storage, achieving optimal matching of photovoltaic permeability and peak regulation capability in transmission and distribution network systems through deep interaction and cooperative operation. The SGLS operation mode will develop to use local networks for internal power transmission and distribution, allocating renewable energy generation and storage equipment on a particular scale at the energy user level. The power exchange between the system and other systems and the main power grid can thus be facilitated (Li et al., 2022a).
An extensive literature review shows that researchers have made notable progress in the planning and scheduling of flexible resources, demonstrating that the coordination of diverse, flexible resources through balancing zones can significantly enhance system safety and economic efficiency. However, researchers have not yet fully leveraged the distinct model characteristics and technical advantages of various balancing zone types, such as microgrids, VPP, and SGLS systems. Moreover, existing research has failed to provide effective methods for choosing the best operational mode for balancing zones, thus creating an urgent need for studies that target different resource combinations. Such research should aim to identify the optimal operational mode for each combination type and design corresponding regulation plans that effectively align with these selected modes.
Therefore, this comparative study and analysis will consider the optimal scheduling effects of flexibility resources in different kinds of balancing zones and propose a category selection and flexibility resource scheduling method that considers the differences in multiple balancing zone models and model characteristics based on a comprehensive evaluation of multidimensional indicators. The main contributions of this paper are as follows:
(1) The scheduling optimization of flexible resources by employing multiple balancing zone techniques to enhance the operational efficiency and flexibility of the distribution network system. The precise assessment of each balancing zone’s characteristics through indicators contributes to the optimal allocation of resources and reduces energy waste.
(2) By utilizing multidimensional balancing zone characteristic assessment indexes, a balancing zone model that cannot operate effectively due to its characteristic constraints is initially ruled out, avoiding the irrational allocation of resources and system risks and maintaining the stability and security of the distribution network.
(3) The output of scheduling solutions and operational effects under different balancing zone models also provides comprehensive supporting data for decision-makers to make scientific decisions and optimize operational strategies.
2 Categories and characteristics evaluation indexes of balancing zones
2.1 Categories of balancing zones
Currently, the main types of balancing zones include microgrids, virtual power plants (VPPs), and source–grid–load–storage (SGLS). Different types of balancing zones have similarities but also have distinctive characteristics.
2.1.1 Microgrid
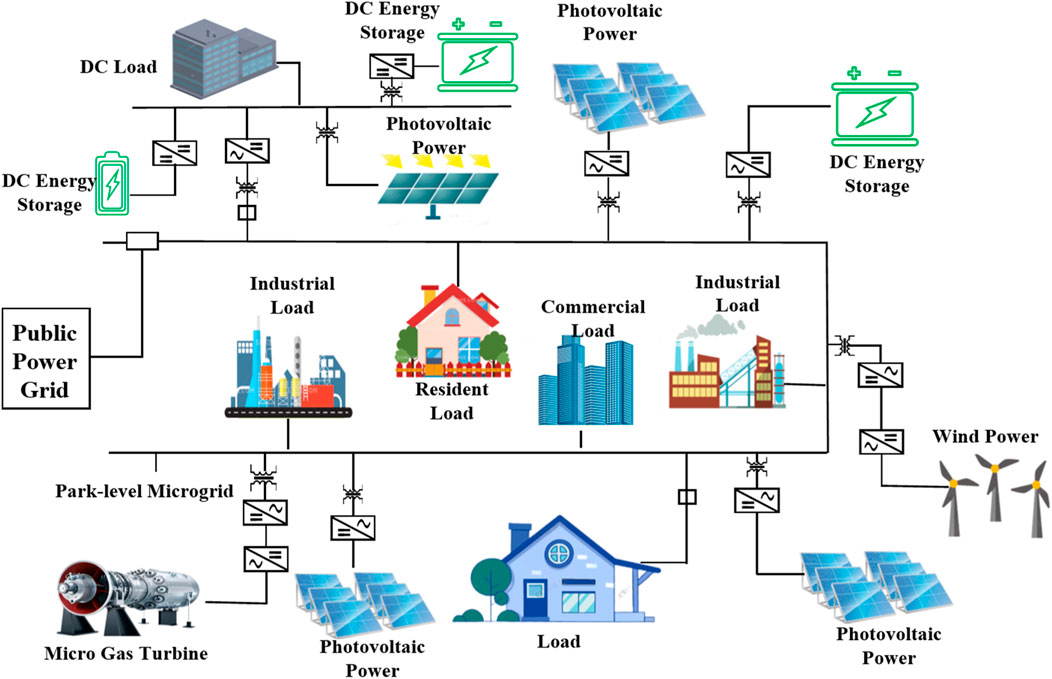
A microgrid is a small-scale power network system that integrates various energy resources, such as photovoltaic, wind power, and natural gas energy, with diverse loads, including electric vehicles, residential users, and industrial consumers. It operates in an isolated mode, known as “island operation”, or is connected to a traditional power grid. The structure diagram of a park-level microgrid is shown in Figure 1. As can be seen, the power sources encompass renewable energy generation equipment including wind and solar power and small-scale hydropower, as well as conventional fossil fuel-based generators such as diesel or gas turbine units. Energy storage devices are utilized for energy conservation and balancing supply and demand, thus enhancing the system’s stability and reliability. Loads, which represent the endpoints in the microgrid structure, include residential, industrial, and commercial premises. The microgrid can interchange electric power with the public power grid, enabling complementary operation between the two.
2.1.2 Virtual Power Plant
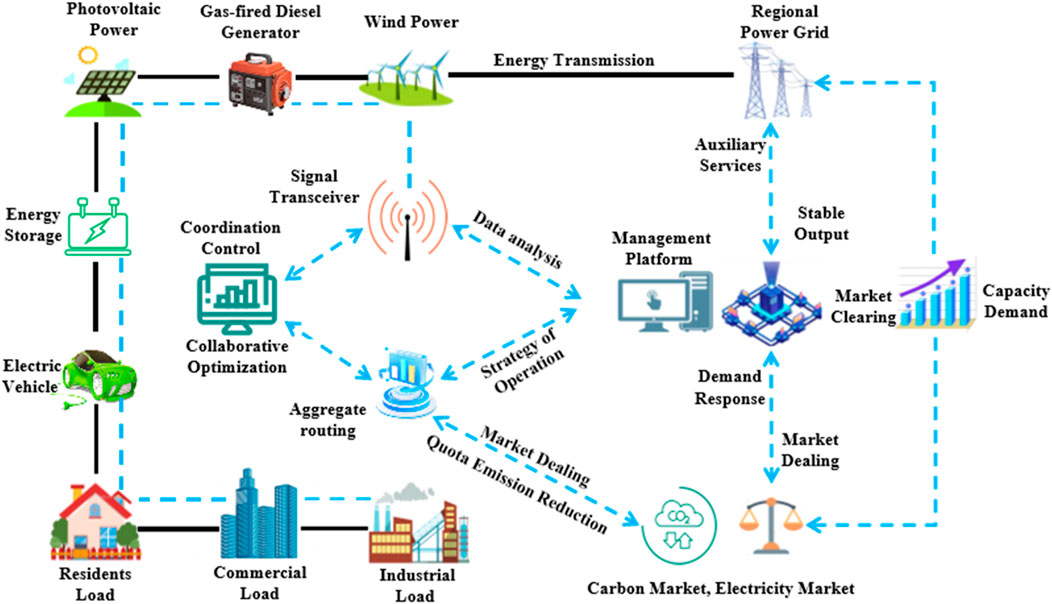
VPP is a management system that realizes the resource aggregation and collaborative optimization of distributed power supply, energy storage, and controlled load through information technology and software systems (Cui et al., 2024). It can simulate the functions of power plants, participate in electricity market transactions, and provide grid ancillary services. The structure of VPP usually includes the resource aggregation layer, the control management layer, and the market transaction layer. The resource aggregation layer is responsible for integrating distributed energy resources, controlling management to execute scheduling instructions, and optimization control, while the market trading layer involves the participation and trading activities of the power market. The structure diagram of VPP is shown in Figure 2.
2.1.3 Integrated Source-grid-load-storage
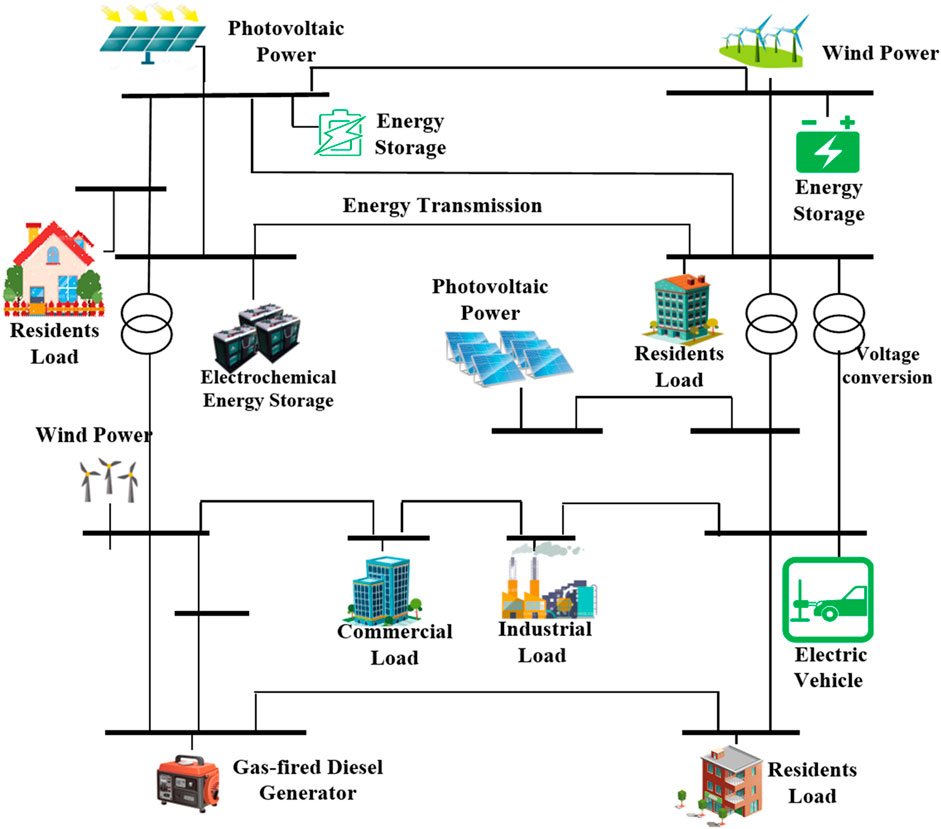
Integrated SGLS is a comprehensive energy system formed by organically integrating energy, the power grid, power load, and the energy storage system to efficiently utilize energy and optimize the balance between energy supply and demand. The structure diagram of integrated SGLS is shown in Figure 3.
2.2 Characteristic evaluation indexes of balancing zones
The balancing zone characteristic assessment indexes established in this study mainly include reliability, stability, flexibility, economy, and coordination. The reliability indicator evaluates the ability of the balancing zone to cope with uncertainties and unexpected events to ensure continuous power supply and stable operation of the power system. The stability indicator evaluates the robustness of the balancing zone to cope with unexpected events in the system dynamics to ensure that the power system maintains stable operation in the face of challenges. The flexibility indicator evaluates the ability of the balancing zone to adapt to changes in load and the fluctuation of renewable energy sources. The flexibility indicator assesses the ability of the balancing zone to adapt to load changes and renewable energy fluctuations to ensure that the power system can effectively respond to different load and energy supply scenarios. The economy indicator evaluates the operating costs and benefits of the balancing zone to ensure that the power system meets customer demand at minimal cost and achieves sustainable development. The coordination indicator evaluates the degree of coordination among the subsystems in the balancing zone to ensure that the various links in the power system are coordinated and harmonized and that overall optimization and resource sharing can be achieved.
2.2.1 Reliability index
2.2.1.1 Power exchanged by DG with the main grid
An amount of power exchanged greater than 0 indicates that the micro-sources in the balancing area during planning cycle T can satisfy the regional load power supply. Conversely, an amount less than 0 indicates that the micro-sources cannot satisfy the regional power supply. This reflects the power exchange between the balancing zone system and the main grid in the evaluation cycle (Zhu and Yang 2018).
where
2.2.1.2 Power generation utilization rate of DG
This is calculated as the ratio of the actual power generation of all DGs in the balancing area to their rated power generation. A high DG generation utilization rate means that the DG equipment can fully utilize its power generation potential to provide a stable and reliable power supply to the grid, which is conducive to improving the overall reliability of the grid; on the other hand, a low DG generation utilization rate indicates that the DG equipment may be unstable in its operation and fails to perform its function.
where
2.2.1.3 Reliability rate of electricity supply
This reflects the proportion of time the system stably provides electricity during the statistical time. It is affected by factors such as the size and structure of the power system, the type and distribution of power sources, the characteristics and distribution of loads, and the operating status of transmission lines and substations.
where
2.2.2 Stability index
2.2.2.1 Power load matching degree
A low power load matching degree indicates that the operational stability of the system is low and a power supply shortage or distribution network failure could easily occur. However, when the power load matching degree is higher, the power generation in the system matches the power demand, making the operation safer and more stable. The total installed capacity of each type of power supply is divided by the maximum load of the system, reflecting the balance between power generation capacity and demand in the balancing zone.
where
2.2.2.2 The proportion of controllable energy
Controllable energy mainly includes controlled nuclear power units, coal power units, and energy storage systems. A higher proportion of controllable energy in the energy composition of the system means that the system has more flexible scheduling and adjustment capability and responds to the output fluctuations caused by new energy access or climate factors in the operation of the power system, according to changes in load demand, to ensure the balance of supply and demand and stable operation.
where
2.2.2.3 Power balance degree
This assesses the degree of power balance in a power system. In power systems, the power balance can be measured by calculating the difference of power, which has a particular influence on the system’s stability and reflects the distribution and loss of power in the system.
where
2.2.2.4 System inertia permeability
System inertia permeability refers to the integrated inertia capacity of the system after the combination of electrical and thermal inertia in the integrated energy system. It is used to slow the immediate imbalance of energy supply and demand in the system, and it reflects the system’s stability.
where
2.2.3 Flexibility index
2.2.3.1 The amplitude-adjustable of power
This refers to the adjustable range of the system’s power output. Larger adjustable amplitude values indicate that the various devices in the system can provide a broader range of power output adjustment to better cope with load fluctuations. This reflects the system’s flexibility in response to load changes, failures, or other emergencies.
where
2.2.3.2 Climbing speed
This is calculated by the ratio of the maximum adjusted output value per minute to the rated capacity of the system. The speed and efficiency of the system in response to external changes are described, reflecting its capacity to lift and drop loads. The climbing speed is typically expressed as a percentage of rated capacity per minute, and different types of generating units, such as hydro, gas, combined cycle, and steam turbines, have distinct climbing speeds.
where
2.2.4 Economic index
2.2.4.1 Comprehensive line loss rate
The comprehensive line loss rate refers to the proportion of the total power loss in the total power supply in a specific area during power transmission. It is a commonly used vital indicator reflecting the power supply management level of the power network. A lower line loss ratio means that the system can reduce the energy lost when transmitting power, thereby reducing the power station’s operating costs and improving the system’s economic performance (Wu et al., 2018).
where
2.2.4.2 Demand response cost ratio
It represents the loss after the user participates in the demand-side response within a certain period. When the demand response cost ratio is relatively low, the power generation operational cost of the system is relatively low, and it depends more on the generator mode when realizing the power balance. When the demand response cost is relatively high, the system operation cost is high, and the system relies more on demand response to maintain the power balance.
where
2.2.5 Coordination index
2.2.5.1 Proportion of spontaneous and self-generated electricity consumption shortage
This is an example of the ratio of the total power demand to the total power demand of the total load in a certain period. A relatively low power shortage ratio indicates that the system’s internal power generation capacity can meet users’ needs and has a strong ability for self-sufficiency. However, a high proportion of self-generated power shortage means that a system’s internal power generation capacity cannot meet users’ power demand. External electricity must then be introduced to make up the gap, which may lead to frequent scheduling and adjustment during the system’s operation and poor coordination (Liu et al., 2022).
where
2.2.5.2 The remaining proportion of self-generated electricity consumption
This indicates the proportion of self-generated residual power in total load demand when the system’s DG generation meets the total load demand in a certain period. The high residual ratio indicates that the power provided by the system is greater than actual consumption, the system can generate excess power, has spare power in the energy supply, can balance supply and demand, and is well coordinated. A close to zero or negative residual ratio means that the system’s self-generated power is insufficient to meet consumption, and it may need supplementary power from the external grid.
where
2.2.5.3 Energy storage capacity to absorb electricity
This quantifies the share of energy stored within the bounds of spontaneous self-utilization capacity over a designated interval. During episodes of severe load undulation within a power system and corresponding shifts in renewable energy output, the energy storage system performs load leveling, thereby securing the system’s power supply stability by assimilating excess electrical power.
where
The multidimensional feature evaluation index is the basis for the subsequent optimal scheduling and allocation of flexible resources in the balance zone. Each index reflects the characteristics of different aspects of the system. However, these indicators are interrelated and influence each other when evaluating the characteristics of the balance zone, so comprehensive consideration is needed.
3 Multi-heterogeneous flexibility resource cost modeling
At present, the flexibility resources in the balancing zone of the distribution network mainly include wind, photovoltaic, storage, load, and other power sources, and energy storage resources and the modeling of the flexibility resources is the basis for analyzing optimal dispatch in the balancing zone. For this reason, the investment costs of the various flexibility resources are modeled in this section.
3.1 Wind turbine
Considering the power dispatching configuration in the balance zone, the corresponding wind turbine total investment cost model is:
In Equation 15:
where
3.2 Photovoltaic generator set
In the optimal scheduling in the equilibrium region, the total investment cost model of photovoltaic cells is:
In Equation 18:
where
3.3 Conventional diesel generator set
Adding diesel generator power to the balancing area provides the flexibility to meet the power needs of the loads within the balancing zone. Conventional diesel engines emit pollutant gases that are harmful to the environment and require fuel combustion. Therefore, fuel combustion, operation and maintenance, and environmental pollution treatment costs must be considered when modeling diesel engines (Wu et al., 2024).
Therefore, the total cost model for constructing a diesel engine in the optimized scheduling is:
In Equation 21:
where
3.4 Energy storage battery
In the optimal scheduling allocation problem of the balancing zone, the total investment cost of the constructed energy storage equipment is:
In Equation 26:
where
4 Flexibility resource optimization scheduling method and multivariate balancing zone modeling
4.1 Flexibility resource optimization scheduling method
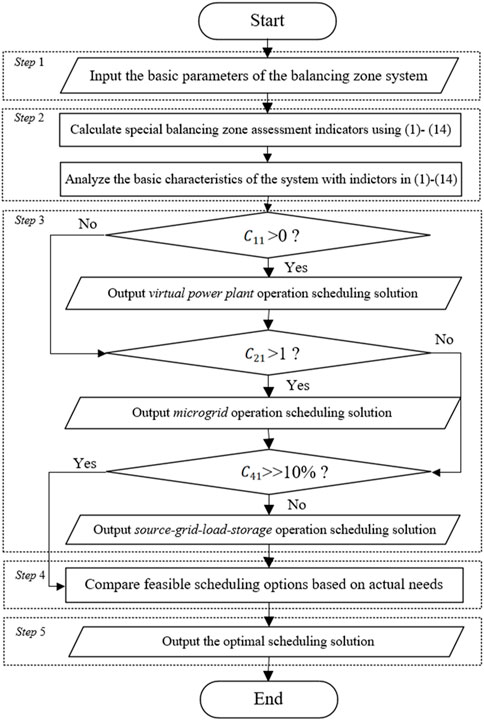
Optimal scheduling of flexibility resources can be achieved through different balancing zone techniques, such as microgrid, SGLS integration, and VPP, to realize the comprehensive optimal solution of flexible resources in the distribution network regarding operation cost and operation reliability. A flowchart of a multivariate heterogeneous flexibility resources optimal scheduling method using feature evaluation indexes, considering the differences between multiple balancing zone models and model features, is shown in Figure 4.
The specific steps are:
Step 1: Input the basic parameters of the balancing zone system.
Step 2: Calculate indicators to determine the feasibility of the balancing zone model.
Step 3: Based on the particular characteristic evaluation indexes of Equations 1, 4, 10, exclude balancing unworkable operation models.
1. If the value of power exchanged by DG with the main grid in Equation 1 is greater than 0, output the scheduling scheme of the VPP operating mode, and vice versa, the operating mode of the virtual power plant is excluded.
2. If the power load matching degree in Equation 4 is greater than 1, the internal power balance constraints of the microgrid are met and output the scheduling scheme of microgrid operation mode, and vice versa; the microgrid operating mode is excluded.
3. If the comprehensive line loss rate in Equation 10 is much higher than 10%, the SGLS operating model will be excluded, and vice versa, the SGLS operating and scheduling scheme will be output.
Step 4: Obtain the judgmental result: practically operable balancing zone model scheduling schemes.
Step 5: Compare the feasible scheduling schemes and derive the optimal ones based on the actual demand.
4.2 Microgrid model
4.2.1 Objective
The goal of the economic optimization dispatching of microgrids is to minimize their total operating cost. Therefore, the objective function of microgrid dispatching in this paper mainly considers the fuel cost of each generator set, the operational and management cost of the unit and energy storage, and the cost of electricity exchange with the large power grid (Li et al., 2022b).
4.2.1.1 Fuel cost of generator set
where T is the current scheduling cycle of 24 h, and
4.2.1.2 Investment construction and operating and maintenance cost of unit and energy storage
where T is the current dispatching cycle; N denotes the type of the microgrid unit;
4.2.1.3 The cost of electricity exchange with the main grid
where
In conclusion, the functional model of the objective function is:
4.2.2 Constraints
4.2.2.1 Power balance constraint
where
4.2.2.2 Power connection line circuit constraints
where
4.2.2.3 Output constraint of each unit
where
4.2.2.4 Battery constraints
4.2.2.4.1 Capacity constraints
where
4.2.2.4.2 State of charge constraint
where
4.3 Virtual power plant model
4.3.1 Objective
When constructing the VPP model, the objective is established with the maximization of the overall revenue of VPP as the goal, and the investment and operation and maintenance costs of each generating unit and energy storage are considered, as well as the cost of purchasing electricity in VPP.
where
The revenue of the VPP can be expressed as:
where
The fuel cost of VPP conventional units and the investment operating and maintenance costs of photovoltaic, wind power, and energy storage systems are the same as the model established by the microgrid in Equations 29, 30.
4.3.2 Constraints
1) Power balance constraint
where
2) Trading constraints in the electricity market
where
3) System reserved standby capacity constraint
Conventional generator sets usually reserve a certain adjustment margin to adjust the source load’s volatility and cope with fluctuations caused by the output of renewable energy generation units and the production and operating load of large users.
where
4) The upper and lower limits of output constraints and battery constraints of each unit are consistent with the constraints of the microgrid model in Equations 37–40.
4.4 Integrated model of source–grid–load–storage
4.4.1 Objective
The integrated, coordinated operation of SGLS takes the minimization of the comprehensive cost of the distribution network operation as the objective function, in which the comprehensive operation cost mainly takes into account the investment, operation, and maintenance costs of each unit, fuel cost, and the power purchase cost of the grid. The mathematical model for the coordinated optimization of the integrated operation of SGLS is:
where
1) The fuel cost of VPP conventional units and the investment and operation and maintenance cost of photovoltaic, wind power, and energy storage systems are the same as the model established by the microgrid in Equations 29, 30.
2) Power grid purchase cost
where
4.4.2 Constraints
1) The maximum and minimum output constraints and energy storage system (battery) constraints of each unit are consistent with the model established by the microgrid in Equations 36–40.
2) Distribution network constraints
2.1 Power balance of each node
For any one node
where
2.2 Branch power flow power limit constraint
Each branch road meets the constraints of active and reactive power flow:
The upper limit constraint of branch power flow is:
where
2.3 Node voltage range limit constraint
Considering power quality problems and line insulation, the node voltage range needs to be limited.
where
4.5 Case study
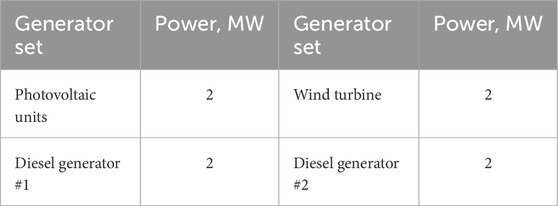
The microgrid model is established in Equations 29–40, the virtual power plant model is established in Equations 41–46, and the source-grid-load-storage model system is established in Equations 47–54. The basic calculation system adopted in this chapter is an IEEE-33 node distribution network system. The network connection diagram of the distribution network is shown in Figure 5. The flexible resources include two conventional diesel generator sets, one photovoltaic unit, one wind turbine, and one energy storage system (battery).
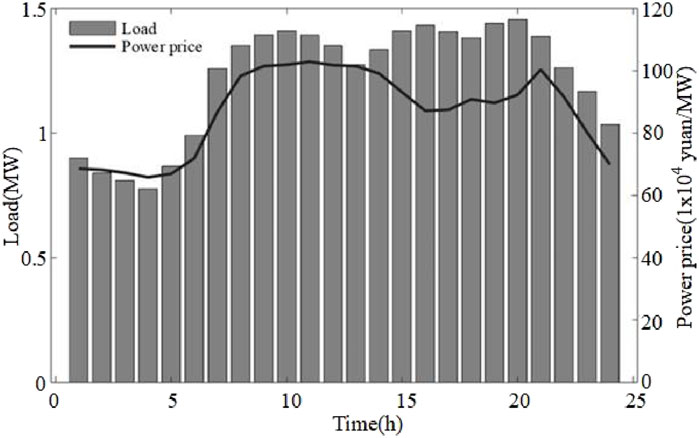
The system load situation and the power trading price are shown in Figure 6.
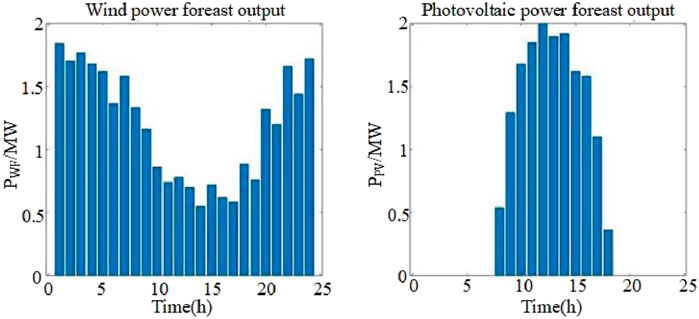
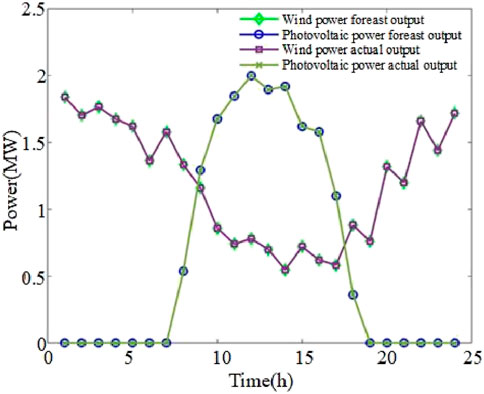
The wind power and photovoltaic forecast output situation is shown in Figure 7.
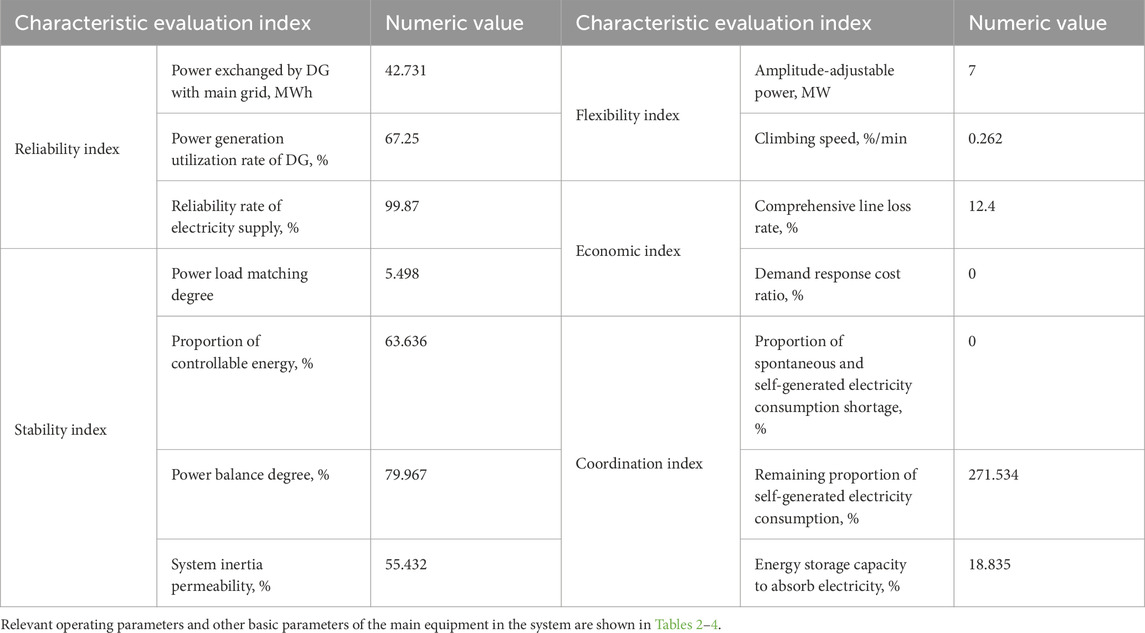
The calculation and collection of the parameters of the characteristic evaluation indexes in Equations 1–14 of the case system are shown in Table 1.
Some basic properties of the system under study can be analyzed through the basic parameters of the distribution network system and the corresponding characteristic evaluation index parameters. Firstly, the distributed resources considered in the system give priority to electric power and energy storage, mainly in the form of sizeable centralized access to the distribution network node. Based on the evaluation index parameters in Table 1, reliability, stability, flexibility, and coordination indicators are at a reasonable level, showing that in the distribution network itself, generator capacity can fully meet the demand of the system load and surplus. The coordination and reliability indexes are notably superior, indicating that under normal conditions, the system can operate stably and reliably with ample regulation capability. However, the economic indicators are poor, with the comprehensive line loss rate on the high side. In the following flexible resource optimization scheduling and comparative analysis, we will comprehensively consider the basic properties of the distribution network system and the characteristics of different operation modes in balancing zones and analyze the differences between different operation modes to reach our conclusions.
4.5.1 Microgrid
The costs and benefits of the microgrid model are shown in Table 5.
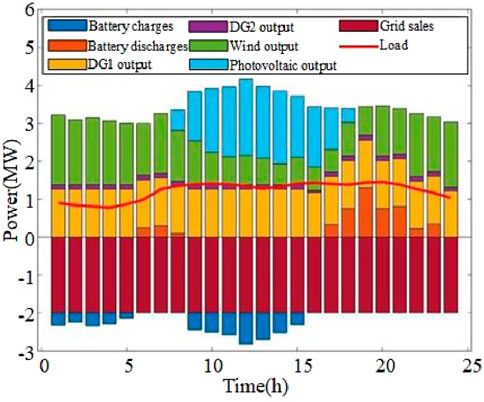
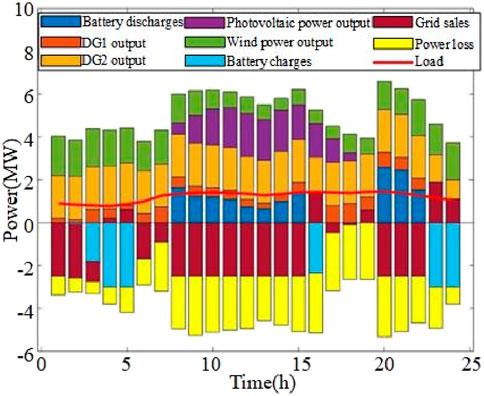
From Figures 8, 9, the system power load is far lower than the sum of the fan and photovoltaic output, and the new energy output cost is significantly lower than the diesel unit and battery output. The flexibility of the system resources in the form of micro power grid, wind, and photovoltaics will receive priority to use the whole simulation time. The fan and photovoltaics adopt “maximum power point tracking” mode, keeping the maximum output. 01:00–05:00, and the fan and the diesel engine remain for battery charging. During the 05:00–16:00 period, the power load increases, while the photovoltaic unit becomes the output unit, giving more power surplus to sell, and the remainder continues to charge the battery. From 16:00–24:00, the photovoltaic unit output is gradually reduced to 0, and the battery discharges to keep the output stable and to continue selling electricity to the grid. During the whole day, the output of the diesel unit is stable, and photovoltaic and wind power are surplus under the condition of meeting the system load. The microgrid will transfer the surplus power to the large power grid to earn income or use it for battery charging and storage.
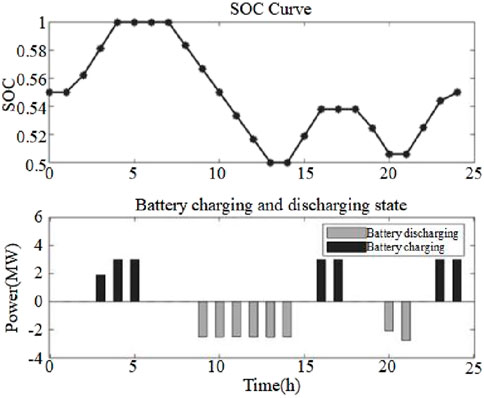
As shown in Figure 10, after optimized scheduling, the SOC change of the energy storage system in the microgrid mode remains within the reasonable operation range at 01:00–05:00; during 06:00–08:00, the load increases, the transaction price increases, the energy storage discharges, and the economy of the microgrid is improved by buying at a low price and selling at a high price. During 09:00–15:00, the output of the photovoltaic unit increases by 1.00, and the energy storage and storage power; for 17:00–24:00, photovoltaic output drops, and the energy storage system output maintains the output balance of the whole system and effectively plays a role in balancing supply and demand in optimal scheduling.
4.5.2 Virtual power plant
The costs and benefits of the VPP model are shown in Table 6.
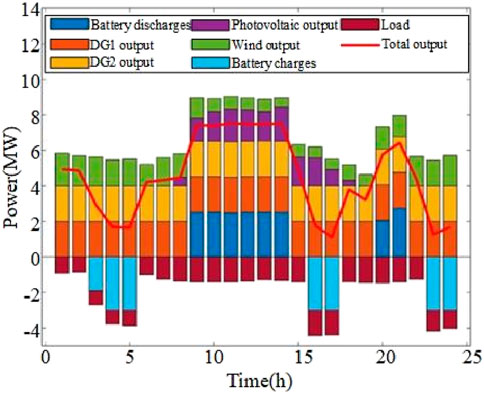
From Figures 11, 12, when the flexible resources in the above system operate as VPP, the impact of the electricity market’s transaction price on the system’s total output is undeniable. According to observation and comparison, during 01:00–05:00, electricity prices are in a trough, the total VPP output is also at a low level, and systems tend to store more power as energy storage. For 05:00–13:00 , trading prices in the electricity market rise and reach higher levels, and total VPP output also rises to a high level. During 13:00–19:00, the electricity trading price decreases, so total output drops. In the 19:00–21:00 period, electricity trading prices rise for a short time, and total VPP output also reflects the upward trend. During 21:00–24:00, electricity trading prices fall, and so total output decreases. Overall, the diesel generator set is basically in the state of full load or high output. Due to the influence of the reserve capacity constraint of the VPP system, wind and photovoltaic power are abandoned in some periods.
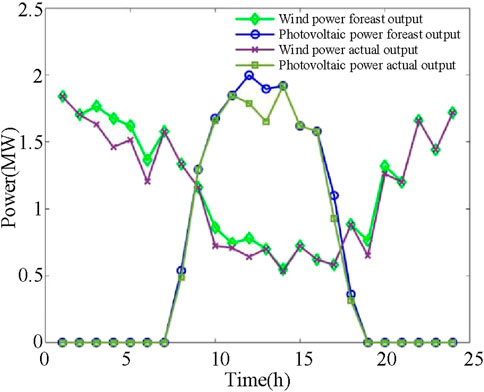
Figure 12. Comparison of wind power and photovoltaic forecast and actual output in the virtual power plant mode.
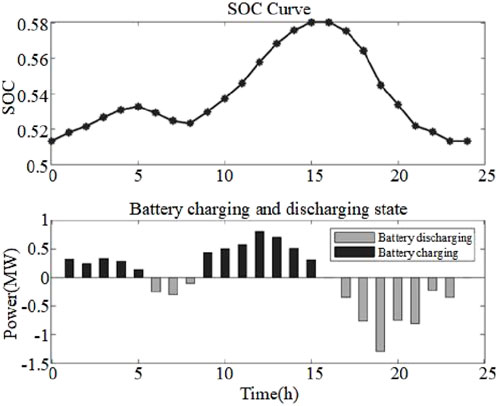
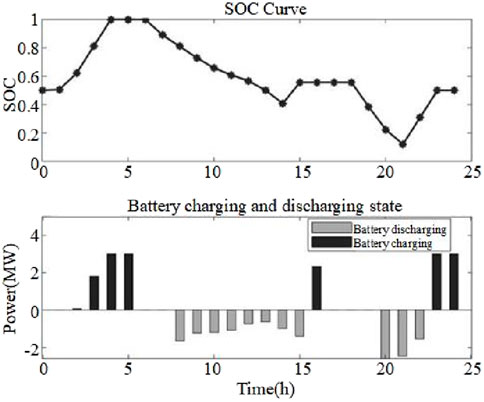
As seen in Figure 13, the energy storage system in VPP mode is mainly accompanied by changing electricity trading prices in the power market and charging and discharging according to the system’s total output demand. During the 01:00–05:00 period, the electricity price is low, the total output demand is small, and most of the excess power is transported to the energy storage system for storage. For 09:00–13:00, electricity demand is significant, the trading price is at a peak, and the total output demand is large, so the energy storage system discharges. During 19:00–21:00, the electricity price briefly rises, the total output demand is large, and the energy storage system discharges. It can be seen from the analysis that under the operating mode of the VPP, after optimized scheduling, the energy storage system meets the changing demand of the total output with the change of the transaction price through charge and discharge to obtain better results from the power market.
4.5.3 Source–grid–load–storage
The costs and benefits of the integrated SGLS model are shown in Table 7.
As shown in Figures 14, 15, when the flexible resources in the above system are operated in the form of source network, load, and storage, the total system output changes with the change in load demand. During 01:00–05:00, when load demand is low, the system output is low, and the line loss is slight. After meeting the load requirements, the excess power is mainly used for energy storage, charging, and transmission to the power grid. During 05:00–20:00, the system output is high, while the line loss increases. Excluding the load demand and line loss, the surplus power is transmitted to the power grid. Over 20:00–24:00, the load decreases, so the total output of the system decreases. Overall, due to the need to consider the loss of the distribution network and meet the system load, the total output demand of the system is extensive. The solar generator set operates at maximum power daily, and the diesel generator operates with stable output.
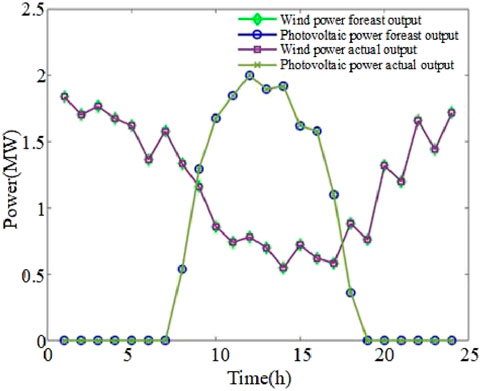
Figure 15. Comparison of wind power and photovoltaic forecast and actual output in the source–grid–load–storage mode.
According to Figure 16, when the energy storage system operates from 01:00 to 05:00, the system load is low, so the energy storage system is charged. When the energy system stores the excess power from 05:00–22:00, the line loss of the distribution network is high. Therefore, the discharge of the energy storage system guarantees the load supply and supports the power for the stable operation of the SGLS system.
From Figure 17, under the dispatching situation of the three operation modes, the node voltage of the distribution network is within a reasonable range, and there is no frequent node voltage transgression. Through observation and comparison, it is found that the nodes with a higher voltage in the distribution network are often the access points of the distributed power supply. In contrast, the lower voltage points generally appear in the network’s distal nodes of the feeder. The network topology constrains the voltage size of the distribution network node and is related to different dispatching modes and the load power of each node.

Figure 17. Voltage distribution of distribution network in different modes. (A) In microgrid mode. (B) In vitrual power plant mode. (C) In source-grid-load-storage mode.
In the case discussed here, the load demand is much smaller than the expected output of the output units, which is not in line with the requirement of maintaining power balance in the microgrid-type balancing zone. The power balancing constraints of the microgrid model greatly limit the output and play of the flexible resources other than the new energy units.
The SGLS integrated operation model can ensure the safe and stable operation of the distribution network, and it can effectively avoid frequent voltage overruns and blocking problems in the distribution network. The operating mode of SGLS integration can largely ensure the safe and stable operation of the distribution network, which can effectively avoid the frequent occurrence of voltage overrun problems in the distribution network, but it can also produce line loss and affect the total output of the system, resulting in poor economic benefits.
VPP puts profits first, and the situation in which the load in the example is much smaller than the output is in line with the demand for profit from VPP. There are certain shortcomings and risks in the operation’s new energy consumption and reliability. However, on the one hand, the “discarded” wind power only accounts for a small part of that power, and reducing a certain amount of new energy access can decrease the uncertainty of the system power, thus improving the stability of the system. On the other hand, through the voltage distribution under different scheduling conditions, it can be seen that for the impact of VPP in some periods of the excessive power, the distribution network can withstand the corresponding impact with the virtue of a better topology.
5 Conclusion
Against a background of rapid construction of new power systems and facing the vast stock and increasing number of distributed flexibility resources in the distribution network, balancing zones, as a new type of main body to participate in system regulation, can effectively release the regulating capacity of flexibility resources. Regarding the selection of operational models and scheduling optimization for the aggregation of flexible resources, we offer the following conclusions and suggestions:
(1) Choosing appropriate operational modes for various scenarios is crucial for reducing costs, enhancing efficiency, and ensuring the safe operation of distribution grid systems. Microgrids are well-suited for small, localized environments with specific independent operational requirements, such as islands, urban districts, and rural areas.
(2) In situations where line impedance is low and the distribution grid system topology remains stable, especially when power-type resources constitute a significant proportion, it is advisable to consider adopting the virtual power plant (VPP) operational mode. This approach can yield greater profits while maintaining safety standards.
(3) Conversely, in cases where line impedance is high and there is a substantial reliance on renewable energy sources, with stringent demands for reliability and stability, the source–grid–load–storage (SGLS) integrated operational mode should be considered. This strategy ensures the distribution grid system’s safe and stable functioning.
Based on the flexible application of characteristic evaluation indices, this paper presents a systematic approach for mode selection and optimal scheduling in the aggregate operation of flexible resources. This methodology offers a novel perspective for coordinating and aggregating the management of extensive flexible resources within distribution networks. Building on the aggregation and optimized scheduling of flexible resources within distribution networks, further in-depth studies could be explored. While employing advanced intelligent optimization algorithms may help address multi-objective scheduling optimization issues, utilizing big data and machine learning techniques to analyze historical records along with real-time monitoring data could uncover underlying patterns and characteristics of grid operations, thereby refining distribution network scheduling strategies.
Data availability statement
The original contributions presented in the study are included in the article/supplementary material; further inquiries can be directed to the corresponding authors.
Author contributions
KH: Data curation, Methodology, Writing–original draft. ZY: Funding acquisition, Supervision, Writing–review and editing, Writing–original draft. YX: Funding acquisition, Resources, Writing–review and editing. ZZ: Formal Analysis, Software, Writing–review and editing. LH: Conceptualization, Formal Analysis, Funding acquisition, Resources, Writing–review and editing.
Funding
The authors declare that financial support was received for the research, authorship, and/or publication of this article. The work in the paper was sponsored by the Science and Technology Project of the State Grid Corporation of China: Research on the planning and design technology of distribution network balance area for flexible resource aggregation control operation (No. 5100-202356412A-3-2-ZN).
Conflict of interest
ZZ was employed by the Economic and Technological Research Institute of State Grid Fujian Electric Power Co., Ltd. LH was employed by the State Grid Economic and Technological Research Institute Co., Ltd.
The remaining authors declare that the research was conducted in the absence of any commercial or financial relationships that could be construed as a potential conflict of interest.
The authors declare that this study received funding from State Grid Corporation of China. The funder had the following involvement in the study: Formal Analysis, Software, Writing–review and editing.
Generative AI statement
The authors declare that no Generative AI was used in the creation of this manuscript.
Publisher’s note
All claims expressed in this article are solely those of the authors and do not necessarily represent those of their affiliated organizations, or those of the publisher, the editors and the reviewers. Any product that may be evaluated in this article, or claim that may be made by its manufacturer, is not guaranteed or endorsed by the publisher.
References
Abdelghany, M. B., Al-Durra, A., and Gao, F. (2023). A coordinated optimal operation of a grid-connected wind-solar microgrid incorporating hybrid energy storage management systems. IEEE Trans. Sustain. Energy 15 (1), 39–51. doi:10.1109/TSTE.2023.3263540
Bagchi, A., Goel, L., and Wang, P. (2018). Adequacy assessment of generating systems incorporating storage integrated virtual power plants. IEEE Trans. Smart Grid 10 (3), 3440–3451. doi:10.1109/TSG.2018.2827107
Cui, Z., Chang, X., Xue, Y., Yi, Z., Li, Z., and Sun, H. (2024). Distributed peer-to-peer electricity-heat-carbon trading for multi-energy virtual power plants considering copula-CVaR theory and trading preference. Int. J. Electr. Power and Energy Syst. 162, 110231. doi:10.1016/J.IJEPES.2024.110231
Dou, X., Song, L., Zhang, S., Ding, L., Shao, P., and Cao, X. (2022). Multi-time scale trading simulation of source grid load storage based on continuous trading mechanism for China. Sensors 22 (6), 2363. doi:10.3390/s22062363
Fu, Y., Fan, H., Ge, L., Liu, Y., Dong, D., Yu, H., et al. (2024). Improving PSO in the application of coordinated and optimal scheduling of source network load and storage. J. Comput. Methods Sci. Eng. 24 (4-5), 2253–2266. doi:10.3233/JCM-247286
Hu, Q., Han, R., Quan, X., Wu, Z., Tang, C., Li, W., et al. (2022). Grid-forming inverter enabled virtual power plants with inertia support capability. IEEE Trans. Smart Grid 13 (5), 4134–4143. doi:10.1109/TSG.2022.3141414
Li, J., Guo, Z., and Ma, S. (2022). Overview of the “source-grid-load-storage” architecture and evaluation system under the new power system. High. Volt. Eng. 48 (11), 4330–4342. doi:10.13336/j.1003-6520.hve.20220532
Li, Y., Yao, F., Zhang, S., Liu, Y., and Miao, S. (2022). An optimal dispatch model of adiabatic compressed air energy storage system considering its temperature dynamic behavior for combined cooling, heating and power microgrid dispatch. J. Energy Storage 51, 104366. doi:10.1016/J.EST.2022.104366
Liu, Y., Wang, Y., Li, T., Ma, R., Xu, K., and Xu, W. (2022). Evaluation of new power system based on entropy weight-TOPSIS method. Math. Problems Eng. 2022 (1), 1–10. doi:10.1155/2022/7669139
Ma, T., Li, M. J., Fan, C. H., and Dong, H. S. (2024). A novel real-time dynamic performance evaluation and capacity configuration optimization method of generation-storage-load for integrated energy system. Appl. Energy 374, 123896. doi:10.1016/J.APENERGY.2024.123896
Ma, X., Wu, Y., Fang, H., and Sun, Y. (2011). Optimal sizing of hybrid solar-wind distributed generation in an islanded microgrid using improved bacterial foraging algorithm. Proc. CSEE (25), 17–25. doi:10.13334/j.0258-8013.pcsee.2011.25.003
Mashhour, E., and Moghaddas-Tafreshi, S. M. (2009). “A review on operation of micro grids and virtual power plants in the power markets”, in 2009 2nd international conference on adaptive science and technology (ICAST) (IEEE), 273–277. doi:10.1109/ICASTECH.2009.5409714
Olivares, D. E., Mehrizi-Sani, A., Etemadi, A. H., Cañizares, C. A., Iravani, R., Kazerani, M., et al. (2014). Trends in microgrid control. IEEE Trans. smart grid 5 (4), 1905–1919. doi:10.1109/TSG.2013.2295514
Peng, D., Shui, J., Wang, D., and Zhao, H. (2023). Review of virtual power plant under the background of “dual carbon”. Power Gener. Technol. 44 (5), 602. doi:10.12096/j.2096-4528.pgt.23023
Torbaghan, S., Blaauwbroek, N., Kuiken, D., Gibescu, M., Hurink, J., Nguyen, P., et al. (2018). A market-based framework for demand side flexibility scheduling and dispatching. Sustain. Energy Grids Netw. 14, 47–61. doi:10.1016/j.segan.2018.03.003
Wu, D., Chang, X., Xue, Y., Huang, Y., Su, J., and Sun, H. (2024). Bilevel low-carbon coordinated operation of integrated energy systems considering dynamic tiered carbon pricing methodology. Energy 133251, 133251. doi:10.1016/j.energy.2024.133251
Wu, M., Zhao, T., Zhao, F., Zhang, Y., Kou, L., and Zhou, X. (2018). Evaluation index system of microgrid operation effect and corresponding evaluation method. Power Syst. Technol. 42 (3), 690–697. doi:10.13335/j.1000-3673.pst.2017.2367
Xin, H., Gan, D., Li, N., Li, H., and Dai, C. (2013). Virtual power plant-based distributed control strategy for multiple distributed generators. IET Control Theory Appl. 7 (1), 90–98. doi:10.1049/iet-cta.2012.0141
Yang, L., Li, H., Zhang, H., Wu, Q., and Cao, X. (2024). Stochastic-distributionally robust frequency-constrained optimal planning for an isolated microgrid. IEEE Trans. Sustain. Energy 15, 2155–2169. doi:10.1109/TSTE.2024.3404434
Yang, Q., Liu, J., and Jiang, W. (2021). Peak regulation strategy of power system considering the interaction of source-network-load-storage under different penetration rate of PV. Electr. Power Constr. 42 (9), 74–84. doi:10.12204/j.issn.1000-7229.2021.09.008
Yi, Z., Xu, Y., Gu, W., and Wu, W. (2019). A multi-time-scale economic scheduling strategy for virtual power plant based on deferrable loads aggregation and disaggregation. IEEE Trans. Sustain. Energy 11 (3), 1332–1346. doi:10.1109/TSTE.2019.2924936
Zhang, K., and Tang, Z. (2024). An improved multi-objective brain storm optimization algorithm for hybrid microgrid dispatch. Int. J. Swarm Intell. Res. (IJSIR) 15 (1), 1–21. doi:10.4018/IJSIR.336530
Zhao, Z., Guo, J., Luo, X., Lai, C. S., Yang, P., Lai, L. L., et al. (2022). Distributed robust model predictive control-based energy management strategy for islanded multi-microgrids considering uncertainty. IEEE Trans. Smart Grid 13 (3), 2107–2120. doi:10.1109/TSG.2022.3147370
Zhongkai, Y. I., Yinliang, X. U., Huaizhi, W. A. N. G., and Sang, L. (2021). Coordinated operation strategy for a virtual power plant with multiple DER aggregators. IEEE Trans. Sustain. Energy 12 (4), 2445–2458. doi:10.1109/TSTE.2021.3100088
Keywords: balancing zone, characterization evaluation index, flexibility resources, optimal dispatch, energy storage
Citation: Huang K, Yi Z, Xu Y, Zhou Z and Han L (2024) Operation mode and scheduling plan optimization approach for multiple balancing zones in a distribution system. Front. Energy Res. 12:1506095. doi: 10.3389/fenrg.2024.1506095
Received: 04 October 2024; Accepted: 05 November 2024;
Published: 03 December 2024.
Edited by:
Lun Yang, Xi’an Jiaotong University, ChinaReviewed by:
Wei Lin, The Chinese University of Hong Kong, ChinaZhaoyuan Wu, North China Electric Power University, China
Lirong Deng, Shanghai University of Electric Power, China
Penghan Li, State Grid Corporation of China (SGCC), China
Copyright © 2024 Huang, Yi, Xu, Zhou and Han. This is an open-access article distributed under the terms of the Creative Commons Attribution License (CC BY). The use, distribution or reproduction in other forums is permitted, provided the original author(s) and the copyright owner(s) are credited and that the original publication in this journal is cited, in accordance with accepted academic practice. No use, distribution or reproduction is permitted which does not comply with these terms.
*Correspondence: Zhongkai Yi, eXprQGhpdC5lZHUuY24=; Ying Xu, eWluZy54dUBoaXQuZWR1LmNu
 Kai Huang1
 Zhongkai Yi
 Ying Xu