- 1State Grid Economic and Technological Research Institute Co., Ltd., Beijing, China
- 2State Grid Corporation of China, Beijing, China
- 3School of Electrical Engineering, Xi’an Jiaotong University, Xi’an, Shaanxi, China
As the penetration level of renewable energy is continuously growing, it is essential for transmission and distribution system operators to collaborate on optimizing the siting and sizing of distributed energy storage to enhance the operational flexibility and economic efficiency. Given the frequent occurrence of extreme weather in recent years, the planning should also account for such factors. Hence, a planning method of distributed energy storage with the coordination of transmission and distribution systems considering extreme weather is proposed. Firstly, a Gaussian mixture model-based chance constraint is established to describe the uncertainty of wind and solar power, ensuring high confidence that the bus voltage of the distribution system is within a safe range. Secondly, aiming to maximize the social welfare, a bi-level planning model for distributed energy storage is developed. The upper-level addresses the siting and sizing issues of distributed energy storage, while the lower-level characterizes the day-ahead clearing problem of power market. By leveraging Karush-Kuhn-Tucker (KKT) conditions and linearization techniques, the bi-level model is transformed into a single-level mixed integer linear programming model that is easier to solve. Finally, numerical analysis is conducted on a modified IEEE 24-node system combined with two IEEE 33-node systems. The case study verifies the effectiveness of the proposed model.
1 Introduction
Global climate change and the rapid development of new energy technologies have introduced significant challenges to the safe and stable operation of power grids. Energy storage, as a flexible resource, plays a crucial role in ensuring the stability of power systems. In recent years, the trend toward clean power generation has gained prominence (Li, H. et al., 2021). With the increasing integration of distributed wind and photovoltaic power, the configuration of an appropriate amount of energy storage on the distribution network side has emerged as a critical issue. To enhance the operational flexibility and economic efficiency of the power system, while also leveraging the benefits of energy storage on the distribution network side, it is essential for the transmission system operator (TSO) and the distribution system operator (DSO) to collaborate closely in optimizing the siting and sizing of distributed energy storage.
The key to promoting renewable energy consumption through energy storage lies in optimizing the location and scale of energy storage systems. Work in (Tang et al., 2022) developed a location and capacity model for energy storage aimed at minimizing bus voltage fluctuations, energy storage investment costs and load fluctuation; Works (Fernández-Blanco et al., 2016; Pandžić et al., 2014) employed lossless DC power flow to approximate the transmission network while disregarding distribution network constraints. However, energy storage resources are typically situated within the distribution system and provide services to both transmission and distribution systems; Work in (Yao et al., 2022) introduced a joint planning method for transmission and storage that takes into account the complementarity of wind and solar energy, thereby enhancing the consumption levels of these renewable sources; Work in (Hua et al., 2020) proposed a control strategy for battery energy storage that considers the feasible domain of wind power acceptance to improve both the transmission and consumption; Work in (Zhao et al., 2022) established an optimization planning model for distributed energy storage in active distribution networks, utilizing an error scenario simulation method to mitigate the impact of photovoltaic output randomness on energy storage configuration planning. Notably, these studies have not established a unified framework for coordinating transmission and distribution to optimize energy storage investment planning.
Numerous studies have addressed the dual-sided uncertainties associated with renewable energy generation and load. Work in (Peker et al., 2018) introduced a two-stage stochastic programming model aimed at jointly optimizing transmission line and energy storage investment; Work in (Li et al., 2024) proposed a bi-level optimization model for the siting and sizing of distributed electrochemical energy storage, utilizing typical day scenarios while accounting for the uncertainties in to renewable energy output; Work in (Qian et al., 2020) considered the impact of wind power and photovoltaic output uncertainties on new energy bases' power transmission, modeling the operational characteristics of these bases, DC channels and receiving power grids separately, and suggested a stochastic planning method for DC transmission of new energy bases based on scenario analysis. Work in (Li et al., 2019) developed a multi-objective optimization cooperative planning model for renewable energy and energy storage, taking into consideration reliability and renewable energy penetration. Work in (Wang et al., 2024) introduced a novel interval power flow (NIPF) method based on a hybrid uncertain set, which effectively addresses input data uncertainties, including active power generation from renewable sources (such as wind and photovoltaic) and load demand. Some studies have insufficient descriptions of the predicted output of renewable energy, which makes it difficult to fully reflect the output range of renewable energy, or are often too conservative in order to cover the output range.
In the context of power grid planning influenced by extreme weather, work in (Li et al., 2023) proposed a multi-level planning method for energy storage power stations within distribution networks, which accounts for the spatiotemporal correlation of compound natural disasters; Work in (Ma et al., 2020) introduced a power grid resilience evaluation index and developed a bi-level planning model for the location and capacity of flexible resources during typhoon disasters, with the objective of optimizing both the index and economic outcomes.; Work in (Yuan et al., 2016) presented a novel flexible distribution system planning model based on two-stage robust optimization aimed at minimizing the total load reduction during natural disasters; Work in (Wang et al., 2023) proposed a new method for the location and capacity planning of energy storage systems based on extreme scenarios. Some studies focus solely on power grid planning under extreme scenarios, neglecting a comprehensive consideration of the impacts of both conventional and extreme scenarios.
Despite the extensive research on the planning and operation models of distributed energy storage in conjunction with renewable energy, several research gaps remain: 1) The investment planning of distributed energy storage is seldom addressed within a unified TSO-DSO framework. 2) The uncertainty associated with the forecast error of renewable energy generation on a typical day is often overlooked. 3) Many of these planning models fail to comprehensively consider the effects of conventional scenarios and extreme weather events. To address these deficiencies, this paper introduces a bi-level planning model for distributed energy storage that incorporates the influence of extreme weather on transmission and distribution coordination. The upper model aims to minimize the investment and operational costs for the DSO, while the lower model seeks to maximize social welfare, thereby modeling the electricity market clearing at the transmission network level. This model effectively leverages distributed energy resources and flexibility at both the distribution and transmission network levels.
The main contributions of this paper are as follows.
1) Unlike traditional methods for configuring energy storage in distribution networks, this study establishes a storage investment planning decision model for distributed renewable energy across multiple distribution networks, incorporating the collaborative participation of DSO and TSO in the market.
2) The planning model fully accounts for the uncertainty associated with renewable energy, modeling the forecast error of daily renewable energy generation using a Gaussian mixture model in conjunction with a chance constraint method.
3) In contrast to conventional planning methods that rely on typical days, this research considers the impact of extreme weather on planning; extreme weather scenarios are extracted based on a robustness framework that incorporates both maximum and minimum model parameters.
The organization of this paper is as follows: Section 2 introduces the bi-level programming model for distributed energy storage under the coordination of transmission and distribution. Section 3 presents a solution to the bi-level optimization problem. Case studies are discussed in Section 4, followed by conclusions in Section 5.
2 Model structure and problem formulation
2.1 Stochastic bi-level investment model
The proposed bi-level optimization model for distributed energy storage planning is illustrated in Figure 1. The upper level addresses the location and scale of energy storage within the distribution network, aiming to minimize the total investment and operational costs. The lower level focuses on the day-ahead power market clearing problem, which seeks to maximize social welfare, defined as the load benefit minus the generator costs, while adhering to the constraints of the transmission network. Furthermore, the upper-level problem establishes the operational framework for the distribution network and the power transactions with the upstream power grid, with the power transaction decisions serving as input parameters for the lower-level problem. The lower-level problem subsequently provides feedback on market clearing results, including dispatch and pricing, which are utilized in the upper-level problem to compute the expected market income for all users associated with the distribution network.
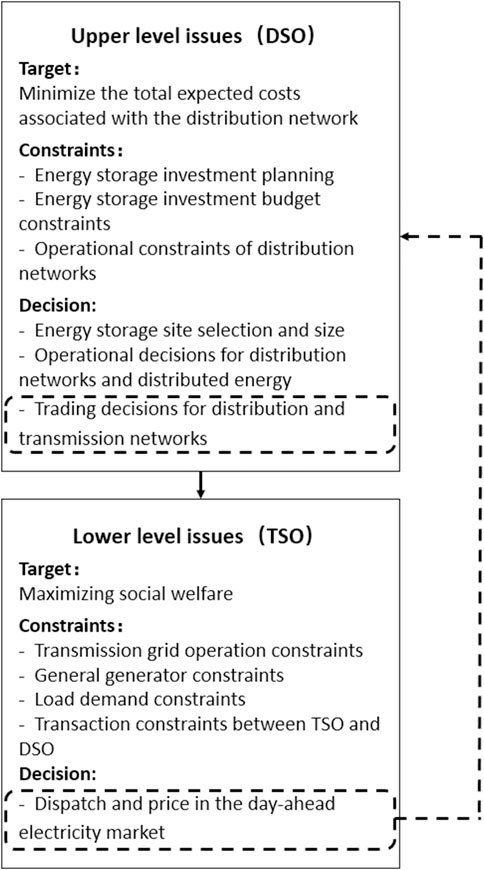
Figure 1. A bi-level planning model for distributed energy storage in transmission and distribution coordination.
To account for the effects of extreme weather, particularly the prevalence of typhoons, this study emphasizes scenario robustness. Historical data has been employed to categorize a year into four conventional scenarios and one extreme weather scenario, based on adjustments to the wind and solar output sequences during typhoon conditions. The corresponding outputs for wind and solar energy are specified, with their uncertainties characterized through prediction error and modeled using the chance constraint method. Investment planning is conducted for a single target year following the static investment analysis method (Liu et al., 2017), while operational decisions are optimized for each representative day.
2.2 Upper-level problem: Siting and sizing of distributed energy storage
The upper problem minimizes the total cost of the distribution network over the course of the year, which includes both the annual energy storage investment cost (
In this context, Equation 2 details the calculation of the distribution network in conjunction with the upstream grid, while Equations 3, 4 outline the operating costs of DERs and the annualized investment cost of energy storage, respectively.
Where:
Equation 2 represents the electricity transaction cost associated with the distribution network’s participation in the day-ahead electricity market. Equation 3 outlines the operating cost of DERs on a typical day
Where:
Investment decisions (
Where:
Equations 6, 7 delineate the energy and power limitations for the areas (nodes) within the distribution network eligible for energy storage installation, while Equation 8 restricts the energy-to-power ratio of the energy storage device. Equation 9 indicates that the total investment cost must not exceed the allocated investment budget.
In addition, due to the operational characteristics of energy storage, its dispatch operation is subject to specific constraints on a typical day
Where:
Equations 10–13 delineate the charge and discharge state of the energy storage device. The binary variable
The output from distributed power sources, such as photovoltaics and wind power, is significantly influenced by climatic conditions. This influence is particularly pronounced during extreme weather events, where the output from wind and solar sources can become markedly abnormal and irregular. Consequently, the output from these sources exhibits increased volatility and uncertainty. To capture these effects, this article presents predicted outputs for wind and solar power under both normal and extreme scenarios, derived from historical data. It is important to note that the likelihood of extreme scenarios occurring is considerably lower. The chance constraint method is employed to strike a balance between conservatism and optimism, with the uncertainty in wind and solar power output characterized by the variability of prediction errors. Therefore, the outputs from wind power and photovoltaics should satisfy the following sufficiency conditions:
Where:
Equation 17 indicates that the output of wind power (
The power flow of the distribution network adopts the linearized Distflow model, which is widely used in distribution systems. The complete model is shown in Equations 23–29.
Where:
The branch power flow equations are presented in (23)–(25). The voltage difference between the buses at both ends of the node branch is related to the active and reactive power flows of the branch, as shown in Equation 25. The active power balance in the transmission line connected to the root node of the distribution network (i.e., the node linked to the transmission network) is
Equations 30, 31 impose limits on the amount of electricity that the distribution network can trade with the upstream grid, in accordance with the capacity of the substations that connect the transmission grid and the distribution grid. The binary variable
Where:
Finally, the decision variable set (
2.3 Lower-level problem: Day-ahead electricity market clearing problem
The underlying problem is the day-ahead electricity market clearing problem at the transmission network level, which is performed on each typical day with the goal of maximizing social welfare, as shown in Equations 33–41.
Where:
TSO clears the day-ahead electricity market for each typical day by minimizing social costs, as shown in Equation 33. The power flow of the transmission network adopts the DC power flow model. Equation 34 represents the power balance of the distribution network node. Equation 35 imposes a limit on the maximum output active power of conventional generators, while Equation 38 restricts the maximum active power required by the load aggregator. Equations 36, 37 detail the ramping capabilities of conventional generators. The power trading volume between the transmission and distribution networks is constrained to a specific range, as indicated in Equations 39, 40. Equation 41 establishes a limit on the active power flow within the transmission line. Additionally, the dual variables associated with each constraint are presented after the semicolon, with the voltage phase angle of the reference bus set to zero.
In summary, the upper model transfers the power trading decision between the transmission and distribution networks to the lower model, which in turn provides feedback on the node prices for each time period of the day. Based on these node prices at the boundary of the transmission and distribution networks, energy storage systems optimize their charging and discharging strategies by purchasing electricity (charging) during low-price periods and selling electricity (discharging) during high-price periods. This approach enhances economic benefits and regulates the system, ultimately leading to a reduction in the operational costs of the distribution network.
2.4 Typical day scene generation of wind and solar output
2.4.1 Conventional typical day scene generation
The selection of scenarios in this paper is based on actual annual intra-day output data for wind and solar power, resulting in a total of 365 scenarios. The large number of scenarios can significantly increase computational load, leading to lower solution efficiency and reduced flexibility. Therefore, it is essential to reduce the original scenarios to obtain typical output scenario data for wind and solar, ensuring both the diversity of scenarios and the efficiency of model solving. This study employs the K-means clustering algorithm to achieve this reduction and obtain typical output scenarios for wind and solar.
The scenario reduction process based on the K-means clustering algorithm is as follows.
1) Select K initial cluster centers from all samples;
2) Assign data points: Calculate the distances from the remaining data points to each cluster center and assign each data point to the cluster center with the closest distance;
3) Update the cluster center: Recalculate the cluster center point based on the assigned data points, establishing it as the new center of the cluster;
4) Iteration: Repeat the above steps until the cluster center no longer changes.
2.4.2 Generation of typical daily scenarios for extreme weather considering robustness
Conventional scenarios may not adequately capture the impact of extreme weather on wind and solar output. Given the significant influence of typhoons on renewable energy generation and to reduce model complexity, it is necessary to establish a separate typical day scenario for typhoon extreme weather. Additionally, a single wind field model (Batts model) is used, without considering the coupling effects of typhoons with associated disasters, such as the coupling of typhoons with rainstorm events (Zhang et al., 2024).
Batts model is a relatively mature wind field model. This paper uses the Batts model to estimate the real-time maximum wind speed in the typhoon-affected area. The parameters of the initial pressure difference, typhoon moving speed and typhoon moving direction probability distribution in the model are estimated empirically in the literature (Liu et al., 2020). The typhoon center pressure difference and typhoon moving speed should obey the log-normal probability distribution, and the typhoon moving direction should obey the binormal distribution, as shown in Equations 42–44.
Where:
The wind and solar output rules under typhoon weather are set as follows: when a typhoon occurs, the photovoltaic output level at each moment is randomly reduced to half or less than that in normal weather. The specific proportional coefficient (
The calculation formula for the real-time maximum wind speed is shown in Equation 48. The derivation process can be found in (Liu et al., 2020) and will not be repeated here. After sampling the initial pressure difference
The wind and solar power output sequence correction method under typhoon weather described in Equations 45–47, the actual annual wind and solar power output data is corrected, and 365 possible wind and solar power output sequence data under typhoon weather can be obtained. In order to reflect the robustness of extreme scenarios, this paper takes the amount of electricity purchased by the distribution network to the transmission network as an indicator to find the worst scenario as a typical daily scenario of typhoon extreme weather.
The extreme scenario set is formed by a series of wind and solar output scenarios corrected by the wind and solar output sequence under typhoon weather, which is recorded as
Where:
The auxiliary problem is framed as a bi-level optimization problem in the form of max-min. The constraints governing this problem are the real-time operational constraints of the distribution network, specifically outlined in Equations 17–32, with Equation 23 requiring substitution with the following
In addition, it should be noted that the auxiliary problem constraints are a set of extreme scenarios
To summarize, the steps to ascertain the worst-case scenario for wind and solar power output during typhoon weather are as follows.
1) The actual annual data is processed using the wind and solar power output sequence correction method tailored for typhoon weather, resulting in an initial set of extreme scenarios for wind and solar power output.
2) By substituting this set of extreme scenarios into the auxiliary problem, we can derive the auxiliary variable corresponding to these extreme scenarios and subsequently identify the worst scenario associated with the auxiliary variable.
2.5 Overall model structure
In summary, the proposed complete model is as follows:
Where:
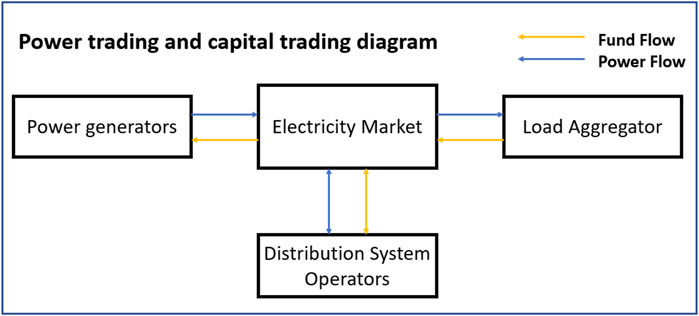
The upper optimization goal is to minimize the total investment and operation cost of the distribution network, and the participating entity is the distribution network; the lower optimization goal is to maximize social welfare, and the participating entities are power generators, load aggregators and distribution networks. The power transactions and capital transactions between the upper and lower participating entities are shown in Figure 2:
Obviously, the proposed model represents a bi-level optimization problem that cannot be solved directly. Additionally, the chance constraint poses significant challenges. Consequently, the subsequent section will demonstrate how to convert the chance constraint and the objective function into a tractable mixed-integer linear programming (MILP) formulation. This transformation will allow the bi-level optimization problem to be reformulated as a single-level optimization problem, effectively handling its nonlinear terms and yielding a directly solvable MILP problem.
3 Solutions
The original problem cannot be addressed directly. This section will outline the methodology for transforming the bi-level optimization problem into a MILP problem. First, a Gaussian mixture model will be employed to express the opportunity constraints associated with renewable energy as deterministic constraints. Second, voltage will be articulated as a function of random power injection, with the inherent uncertainty in voltage being characterized by the output of renewable energy. This approach will convert the voltage-related opportunity constraints into deterministic constraints. Finally, the KKT optimality condition will be utilized to reformulate the bi-level optimization problem into a single-level problem. Subsequently, the complementary relaxation conditions and the remaining bilinear terms will be linearized into linear terms using the Big M method and duality relations, ultimately resulting in the transformation of the model into a single-layer MILP framework.
3.1 Chance-constrained deterministic representation
3.1.1 Opportunity-constrained conversion of renewable energy output based on GMM
3.1.1.1 Forecasted output distribution of renewable energy
As mentioned above, the uncertainty of wind and solar power output can be characterized by the uncertainty of prediction error. Affected by the central limit theorem, the prediction error is described by Gauss Mixed Model (GMM). The random vector
Where:
By adjusting the parameter set
3.1.1.2 Opportunity-constrained conversion of wind and solar output
Assume that the random variable
The cumulative distribution function (CDF) of the Gaussian distribution can be calculated as follows:
Therefore, the opportunity constraints related to renewable energy output are transformed into deterministic constraints through the Gaussian mixture model.
3.1.2 Opportunity-constrained conversion of voltage
3.1.2.1 Node injection power represents node voltage
Equation 29 implicitly relies on uncertainty. In order to interpret (29) in a straightforward way, the voltage should be reformulated as an expression related to the random injected power. Existing studies have shown that in the LinDistFlow model, the node voltage of the radial distribution system is linearly related to the injected power of all nodes.
The amount of active/reactive power (
The injected power of the distribution network also considers the root node (
Where:
Therefore, the voltage safety constraint directly related to uncertainty is expressed as shown in Equation 66.
3.1.2.2 Voltage opportunity constrained conversion
As shown in Equation 66, voltage can be expressed by node injection power. Equations 58, 59 show that the opportunity constraints related to renewable energy output can be transformed into deterministic constraints, and the uncertainty implicit in node injection power comes from the output of renewable energy. Therefore, in order to ensure that the probability of the voltage amplitude within the safety interval is greater than the given confidence level (
Therefore, the chance constraint Equation 29 is transformed into a deterministic constraint.
3.2 KKT optimality condition
KKT conditions are widely used to solve nonlinear models. The lower-level market clearing problem is a linear programming problem, in which the stationary condition is obtained by taking the first order derivative of the lower-level decision variables based on the Lagrangian function of the lower-level problem. For example, (
The same is true for the remaining variables, with Equation 68 representing all stationary conditions. Similarly, the feasibility condition and complementary slack condition are obtained by taking constraint Equation 38 as an example:
The symbol
The nonlinearity caused by the complementary relaxation condition is linearized using the large M method (Wang et al., 2011). Taking Equations 69a, 69b as an example, they can be restated as the following constraints:
Where:
For simplicity, Equation 70 is used to refer to the constraints after all feasibility conditions and complementary slack conditions are processed by the big M method.
In order to deal with the nonlinearity in the objective function related to the expression of (2), the linear programming duality theorem can be used to obtain the following expression, as shown in (71):
The final model is as follows:
4 Case study
4.1 Example setup
The modified IEEE 24 node transmission network was combined with two IEEE 33 node distribution networks for testing. The root nodes of the two distribution networks were connected to nodes 4 and 9 of the transmission network respectively. The distribution system is shown in Figure 3. The energy storage investment occurs in the two distribution networks, and renewable energy is also distributed on the distribution networks.
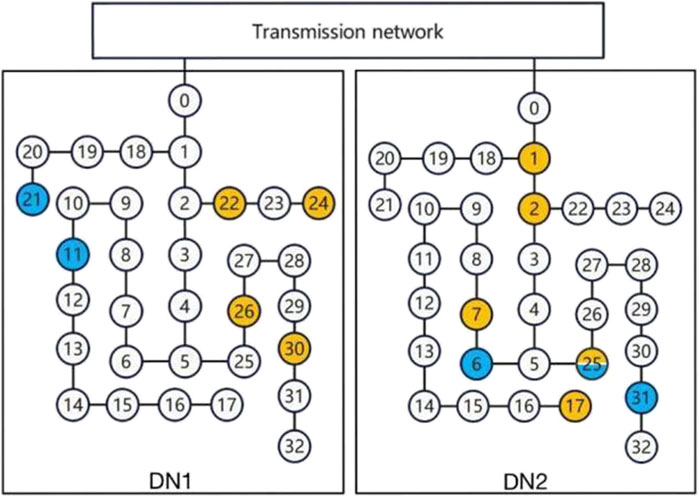
Figure 3. Schematic diagram of the dual IEEE 33-node power distribution test system (yellow indicates photovoltaic resources and blue indicates wind power resources).
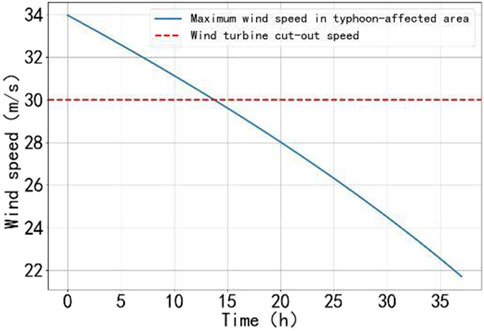
Table 1 lists the distribution network nodes suitable for energy storage investment. The distribution profile of renewable energy is shown in Table 2. The load and renewable energy generation profile is based on the actual annual data of a certain place. Wind power and photovoltaic are located in two different locations of the place. Based on the K-means clustering algorithm, the annual wind and solar power output data are processed to obtain 4 typical days of conventional scenarios. Figure 4 describes the weighted average of the conventional scenario of load, wind power and photovoltaic output. Let the maximum wind speed of the wind turbine be 30 m/s. Based on the typhoon model, the maximum wind speed change in the typhoon-affected area is obtained, as shown in Figure 5. It can be seen that the wind turbine was in a shutdown state in the first 14 h. Then, based on the wind and solar power output sequence correction method under typhoon weather, the worst scenario under typhoon weather is obtained with the maximum power purchase of the distribution network as the indicator, as shown by the solid line in Figure 7.
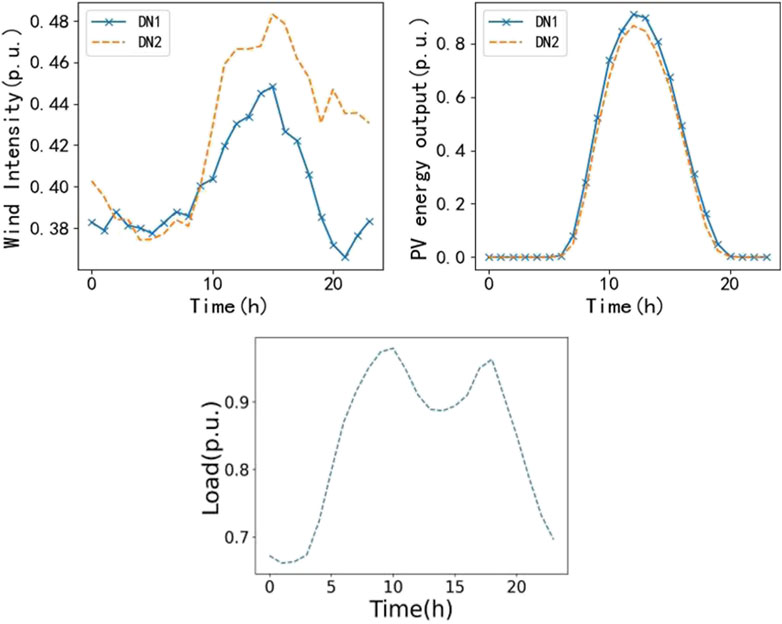
Figure 4. Weighted average of load, predicted wind power and PV intensity under conventional scenarios.
The prediction output error is simulated based on the Gaussian mixture model, and 1,000 samples are analyzed for each prediction value. The predicted wind power and photovoltaic output power and their confidence intervals under a conventional scenario and an extreme scenario are shown in Figures 6, 7, respectively. In the case studied, the confidence level
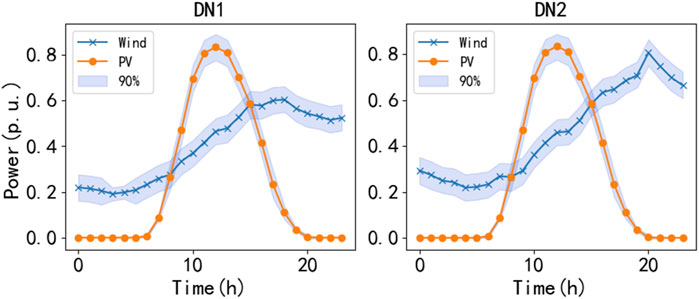
Figure 6. Predicted wind and solar power output power and its confidence interval under nor-mal circumstances.
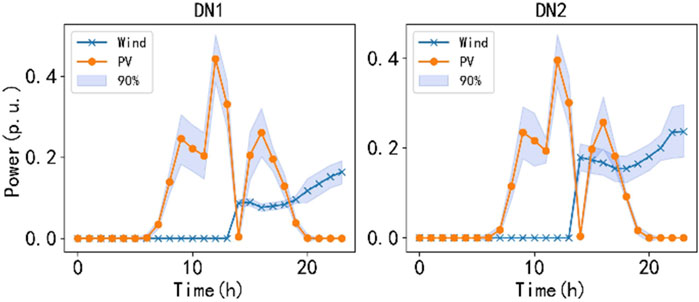
Figure 7. Predicted wind and solar output power along with their confidence intervals under extreme weather conditions.
Assume that the investment cost of energy storage is
4.2 Siting and sizing decisions
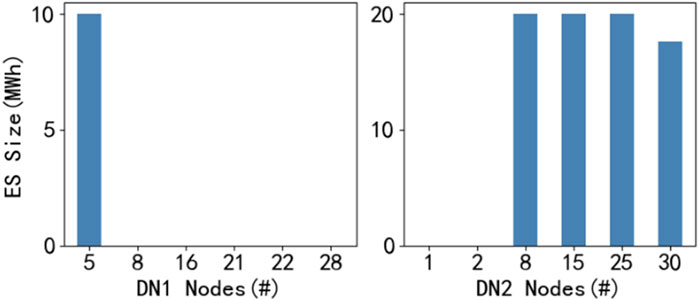
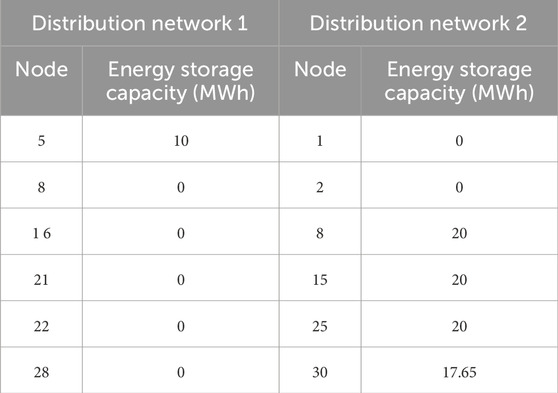
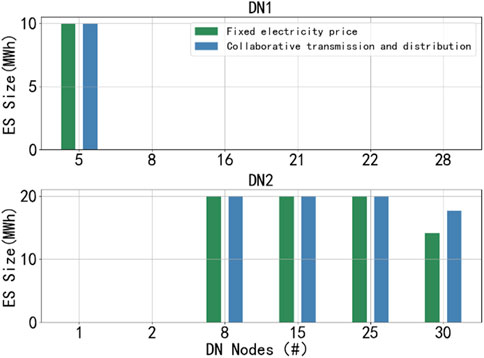
The planning results of energy storage site selection and scale are shown in Figure 8, and the specific configuration is shown in Table 4. It can be seen that the energy storage investment on distribution network 2 is higher than that on distribution network 1. This is mainly because distribution network 2 has better wind resources (see Figure 4) and has larger wind power and photovoltaic installed capacity. Therefore, its renewable energy generation is much larger than that of distribution network 1, and the corresponding energy storage investment will also be larger.
The energy storage investment on distribution network one is only distributed in node 5, because node 5 is the intersection of the branches where nodes 11, 26 and 40 are located, and it is also the only branch flowing to the root node. Installing energy storage here can effectively alleviate the congestion of the line. The energy storage investment in Distribution Network 2 is solely distributed at nodes 8, 15, 25, and 30, with no energy storage investment at nodes one and 2. This planning combination is mainly determined by the distribution of renewable energy generation, load distribution and grid structure. Node 25 has the largest wind power installed capacity and a lot of photovoltaic capacity, which determines that the energy storage investment of node 25 should be large. The nodes near nodes 8 and 15 are equipped with large-capacity wind power or photovoltaic units, and node 31 adjacent to node 30 has a large load. Therefore, it is reasonable to invest a lot of energy storage in these three nodes, which can effectively alleviate the congestion of adjacent nodes and lines. Nodes one and 2 are adjacent to the root node of the distribution network, which are mainly responsible for receiving or sending the transaction electricity between the distribution network and the upstream power grid, so there is no urgent need for energy storage.
The investment cost of the energy storage decision is
4.3 Overview of clearing electricity prices and system operation
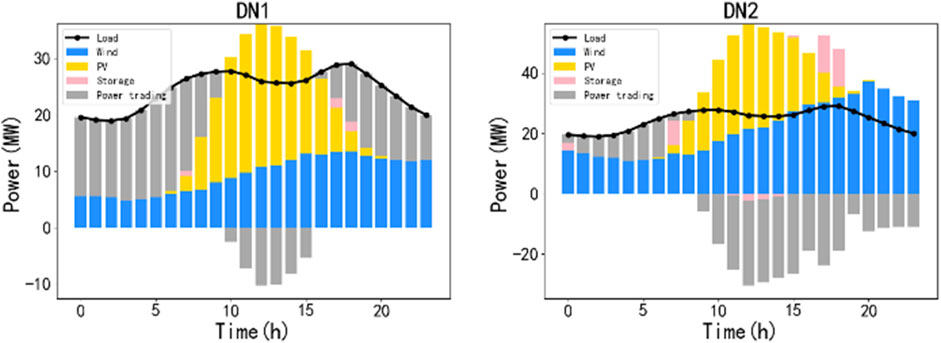
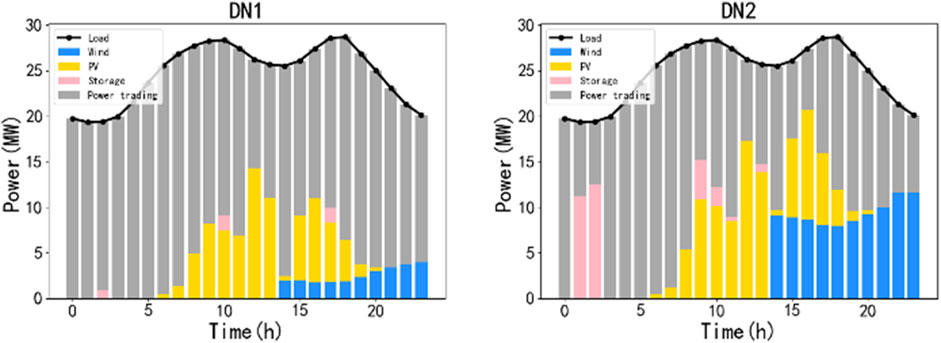
The power balance of the distribution network in a normal scenario and extreme weather is shown in Figures 9, 10 respectively. Compared with the normal scenario, the output of photovoltaic and wind power is partially limited by extreme weather, and the distribution network needs to purchase more electricity to meet energy demand.
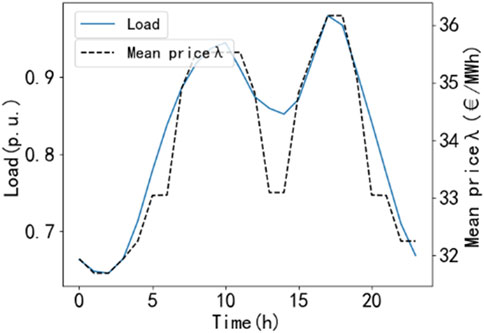
The load demand intensity and average electricity price in the region on a typical day are shown in Figure 11. For the electricity market, at the clearing price level, the amount of electricity that users are willing and able to purchase is exactly equal to the amount of electricity that the power generation side is willing and able to supply. Generally speaking, the power generation costs of various thermal power units are different, and the bids participating in the bidding are also different.
Therefore, when the user side demand is certain, the bids are usually won in order from small to large. When the load demand is small, the average electricity price in the area is also relatively small.
4.4 Impact of extreme weather scenarios on energy storage planning
In order to demonstrate the impact of extreme weather scenarios on energy storage planning, the following two scenarios are set up for analysis.
1) Scenario 1: Extreme weather scenarios are not considered in energy storage planning;
2) Scenario 2: Consider extreme weather scenarios in energy storage planning.
As shown in Figure 12, the energy storage planning under the two scenarios is shown. It can be seen from the figure that although the energy storage planning of the distribution network under the two scenarios is generally similar, in scenario 2, the energy storage capacity of node 30 in distribution network 2 is increased by 3.09 MW compared with scenario 1, that is, the total energy storage capacity of scenario 2 is greater than that of scenario 1. This is because considering the greater uncertainty and growth in electricity demand brought about by extreme weather scenarios, increasing energy storage capacity helps maintain power balance. However, due to the low probability of extreme weather scenarios, the increase in energy storage capacity is relatively small relative to the change in the overall energy storage plan.
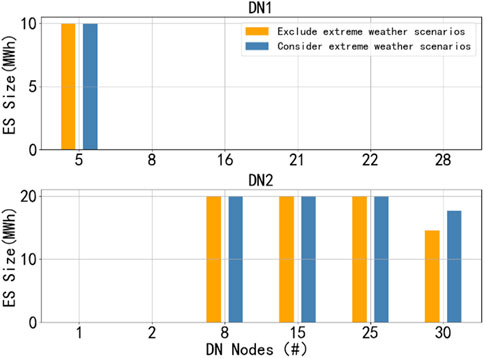
Figure 12. Comparison of energy storage planning with and without considering extreme weather scenarios.
In addition, the investment cost of energy storage planning in scenario one is
4.5 Impact of transmission and distribution coordination on energy storage planning
In order to demonstrate the impact of transmission and distribution coordination on energy storage planning, the following two scenarios are set up for analysis.
1) Scenario 1: The transmission and distribution grid conducts electricity trading at a fixed price;
2) Scenario 2: Determine the transaction price of transmission and distribution network based on the proposed model.
By comparing scenarios with fixed transmission and distribution network transaction prices, it demonstrates the role of transmission-distribution coordination mechanisms in dynamically changing transaction prices, thereby affecting the investment planning for energy storage. Figure 13 compares the energy storage planning under the two scenarios. The results show that the energy storage scale increases by 3.47 MW when the distribution network participates in the market bidding mechanism under the transmission and distribution coordination compared with the fixed transaction electricity price. This is mainly because under the transmission and distribution coordination mechanism, the electricity price will change dynamically according to market demand and supply conditions. This potential economic return encourages more energy storage investment, resulting in an increase in the scale of energy storage.
For example, under a fixed electricity price, the total investment and operating cost of the distribution network is
4.6 Fluctuation of voltage at distribution network nodes
Figure 14 shows the variation of the square of the voltage amplitude at all nodes of distribution network one during a day.
The square of the minimum and maximum voltage amplitudes during the day is 0.8744p.u. and 1.0691p.u. Since all voltages are within the safety range, network security is guaranteed. Therefore, in the case studied, the voltage security constraint has little effect on the planning and operation results.
5 Conclusion
Based on the TSO-DSO coordination framework, this paper establishes a distributed energy storage investment problem model considering extreme weather. Distributed energy storage power stations are installed in multiple distribution networks to obtain greater social welfare and renewable energy utilization. A stochastic bi-level investment planning model is established. The KKT condition, strong duality theory and linearization technology are used to transform the bi-level model into a single-level MILP model that is easy to solve. A chance constraint method based on a Gaussian mixture model is proposed to deal with the uncertainty of renewable energy power. This method can strike a balance between conservatism and optimism. A case study based on the transmission and distribution network system is carried out to verify the proposed model and method. The results show that the model considers the impact of extreme weather scenarios and optimizes the energy storage planning of the distribution network. Compared with not considering extreme weather, although the energy storage investment cost increases by 3.66%, it helps to improve the system’s flexible adjustment ability; considering the transmission and distribution collaborative conditions, the total investment and operation cost of the distribution network is reduced by 0.40%. In future research work, it is possible to consider adding system reliability indicators to improve the model, and consider studying more efficient solution methods to deal with the situation where the model is complex and difficult to solve due to the increase in extreme weather scenarios.
Data availability statement
The original contributions presented in the study are included in the article/supplementary material, further inquiries can be directed to the corresponding author.
Author contributions
YX: Investigation, Methodology, Writing–original draft. KZ: Data curation, Investigation, Writing–review and editing. ZW: Methodology, Validation, Writing–original draft, Writing–review and editing. GG: Software, Writing–review and editing. DL: Investigation, Writing–original draft. RS: Validation, Writing–original draft. Shengjin Huang: Software, Writing–original draft.
Funding
The author(s) declare that financial support was received for the research, authorship, and/or publication of this article. This work was supported by State Grid Corporation Science and Technology Project (No. 5419-202356379A-2-3-XG).
Conflict of interest
Authors YX, ZW, GG, and DL were employed by State Grid Economic and Technological Research Institute Co., Ltd.
Authors KZ and RS were employed by State Grid Corporation of China.
The remaining authors declare that the research was conducted in the absence of any commercial or financial relationships that could be construed as a potential conflict of interest.
The authors declare that this study received funding from State Grid Corporation Science and Technology Project. The funder had the following involvement in the study: collection, analysis, interpretation of data and the decision to submit it for publication.
Generative AI statement
The author(s) declare that no Generative AI was used in the creation of this manuscript.
Publisher’s note
All claims expressed in this article are solely those of the authors and do not necessarily represent those of their affiliated organizations, or those of the publisher, the editors and the reviewers. Any product that may be evaluated in this article, or claim that may be made by its manufacturer, is not guaranteed or endorsed by the publisher.
References
Akbari, T., and Bina, M. T. (2014). A linearized formulation of AC multiyear transmission expansion planning: a mixed-integer linear programming approach. Electr. Power Syst. Res. 114, 93–100. doi:10.1016/j.epsr.2014.04.013
Baringo, L., and Conejo, A. J. (2011). Wind power investment: a benders decomposition approach. IEEE Trans. Power Syst. 27 (1), 433–441. doi:10.1109/TPWRS.2011.2167764
Fernández-Blanco, R., Dvorkin, Y., Xu, B., Wang, Y., and Kirschen, D. S. (2016). Optimal energy storage siting and sizing: a WECC case study. IEEE Trans. Sustain. Energy 8 (2), 733–743. doi:10.1109/TSTE.2016.2616444
Hua, S., Li, J., Wang, T., Zhang, J., Hu, D., and Ge, Y. (2020). Control strategy of wind power transmission improvement by considering the battery energy storage in the feasible area of wind power acceptance. Jilin Electr. Power 48 (2), 5–10. doi:10.16109/j.cnki.jldl.2020.02003
Li, H., Liu, D., Qing, J., Han, X., Zhao, P., Sun, Y., et al. (2024). Stochastic planning method for UHVDC transmission of renewable energy power base considering wind and photovoltaic output uncertainties. Power Syst. Technol. 48 (7), 2795–2803. doi:10.13335/j.1000-3673.pst.2023.1888
Li, H., Liu, D., and Yao, D. (2021). Analysis and reflection on the development of power system towards the goal of carbon emission peak and carbon neutrality. Proc. CSEE 41 (18), 6245–6259.
Li, J., Wang, Z., Da, Z., Ren, Y., Jin, Y., and Zhou, B. (2023). Multi-level planning method of energy storage stations for resilient distribution networks considering spatio-temporal correlation of severe weather. Power Syst. Prot. Control 51 (9), 128–137. doi:10.19783/j.cnki.pspc.221212
Li, R., Wang, W., Wu, X., Tang, F., and Chen, Z. (2019). Cooperative planning model of renewable energy sources and energy storage units in active distribution systems: a bi-level model and Pareto analysis. Energy 168, 30–42. doi:10.1016/j.energy.2018.11.069
Liu, X., Hou, K., Jia, H., Zhao, J., Mili, L., Jin, X., et al. (2020). A planning-oriented resilience assessment framework for transmission systems under typhoon disasters. IEEE Trans. Smart Grid 11 (6), 5431–5441. doi:10.1109/TSG.2020.3008228
Liu, Z., Yang, P., and Xu, Z. (2017). Capacity allocation of integrated energy system considering typical day economic operation. Electr. Power Constr. 38 (12), 51–59. doi:10.3969/j.issn.1000-7229.2017.12.007
Ma, L., Wang, H., Lu, Z., and Zhen, L. (2020). Flexible resource planning for improving distribution network resilience under typhoon disasters considering relevance impact. Automation Electr. Power Syst. 46 (7), 60–68. doi:10.7500/AEPS20210902005
Pandžić, H., Wang, Y., Qiu, T., Dvorkin, Y., and Kirschen, D. S. (2014). Near-optimal method for siting and sizing of distributed storage in a transmission network. IEEE Trans. Power Syst. 30 (5), 2288–2300. doi:10.1109/TPWRS.2014.2364257
Peker, M., Kocaman, A. S., and Kara, B. Y. (2018). Benefits of transmission switching and energy storage in power systems with high renewable energy penetration. Appl. Energy 228, 1182–1197. doi:10.1016/j.apenergy.2018.07.008
Qian, D., Zeng, P., Sun, K., Xu, C., and Xu, Z. (2020). A planning method for the placement and sizing of distributed energy storage system considering the uncertainty of renewable energy sources. Energy Storage Sci. Technol. 9 (1), 162–169. doi:10.12028/j.issn.2095-4239.2019.0156
Tang, W., Lu, J., Chen, H., Yuan, Y., Lv, X., Chen, J., et al. (2022). “Optimal research on siting and sizing of energy storage in distribution network,” in 2022 5th international conference on power and energy applications (ICPEA) (IEEE), 398–402. doi:10.1109/ICPEA56363.2022.10052359
Wang, D., Zhang, C., Li, J., Zhu, L., Zhou, B., Zhou, Q., et al. (2024). A novel interval power flow method based on hybrid box-ellipsoid uncertain sets. IEEE Trans. Power Syst. 39 (4), 6111–6114. doi:10.1109/TPWRS.2024.3391921
Wang, H., Zhang, W., and Liu, Y. (2016). Measurement placement in active distribution networks considering output uncertainty of distributed generators. Automation Electr. Power Syst. 40 (12), 9–14. doi:10.7500/AEPS20160314010
Wang, L., Li, Y., and Jin, S. (2011). A new algorithm for linear programming—improved Big-M method. J. Logist. Eng. Univ. 27 (3), 92–96. doi:10.3969/j.issn.1672-7843.2011.03.017
Wang, X., Gao, X., Wang, Y., Shi, Y., Zheng, H., Yao, Y., et al. (2023). “Energy storage siting and capacity planning considering voltage flexibility under extreme scenarios,” in 2023 IEEE 7th conference on energy internet and energy system integration (EI2) (IEEE), 1082–1089. doi:10.1109/EI259745.2023.10512477
Xu, X., Li, J., Xu, Y., Xu, Z., and Lai, C. S. (2020). A two-stage game-theoretic method for residential PV panels planning considering energy sharing mechanism. IEEE Trans. Power Syst. 35 (5), 3562–3573. doi:10.1109/TPWRS.2020.2985765
Yao, T., Liu, Q., Liu, J., Liu, H., Huang, J., Zhang, L., et al. (2022). Research on joint planning methods for energy storage and transmission network considering complementarity of wind power and PV. Power Syst. Clean Energy 38 (7), 118–126. doi:10.3969/j.issn.1674-3814.2022.07.015
Yuan, W., Wang, J., Qiu, F., Chen, C., Kang, C., and Zeng, B. (2016). Robust optimization-based resilient distribution network planning against natural disasters. IEEE Trans. Smart Grid 7 (6), 2817–2826. doi:10.1109/TSG.2015.2513048
Zhang, W., Zhang, C., Zhou, Q., Li, J., Zhu, L., Cao, S., et al. (2024). Spatial–Temporal resilience assessment of distribution systems under typhoon coupled with rainstorm events. IEEE Trans. Industrial Inf., 1–10. doi:10.1109/TII.2024.3450079
Keywords: transmission and distribution coordination, bi-level optimization, energy storage sizing and siting, market clearing, uncertainty, extreme weather
Citation: Xue Y, Zhang K, Wang Z, Guo G, Liu D, Shi R and Huang S (2024) Planning of distributed energy storage with the coordination of transmission and distribution systems considering extreme weather. Front. Energy Res. 12:1505582. doi: 10.3389/fenrg.2024.1505582
Received: 03 October 2024; Accepted: 06 November 2024;
Published: 04 December 2024.
Edited by:
Cong Zhang, Hunan University, ChinaReviewed by:
ShunLin Zheng, North China Electric Power University, ChinaYuchen Fang, Dalian University of Technology, China
Mengfan Zhang, Royal Institute of Technology, Sweden
Copyright © 2024 Xue, Zhang, Wang, Guo, Liu, Shi and Huang. This is an open-access article distributed under the terms of the Creative Commons Attribution License (CC BY). The use, distribution or reproduction in other forums is permitted, provided the original author(s) and the copyright owner(s) are credited and that the original publication in this journal is cited, in accordance with accepted academic practice. No use, distribution or reproduction is permitted which does not comply with these terms.
*Correspondence: Guodong Guo, MTYyMjA2Mzc3NkBxcS5jb20=
 Yawei Xue1
 Shengjin Huang