- NARI Technology Nanjing Control Systems Co., Ltd., Nanjing, Jiangsu, China
The analysis of multi-energy flows forms the cornerstone for the study of state estimation, safety assessment, and optimization in integrated smart energy systems (ISES). The interactions between various energy flows and the inherent variability of renewable energy sources often lead to significant challenges to the static stability of ISES. This paper investigates the static voltage stability of ISES under multi-energy coupling conditions through multi-energy flow analysis in electric-gas-thermal energy systems. First, a steady-state model of the ISES is constructed by representing the interconnected energy subsystems as equivalent sources and loads in the power grid. Subsequently, through the coupling elements of ISES, the power flows of the natural gas system (NGS) and the district heating system (DHS) are converted into active power in the electrical power system (EPS), resulting in an equivalent power flow equation for the ISES. Then, using Brouwer’s fixed-point theorem, the analytical sufficient conditions for solving the equivalent power flow equation are derived. Finally, a simulation model based on MATLAB/Simulink is established. The steady-state criterion for ISES is obtained in this paper, and the correctness and effectiveness of the proposed conclusions are verified by the simulation results.
1 Introduction
With the depletion of fossil fuels and the increase in renewable energy sources, Integrated Smart Energy Systems (ISES) have gained widespread attention (Li et al., 2020; Liu et al., 2022; Peng et al., 2021; Ma et al., 2024; Wang et al., 2024; Yang et al., 2020). ISES refers to the coordinated optimization and stable operation of various energy supply systems within a certain area through the integration of multiple energy sources such as electricity, heat, cooling, and gas. By leveraging advanced information processing technologies and innovative management models, ISES aims to form a multi-energy collaborative management system that can meet diverse energy needs, aligning with future trends of openness, low carbon, and sustainability in the energy sector. Compared to traditional energy systems, ISES breaks the independence of individual energy supply networks, considering the complementary and cascading utilization relationships between various heterogeneous energy sources, thereby promoting the upgrading of the energy system structure (Huang et al., 2022).
As the proportion of renewable energy increases and the need for energy interconnection grows, the scale and complexity of ISES are also continuously increasing. However, one of the ensuing problems is static voltage stability, which refers to the ability of the system to maintain voltage levels under steady-state conditions (Liu et al., 2020; Nguyen et al., 2018; Liu et al., 2018). As the main energy carrier, electrical power system (EPS)’s coupling relationship with NGS and DHS is becoming increasingly complex. ISES can become unstable through various mechanisms, such as the loss of long-term equilibrium due to the increasingly complex coupling relationships among EPS, NGS, and DHS. Particularly, the uncertainty in power flow injections can push the equilibrium point of ISES out of the feasible region, making the system’s steady-state equilibrium non-existent (Dvijotham et al., 2018). Therefore, accurate static voltage stability analysis of ISES is crucial for subsequent state estimation, safety analysis, and optimal control.
Currently, researchers worldwide have conducted extensive studies and analyses on ISES, focusing mainly on ISES modeling, power flow calculation, steady-state analysis, and multi-energy system security. For example, in Shabanpour-Haghighi and Seifi (2015), a steady-state model of an electric-gas-thermal coupling system is established, considering the valve point effect of gas turbines, part-load characteristics of combined heat and power (CHP) units, and the impact of gas boilers on the power flow distribution of the energy system. In Zhang et al. (2021), an effective probabilistic multi-energy flow (PMEF) calculation method is proposed to obtain the probabilistic information and energy flow distribution of hydrogen-injected ISES through probabilistic flow analysis. In Massrur et al. (2018), an adaptive discretization method is proposed to achieve satisfactory accuracy with low computational burden. Regarding multi-energy flow and thermal inertia (Huang et al., 2023), proposes a sequential simulation reliability assessment method. Considering the time characteristics of renewable energy (Wu and Wang, 2022), uses a sequential Monte Carlo simulation method to evaluate the reliability of ISES. In Sun et al. (2019), the droop control and equal incremental rate standard of ISES are considered.
In summary, existing studies on ISES tend to focus on the efficiency of multi-energy flow calculation and steady-state calculation, without the ability to determine whether a steady state exists in ISES quickly and accurately. Additionally, although static voltage stability has been widely studied in traditional power systems, the specific characteristics of ISES, particularly the coordinated operation and coupling of multiple energy sources, have not been fully addressed. This paper aims to analyze the static voltage stability of ISES under multi-energy flow coupling conditions. The main contributions can be summarized as follows: (1) Derivation of static voltage stability criteria for ISES under multi-energy flow coupling, ensuring the existence of equilibrium points in ISES. (2) Proposal of a multi-energy flow equation iteration algorithm based on the fixed-point method, including the construction of iterative expressions and the selection of initial values.
2 Mathematical model of ISES
2.1 Symbols and definitions
Definition 1.
Definition 2. Define
Lemma 1. (
Lemma 2. Let
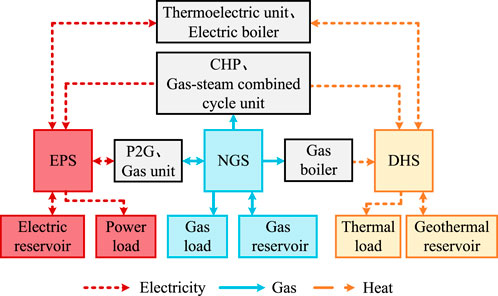
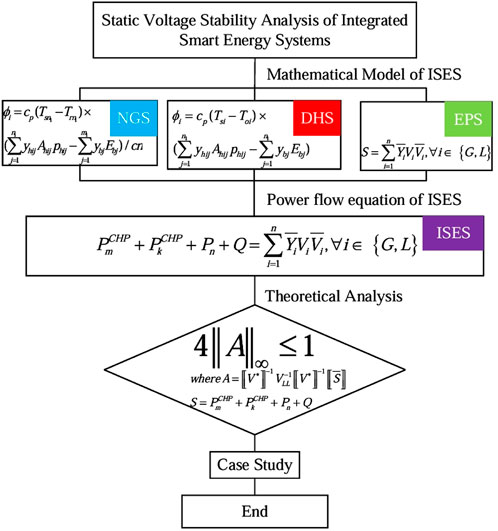
Based on the characteristics of power flow distribution in the EPS model, NGS model, and DHS model in ISES, the power flow equation of ISES is determined. First, the mathematical model of ISES is shown in Figure 1.
2.2 EPS model
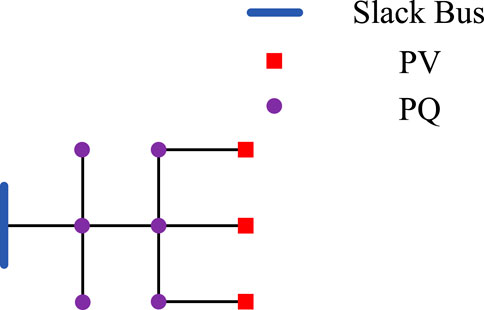
In the EPS model used in this paper, there are n + 1 buses, including l balanced bus, g distributed generation buses, and l load buses, corresponding to l balanced node, g generator nodes, and l load nodes, with l = n − g. The EPS is set as a voltage regulation source, and the phase angle of the balance bus is fixed. Without loss of generality, it is assumed that the balance bus has a voltage of
For PQ buses, the injected power is
where
Further, Equation 2 can be written in a compact form, resulting in Equation 3.
The reference direction of the current is opposite to the reference direction of the voltage, hence the negative sign on the right side of Equation 3.
2.3 NGS model
According to Ma et al. (2024), for an N-node NGS, the network equation describing the gas flow is given by Equation 4.
where
where
When there are pressure-defined nodes in the natural gas network, the node admittance matrix
2.4 DHS model
The steady-state calculation of DHS is divided into hydraulic steady-state calculation and thermal steady-state calculation, where the hydraulic steady-state power flow calculation is completely analogous to the steady-state power flow calculation of NGS.
2.4.1 Hydraulic steady-state model
According to Ma et al. (2024), as shown in Equation 7, this equation is consistent with the mathematical form of the power grid equation and is suitable for solving hydraulic flow in radial or looped networks.
where
Based on this classification, the network equation describing the hydraulic is shown by Equation 8.
where
When there are pressure-defined nodes in DHS, the node admittance matrix
where
2.4.2 Thermal steady-state model
According to Liu et al. (2022), the network equation for the thermal steady-state of DHS is given by Equation 11.
where
2.4.3 Combined water-thermal network model
It should be noted that in practical DHS, the thermal load power is usually known, and fluctuations in the thermal load simultaneously affect both the hydraulic and thermal circuits. According to the power flow calculation method of electric power systems, the network equation of DHS in terms of node thermal power is obtained, as shown in Equation 13.
where
2.5 Coupling units
2.5.1 CHP unit model
Combined heat and power (CHP) units are electric-thermal coupling elements, which are special thermal power units that can generate electricity and provide heat to users (e.g., urban centralized heating) by utilizing waste steam (steam that has completed its work in turbines). During operation, the units exhibit the characteristic of “determining electricity by heat,” i.e., adjusting the electricity output according to changes in heat output. The mathematical model is as follows shown by Equation 14:
where
2.5.2 Gas turbine model
Gas turbines are electric-gas coupling elements, usually acting as loads in the natural gas network to convert and output electricity, serving as sources in the power grid. The gas turbine model is as follows shown by Equation 15 (Liu et al., 2022):
where
Gas turbines act as sources in the power grid and loads in the gas network, connecting the PV nodes of the power grid with the injection-defined nodes of the gas network. Assuming that the heat source S1 in the thermal network operates under constant outlet pressure and constant outlet temperature, and the balance node is numbered
where
2.6 Power flow equations of ISES
Combining the mathematical models of the various subsystems in ISES and the energy coupling relationships of the coupling elements, the power flow equations of ISES can be represented by Equation 19.
Then, using the coupling elements as bridges, the network equations of NGS and DHS can be combined with the network equations of EPS. Their power flow can be equivalently represented as active power P substituted into Equation 2 to obtain the equivalent power flow equations of ISES.
where,
3 Sufficient analytical conditions for the existence of ISES equilibrium
In this section, we will apply Brouwer’s fixed-point theorem to the power flow equations of ISES to derive the static voltage stability criterion of ISES. First, taking the conjugate of both sides of Equation 3 gives Equation 21.
Equation 21 can be expanded based on Equation 1 and written in the form of Equation 22.
Multiplying both sides of the equation by
Note that the admittance matrix
For an n-dimensional quadratic equation with n unknowns (MDQE), solving it is quite challenging. The key lies in transforming the power flow equations into a form that constructs a mapping, and then obtaining the solution of the equations by analyzing the fixed points of the mapping.
To construct the mapping, we multiply both sides of Equation 24 by
Let
Therefore, the solvability of Equation 23 is equivalent to the existence of a fixed point of the function
Therefore, we can express the range as Equation 28.
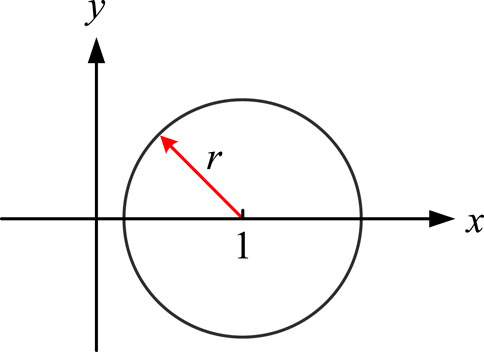
According to Brouwer’s fixed-point theorem, if there exists a non-empty compact set
After rearranging, we can obtain the static stability criterion for ISES, which is Equation 30.
In fact, the static voltage stability of both is fundamentally based on the existence of solutions to the power flow equations or multi-energy flow equations. Due to the coupling effects of multi-energy flows, the multi-energy flow equations are more complex than the power system flow equations. In this study, we modeled the Combined Heat and Power (CHP) components as pivotal connections among the Electric Power System (EPS), Natural Gas System (NGS), and District Heating System (DHS). Specifically, we consider the natural gas flow from the NGS as an input, while the outputs are the electrical energy from the EPS and thermal energy from the DHS. This approach allows us to integrate parameters such as gas flow and thermal energy into the power flow equations of the EPS (as illustrated in Equations 19, 20), enabling the derivation of the power flow equations for the ISES. Consequently, the analytical static voltage stability criterion for the ISES is proposed in Equation 30.
4 Cost optimization
Under the conditions of static voltage equilibrium, an optimization problem is set up with the objective function as shown by Equation 31:
Where
5 Simulation and experimental study
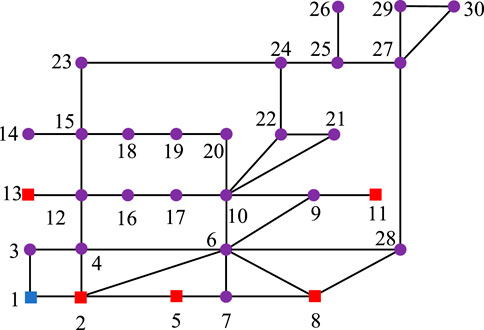
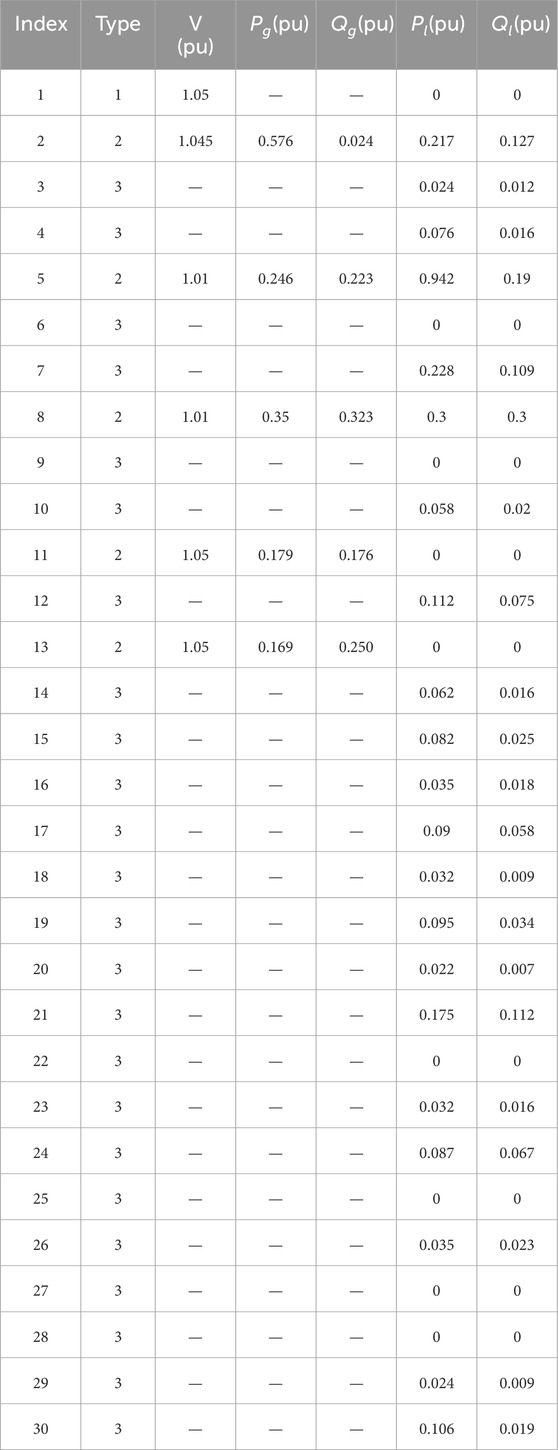
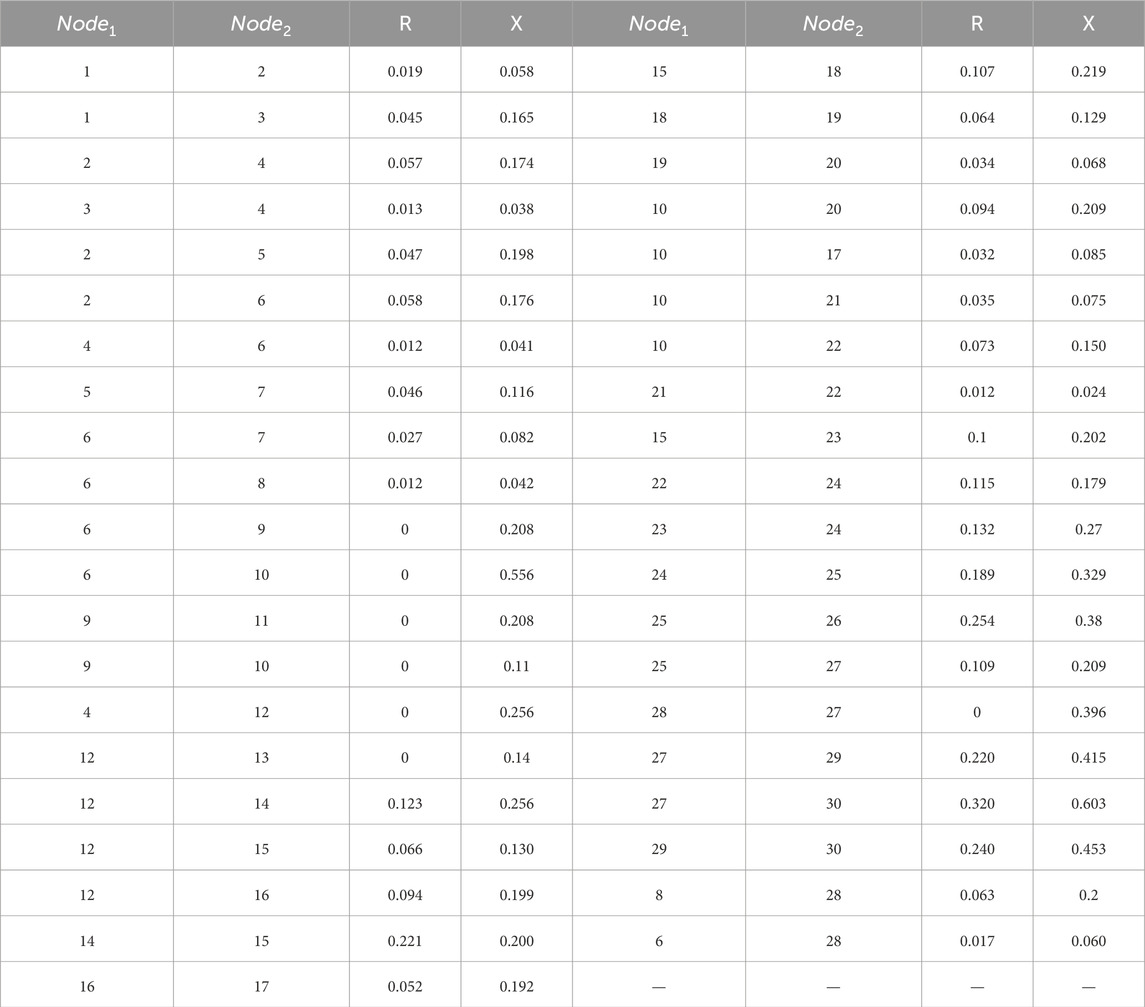
Based on the MATLAB/Simulink simulation platform, an IEEE 30-bus system as shown in Figure 4 is constructed. The blue nodes represent the slack buses, the red nodes represent the PV buses, and the purple nodes represent the PQ buses. The black line segments between the nodes represent the cables. The relevant parameters are shown in Table 3 and Table 4. Node 2 realizes electrical energy conversion through a gas turbine, nodes 5 and 8 achieve electrothermal energy conversion through CHP coupling elements, and nodes 11 and 13 are EPS power nodes.
By calculating the various power flow data of ISES using the thermal-to-electrical conversion method, including the load power of EPS, four test cases are designed to verify the static stability of the system. Let
Case 1. Nodes 2, 11, and 13 are source nodes, and all other loads are EPS loads with no load nodes converted from thermal loads.
Case 2. Nodes 2, 11, and 13 are source nodes, and nodes 5 and 8 are load nodes converted from thermal loads. All other loads are EPS loads.
Example 1. In the per-unit system,
Example 2. In the per-unit system,
Example 3. The reference voltage
The iterative process of the algorithm (Example 1) is shown in Figure 5. Figure 5 illustrates that
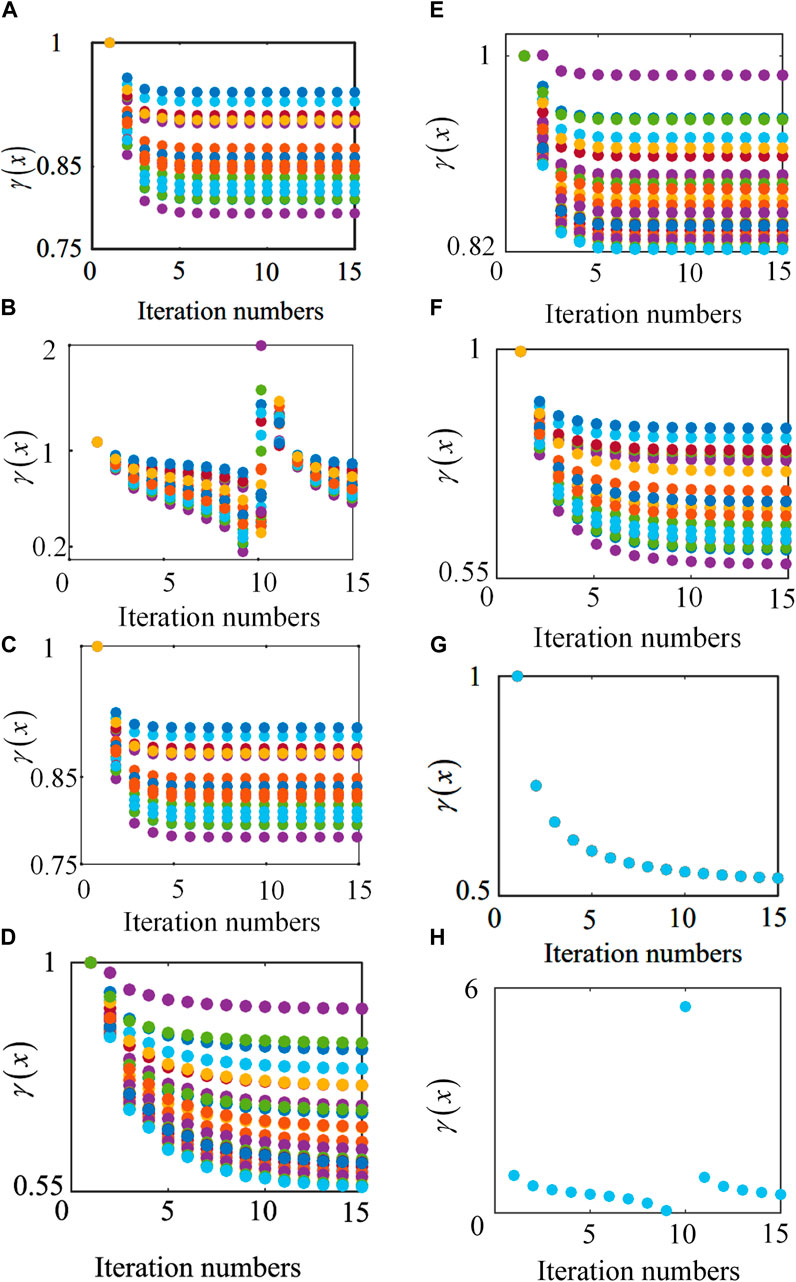
Figure 5. The iteration processes of the proposed algorithm:
Example 4. A Simulink model is established. In this case, the actual power of the load is involved in the calculation, set p = 0.18 MW, Q = 0 Var,
Example 5. Increase the DHS load power, set to p = 0.20 MW, Q = 0Var,
The results of Figures 5A, C, E indicate that if the static voltage stability criterion, i.e., Equation 30, is satisfied, then the proposed iterative algorithm converges to the solution; Figures 5B, D, F show that if the static voltage stability criterion is not satisfied, the proposed algorithm may diverge, and the power flow equations may have no solution. Furthermore, by comparing Case 1 and 2 in Figure 5, when DHS nodes are converted to electrical load nodes and added to the system, the system load increases, and the system’s stability margin decreases, meaning the system is more likely to lose its equilibrium point. Figures 5G, H show the results of the fixed-point algorithm’s iteration for Examples 4 and 5, respectively. In Figure 5G, the fixed-point algorithm converges, and the system has a solution; in Figure 5H, the fixed-point algorithm diverges, and the system may have no solution.
Simulation Examples 4, 5: In the case of Example 4, the three-phase voltage waveform in Figure 6A varies between
In the coupled network, the NGS is coupled with the EPS through the gas turbine at node 2, making node 2 another power source node for the EPS. The DHS is coupled with the EPS through the combined heat and power units at nodes 5 and 8, making nodes 5 and 8 two load nodes for the EPS. NGS and DHS, as sources or loads for EPS through coupling equipment, will certainly affect the original power flow distribution of the EPS. Therefore, we will analyze the changes in the static voltage stability criterion and the equilibrium point of the system by separately increasing the natural gas consumption, electrical load, and thermal load in the IEEE 30-bus system. Through this data, we will infer the impact of natural gas consumption, electrical load, and thermal load on the stability of the IEEE 30-bus system.
Figure 7A shows that increasing natural gas consumption can increase the system’s stability margin to a certain extent. When the gas consumption increases to
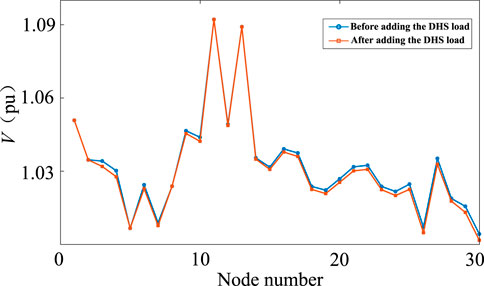
As shown in Figure 8A, when the gas consumption increases, the equivalent generator at node 2 can supply more active power to the system, and the node voltage can be maintained within an appropriate range, thus preserving the equilibrium point. Conversely, as shown in Figure 9, the voltage magnitude of the IEEE 30-bus system decreases after the addition of DHS load. This is because the DHS nodes are connected to the grid through CHP, and the thermal load adds an extra load to the system, increasing the demand for active power, which leads to a voltage drop. When the thermal load increment reaches 100 MW, the node voltage magnitude drops to 1.001 pu, as shown in Figure 8B, which is
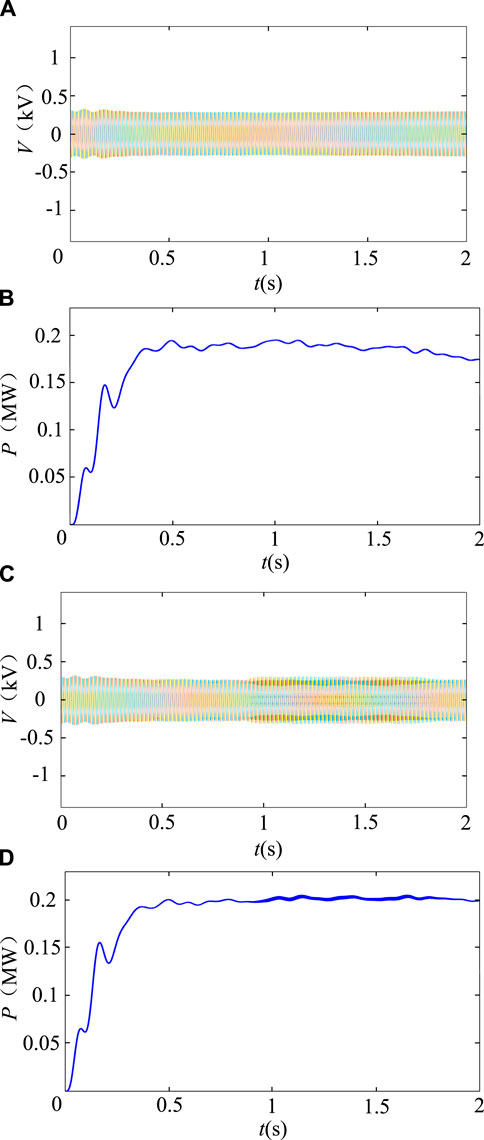
Figure 6. Simulation results of Case 3, 4. (A) Three-phase load voltage, for Example 3. (B) Load power, for Example 3. (C) Three-phase load voltage, for Example 4. Load power, for Example 4.
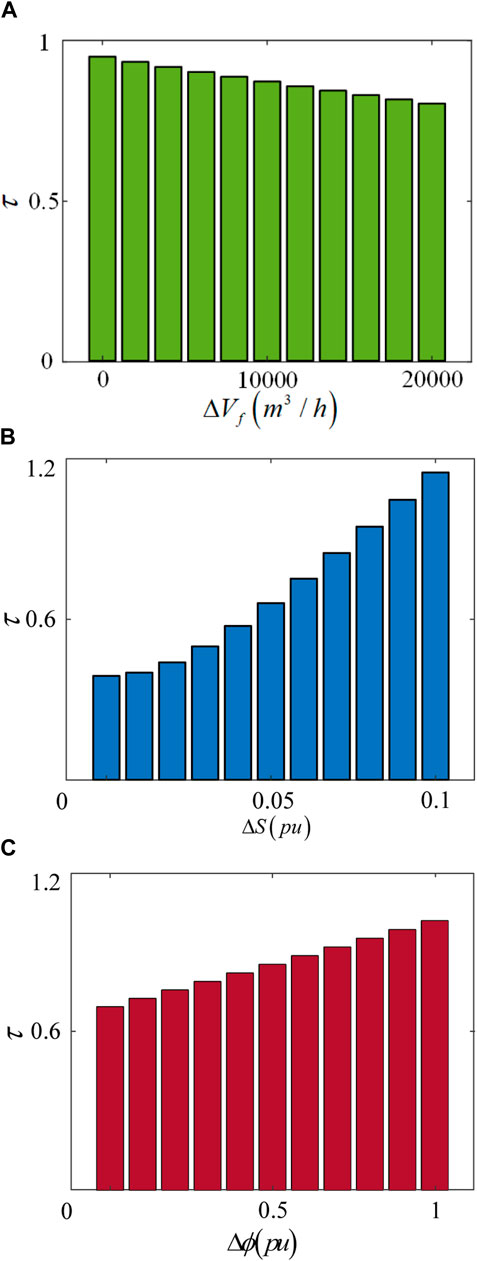
Figure 7. Static voltage stability criteria var ISES with the increase in gas consumption and load. (A) Variation of the static voltage stability criterion with increasing natural gas consumption. (B) Variation of the static voltage stability criterion with increasing electrical load. (C) Variation of the static voltage stability criterion with increasing thermal load.
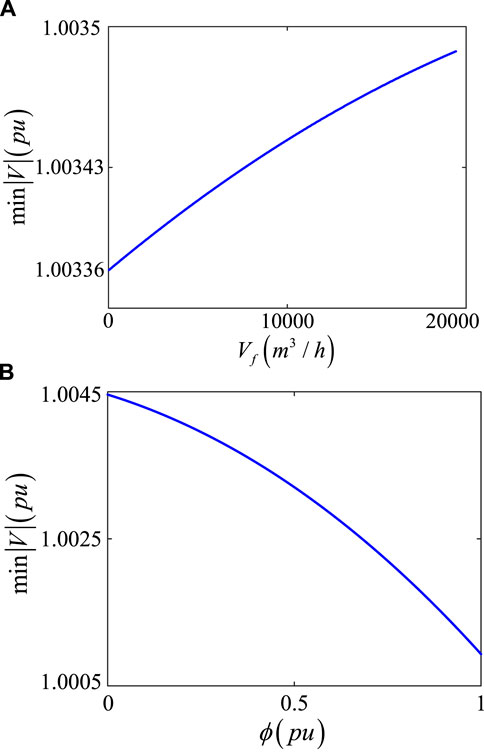
Figure 8. Equilibrium varies with the increase in gas consumption and thermal load. (A) Variation of the static voltage stability criterion with increasing natural gas consumption. (B) Variation of the equilibrium point with increasing thermal load.
6 Conclusion
Based on the characteristics of the power flow distribution in the EPS, NGS, and DHS models within ISES, this paper determines the power flow equations of ISES as shown in Figure 10. Using Brouwer’s fixed-point theorem, the power flow equations are algebraically transformed to obtain the corresponding algebraic equation mapping expressions. By constructing a self-mapping for the algebraic equation mapping expressions, the steady-state criterion for ISES is obtained. According to the relevant parameters and the steady-state criterion of ISES, it is determined whether ISES has a steady state. This paper successfully converts the solvability problem of ISES power flow equations into the existence problem of mapping fixed points. The derived static voltage stability criterion can quickly and accurately determine whether ISES has a steady state, providing support for subsequent state estimation, security analysis, and optimization control of ISES.
Data availability statement
The raw data supporting the conclusions of this article will be made available by the authors, without undue reservation.
Author contributions
JH: Conceptualization, Funding acquisition, Writing–original draft, Writing–review and editing. XD: Investigation, Project administration, Writing–original draft, Writing–review and editing. DJ: Resources, Software, Validation, Writing–review and editing, Writing–original draft. ZL: Methodology, Resources, Validation, Writing–original draft, Conceptualization, Writing–review and editing.
Funding
The author(s) declare that no financial support was received for the research, authorship, and/or publication of this article.
Conflict of interest
Authors JH, XD, DJ, and ZL were employed by NARI Technology Nanjing Control Systems Co., Ltd.
The reviewer LY declared a shared affiliation with the author DJ to the handling editor at the time of review.
Publisher’s note
All claims expressed in this article are solely those of the authors and do not necessarily represent those of their affiliated organizations, or those of the publisher, the editors and the reviewers. Any product that may be evaluated in this article, or claim that may be made by its manufacturer, is not guaranteed or endorsed by the publisher.
References
Dvijotham, K., Nguyen, H., and Turitsyn, K. (2018). Solvability regions of affinely parameterized quadratic equations. IEEE Control Syst. Lett. 2, 25–30. doi:10.1109/LCSYS.2017.2721380
Huang, Y., Sun, Q., Li, Y., Gao, W., and Gao, D. W. (2022). A multi-rate dynamic energy flow analysis method for integrated electricity-gas-heat system with different time-scale. IEEE Trans. Power Deliv. 38, 231–243. doi:10.1109/tpwrd.2022.3186762
Huang, Y., Sun, Q., Li, Y., Zhang, H., and Chen, Z. (2023). Adaptive-discretization based dynamic optimal energy flow for the heat-electricity integrated energy systems with hybrid ac/dc power sources. IEEE Trans. Automation Sci. Eng. 20, 1864–1875. doi:10.1109/TASE.2022.3188277
Li, C., Yang, H., Shahidehpour, M., Xu, Z., Zhou, B., Cao, Y., et al. (2020). Optimal planning of islanded integrated energy system with solar-biogas energy supply. IEEE Trans. Sustain. Energy 11, 2437–2448. doi:10.1109/TSTE.2019.2958562
Liu, N., Tan, L., Sun, H., Zhou, Z., and Guo, B. (2022). Bilevel heat–electricity energy sharing for integrated energy systems with energy hubs and prosumers. IEEE Trans. Industrial Inf. 18, 3754–3765. doi:10.1109/TII.2021.3112095
Liu, Z., Liu, R., Zhang, X., Su, M., Sun, Y., Han, H., et al. (2020). Feasible power-flow solution analysis of dc microgrids under droop control. IEEE Trans. Smart Grid 11, 2771–2781. doi:10.1109/tsg.2020.2967353
Liu, Z., Su, M., Sun, Y., Yuan, W., Han, H., and Feng, J. (2018). Existence and stability of equilibrium of dc microgrid with constant power loads. IEEE Trans. Power Syst. 33, 6999–7010. doi:10.1109/tpwrs.2018.2849974
Ma, Z., Zhou, Y., Zheng, Y., Yang, L., and Wei, Z. (2024). Distributed robust optimal dispatch of regional integrated energy systems based on admm algorithm with adaptive step size. J. Mod. Power Syst. Clean Energy 12, 852–862. doi:10.35833/MPCE.2023.000204
Massrur, H. R., Niknam, T., Aghaei, J., Shafie-Khah, M., and Catalão, J. P. (2018). Fast decomposed energy flow in large-scale integrated electricity–gas–heat energy systems. IEEE Trans. Sustain. Energy 9, 1565–1577. doi:10.1109/tste.2018.2795755
Molitierno, J. J. (2016). Applications of combinatorial matrix theory to laplacian matrices of graphs. London: Chapman & Hall.
Nguyen, H. D., Dvijotham, K., Yu, S., and Turitsyn, K. (2018). A framework for robust long-term voltage stability of distribution systems. IEEE Trans. Smart Grid 10, 4827–4837. doi:10.1109/tsg.2018.2869032
Peng, Q., Wang, X., Kuang, Y., Wang, Y., Zhao, H., Wang, Z., et al. (2021). Hybrid energy sharing mechanism for integrated energy systems based on the stackelberg game. CSEE J. Power Energy Syst. 7, 911–921. doi:10.17775/CSEEJPES.2020.06500
Shabanpour-Haghighi, A., and Seifi, A. R. (2015). An integrated steady-state operation assessment of electrical, natural gas, and district heating networks. IEEE Trans. Power Syst. 31, 3636–3647. doi:10.1109/tpwrs.2015.2486819
Sun, Q., Zhang, N., You, S., and Wang, J. (2019). The dual control with consideration of security operation and economic efficiency for energy hub. IEEE Trans. Smart Grid 10, 5930–5941. doi:10.1109/TSG.2019.2893285
Wang, D., Huang, D., Hu, Q., Jia, H., Liu, B., and Lei, Y. (2024). Electricity-heat-based integrated demand response considering double auction energy market with multi-energy storage for interconnected areas. CSEE J. Power Energy Syst. 10, 1688–1700. doi:10.17775/CSEEJPES.2022.02140
Wang, Z., Cui, B., and Wang, J. (2017). A necessary condition for power flow insolvability in power distribution systems with distributed generators. IEEE Trans. Power Syst. 32, 1440–1450. doi:10.1109/TPWRS.2016.2588341
Wu, T., and Wang, J. (2022). Reliability evaluation for integrated electricity-gas systems considering hydrogen. IEEE Trans. Sustain. Energy 14, 920–934. doi:10.1109/tste.2022.3229896
Yang, H., Li, M., Jiang, Z., and Zhang, P. (2020). Multi-time scale optimal scheduling of regional integrated energy systems considering integrated demand response. IEEE Access 8, 5080–5090. doi:10.1109/ACCESS.2019.2963463
Keywords: integrated smart energy system, electric power system, power flow equation, static voltage stability, Brouwer’s fixed-point theorem
Citation: Huang J, Ding X, Jin D and Liu Z (2024) Static voltage stability analysis of integrated smart energy systems. Front. Energy Res. 12:1500830. doi: 10.3389/fenrg.2024.1500830
Received: 24 September 2024; Accepted: 31 October 2024;
Published: 15 November 2024.
Edited by:
Rui Wang, Northeastern University, ChinaReviewed by:
Liang Yuan, Central South University, ChinaWentao Jiang, Northwestern Polytechnical University, China
Guangze Shi, Hunan University of Technology and Business, China
Copyright © 2024 Huang, Ding, Jin and Liu. This is an open-access article distributed under the terms of the Creative Commons Attribution License (CC BY). The use, distribution or reproduction in other forums is permitted, provided the original author(s) and the copyright owner(s) are credited and that the original publication in this journal is cited, in accordance with accepted academic practice. No use, distribution or reproduction is permitted which does not comply with these terms.
*Correspondence: Xuetian Ding, ZGluZ3h1ZXRpYW5Ac2dlcHJpLnNnY2MuY29tLmNu
 Jungao Huang
 Zhangjie Liu