 Xiaohong Dong1
 Shuo Wang
- 1State Key Lab of Reliability and Intelligence of Electrical Equipment, Hebei University of Technology, Tianjin, China
- 2Tianjin Electric Power Science and Research Institute, Tianjin, China
- 3Key Laboratory of Smart Grid of Ministry of Education, Tianjin University, Tianjin, China
Introduction: Wind turbine generators (WTGs) and electric vehicles (EVs) are used as source-side and load-side resources, respectively. And the uncertainties of WTGs output and EVs charging load seriously affect the frequency stability of the power system. For the wind speed prediction error and the uncertainty of EV off-grid time, a cooperative frequency modulation (FM) strategy is proposed.
Methods: Firstly, the wind speed interval is divided based on the operating characteristics of WTGs and the load reduction rate. On the basis, a load reduction operation strategy based on rotor speed control and pitch Angle control is proposed to enable WTGs to have bidirectional FM capability. The adjustable capacity of WTGs is determined based on the wind speed prediction error and the operation strategy of load reduction; Secondly, based on the controllable domain model of an EV considering the off-grid time uncertainty, the adjustable capacity of EV clusters is determined by state grouping of the state of charge (SOC) according to its charging urgency. By defining EV FM capability parameters and charging urgency parameters, the EV priority list for FM is determined and the power allocation strategy is proposed; Then, based on the urgency of EV charging and the economy of WTGs load reduction operation, a cooperative FM task assignment strategy is proposed.
Results: Simulations demonstrate the strategy enhances FM capability and improves FM effect by 6.05% compared to fixed-proportion task allocation. It strengthens frequency stability by leveraging complementary strengths.
Discussion: Consideration of wind speed prediction errors can improve WTG adjustable capacity estimation, boosting FM accuracy; Coordinated task allocation minimizes WTGs intermittent FM output impacts, ensuring stable grid frequency. This dual-source-load approach offers a robust solution for modern power systems with high renewable penetration.
1 Introduction
Given the rapid promotion of carbon peaking and carbon neutrality strategies, a large proportion of the new energy and large-scale electric vehicles (EVs) have the capability to become the new elements of the source and load sides of the new power system in China. On the source side, the new energy units represented by wind power and photovoltaics are connected to the power grid through converters. Furthermore, the separation of active regulation and frequency control along with the uncertainty and low-inertia characteristics of power generation have strongly impacted the frequency stability of power systems (Zhang et al., 2022a; Zhang et al., 2024b). On the load side, as EVs are a kind of mobile energy storage equipment, their charging and discharging behavior is affected by various factors owing to stochasticity and uncertainty. Charging a large number of EVs in an unorganized manner increases the power grid load and even affects the balance between power grid supply and demand, thereby affecting the frequency stability of the power grid (Zhang et al., 2022b). Traditional thermal power frequency modulation (FM) plants are affected by the mechanical rotating parts and have low ramp rates, which make it difficult to meet the FM requirements of new power systems (Hui et al., 2019).
Doubly fed induction generators (DFIGs) are typical variable pitch-type wind turbine generators (WTGs) that are connected to a power grid through power electronic equipment with the generator speed decoupled from the grid frequency. When the power grid frequency changes, the WTGs cannot respond to these changes (Teng et al., 2023; Tang et al., 2022), and corresponding FM controllers need to be attached to the WTGs. Based on the source, FM energy can be mainly categorized into two FM control methods, namely virtual inertial control (Wu et al., 2019; Lee et al., 2016; Lyu et al., 2021; Bonfiglio et al., 2019) and power standby control (Liu et al., 2021). Of these, the power standby control ensures wind turbine operation at reduced load via overspeed control or pitch control, leaving a reserve to support the system FM; this scheme is also known as load reduction control (Dreidy et al., 2017).
Overspeed control can be used to achieve fast responses, while pitch control can be used for a wide range of applications; coordinating balanced control between the two can help utilize their respective advantages. For example, Lyu et al. (2021) and Bonfiglio et al. (2019) proposed coordinated control methods that combined overspeed control and pitch control. These methods fully utilize the advantages of overspeed control at medium and low wind speeds and pitch control at high wind speeds. However, the FM capability of a WTG is significantly affected by the wind speed. When WTGs alone are used to achieve FM, their FM capabilities can fluctuate greatly, and the WTGs may not be able to provide sufficient FM capability when the system frequency fluctuates greatly (Li et al., 2018; Zhang et al., 2012).
At present, various scholars have conducted extensive research on the coordinated FM of WTGs and other FM resources. In terms of coordinated FM using WTGs and thermal power plants (TPPs), the advantages of WTGs, such as their high response speeds, can be combined with the stable outputs of TPPs to improve the efficiency of FM (Zhong et al., 2014; Liu et al., 2017). However, given the low response speeds of TPPs, when the wind speed is low and frequency decreases sharply, WTGs and TPPs cannot respond in time. Thus, energy storage with its high response speed and high controllability can compensate for the deficiencies of WTGs and TPPs in FM (Zhang et al., 2023; Zhang et al., 2024a).
However, owing to the lifetime limitations of energy storage power plants and their high construction and operation costs, vehicle-to-grid (V2G) technology can be used to regulate the charging and discharging power of EVs in milliseconds using bidirectional smart charging devices (Liu et al., 2020). The FM capability of a single EV is limited, and EVs have larger FM capabilities. If EVs with their larger downward FM capabilities can be combined with WTGs having larger upward FM capabilities using power standby control, then the collaborative FM using EVs and WTGs not only satisfies the rapid FM requirements of the power grid but also reduces the construction and operation costs of the energy storage power station along with the wind abandonment rate of the WTGs. However, the problem of EV uncertainty must be considered as a challenge (Wang et al., 2024).
A cooperative FM strategy involving WTGs and EVs was proposed by Pahasa and Ngamroo (2016) based on model prediction, and only pitch angle control (PAC) was used in the WTG FM strategy. By combining rotor speed control and PAC, Li (2019) established a bidirectional FM model for WTGs that covered all wind speed zones and proposed a cooperative FM strategy for WTGs and EVs; however, the uncertainty of the WTG FM output was not considered. An FM model for WTGs was established based on inertia control, droop control, and PAC, in Zhang et al. (2019), and a control strategy for joint FM of EVs and WTGs was proposed; however, this work does not take into account the coordinated FM in the case of continuous wind speed changes. Coordinated control of WTGs and demand-side response was also proposed in Zhu et al. (2021), which did not consider the continuous wind speed and wind speed error. Thus, the following problems must be considered when WTGs and EVs cooperatively participate in power grid FM: 1) intermittency and uncertainty of WTG FM capability; 2) impact of uncertainty of off-grid time for EV users on FM capability; 3) reasonable allocation of FM tasks for EVs and WTGs in cooperative FM.
To address the above problems, a cooperative FM strategy considering source–load uncertainty is proposed here. First, the load reduction FM strategy is proposed for WTGs by combining speed and pitch angle control based on the consideration of wind speed prediction errors along with the load reduction operation strategy. Furthermore, an EV FM strategy is proposed by considering the uncertainty of the user’s off-grid time. Then, the FM task allocation strategy for EVs and WTGs is proposed based on the urgency of EV charging and the economics of WTG load reduction.
The remainder of this article is organized as follows. Section 2 describes the framework of the cooperative FM strategy considering the source–charge uncertainty. Section 3 introduces the WTG load reduction FM strategy with consideration of the wind speed prediction errors. Section 4 introduces the EV power allocation strategy with consideration of the off-grid time uncertainty of the user. Section 5 introduces the FM task assignment strategy considering the source–load uncertainty. Section 6 presents a case study, and Section 7 summarizes the conclusions of this work.
2 Framework of the proposed cooperative FM strategy
The cluster cooperative FM strategy with the WTGs and EVs also includes the grid dispatch center, the thermal power units, and the EV aggregator, as shown in Figure 1. The collaborative FM task assignment strategy for the WTGs and EVs mainly considers the economical load reduction operation of the WTGs and the charging urgency of the EVs. First, the adjustable capacities of the WTGs and EVs are reported to the power grid dispatch center. Second, based on the system frequency deviation after the thermal power units participate in primary FM and the adjustable capacities of the WTGs, thermal power units, and EVs, the power grid dispatch center assigns FM tasks to the WTGs, thermal power units, and EVs based on the collaborative FM task assignment strategy. Finally, the WTGs respond to the FM tasks based on the load reduction FM strategy and the adjustable capacity considering the wind speed prediction errors; the EVs are controlled in an orderly manner based on the adjustable capacity considering the off-grid time uncertainties of the EV users and the power allocation strategy to respond to the FM tasks.
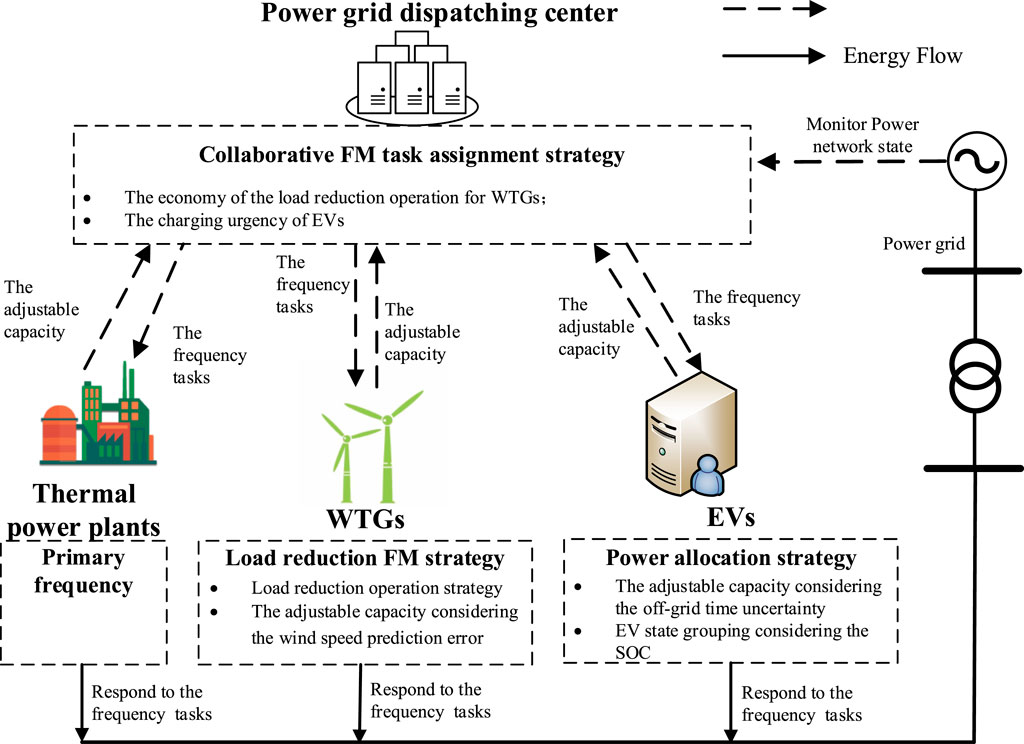
Figure 1. Framework of the proposed frequency modulation (FM) strategy.
3 Load reduction FM strategy of WTGs considering wind speed prediction errors
To gain bidirectional FM capability, the WTGs must be operated in the load reduction state through power standby control. The adjustable capacity of the WTGs must be determined when participating in FM, and this is affected by the wind speed and the load reduction operation strategy. Therefore, the adjustable capacity of the WTGs must be quantified based on the predicted wind speed information and load reduction operation strategy. However, there may be errors between the actual and predicted wind speeds in the response period of the FM tasks, and large errors may affect the accuracy of the WTG responses to the FM tasks.
Thus, the power control principle of the WTGs is analyzed, and the wind speed interval is divided based on the operating characteristics of the WTGs and their load reduction rate to propose the load reduction operation strategy by combining the rotor speed and pitch angle control. The WTGs are operated in the load reduction state, and the initial value of the pitch angle is determined for the PAC; then, the corrected wind speed prediction model is constructed by considering the prediction errors. Finally, the adjustable capacity of the WTGs is quantified by combining the wind speed prediction errors and the load reduction operation strategy of the WTGs.
3.1 WTG load reduction operation strategy based on combined rotor speed and pitch angle controls
3.1.1 WTG power control principle
The rotor speed and pitch angle of a WTG can be precisely controlled based on the wind speed conditions and FM tasks through the grid-connected controller to realize active power adjustment. The principle of active power generation in a WTG is as shown in the following equation (Ren et al., 2011):
where Pm is the mechanical power of the WTG output; ρ is the air density; Rw is the radius of the wind turbine blade; v is the wind speed; Cp(λ, β) is the wind energy utilization coefficient, abbreviated as Cp, which refers to the ratio of the wind energy captured by the blade per unit of time to the total wind energy flowing through the rotating surface of the blade; λ is the tip speed ratio, which expresses the state of the WTG at different wind speeds, and is determined as the ratio of the speed of the tips of the wind turbine blades to the wind speed; β is the pitch angle; γ is the introduced intermediate variable; ωr is the mechanical angular velocity of the wind turbine, which is proportional to the rotor speed. If the wind speed is constant, then the output power of the WTG is determined from the wind energy utilization coefficient Cp.
The wind energy utilization coefficient Cp is a function of the tip speed ratio λ and the pitch angle β. According to Formula 1, this correlation curve can be obtained as shown in Supplementary Appendix A1. It is noted that when the pitch angle β increases gradually, the Cp(λ, β) curve will narrow significantly. This means that increasing the pitch angle reduces the active power of the WTG output. When the pitch angle β is unchanged, a curve can be used to describe the wind energy utilization coefficient Cp as a function of the tip speed ratio λ. Furthermore, there exists an optimal tip speed ratio λotp that maximizes the wind energy utilization coefficient Cpmax, the specific principle of which is shown in Equation 2.:
where
3.1.2 WTG load reduction operation strategy
WTGs are generally divided into the following zones according to the wind speed: low wind speed zone, MPPT zone, constant speed zone, and constant power zone. In the low wind speed range, if the wind speed is lower than the cut-in wind speed vin, normal power generation is not possible; if the wind speed is higher than vin, then the wind turbine starts to operate. In the MPPT range, the wind speed changes, and the rotor angular speed is adjusted to achieve an optimal tip speed ratio. As the wind speed increases, the rotor attains maximum speed, and the rotor angular speed is maintained at the maximum value to ensure safe operation. When the wind speed reaches the rated value, the rated power of the wind turbine is maintained by increasing the pitch angle to maintain the rated power output.
To achieve bidirectional FM capability, the WTGs are operated in the load reduction state through combined rotor speed and pitch angle control. In the MPPT zone, the rotor speed control enables the WTGs to operate at a suboptimal rotor speed higher than the optimal speed, thereby operating in the load reduction state. As the wind speed increases, the rotor speed control may cause the rotor speed to exceed the safe operating range; in this case, additional PAC is required to ensure safe and reliable operation of the WTG while maintaining the load reduction state.
In the MPPT zone involving combined control, the conventional wind speed interval division no longer meets the load reduction operation needs of the WTGs participating in the FM; hence, it is necessary to reasonably divide the wind speed intervals based on the operating characteristics of the WTGs and the load reduction rate. The entire range of wind speeds is thus divided into three zones: start-up, load reduction, and cut-out zones. In the start-up zone, the low active power of the WTG output means that the WTGs do not participate in the FM service. In the cut-out zone, owing to the high wind speeds, the WTGs are removed from the grid-connected state to ensure safe operation, so they cannot participate in the FM service. Therefore, the WTGs only provide FM service to the power grid when the wind speeds are in the range of the load reduction zone.
Considering the relevant operational constraints of the WTGs, the load reduction zone can be further subdivided into low, medium, and high load reduction areas, and different load reduction rates are set for these three areas. In the low load reduction zone, rotor speed control is used for load reduction, and the load reduction rate is set to d1%. In the medium load reduction zone, considering the rotor speed constraints, rotor speed control is used in combination with PAC to realize load reduction operation and the load reduction rate is set to d2%, as shown in the Equation 3. In the high load reduction zone, PAC is used to realize load reduction operation, and the load reduction rate is set to d3%. Here, d1% and d3% are fixed load reduction rates that can be adjusted based on the actual conditions, as shown in Figure 2.
where vt is the wind speed in the medium load reduction zone; v2 is the wind speed at the boundary between the low and medium load reduction zones; v3 is the wind speed at the boundary between the medium and high load reduction zones.
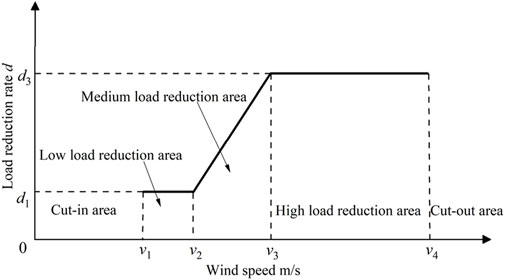
Figure 2. Load reduction rates at different wind speed ranges.
The method of dividing the wind speeds at the different boundaries is as follows:
1) Between the start-up and low load reduction zones v1: to ensure that the WTGs achieve the required upward adjustable capacity, the optimal rotor speed ωopt must be controlled to within a safe range. Therefore, the wind speed v1, corresponding to the optimal rotor speed and the lower operating limit of the WTGs, is set as the wind speed at the boundary between the start-up and low load reduction zones. This wind speed v1 must be greater than the cut-in wind speed vin of the WTGs to ensure that the grid connection conditions are met.
2) Between the low and medium load reduction zones v2: considering the safe operating range for the rotor speed, PAC is introduced in the medium load reduction zone. Therefore, v2 is the wind speed at which the rotor speed control reaches the upper limit of safe operation.
3) Between the medium and high load reduction zones v3: since ωopt is the same as the upper limit of the rotor speed at the rated wind speed vN when the wind speed exceeds the rated speed vN, the WTGs can only realize load reduction operation through PAC. Therefore, the rated wind speed vN is set as v3.
4) Between the high load reduction zone and the cut-out zone v4: to ensure the safe operation of the WTGs, the cut-out wind speed vout of the WTGs is set to v4. Once the wind speed exceeds v4, the WTGs will automatically stop and exit the load reduction state.
3.1.3 Determining the initial pitch angle for PAC
When the wind speed exceeds v2, it is necessary to combine PAC with rotor speed control to realize load reduction operation. At a certain wind speed, the active power of the WTG output is proportional to the wind energy utilization coefficient Cp. Therefore, the variation of the active power is described by the coefficient Cp. According to Formula 1, the relationship curve between the utilization coefficient and the pitch angle can be obtained. Supplementary Appendix A3 demonstrates the variation of the wind energy utilization coefficient Cp with the pitch angle at a wind speed of v2, where the rotor speed is 1.2 pu. It can be seen that Cp does not decrease monotonically as the pitch angle increases. When the wind speed is v2, there exist three values of the pitch angle β1 = 0°, β2 = 0.5°, and β3 = 2.1°, which can ensure the WTGs in load reduction operation of the WTGs.
To analyze the effects of different initial values of the pitch angle on the PAC, we selected β1, β2, and β3 for analysis, as shown in Figure 3. When β1 is the initial value, the pitch angle undergoes a large abrupt change of 2.1° as the wind speed increases from 10.2 m/s to 10.3 m/s. When β3 is the initial value, the pitch angle changes very slightly as the wind speed increases from 10.2 m/s to 10.3 m/s; however, given the fact that PAC is introduced only in the medium load reduction zone, the pitch angle changes greatly from 0° to 2.1° when the wind speed reaches v2 (10.1 m/s). In contrast, when β2 is the initial value, the pitch angle changes by only 1.5° when the wind speed increases from 10.2 m/s to 10.3 m/s, and the pitch angle change when the wind speed reaches v2 (10.1 m/s) is also small. Therefore, considering the maintenance cost of the WTGs and the limitation on the change rates of the pitch angle, β2 is selected as the initial value for PAC in the medium load reduction zone.
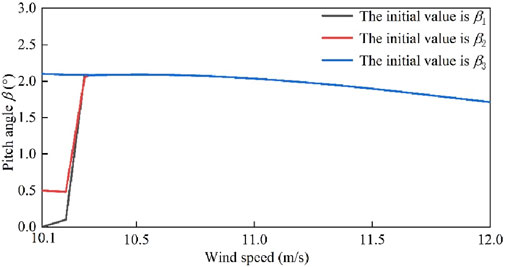
Figure 3. Influence of different initial pitch angle values on pitch angle control in the medium load reduction region.
3.2 Quantifying the adjustable capacity of the WTGs considering wind speed prediction errors
The participation of WTGs in the FM service requires the reporting of the adjustable capacity to the power grid dispatch center, so it is necessary to quantify the FM capability of the WTGs based on the load reduction operation strategy and the corrected wind speed vt.
3.2.1 Wind speed forecast errors
The wind speed errors are predicted by combining historical and forecast data based on the autoregressive integrated moving average model, as shown in Equation 4:
where p is the lag order of the autoregressive term;
3.2.2 Wind speed correction considering forecast errors
By combining the wind speed prediction error and the WTG load reduction operation strategy, when the wind speed is in the load reduction zone, the WTGs need load reduction control to achieve bidirectional FM capability. Using the corrected wind speed vt, the adjustable capacity of the WTGs can be quantified as follows.
① WTGs in the low load reduction zone provide an upward adjustable capacity of d1%PMPPT(v): when the corrected wind speed vt is within the low load reduction zone, the load reduction rate of the WTGs is d1%. The rotor speed control is then utilized to operate the WTGs in the overspeed suboptimal trajectory while maintaining a pitch angle of 0° to realize the load reduction operation. The specific corresponding rotor speed can be determined using Equation 5.
where
② WTGs in the medium load reduction zone provide an upward adjustable capacity of d2%PMPPT(v): when the corrected wind speed vt is in the medium load reduction zone, the load reduction rate of the WTGs is d2%. The rotor speed remains unchanged at 1.2 pu. because it has already reached the upper limit of safe operation. The combination of rotor speed and pitch angle control is used to ensure WTG operation in the load reduction state. The initial value of PAC in the load reduction area is β2, and the specific corresponding pitch angle can be determined using Equation 6.
where βt and
③ WTGs in the high load reduction zone provide an upward adjustable capacity of d3%PN: when the corrected wind speed vt is in the high load reduction zone, the load reduction rate of the WTGs is d3%. Because the rotor speed of the WTGs in the normal operation state has reached the upper limit of safe operation (1.2 pu), it is not possible to use rotor speed control. Therefore, PAC is used to realize the load reduction operation of the WTGs, and the specific corresponding pitch angle can be determined using Equation 7.
where βt and
In summary, based on the loadreduction operation strategy of the WTGs and the corrected wind speed vt, the upward adjustable capacity
where
4 Power allocation strategy for EVs considering off-grid time uncertainty
Owing to their mobility characteristics, EVs may leave before or after the planned off-grid time, which may lead to inaccurate prediction of the controllable capacity of EVs and make it difficult to fulfill FM tasks in extreme cases. It is even possible that the charging demand cannot be met after controlling the charging and discharging due to early departure. To solve this problem, the credibility parameter is introduced to describe the off-grid time uncertainty, a single EV controllable domain model is built based on the credibility modification, and the EVs are grouped into different states to quantify the adjustable capacity of the EV cluster. Then, by comprehensively considering the FM capability of the EVs, charging urgency, and credibility information, the FM prioritization parameter is established to determine the FM priority list. Finally, based on the FM tasks of the EVs, the FM priority list, and the state grouping, a power allocation strategy is proposed to determine the participating EVs and the total response capacity.
4.1 EV state grouping based on the controllable domain model
4.1.1 Single EV controllable domain model based on credibility correction
The credibility parameter ρi can be obtained from the historical charging data of the EVs, as shown in Equation 10 (Luo et al., 2013). The off-grid time of the users can be corrected using the credibility parameter, as shown in Equation 11. Accordingly, the single EV controllable domain model is established based on the credibility correction, as shown in Figure 4, and the time range when the EV is connected to the power grid is [tin,i, tl,i(ρi)]. Here, tin,i is the arrival time of the ith EV, and tl,i (ρi) is the corrected off-grid time based on the credibility parameter ρi of the ith EV. In Figure 4, SOCmin refers to the minimum state of charge (SOC) of the EV; SOCi,0 is the initial SOC of the ith EV; SOCe,i is the expected SOC of the ith EV; SOCmax is the maximum SOC of the EV.
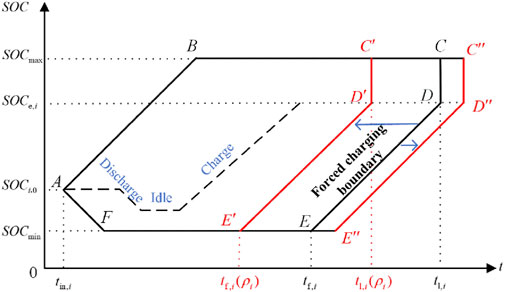
Figure 4. Single electric vehicle (EV) controllable domain model based on credibility correction.
If ρi < 1, then the EV will be off-grid before the set off-grid time tl,i. At this time, the upper and lower boundaries of the controllable domain based on the credibility correction are A-B-C’ and A-F-E’-D’, respectively, and the boundary for forced charging of the EV is E’-D’. The forced charging boundary can be calculated from the forced charging time tf,i(ρi), as shown in Equation 12. On the contrary, if ρi ≥ 1, the EV will be off-grid after the set off-grid time tl,i, and the upper and lower boundaries of the controllable domain based on the credibility correction are A-B-C’ and A-F-E’-D’, respectively, such that the forced charging boundary of the EV becomes E’-D’. When t ≥ tf,i(ρi), to satisfy the charging demand, the EV enters the forced charging state (FCS) and is charged based on
where
where Q is the battery capacity of the ith EV; SOCi(t) is the state of charge of the ith EV in the tth period;
4.1.2 EV state grouping based on the controllable domain model
The battery capacities of the EVs participating in the FM during the off-grid time should meet the charging requirements of the EV users. Based on the single EV controllable domain model, the remaining on-grid time
where
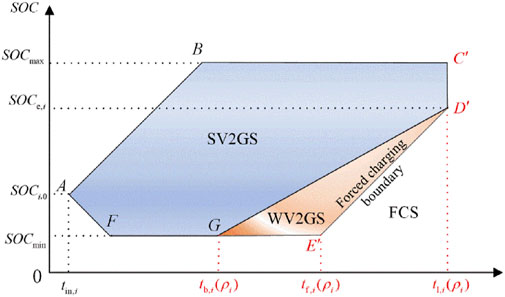
Figure 5. Schematic representation of EV state grouping.
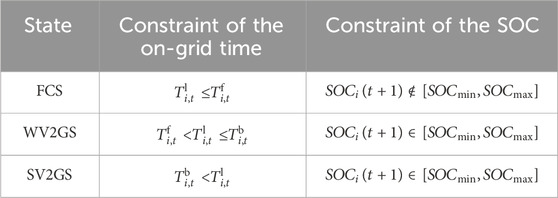
Table 1. EV state grouping constraints under different control states.
As shown in Equation 16,
4.1.3 Adjustable capacity quantification of the EV cluster
Based on the controllable domain model and the EV states, Figure 6 demonstrates the adjustable capacity of the EVs in the controllable states, namely the SV2GS and WV2GS, as shown in Equations 17, 18. The left side of the vertical axis in the figure is the adjustable capacity provided by the EVs in the SV2GS, while the right side is the adjustable capacity provided by the EVs in the WV2GS.
where

Figure 6. Controllable capacities of the EVs in different states.
The EVs calculate the total upward adjustable capacity
where Ntco is the total number of EVs that are in a controllable state during period t.
4.2 Power allocation strategy based on state grouping and priority lists
4.2.1 Establishing FM priority parameters
Based on the EV FM capability, charging urgency, and EV credibility information, the FM prioritization parameter
where ρi is the credibility parameter; αi,t is the FM capability parameter that describes the completion of the charging demand for the ith EV during period t, as shown in Equation 22;
EVs with large values of αi,t have large relative capacities and are close to meeting the charging requirements. Therefore, such EVs have strong upward FM capabilities and can be prioritized to reduce the charging power or even reverse discharging when participating in upward FM. On the contrary, for smaller values of αi,t, the EV capacities are smaller, and the upward FM capability is weaker while the downward FM capability is stronger. Therefore, when participating in downward FM, such EVs can be prioritized to increase their charging power with small values of αi,t.
where Nall is the total number of EVs.
4.2.2 Power allocation strategy
After receiving the FM task
where ck is the number of the kth EVs in Lupt; dh is the number of the hth EVs in Ldownt.
The EV cluster determines the participating EVs and FM capacity based on the FM priority list, status grouping, and FM tasks.
1)
When
where
When
2)
When
where
When
5 Cooperative FM task assignment strategy considering source–load uncertainty
5.1 Cooperative FM task assignment strategy
To compensate for the intermittency and uncertainty when WTGs are involved in FM, a cooperative FM task assignment strategy is proposed for WTGs and EVs based on the urgency of EV charging and the economy of load reduction operations for the WTGs, considering the uncertainties of the two resources; this allows a reasonable allocation of the FM tasks while avoiding overuse of a single resource to improve the frequency stability of the system. The assignment strategy is based on the following principles:
1) Because EVs have transportation characteristics, their travel requirements must be met when participating in the FM service. When the power grid needs downward FM, EVs are preferred for increasing the charging power to meet the FM requirements.
2) WTGs in the load reduction operation state can affect economic efficiency; therefore, the power grid needs upward FM, and WTGs are preferred for increasing the active power output to meet the FM requirements.
The power grid dispatch center assigns FM tasks based on the adjustable capacities reported by the EVs and WTGs in accordance with the above principles, as explained below.
1) If
① When
② When
③ When
2) If
① When
② When
③ When
5.2 Control flow of the cooperative FM strategy
The detailed processes involving the participation of the EVs and WTGs in the FM service of the power grid are described below. The cooperative FM strategy is shown in Figure 7. First, the WTGs determine the wind speed interval by considering the wind speed prediction errors, and the upward and downward adjustable capacities of the WTGs are determined based on the load reduction operation strategy when the wind speed is in the load reduction zone. At the same time, the EVs are connected to the power grid based on the daily driving patterns, and the EV cluster groups the EVs based on their SOCs and charging urgencies before determining their upward and downward adjustable capacities based on the state grouping.
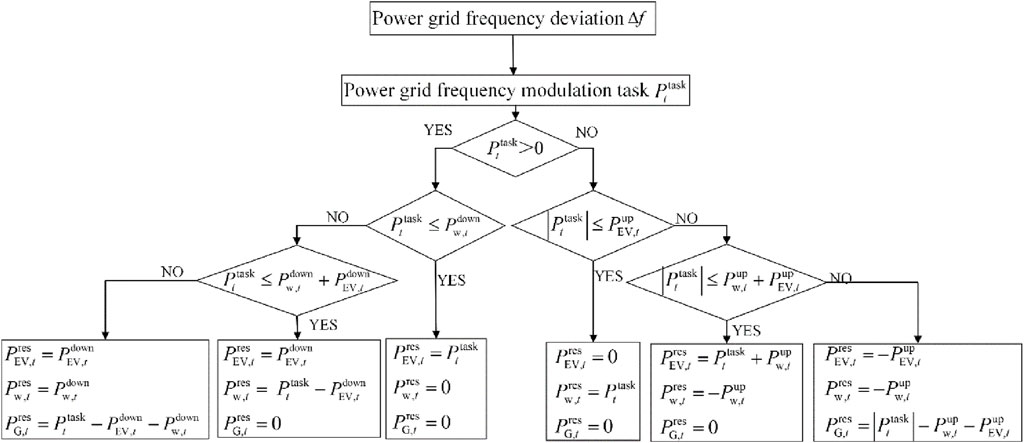
Figure 7. Control flow of the cooperative FM strategy.
Then, the power grid dispatch center assigns FM tasks to the EVs and WTGs in accordance with the cooperative FM task assignment strategy based on the power grid frequency deviation and the reported adjustable capacities. When the adjustable capacities of the two cannot meet the FM requirements, the remaining FM tasks are accomplished by the thermal power units. After determining their respective FM tasks, the EVs and WTGs adjust their active power as outlined in Sections 3, 4 to participate in the FM service of the power grid.
6 Case study
6.1 Control flow of the cooperative FM strategy
To verify the effectiveness of the cooperative FM strategy considering the source–load uncertainty, a power system FM model including an EV and a wind turbine is built based on prior works (Li et al., 2019; Deng et al., 2022); the relevant parameters of the power system and EV model are as detailed in the literature (Li et al., 2019; Deng et al., 2022), in addition to those of the WTGs and the response time constant. The system model diagram is shown in Supplementary Appendix A4. Considering the load volatility and new energy generation, the unbalanced power of the system is simulated based on the white noise model (Shinji et al., 2008), as shown in Supplementary Appendix A5. The relevant parameters of the WTGs are shown in Supplementary Appendix B1, while the wind speeds of the WTGs are shown in Supplementary Appendix A6. Based on the proposed method of dividing the wind speed zones, the time periods for each of the wind speed zones are shown in Supplementary Appendix B2.
6.2 Result analysis of WTGs participating in FM considering wind speed prediction errors
Since the impact of wind speed errors on FM has not been considered in the current research, the following two scenarios are established for comparative analysis to verify the impact on FM capacity prediction and FM effect:
Scenario 1: EVs do not participate in FM, while the WTGs participate in FM based on the proposed load reduction FM strategy without considering the uncertainties of wind speed prediction errors. If the adjustable capacity of the DFIGs is not enough to satisfy power grid FM requirements, the remaining FM tasks are accomplished by the thermal power units.
Scenario 2: EVs do not participate in FM, while the WTGs participate in FM based on the proposed load reduction FM strategy considering wind speed prediction errors. If the adjustable capacity of the WTGs is not enough to meet the power grid FM requirements, the remaining FM tasks are accomplished by the thermal power units.
Figure 8 shows the adjustable capacities of Scenario 1, Scenario 2, and the actual wind speed. The upward adjustable capacity is positive, whereas the downward adjustable capacity is negative. It can be seen in Scenario 1 that owing to the influence of the wind speed prediction errors, the predicted adjustable capacity of the WTGs is significantly higher than the actual adjustable capacity during 11:49–15:37 and 19:40–21:20. If the power grid dispatch center assigns FM tasks based on the predicted adjustable capacity during these periods, the FM tasks of the WTGs may exceed the FM capacity and fail to satisfy the FM requirements. The predicted adjustable capacity is significantly lower than the actual adjustable capacity during 18:14–19:12, which may result in the wastage of FM resources.
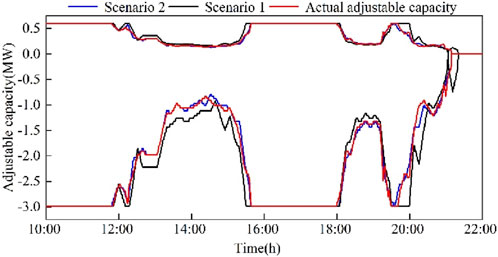
Figure 8. Comparison of the controllable capacity between Scenario 1 and Scenario 2.
In Scenario 2, the predicted wind speed is corrected by considering the wind speed prediction errors to improve the accuracy of the wind speed prediction, where the predicted adjustable capacity of the WTGs is only slightly higher than the actual adjustable capacity during parts of the intervals 14:14–19:29, 18:30–19:41, and 20:08–20:30. The wind speed prediction errors can be used to predict the adjustable capacity of the WTGs more accurately than using the predicted wind speeds directly. According to the above analysis, considering the wind speed errors can improve the accuracy of FM capacity prediction by 9.27%.
The power deviations between the FM tasks and the actual FM outputs of the WTGs under different scenarios are compared and analyzed, as shown in Figure 9. Deviations greater than 0 indicate that the FM outputs of the WTGs are insufficient, whereas deviations less than 0 indicate that the FM outputs are too large. In Scenario 1, the FM output fails to meet the FM requirements during 12:21–15:34, 19:56–20:28, and 21:08–21:19. In particular, during 21:08–21:19, the FM output shows a maximum deviation of 0.54 MW. Compared with Scenario 1, insufficient FM output occurs in Scenario 2 only during a small interval, which proves that the proposed load reduction FM strategy of the WTGs considering wind speed prediction errors can effectively participate in the FM service of the power grid while improving the quality of the power system frequency.
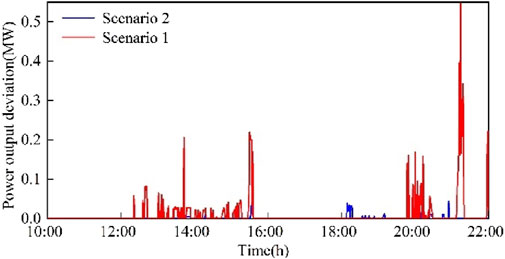
Figure 9. Power deviations between the FM tasks and actual FM outputs of the wind turbine generators (WTGs) under different scenarios.
6.3 Result analysis of the proposed cooperative FM strategy
To verify the effectiveness of the cooperative FM strategy, Scenario 3 was established, in which the EVs and WTGs participated in FM; when the adjustable capacity of the two resources cannot satisfy the FM demand of the grid, the remaining FM tasks are accomplished by the thermal power units. The FM achieved by the WTGs and EVs is shown in Figure 10. It can be seen that the total adjustable capacity of the EVs and WTGs can fulfill the FM tasks.
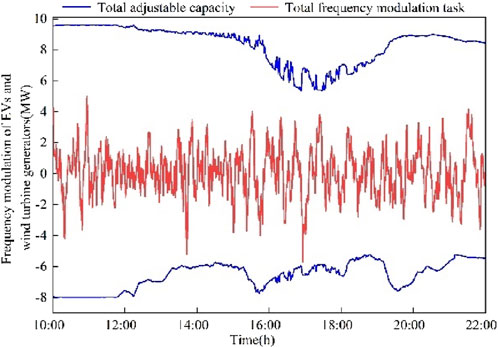
Figure 10. FM task components of the EVs and WTGs.
Figure 11 shows the participation of EVs and WTGs in FM. Considering the charging urgency when EVs participate in FM, the downward FM tasks of the EVs are more than the upward FM tasks. During 16:54–17:03, the downward adjustable capacity of the EVs cannot meet the power grid FM demand, and the remaining FM tasks are accomplished by the WTGs. These WTGs do not participate in the downward FM tasks in the other periods. From the figure, it can be seen that when the WTGs participate in FM, the main FM task is upward FM. Owing to the limitation of the adjustable capacity, the upward FM demand of the power grid cannot be fully satisfied, and the remaining upward FM task is accomplished by the EVs. Specifically, during 20:00–22:00, the upward FM capacity of the WTGs is small or even zero, and the upward FM task of the power grid is almost entirely handled by the EVs.
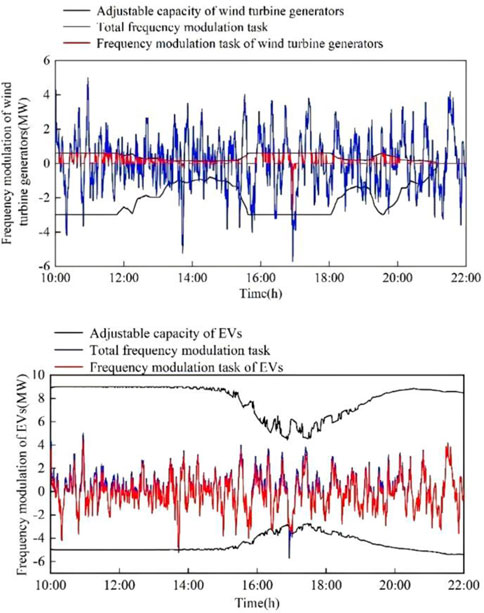
Figure 11. EV or WTG FM under Scenario 3.
Figure 12 demonstrates the frequency deviations of the WTGs and EVs participating in FM. From the figure, it is seen that the frequency deviations of Scenario 2 and Scenario 3 are close to each other during 10:42–12:40 and 16:51–19:06. This is due to the fact that in these periods, the WTGs are in the high load shedding area, and their adjustable capacity is larger while the FM task is smaller. However, in the other periods, the frequency deviations of Scenario 2 are higher than those of Scenario 3. This is because they are limited by the wind speed, and the turbines are unable to provide more adjustable capacity as the FM task is larger. Therefore, the WTGs cannot meet the system FM requirements, and the thermal power units are required to fulfill the remaining FM task, leading to increased frequency deviations owing to the slower ramp rates of the thermal power units. In Scenario 3, the adjustable capacities of the EVs and WTGs are complementary and can respond quickly to the FM task. Therefore, the FM effects of Scenario 3 are better than those of Scenario 2. As a result, the proposed collaborative FM strategy can effectively compensate for the intermittent and uncertain characteristics of the WTG FM output to improve the FM effects.
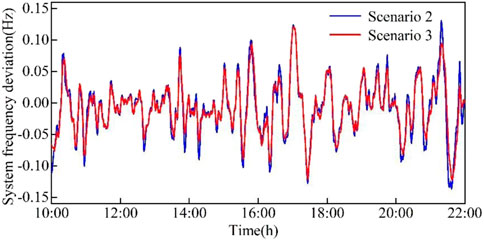
Figure 12. Comparison of FM effects between Scenario 2 and Scenario 3.
6.4 Comparative analysis of the proposed cooperative FM strategy
To verify the advantages and rationality of the FM task allocation strategy considering the urgency of EV charging and wind speeds, Scenario 4 was established. In Scenario 4, the adjustable capacities of the EVs and WTGs are not taken into account, and the power grid dispatch center directly allocates the FM tasks to the EVs and WTGs equally in a ratio of 5:5. If the EVs or WTGs are unable to satisfy the FM requirements, the thermal power units complete the remaining FM tasks. The FM tasks and other conditions in this scenario are the same as those of Scenario 3.
The FM situation of the EVs and WTGs in Scenario 4 is shown in Figure 13. If the FM tasks are assigned in a ratio of 5:5, the EVs can complete the assigned FM tasks. Therefore, the FM output curve of the EVs coincides with the FM task curve. However, the limited upward adjustable capacity of the WTGs prevents the completion of the upward FM tasks of the system, so it is necessary for the thermal power units to increase the FM output. The WTGs are able to complete the downward FM tasks assigned by the dispatch center, except during a part of 13:34–15:23 and the period when the wind speed is in the non-load reduction zone.
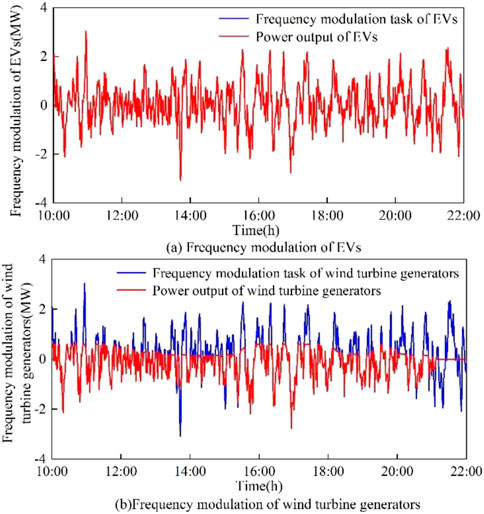
Figure 13. Frequency modulations of (A) EVs and (B) WTGs under Scenario 4.
Figure 14 illustrates the frequency deviation between Scenario 3 and Scenario 4. It can be seen that the FM effects of Scenario 3 are better than those of Scenario 4. The main reason for this is that the upward adjustable capacity provided by the WTGs is smaller than the downward adjustable capacity, and the limitations of the adjustable capacity and wind speed on the FM capabilities are ignored when assigning FM tasks based on the fixed ratio, resulting in the FM task assignment exceeding the FM capacity. The adjustable capacity provided by the EVs is larger than that provided by the WTGs. Therefore, they are able to complete the assigned FM tasks, but the EVs may not be able to complete the assigned FM tasks during the period when the EVs are off-grid if these tasks are increased. The FM task assignment strategy in Scenario 3 combines the characteristics of EVs and WTGs. Therefore, during upward FM, if the adjustable capacity provided by the WTGs cannot satisfy the upward FM requirements, the remaining FM tasks are allocated to EVs based on the reported adjustable capacity. The same is true for downward FM. The cooperative FM strategy adopted in Scenario 3 does not waste FM capacity or assign too many FM tasks when there is insufficient FM capacity. It can also reasonably utilize the FM resources on both the source and load sides while meeting the FM requirements to maintain the frequency stability of the system.
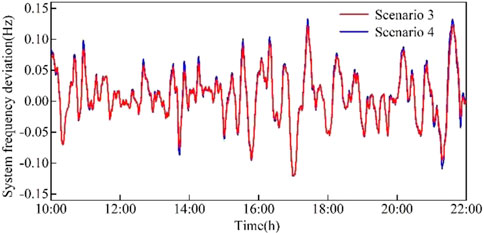
Figure 14. Comparison of FM effects between Scenario 3 and Scenario 4.
7 Conclusion
A cooperative FM strategy considering source–load uncertainty was proposed in this work. Here, the power grid dispatch center determines the FM required based on the urgency of EV charging and the economy of the WTG load reduction operations. Through the proposed WTG load reduction FM strategy, the WTGs can consider the wind speed prediction errors, and the rotor speed and pitch angle control are combined to operate the WTGs in the load reduction state. The FM tasks assigned by combining the rotor speed and pitch angle controls are in response to the corrected wind speed and FM tasks. By analyzing the simulation results, the following conclusions can be drawn:
1) Considering the wind speed prediction errors can improve the accuracy of quantifying the adjustable capacity of the WTGs and improve the FM effects when the WTGs participate in the FM service. Compared to the case where the wind speed errors are not considered, the FM capacity prediction can be improved by 9.27% when the errors are considered.
2) The combined rotor speed and pitch angle control of the WTG load reduction FM strategy improves the system frequency stability in the load reduction zone under continuously varying wind speeds.
3) The cooperative FM task allocation strategy enables the EVs and WTGs to complement each other’s strengths , reducing the impacts of the intermittency and uncertainty of the WTG FM outputs on the system frequency; accordingly, the FM effect is 6.05% higher than that when using a fixed allocation ratio.
Data availability statement
The datasets presented in this study can be found in online repositories. The names of the repositories and accession numbers can be found in the article/Supplementary Material.
Author contributions
XD: Writing–original draft, Writing–review and editing. SW: Writing–original draft, Writing–review and editing. DA: Writing–original draft, Writing–review and editing. YM: Writing–original draft, Writing–review and editing. XY: Writing–original draft, Writing–review and editing.
Funding
The authors declare that financial support was received for the research, authorship, and/or publication of this article. This work was supported by the Chinese Postdoctoral Science Foundation (no. 2024M750716).
Conflict of interest
The authors declare that the research was conducted in the absence of any commercial or financial relationships that could be construed as a potential conflict of interest.
Publisher’s note
All claims expressed in this article are solely those of the authors and do not necessarily represent those of their affiliated organizations, or those of the publisher, the editors and the reviewers. Any product that may be evaluated in this article, or claim that may be made by its manufacturer, is not guaranteed or endorsed by the publisher.
Supplementary material
The Supplementary Material for this article can be found online at: https://www.frontiersin.org/articles/10.3389/fenrg.2024.1497430/full#supplementary-material
References
Bonfiglio, A., Invernizzi, M., Labella, A., and Procopio, R. (2019). Design and implementation of a variable synthetic inertia controller for wind turbine generators. IeeeTransaction Power Syst. 34 (1), 754–764. doi:10.1109/tpwrs.2018.2865958
Deng, Q., Zhang, Y., Li, T., Sun, T., and Yue, H. (2022). Hierarchical distributed frequency regulation strategy of electric vehicle cluster considering demand charging load optimization. IEEE Trans. Industry Appl. 58 (1), 720–731. doi:10.1109/TIA.2021.3122392
Dreidy, M., Mokhlis, H., and Mekhilef, S. (2017). Inertia response and frequency control techniques for renewable energy sources: a review. Renew. and Sustain. Energy Rev. 69, 144–155. doi:10.1016/j.rser.2016.11.170
Hui, H., Ding, Y., Song, Y., and Rahman, S. (2019). Modeling and control of flexibleloads for frequency regulation services considering compensation of communication latency and detection error. Appl. Energy 250, 161–174. doi:10.1016/j.apenergy.2019.04.191
Lee, J., Muljadi, E., Sorensen, P., and Kang, Y. C. (2016). Releasable kinetic energy-based inertial control of a DFIG wind power plant. Ieee Trans. Sustain. Energy 7 (1), 279–288. doi:10.1109/tste.2015.2493165
Li, C., Zhou, Y., and Xu, Z. (2019). System Frequency control strategy based on Energy Efficiency power plant for electric Vehicles. J. Electr. Power Syst. Automation 31, 68–74.
Li, Y. (2019). “Coordinated secondary frequency regulation strategy of electric vehicles and wind/photovoltaic generation in micro-grid,”. China (Chongqing): Chongqing University. dissertation/master's thesis.
Li, Y., Xu, Z., Zhang, J., and Wong, K. P. (2018). Variable gain control scheme of DFIG-based wind farm for over frequency support. Renew. Energy 120, 379–391. doi:10.1016/j.renene.2017.11.055
Liu, H., Peng, X., Zhang, C., and Zhang, S. (2021). Overview of wind power participating in frequency regulation control strategy for power system. Electr. Power Autom. Equip. 41 (11), 81–92. doi:10.16081/j.epae.202107029
Liu, J., Yao, Q., Liu, Y., and Hu, Y. (2017). Wind farm primary frequency control strategy based on wind and thermal power joint control. Proc. Chin. Soc. Electr. Eng. 37 (12), 3462–3469. doi:10.13334/j.0258-8013.pcsee.161663
Liu, S., Xie, X., and Yang, L. (2020). Analysis, modeling and implementation of a switching Bi-directional buck-boost converter based on electric vehicle hybrid energy storage for V2G system. Ieee Access 8, 65868–65879. doi:10.1109/access.2020.2985772
Luo, Z., Hu, Z., Song, Y., Xu, Z., and Lu, H. (2013). Optimal coordination of plug-in electric vehicles in power grids with cost-benefit analysis-Part I: enabling techniques. IEEE Trans. Power Syst. 28 (4), 3546–3555. doi:10.1109/TPWRS.2013.2262318
Lyu, X., Jia, Y., and Dong, Z. (2021). Adaptive frequency responsive control for wind farm considering wake interaction. J. Mod. Power Syst. Clean Energy 9 (5), 1066–1075. doi:10.35833/mpce.2020.000237
Meng, J., Mu, Y., Jia, H., Wu, J., Yu, X., and Qu, B. (2016). Dynamic frequency response from electric vehicles considering travelling behavior in the Great Britain power system. Appl. Energy 162, 966–979. doi:10.1016/j.apenergy.2015.10.159
Pahasa, J., and Ngamroo, I. (2016). Coordinated control of wind turbine blade pitch angle and PHEVs using MPCs for load frequency control of microgrid. Ieee Syst. J. 10 (1), 97–105. doi:10.1109/jsyst.2014.2313810
Ren, Y., An, Z., and Li, J. (2011). Flexible grid connection and control of doubly fed wind turbines. China: Mechanical Industry Press.
Shinji, T., Sekine, T., Akisawa, A., Kashiwagi, T., Fujita, G., and Matsubara, M. (2008). Reduction of power fluctuation by distributed generation in micro grid. Electr. Eng. Jpn. 163 (2), 22–29. doi:10.1002/eej.20462
Tang, J., Su, J., Yao, Y., Tang, Q., Wu, Y., and Yue, G. (2022). Technical analysis ofpower system frequency regulation by wind power for new power system. Therm. Power Gener. 51 (7), 1–8. doi:10.19666/j.rlfd.202202027
Teng, X., Tan, C., Chang, L., Zhang, X., and Cao, R. (2023). Review and prospect of researchon active power and frequency control in power system with high proportion of renewable energy. Automation Electr. Power Syst. 47 (15), 12–35. doi:10.7500/AEPS20221128005
Wang, D., Zhang, C., Li, J., Zhu, L., Zhou, B., Zhou, Q., et al. (2024). A novel interval power flow method based on hybrid box-ellipsoid uncertain sets. IEEE Trans. Power Syst. 39 (4), 6111–6114. doi:10.1109/TPWRS.2024.3391921
Wu, Y.-K., Yang, W.-H., Hu, Y.-L., and Phan, Q. D. (2019). Frequency regulation at aWind farm using time-varying inertia and droop controls. Ieee Trans. Industry Appl. 55 (1), 213–224. doi:10.1109/tia.2018.2868644
Zhang, B., Wang, Y., Guo, Y., Xu, W., Jiang, X., and Ge, C. (2024a). A combined wind-storage primary frequency regulation method considering low-speed shaft fatigue loads in wind turbine. Electr. Power Syst. Res. 235, 110891. doi:10.1016/j.epsr.2024.110891
Zhang, W., Zhang, C., Zhou, Q., Li, J. Y., Zhu, L. P., Cao, S. R., et al. (2024b). Spatial-temporal resilience assessment of distribution systems under typhoon coupled with rainstorm events. IEEE Trans. Industrial Inf. 21, 188–197. doi:10.1109/TII.2024.3450079
Zhang, X., Qin, S., Chen, C., Zhang, Y., Hao, S., and Wu, Q. (2024c). Wind turbine storage joint frequency modulation control strategy considering the balance of energy storage charge and discharge. Power Syst. Technol. 48 (05), 1938–1946. doi:10.13335/j.1000-3673.pst.2023.0907
Zhang, C., Liu, L., Cheng, H., Lu, J., Zhang, J., and Li, G. (2022a). Review and prospects of planning and operation optimization for electrical power systems considering frequency security. Power Syst. Technol. 46 (1), 250–264. doi:10.13335/j.1000-3673.pst.2021.0844
Zhang, Q., Wu, X., Huang, Y., and Li, C. (2022b). A review of key issues in electric vehicle and power grid interaction. Chin. J. Automot. Eng. 12 (1), 411–430. doi:10.3969/j.issn.2095-1469.2022.04.07
Zhang, Q., Li, Y., Li, C., Ding, Z., and Xie, W. (2019). Coordinated secondary frequency regulation strategy of doubly-fed induction generator and electric vehicle. Appl. Sciences-Basel 9 (14), 2815. doi:10.3390/app9142815
Zhang, X., Qin, S., Zhang, Y., Hao, S., Wu, Q., and Zhang, J. (2023). Wind turbine and storage joint frequency modulation control strategy considering energy storage state of charge. High. Volt. Eng. 49 (10), 4120–4130. doi:10.13336/j.1003-6520.hve.20230701
Zhang, Z. S., Sun, Y. Z., Lin, J., and Li, G. J. (2012). Coordinated frequency regulation by doubly fed induction generator-based wind power plants. Iet Renew. Power Gener. 6 (1), 38–47. doi:10.1049/iet-rpg.2010.0208
Zhong, J., He, L., Li, C., Cao, Y., Wang, J., Fang, B., et al. (2014). Coordinated control for large-scale EV charging facilities and energy storage devices participating in frequency regulation. Appl. Energy 123, 253–262. doi:10.1016/j.apenergy.2014.02.074
Keywords: source–load uncertainty, electric vehicle, wind turbine generator, frequency modulation, wind power reserve
Citation: Dong X, Wang S, Ai D, Ma Y and Yu X (2025) Coordinated frequency modulation strategy considering source–load uncertainty. Front. Energy Res. 12:1497430. doi: 10.3389/fenrg.2024.1497430
Received: 17 September 2024; Accepted: 27 December 2024;
Published: 05 February 2025.
Edited by:
Ning Qi, Columbia University, United StatesReviewed by:
Cong Zhang, Hunan University, ChinaNing Tong, Guangdong University of Technology, China
Copyright © 2025 Dong, Wang, Ai, Ma and Yu. This is an open-access article distributed under the terms of the Creative Commons Attribution License (CC BY). The use, distribution or reproduction in other forums is permitted, provided the original author(s) and the copyright owner(s) are credited and that the original publication in this journal is cited, in accordance with accepted academic practice. No use, distribution or reproduction is permitted which does not comply with these terms.
*Correspondence: Xiaodan Yu, eXV4ZEB0anUuZWR1LmNu