 Chen Bingbing
 Liu Jiateng
95% of researchers rate our articles as excellent or good
Learn more about the work of our research integrity team to safeguard the quality of each article we publish.
Find out more
ORIGINAL RESEARCH article
Front. Energy Res. , 17 February 2025
Sec. Smart Grids
Volume 12 - 2024 | https://doi.org/10.3389/fenrg.2024.1496247
This article is part of the Research Topic Enhancing Resilience in Smart Grids: Cyber-Physical Systems Security, Simulations, and Adaptive Defense Strategies View all 19 articles
As the risk of extreme fault conditions to power supply reliability escalates, the importance of supply recovery within active distribution networks (ADNs) is exponentially increasing. However, the utilization of a single resource strategy is insufficient to fully exploit the supply recovery potential of the ADN’s diverse and flexible resources. Therefore, a flexible resource coordination supply recovery for ADN considering multiple demand responses is proposed. This strategy utilizes distributed generation (DG) and energy storage system (ESS) as distributed power supply units, and involves the operational flexibility of soft open points (SOPs) to couple DGs with ESSs. Meanwhile, the demand response consisting of transferable and interruptible loads is taken into account, with its load regulation capability harnessed to supply recovery. A supply recovery model is established to coordinate the flexibility of source, network, and demand sides, which is further transformed into a second-order cone programming (SOCP) model to enhance solution efficiency with accuracy preservation. Simulations conducted on a modified IEEE 33-node system validate the effectiveness of the proposed strategy in maximizing supply recovery.
In recent years, the concept of active distribution network (ADN) resilience has gained considerable attention, with supply recovery being identified as a pivotal feature that significantly contributes to enhancing system reliability (Yan and Li, 2020). Supply recovery is crucial for the safety of ADNs, especially in the context of the growing popularity of distributed generation (DG) (Dubey et al., 2019). Currently, using a single resource to meet recovery demands overlooks the benefits of multiple resource cooperative scheduling in maximizing supply recovery potential (Saberi et al., 2021).
Previous studies have investigated the supply recovery within the ADN. Zhang et al. (2021) put forward a two-stage stochastic optimization method proposed to enhance resilience and restore ADNs by considering the coordination of mobile resources, repair crews, DGs, and ESSs. Lei et al. (2023) utilize convex hull theory to construct the recovery strategy, the using of the new theory has advanced the recovery level. Zhang et al. (2021) refer to a mixed integer linear programming (MILP) based sequential restoration method in ADNs proposed by considering network reconfiguration and frequency dynamic constraints. Vita et al. (2023) prioritize power supply continuity from a critical load perspective, achieving a 100% restoration rate for critical loads. However, the existing body of literature, as previously discussed, predominantly concentrates on the refinement of optimization techniques and the exploitation of individual resources. This focus, while valuable in its own right, has inadvertently overlooked the critical aspect of integrating and harnessing the unique, inherent resources that are intrinsic to the ADN. The singular approach to resource management fails to capture the synergistic potential that emerges from the interplay of various resources within the ADN ecosystem. By not considering the composite nature of these resources, the literature has missed an opportunity to explore the complex dynamics that could lead to more efficient and effective energy management strategies. The integration of these resources is not merely an additive process but a transformative one, where the whole is greater than the sum of its parts.
Flexible resources such as energy storage systems (ESSs) and DGs are commonly utilized in ADN, while their roles can be varied in the context of supply recovery. Upon the network’s transition to islanded operation due to a fault, some nodes shift from PQ control mode to V/f mode to maintain voltage and frequency stability within the islanded region (Poudel and Dubey, 2018). In this process, alongside the controllable distributed power supply, the ESS contributes to supply recovery through its charging and discharging capabilities.
Resources like ESS and DG enhance ADN operation with considerable flexibility. However, the challenge lies in efficiently networking these resources to strengthen the supply recovery effect during extreme events. SOPs, a product of advanced power electronics, introduce a novel approach to enhance the flexibility of ADN topologies. SOPs offer two primary advantages over traditional tie lines: firstly, they enable precise real-time control of system power flow by adjusting the power output of the connected feeders; secondly, they mitigate the reverse power flow issues that arise due to the high penetration of DGs within the network (Cao et al., 2016). Mardanimajd et al. (2024) establishes an SOP-integrated flexible power flow management model, improving power flow optimization. Li et al. (2024) develops an optimization configuration model with SOP to facilitate coordinated complementarity between distribution network devices. To date, the application of SOPs to coordinate multiple flexible resources in supply recovery has not been extensively investigated, and the operational optimization functionalities of SOPs remain largely untapped (Zhao et al., 2024). As described in Zhang et al. (2024), SOPs utilized in extreme scenarios involving complete power loss in ADNs are lacked of consideration. Therefore, fully leveraging the advantages of SOPs and applying them to supply recovery is of substantial positive significance for enhancing the reliability and flexibility of the recovery process.
Additionally, the demand response is widely utilized as a flexible end-user resource on the demand side to enhance the scheduling effect. Liang et al. (2024); Mansouri et al. (2021); Melgar-Dominguez et al. (2020) offer a comprehensive analysis of the benefits and application environments of demand response, which plays a crucial role in enhancing economic efficiency. Liu et al. (2024) introduces demand response to an AC/DC Hybrid Distribution Network and establishes a comprehensive recovery strategy encompassing voltage source converter (VSC) control and demand response, ultimately achieving efficient recovery. Li et al. (2024) constructs demand response models for multi-energy systems and integrates them into recovery strategies. The analysis suggests that the integration of demand response can contribute positively to supply recovery.
Under extreme disasters, the efficient utilization of limited resources is crucial for achieving maximum supply recovery. Previous research has only focused on a subset of resources in the ADN, failing to fully exploit the potential for supply recovery from multiple flexible resources across the source, network, and load. Consequently, this paper proposes a flexible resource coordination supply recovery of an ADN considering multiple demand responses. This strategy alleviates the supply recovery burden through demand response mechanisms and connects the entire network’s resources with SOPs, enabling efficient cooperation and operation of diverse flexible resources such as ESSs and DGs within the network. It can effectively address the following scenarios: 1) The main grid loses power supply to the distribution system due to faults or other reasons; 2) Distribution network failures caused by severe weather conditions; 3) Grid collapses due to human factors. The major contributions of this paper are summarized as follows:
Multiple flexible resources in the source, network, and load sides are coordinated with SOP to improve the supply recovery effect. By leveraging SOP to enhance network topology flexibility, the barriers between the source, network, load, and storage resources are bridged, enabling the unified scheduling of a larger scale of flexible resources.
The integration of diverse demand responses into the supply recovery strategy is a pivotal step towards enhancing the recovery rate. By employing demand response, the strategy aims to bolster the flexibility of the demand side, which in turn substantially alleviates the strain on the power supply system. This is achieved through the judicious management of interruptible and transferable loads, ensuring that the system’s power supply is not overburdened. Through this optimized load management, the strategy facilitates the efficient allocation and use of the network’s limited resources, thereby maximizing the overall effectiveness of the supply recovery process.
The following chapters are the main work completed in this paper. Section 2 delineates the role of resources at each stage and establishes corresponding models for each. Section 3 develops a supply recovery model that orchestrates the operation of various resources across the source, network, load, storage, and power electronic device domains, and incorporates the control strategies for DGs, ESSs, and SOPs. Case studies are given in Section 4 to verify the effectiveness of the proposed method using a modified IEEE 33-node system. Section 5 concludes the paper with a discussion.
This paper delves into the supply recovery challenge, which is crucial for security, by formulating optimization strategies that harness the cooperative potential of ADN resources. It integrates demand response and multiple resources within the network to optimize supply recovery capabilities, aiming to maximize the supply recovery potential through a collaborative supply recovery model that respects operational constraints.
ADN sources are classified into controlled and uncontrolled categories based on their regulatory performance in power adjustment.
In contemporary ADNs, micro gas turbines are predominantly utilized as CDG. The operational constraints are typically formulated as follows:
where
NDG predominantly photovoltaic, represents a crucial clean energy technology characterized by substantial generation variability and timing dependence. The operational constraints are expressed as:
where
Achieving supply-demand balance within an isolated network through the scheduling of ESSs charging and discharging strategies, while comprehensively considering the losses and active/reactive characteristics. With the direction of power flow into the ADNs considered positive, the operational constraint of ESS can be depicted as:
where
SOPs, innovative power electronic devices installed at traditional contact switch positions, address the limitations of conventional switches in power regulation. By controlling power exchange between feeder sides, SOPs can alter the system’s current distribution, enhancing overall power system operation with optimized efficiency (Zhang et al., 2021). SOP devices mainly consist of three topological structures: back-to-back voltage source converters (B2B VSC), unified power flow controllers (UPFC), and static series synchronous compensators (SSSC) (Ebrahim et al., 2024). Among them, the B2B VSC stands for its ability to asynchronously connect AC lines, decoupling feeders via a unique DC capacitive link, which is why this form of SOP is primarily chosen for this article. Integration of the SOPs in an ADN is shown in Figure 1.
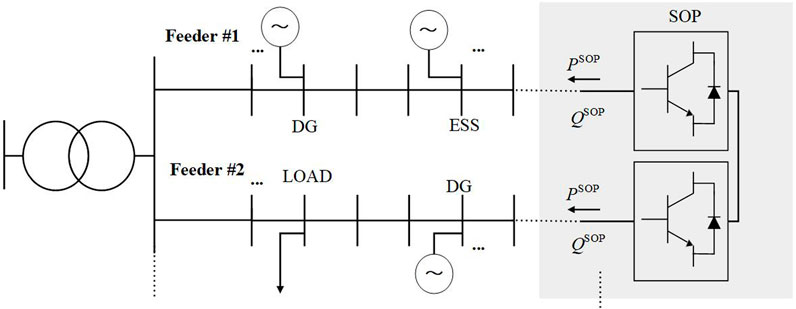
Figure 1. Integration of the SOPs in an ADN.
It is assumed that converters VSC1 and VSC2 are connected to node
where
Demand-side electrical loads can be categorized into price-responsive and incentive-responsive loads. Price-responsive loads can shift their electricity consumption based on price signals, allowing for load transfer during certain periods to respond to the time-of-use energy prices from the upper-level network, known as demand-side transferable loads (Wang et al., 2024). Incentive-responsive loads, on the contrary, are those that, through contractual agreements or other means, allow for interrupting some loads when necessary, classifying them as demand-side interruptible loads. The load engaged in demand response must adhere to the following constraints:
where
where
where
The sources of motivation for the two methods are different, hence how they affect demand response is also different, impacting the distribution of load from both temporal and spatial perspectives. By stimulating the transfer of transferable load through price incentives and achieving the interruption of some interruptible load pass incentives, both methods are carried out in parallel to respond to the load demand during the fault period. As shown in Formulas 9, 10, applying price-based demand response during the fault period only serves to shift the load and does not change the total electricity consumption during that period; yet, incentive-based demand response will lead to a reduction in electricity consumption.
This chapter is grounded in a radial ADN, accounting for the controllability of power sources, and involves the construction of the Distflow model for a selected branch’s operating state at time
where
As the distribution system evolves, the integration of numerous controllable units necessitates their outputs to be managed effectively, as Equations 15, 16.
where
The big-M method is incorporated into the model (Pineda et al., 2024). Equations 11–14 are further transformed into:
where M is a very large constant;
The ADN must adhere to radial operation constraints, as delineated below:
where
Compliance with the requisite safe operation constraints is mandatory:
where
Second-order cone programming (SOCP) represents a class of convex optimization problems, facilitating the efficient solution of a wide range of optimization design issues. The constraints outlined in this paper involve both integer and quadratic terms, conversion of this model into a SOCP formulation enables an efficient solution approach (Srirangarajan et al., 2008).
The new optimization variables are first introduced using permutations.
The transformation of Equation 20 yields a nonlinear constraint, which is relaxed into a second-order cone constraint as Equation 26, and subsequently converted to a standard second-order cone form, as presented in Equation 27.
Through the transformation, the model is transformed into a second-order cone programming problem that can be solved efficiently.
By applying second-order convex relaxation, Equations 1, 2 for CDG/NDG, Equations 3, 4 for ESS, and Equations 5, 6, 7, 8 for SOPs are converted into rotating cone constraints, streamlining the solution process.
To mitigate the impact of distribution network faults, this paper proposes to study a supply recovery strategy that leverages the synergy of multiple resources from the source, network, and load side. Based on the strategy, DG and ESS are considered as power generation units during the island operation of distribution networks. The significant role of the SOP in the flexible allocation of power flow in distribution networks is emphasized, and the flexible adjustment capability of demand response is taken into account to comprehensively enhance the effectiveness of supply recovery.
In order to allocate various resources reasonably, minimize unnecessary economic losses, and reduce the cost of recovery, the minimization of the total load lost after supply recovery is adopted as the objective function:
where
The obtained ADN supply recovery model based on second-order cone planning with multiple resource synergy is as follows:
To analyze the accuracy of the optimization results of this model, Equation 28 is used to calculate the relaxation error as follows:
If the relaxation error
The model is implemented in the YALMIP optimization toolbox with MATLAB R2023b and is solved by the Gurobi solver. The overall framework diagram for the recovery method coordinating ADNs of DGs, ESSs, and SOPs is shown in Figure 2.
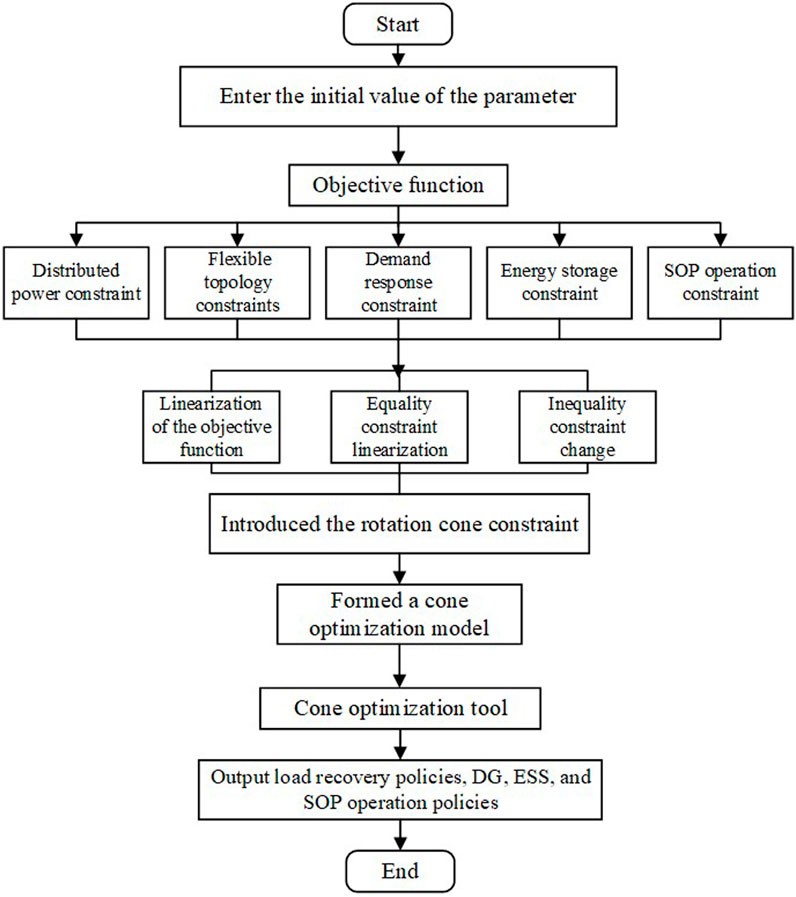
Figure 2. Overall framework diagram.
The modified IEEE 33-node system is chosen for testing to verify the strategy proposed in this paper. The load and branch impedance parameters of the standard IEEE 33-node system are shown in Supplementary Table S1, and the topology of the improved system structure is shown in Figure 2. It is assumed that all branches and loads can be controlled. The access locations of DGs, ESSs, and SOPs are shown in Table 1, Table 2, 3. Load and PV prediction curves are cited from the Reference Sobri et al., 2018.

Table 1. DG data details.
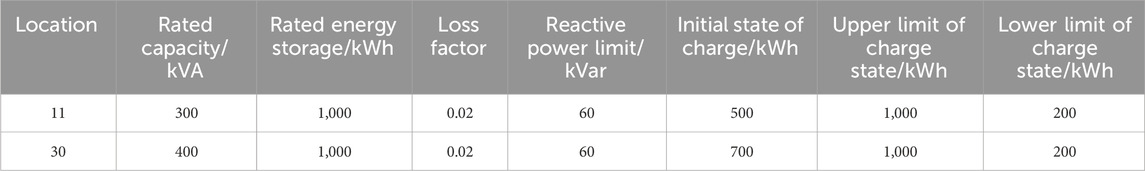
Table 2. ESS data details.

Table 3. SOP data details.
The paper postulates a failure scheme that branch between nodes 1 and 2 has a permanent three-phase fault at 6:00 a.m. lasting 4 h. The total power loss is quantified at 3715 kW. To assess the superiority of the proposed recovery strategy, the paper devises a series of resource synergy schemes.
Scheme Ⅰ: Supply recovery with DGs.
Scheme Ⅱ: Supply recovery under the cooperative participation of DGs and ESSs.
Scheme Ⅲ: Supply recovery with DGs and SOPs.
Scheme Ⅳ: Supply recovery with DGs and demand response.
Scheme Ⅴ: Supply recovery under the participation of multiple resource synergy in the ADN.
The results of supply recovery in all schemes are shown in Table 4, while the control modes of CDGs and ESSs are presented in Table 5, 6.
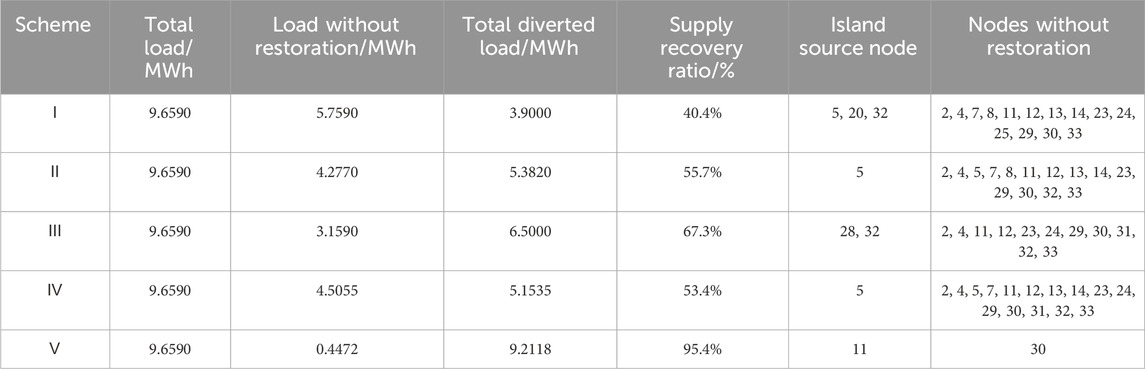
Table 4. Results of supply recovery in 5 schemes.

Table 5. CDG control mode.

Table 6. ESS control mode.
In Scheme Ⅰ, the source side integrates DGs as the primary energy source during post-fault distribution system operation. CDGs can be appointed as the source nodes when the system transitions to islanded operation mode following a failure. This source node employs V/f control to furnish voltage and frequency support for the island, facilitating the recovery of a portion of the load.
Figure 3 depicts the outcomes of the islanded operation under Scheme Ⅰ. The island is demarcated by light blue regions, with solid and hollow nodes representing restored and unrecovered load nodes. Green solid rectangles denote controllable units operating under the V/f control strategy as the island’s source nodes, while hollow rectangles indicate the application of P/Q control. Eventually, the system forms three islands, with nodes 20, 5, and 32 serving as V/f control nodes for islands ①-③, respectively. Each island fully utilizes distributed resources to achieve a recovery rate of 40.4% in Scheme Ⅰ.
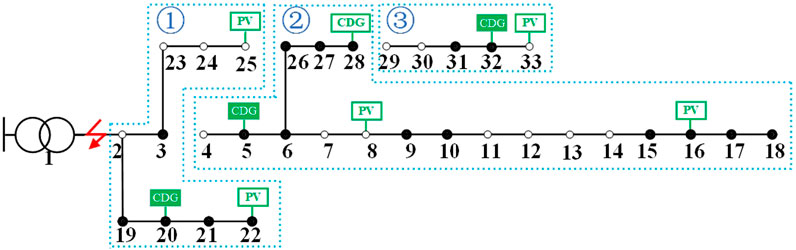
Figure 3. Islanding partition strategy in Scheme Ⅰ.
In contrast to Scheme Ⅰ, Scheme Ⅱ incorporates ESSs, and the operation of ESSs is shown in Figure 4. The initial states of ESS at nodes 11 and 31 before the fault were 500 kWh and 700 kWh, respectively. As indicated in Table 2, the ESS can be employed as the source node for the island, allowing the system to adapt the output power in accordance with actual demand. Through the precise control of active and reactive power, the capability for supply recovery is enhanced. Compared with Scheme Ⅰ, the recovery ratio increased by 15.3%.
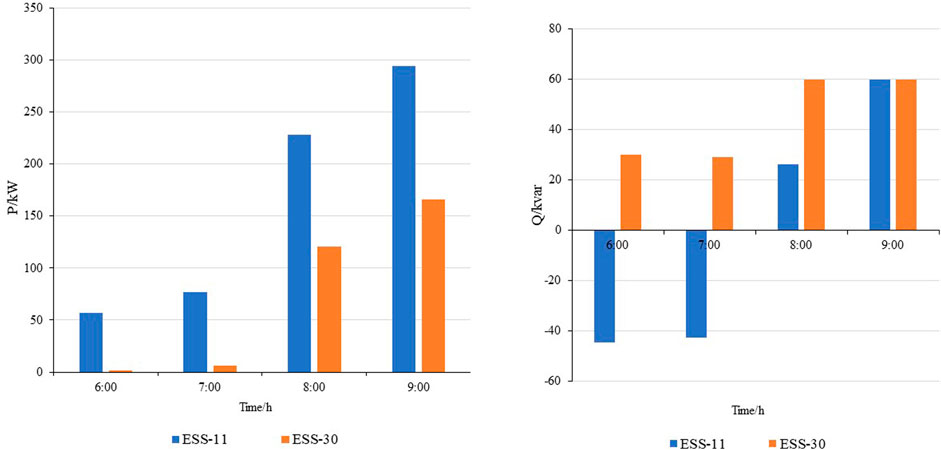
Figure 4. ESS charging and discharging power in Scheme Ⅱ. (A) Active power (B) Reactive power.
Figure 5 depicts the operational behaviors of SOPs in Scheme Ⅲ. The positive direction of power flow in SOPs is from SOP12 (18) to SOP22 (33). SOPs replace switch operations, enabling real-time, reliable power exchange within the isolated island area, which makes the system fully utilize DGs. The introduction of SOPs facilitates power distribution, with power flowing from nodes 12 and 18, redirecting the power flow from island ② to islands ① and ③, thereby establishing global connectivity based on Scheme Ⅰ. Comparing Scheme Ⅲ with Scheme Ⅰ, the recovery ratio increased by 26.9%.
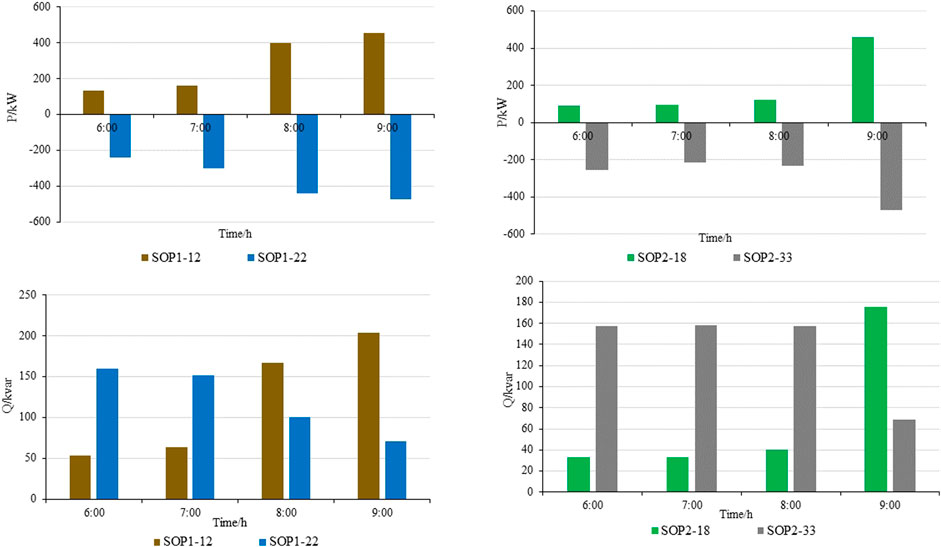
Figure 5. Operation strategies of SOP in Scheme III. (A) SOP1 active power (B) SOP2 active power (C) SOP1 reactive power (D) SOP2 reactive power.
In contrast to Scheme Ⅰ, Scheme Ⅳ incorporates a more sophisticated demand response strategy, engaging multiple mechanisms to manage power consumption. Table 7 provides specific details of interruptible and transferable loads in demand response, with interruptions and transfers indicated as positive values. During the fault periods, 0.386 MWh load was interrupted and 0.966 MWh load was transferred out, reducing the power supply burden on DGs. These actions not only mitigate the immediate pressure on the power supply but also facilitate a more profound examination of the network’s capacity to rebound from disruptions. By optimizing the power supply efficiency of the DGs through these demand response tactics, Scheme Ⅳ achieves a notable 13.0% enhancement in supply recovery efficiency over Scheme Ⅰ, underscoring the efficacy of a multifaceted demand response in bolstering the resilience and efficiency of the power network.
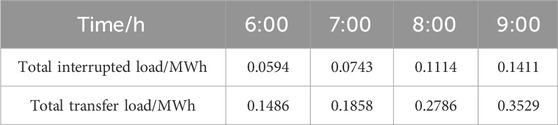
Table 7. Total demand response load in scheme Ⅳ.
Figure 6 illustrates the network island partitioning results after supply recovery in Scheme Ⅴ. Scheme Ⅴ integrates flexible resources from the source, network, and load sides, including DGs, ESSs, and multiple demand responses. Demand response alleviates the strain on the network’s power supply, efficiently utilizing limited resources, as shown in Figure 7 that compares the operation of SOPs between Scheme Ⅴ and Scheme Ⅰ. SOPs connect the network’s resources, creating a stable large network that fully leverages the flexibility of DG and ESS. Finally, under the coordinated operation of resources from the source, network, and load, the supply recovery capability is enhanced, and a recovery rate of 95.4% of the load is achieved.
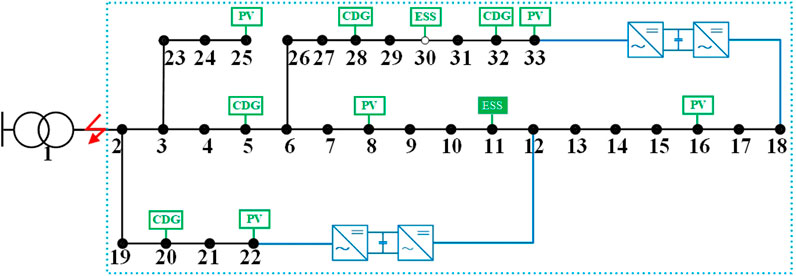
Figure 6. Islanding partition strategy in Scheme Ⅴ.
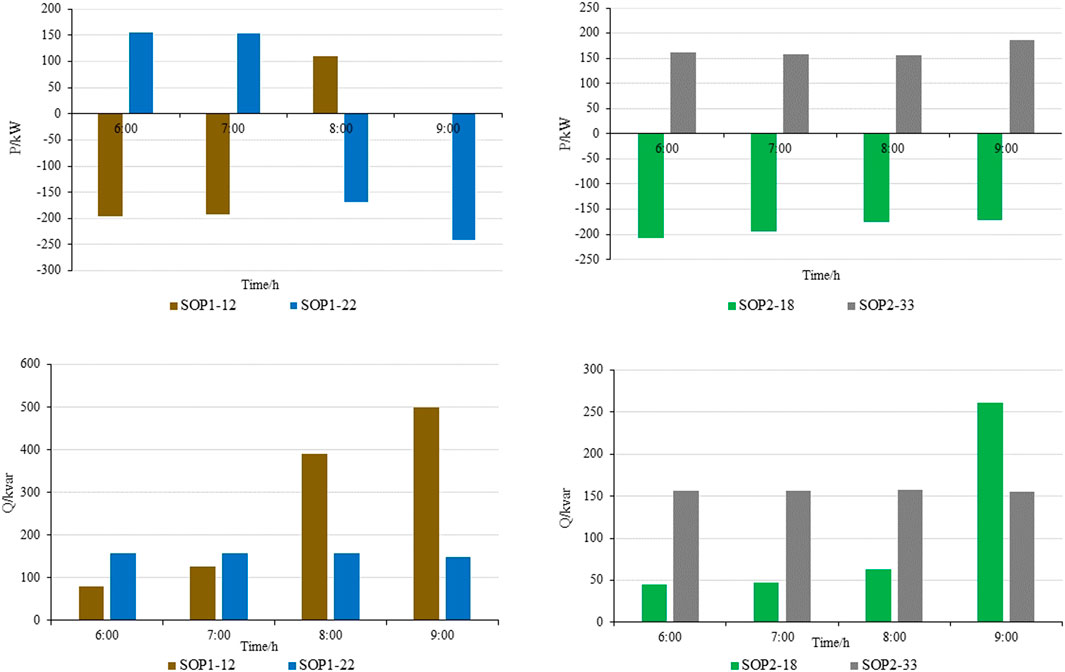
Figure 7. SOP reactive power in Scheme Ⅴ. (A) SOP1 active power (B) SOP2 active power (C) SOP1 reactive power (D) SOP2 reactive power.
The remaining power exchange and operational behaviors for resources under each scheme are detailed in Supplementary Figures.
As depicted in Figure 8, for Scheme 5, the relaxation error distribution is presented, with a maximum error of 1.25
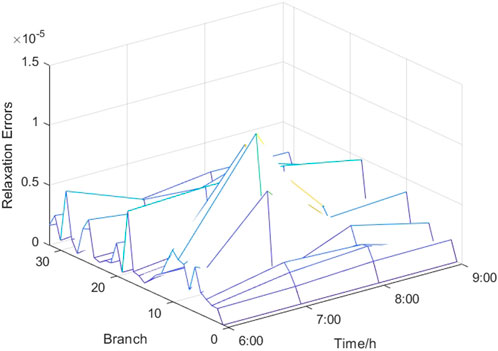
Figure 8. The distribution of relaxation errors for Scheme Ⅴ.
This paper presents an ADN supply recovery strategy that takes into account the synergy of flexible resources and multiple demand responses. The strategy leverages the load regulation capability of multiple demand responses to alleviate the burden on supply recovery. It also utilizes the topology flexibility further enhanced by SOPs to interconnect all the flexible resources in ADN, enhancing the potential of supply recovery. The proposed approach contributes to enhancing the resilience of ADNs and reducing losses during faults.
The IEEE 33-node simulation reveals that utilizing multiple flexible resources significantly aids supply recovery.
1) ESSs, SOPs, and multiple demand responses, when integrated with DGs, markedly enhance the supply recovery rate, achieving respective rates of 55.7%, 67.3%, and 53.4%.
2) The multi-flexible resource cooperation strategy integrated with the above resources guides demand response to alleviate the network’s energy consumption demand. Implementing SOPs integrates all ESSs and DGs within the network. This collaborative use of resources in ADN maximizes supply recovery, more than doubling the supply recovery rate to 95.4%, compared to recovery methods that depend solely on DGs.
3) The method described in this paper is effective in restoring power outages in distribution networks. It has a positive significance in resisting the loss of power supply coordination between the main and distribution networks caused by natural disasters, as well as the power outages in distribution networks caused by human factors.
The original contributions presented in the study are included in the article/Supplementary Material, further inquiries can be directed to the corresponding author.
CB: Writing–original draft, Writing–review and editing. LJ: Writing–review and editing. WH: Writing–review and editing. WH: Writing–review and editing. CY: Writing–review and editing.
The author(s) declare that financial support was received for the research, authorship, and/or publication of this article. This work was financially supported by the State Grid Jiangsu Electric Power Co., Ltd. Science and Technology Project (J2023102).
Authors CB, LJ, WH, and CY were employed by State Grid Nanjing Jiangbei New Area Power Supply Company.
The authors declare that this study received funding from State Grid Jiangsu Electric Power Co., Ltd. The funder had the following involvement in the study: the study design, data collection and analysis, decision to publish, or preparation of the manuscript.
All claims expressed in this article are solely those of the authors and do not necessarily represent those of their affiliated organizations, or those of the publisher, the editors and the reviewers. Any product that may be evaluated in this article, or claim that may be made by its manufacturer, is not guaranteed or endorsed by the publisher.
The Supplementary Material for this article can be found online at: https://www.frontiersin.org/articles/10.3389/fenrg.2024.1496247/full#supplementary-material
Cao, W., Wu, J., Jenkins, N., Wang, C., and Green, T. (2016). Operating principle of soft open points for electrical distribution network operation. Appl. Energy 164, 245–257. doi:10.1016/j.apenergy.2015.12.005
De Robbio, R. (2023). Micro gas turbine role in distributed generation with renewable energy sources. Energies 16 (2), 704. doi:10.3390/en16020704
Dubey, R., Popov, M., and Samantaray, S. R. (2019). Transient monitoring function-based islanding detection in power distribution network. IET Generation, Transm. and Distribution 13, 805–813. doi:10.1049/iet-gtd.2017.1941
Ebrahimi, H., Galvani, S., Talavat, V., and Farhadi-Kangarlu, M. (2024). A conditional value at risk based stochastic allocation of SOP in distribution networks. Electr. Power Syst. Res. 228, 110111. doi:10.1016/j.epsr.2023.110111
Fuad, K. S., Hafezi, H., Kauhaniemi, K., and Laaksonen, H. (2020). Soft open point in distribution networks. IEEE Access 8, 210550–210565. doi:10.1109/ACCESS.2020.3039552
Lei, C., Bu, S., Zhong, J., Chen, Q., and Wang, Q. (2023). Distribution network reconfiguration: a disjunctive convex hull approach. IEEE Trans. Power Syst. 38, 5926–5929. doi:10.1109/TPWRS.2023.3304132
Li, C., Tang, Z., Tang, J., Yao, Y., and Liu, Y. (2024). Load recovery strategy for integrated electricity-water-gas energy system based on integrated demand response under extreme disasters. High. Volt. Eng. 50, 1403–1415. doi:10.13336/j.1003-6520.hve.20231764
Li, S., Li, Z., Shahidehpour, M., Huang, W., and Zheng, J. (2024). Dispatchable region for distributed renewable energy generation in reconfigurable AC–DC distribution networks with soft open points. Appl. Energy 371, 123704. doi:10.1016/j.apenergy.2024.123704
Liang, K., Wang, H., Pozo, D., and Terzija, V. (2024). Power system restoration with large renewable Penetration: state-of-the-Art and future trends. Int. J. Electr. Power and Energy Syst. 155, 109494. doi:10.1016/j.ijepes.2023.109494
Liu, Q., Zhu, W., and Ma, T. (2024). Fault recovery of AC/DC Hybrid distribution network considering load demand response and VSC control mode. Mod. Electr. Power, 1–12. doi:10.19725/j.cnki.1007-2322.2023.0187
Mansouri, S. A., Ahmarinejad, A., Javadi, M. S., Nezhad, A. E., Shafie-Khah, M., and Catalão, J. P. (2021) “Demand response role for enhancing the flexibility of local energy systems,” in Distributed energy resources in local integrated energy systems, 279–313. doi:10.1016/B978-0-12-823899-8.00011-X
Mardanimajd, K., Karimi, S., and Anvari-Moghaddam, A. (2024). Voltage stability improvement in distribution networks by using soft open points. Int. J. Electr. Power and Energy Syst. 155, 109582. doi:10.1016/j.ijepes.2023.109582
Melgar-Dominguez, O. D., Pourakbari-Kasmaei, M., Lehtonen, M., and Mantovani, J. R. S. (2020). An economic-environmental asset planning in electric distribution networks considering carbon emission trading and demand response. Electr. power Syst. Res. 181, 106202. doi:10.1016/j.epsr.2020.106202
Pineda, S., Morales, J. M., Porras, Á., and Domínguez, C. (2024). Tight big-Ms for optimal transmission switching. Electr. Power Syst. Res. 234, 110620. doi:10.1016/j.epsr.2024.110620
Poudel, S., and Dubey, A. (2018). Critical load restoration using distributed energy resources for resilient power distribution system. IEEE Trans. Power Syst. 34, 52–63. doi:10.1109/TPWRS.2018.2860256
Saberi, R., Falaghi, H., Esmaeeli, M., and Ramezani, M. (2021). A two-stage approach to enhance distribution network resilience against natural disasters. J. Energy Manag. Technol. 5, 53–63. doi:10.22109/jemt.2020.214207.1221
Sobri, S., Koohi-Kamali, S., and Rahim, N. A. (2018). Solar photovoltaic generation forecasting methods: a review. Energy Convers. Manag. 156, 459–497. doi:10.1016/j.enconman.2017.11.019
Srirangarajan, S., Tewfik, A. H., and Luo, Z.-Q. (2008). Distributed sensor network localization using SOCP relaxation. IEEE Trans. Wirel. Commun. 7, 4886–4895. doi:10.1109/T-WC.2008.070241
Vita, V., Fotis, G., Pavlatos, C., and Mladenov, V. (2023). A new restoration strategy in microgrids after a blackout with priority in critical loads. Sustainability 15, 1974. doi:10.3390/su15031974
Wang, Y., Dong, P., Xu, M., Li, Y., Zhou, D., and Liu, X. (2024). Research on collaborative operation optimization of multi-energy stations in regional integrated energy system considering joint demand response. IJEPES 155, 109507. doi:10.1016/j.ijepes.2023.109507
Yan, X., and Li, R. (2020). Flexible coordination optimization scheduling of active distribution network with smart load. IEEE Access 8, 59145–59157. doi:10.1109/ACCESS.2020.2982692
Zhang, B., Liu, C., Lin, Z., Yang, L., Gao, Q., and Xu, H. (2021). Distribution network reconfiguration with high penetration of renewable energy considering demand response and soft open point. Automation Electr. Power Syst. 45, 86–94. doi:10.7500/AEPS20190930004
Zhang, Q., Ma, Z., Zhu, Y., and Wang, Z. (2021). A two-level simulation-assisted sequential distribution system restoration model with frequency dynamics constraints. IEEE Trans. Smart Grid 12 (5), 3835–3846. doi:10.1109/TSG.2021.3088006
Zhang, Q., Wang, Z., Ma, S., and Arif, A. (2021). Stochastic pre-event preparation for enhancing resilience of distribution systems. Renew. Sustain. Energy Rev. 152, 111636. doi:10.1016/j.rser.2021.111636
Zhang, W., Zhang, C., Li, J., Cao, S., Wang, D., Yang, H., et al. (2024). Resilience-oriented comparative study of SOP-based service restoration in distribution systems. Electr. Power Syst. Res. 228, 110050. doi:10.1016/j.epsr.2023.110050
Keywords: supply recovery, distributed generation, energy storage system, multiple demand response, soft open point, flexible-resource collaboration
Citation: Bingbing C, Jiateng L, Haotian W, Haiwei W and Yunfan C (2025) Flexible-resource coordination supply recovery of active distribution network considering multiple demand responses. Front. Energy Res. 12:1496247. doi: 10.3389/fenrg.2024.1496247
Received: 14 September 2024; Accepted: 09 December 2024;
Published: 17 February 2025.
Edited by:
Pengfei Zhao, Chinese Academy of Sciences (CAS), ChinaReviewed by:
Kaiping Qu, China University of Mining and Technology, ChinaCopyright © 2025 Bingbing, Jiateng, Haotian, Haiwei and Yunfan. This is an open-access article distributed under the terms of the Creative Commons Attribution License (CC BY). The use, distribution or reproduction in other forums is permitted, provided the original author(s) and the copyright owner(s) are credited and that the original publication in this journal is cited, in accordance with accepted academic practice. No use, distribution or reproduction is permitted which does not comply with these terms.
*Correspondence: Chen Bingbing, Y2hlbl9iaW5nYmluZzExMUBvdXRsb29rLmNvbQ==
Disclaimer: All claims expressed in this article are solely those of the authors and do not necessarily represent those of their affiliated organizations, or those of the publisher, the editors and the reviewers. Any product that may be evaluated in this article or claim that may be made by its manufacturer is not guaranteed or endorsed by the publisher.
Research integrity at Frontiers
Learn more about the work of our research integrity team to safeguard the quality of each article we publish.