- 1School of Automation, Nanjing University of Science and Technology, Nanjing, China
- 2State Grid Jiangsu Electric Power Co., Ltd. Research Institute, Nanjing, China
The rapid advancement of power electronics technology has led to the development of more flexible DC transmission systems, revealing the issue of oscillations. In this paper, a novel impedance modeling approach for the DC side of Modular Multilevel Converters (MMCs) has been introduced to overcome the limitations of previous methods, which did not take into account the complete control structure and internal harmonic characteristics. An accurate impedance model has been established, integrating the types of disturbance signal sources used in impedance measurement and the impact of measurement device characteristics on model accuracy. This approach enhances the precision of impedance stability analysis, which is crucial for system stability. The model’s effectiveness has been validated through simulations, demonstrating the influence of disturbance signal types and measurement device characteristics on the impedance stability of the MMC’s DC side.
1 Introduction
Since the beginning of the 21st century, the growing depletion of fossil fuels and the worsening global environment have prompted China to pursue the accelerated development of the new energy industry (Schuman and Lin, 2012). However, the distribution of new energy resources across China is characterized by significant imbalances. The resource-rich western regions have lower electricity demand, while the eastern regions, with much higher energy needs, suffer from resource shortages (Wang et al., 2020; Liu et al., 2021; Rokicki et al., 2022). To address this challenge, it is of the utmost importance to select an appropriate method for long-distance power transmission. Flexible DC transmission, specifically high-voltage direct current (HVDC) technology based on voltage source converters, has become the primary method for long-distance transmission, particularly given its advantages in renewable energy integration and asynchronous grid interconnection (Sun et al., 2017; Pierri et al., 2017; Sanchis et al., 2014).
The advent of flexible DC transmission systems has brought with it a number of challenges related to system stability. The control strategies for MMC grid-connected systems remain imperfect, and the complex internal dynamic characteristics of MMCs can affect the normal operation of the system, leading to oscillations (Yin et al., 2019; Antonopoulos et al., 2009). In recent years, China has experienced various oscillation phenomena in its flexible DC transmission projects, with frequencies ranging from a few hertz to several kilohertz. For example, in 2017, the Luxi back-to-back flexible DC transmission project encountered high-frequency oscillations at 1.2 kHz due to changes in grid operation (Zou et al., 2018). Similarly, in 2018, the Chongqing-Hubei back-to-back flexible DC transmission project experienced oscillations at frequencies of 700 Hz and 1.8 kHz. These oscillation events indicate that the related technology of MMC-HVDC is still immature, and it is prone to interacting with interconnected systems, causing oscillatory instability and posing a significant threat to the stable and secure operation of the power grid (Dewangan and Bahirat, 2019; Lyu et al., 2015). Therefore, it is necessary to conduct small-signal stability analysis on the MMC based DC grid terminals to understand their operational characteristics, identify the key factors affecting stable operation, and ensure the safe and reliable operation of MMC-HVDC systems.
Small-signal stability analysis is a crucial theoretical approach for examining system oscillations, primarily encompassing the state-space method (Yang et al., 2020) and the impedance analysis method (Amin et al., 2016). The state-space method is aimed at time-domain analysis, utilizing detailed state-space models to assess system stability. Although it is highly effective in identifying oscillatory behaviors in unstable conditions, it is less successful in determining the underlying causes of such oscillations. Moreover, modeling for complex systems is often difficult and computationally demanding. In contrast, the impedance analysis method focuses on frequency-domain analysis, relying on impedance transfer functions and the interactions between subsystem impedances to assess the stability of the entire system (Mu et al., 2021).
Impedance analysis is widely used in determining system stability. The prerequisite for this method is obtaining the impedance parameters of the system under test. When system parameters or control parameters are unavailable, theoretical analysis through impedance modeling becomes impractical. In such cases, impedance measurement techniques must be employed to determine the system’s impedance characteristics.
The measurement methods for grid impedance have a long history and can be classified into active and passive methods based on whether an external excitation source is applied during the measurement process (Sun et al., 2021). The passive measurement method directly utilizes the harmonic voltage and current signals naturally present in the system, combined with mathematical analysis and numerical processing, to determine the system’s impedance characteristics. Since passive measurement does not require injecting disturbance signals into the grid from an external source, it does not impact the stable operation of the grid. However, the accuracy of the passive method is difficult to guarantee, as it is highly dependent on the parameters of the power system, and the complex algorithms used may result in high computational demands. Furthermore, the natural harmonics in the system do not cover the full frequency range required for impedance measurement, making the active measurement method more widely adopted.
The active measurement method injects disturbance signals into the test port through an external disturbance source, and by capturing the disturbance components at the corresponding frequencies of the measurement points, the voltage and current amplitudes and phase information at various frequencies are obtained using Fast Fourier Transform (Kamala et al., 2022). This allows for the determination of the impedance characteristics at the test port. Currently, active measurement methods mainly include transient measurement and steady-state measurement (Huang et al., 2009). The transient measurement method consists of capacitor switching and thyristor short-circuiting techniques, while the steady-state measurement method refers to harmonic injection. Harmonic injection involves injecting voltage or current harmonic disturbance signals into the system under test to measure impedance. Unlike transient measurement methods, the frequency and amplitude of the injected harmonic disturbance signals can be artificially set by controlling power electronic devices or switches, thereby avoiding errors in measurement results caused by missing signals or insufficient disturbance signal amplitude at certain frequency points. The harmonic injection method can be further divided into single-frequency disturbance measurement and wide-frequency disturbance measurement. Wide-frequency disturbance signals mainly include binary sequence signals, third-order sequence signals, variable frequency sine waves, and multi-sine signals (Roinila et al., 2017).
This paper analyzes the system’s impedance stability based on impedance analysis methods, with a specific focus on the impact of the type of disturbance signal source and the impedance characteristics of the measuring device on the system’s impedance stability during the measurement process. Finally, simulations are conducted to verify the influence of impedance measurement on system stability.
2 MMC DC-Side impedance model
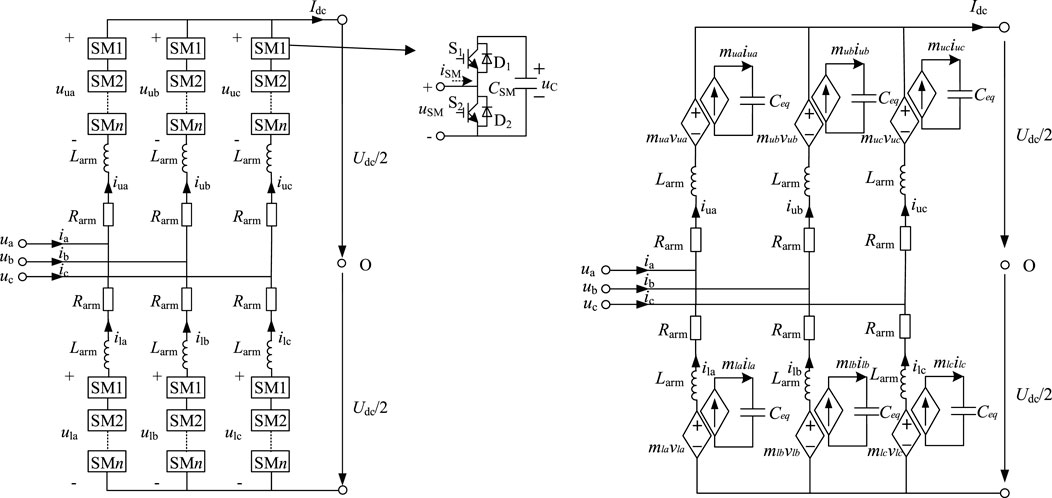
As shown in Figure 1, the MMC topology is a modular structure composed of multiple submodules, which can be half-bridge types, arranged in a series or parallel configuration to form the converter arms. The average model equivalent diagram represents the MMC as an equivalent circuit, where the submodules are simplified into average voltage sources, and the arm inductors and capacitors are used to model the AC and DC side behavior of the converter. In the average model, the MMC is depicted with an equivalent arm inductance and an equivalent capacitance at the DC side, which helps in analyzing the dynamic performance and control strategies of the converter. The equivalent diagram simplifies the complex MMC structure, allowing for easier analysis of the system’s impedance and harmonic characteristics, which are crucial for the stability and efficiency of the HVDC grid.
As shown in Figure 2, MMC dual closed-loop control is a control strategy employed in Modular Multilevel Converters (MMCs) to enhance system stability and performance. It consists of two interconnected control loops: an inner current control loop and an outer voltage control loop. The inner loop rapidly responds to maintain the current flowing through submodules at the desired level, providing stability against disturbances. The outer loop, operating at a slower pace, regulates the overall DC voltage output to meet system demands. This hierarchical structure allows for precise output regulation, improving the dynamic response and ensuring long-term voltage setpoints are achieved. The dual closed-loop system is essential for managing power flow and maintaining grid stability in HVDC systems, particularly when integrating renewable energy sources.
The control of MMC primarily influences its frequency-domain characteristics through the submodule switching factor. When using DC voltage control combined with reactive power control, the submodule switching factor can be expressed as Equation 1:
where,
For simplicity, the submodule switching factor is denoted as Equation 2:
The specific expressions for
Once the expression for the submodule switching factor is derived, the MMC’s small-signal frequency-domain model can be used to obtain the DC-side admittance model (Lu et al., 2018). To simplify, the DC-side admittance model is expressed as Equation 5:
where,
where,
Using the admittance matrix
3 Impact of impedance measurement on impedance characteristics
3.1 Measurement methods and impedance stability criteria
For active measurement methods, based on the form of the disturbance signal injected into the system, they can be divided into series voltage source disturbance injection methods and parallel current source disturbance injection methods, as shown in Figures 3A, B respectively. However, for the parallel current source disturbance injection method, although its injection method is simple and the design is relatively flexible, there is a problem of uneven disturbance distribution. From Figure 3B, it can be seen that the distribution of the injected current disturbance is determined by the impedances on the source side and the load side. When the source side impedance is much smaller than the load side impedance, most of the injected disturbance signal will flow towards the source side, and the disturbance signal on the load side will be very small, which can lead to a significant error in the impedance measurement results. Therefore, this paper adopts the series voltage source disturbance injection method.

Figure 3. Disturbance signal injection implementation methods. (A) Series voltage source disturbance injection (B) parallel current source disturbance injection.
After conducting impedance measurements to obtain the impedance characteristics of the system under test, the stability of the system can be analyzed based on the obtained impedance characteristics. Compared to stability analysis methods based on the state-space approach, impedance-based stability analysis methods have more practical physical significance. Impedance-based stability analysis methods mainly analyze the stability of the system under test through the Nyquist criterion and frequency domain impedance criteria. The Nyquist criterion starts from the perspective of cascade, while the frequency domain impedance criteria consider the system under test as a whole and analyze the stability of the system through the impedance characteristic curve of the overall system. The stability analysis method used in this paper is the frequency domain impedance analysis method, which analyzes the impedance stability of the system by analyzing the amplitude-frequency and phase-frequency curves of the impedance.
3.2 Disturbance signal source
When measuring impedance, the amplitude and peak value of the injected disturbance signal must be constrained to ensure normal system operation and obtain accurate measurements. The amplitude of the disturbance signal is critical to counteract noise interference during actual measurements. To ensure measurement accuracy, the disturbance signal amplitude must be large enough to maintain an adequate signal-to-noise ratio. Larger disturbance signals also make it easier to capture the response signal. However, if the peak value of the disturbance signal is too high, issues like saturation and over-modulation can occur.
3.2.1 Single sine wave signal
The single sine wave signal is the most commonly used disturbance injection signal for impedance measurement. Its time-domain expression is shown in Equation 8. Since a single disturbance injection only provides impedance characteristics at a specific frequency, multiple injections are required to obtain the broadband impedance characteristics of the test port.
where
3.2.2 Multi-sine wave signal
The multi-sine wave, also known as a multi-tone signal, consists of multiple sine waves with different frequencies, amplitudes, and phases combined. Its time-domain expression is Equation 9:
where
3.2.3 Chirp Signal
The chirp signal is a sine wave whose frequency changes with time, resulting in a rectangular time-domain envelope with frequency variations within it. Its time-domain expression is Equation 10:
where
The frequency modulation function
Linear chirp signals can also be transformed into pulse-width modulation (PWM) signals, known as chirp-PWM (CPWM). The transformation expression is Equation 13:
CPWM signals, which only have two states (0 and 1), are essentially a type of binary sequence.
3.2.4 Pseudo random binary sequence signal
Pseudo random binary sequence (PRBS) is a binary signal that exhibits randomness within a single cycle but overall periodicity (Sihvo et al., 2019). Maximum length binary sequence (MLBS), a special type of PRBS, is widely used in power supply analysis (Roinila et al., 2012).
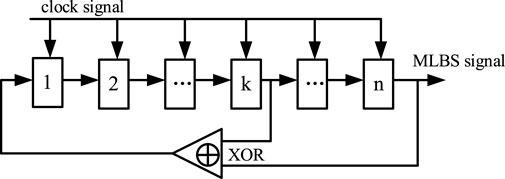
MLBS is a two-level signal that alternates between “0”and “1”, changing state only at specific times. It can be generated using the shift register method, where the kth and nth elements of an n-stage shift register undergo an XOR operation, with the result fed back into the first position of the register. The complete MLBS signal is formed by shifting all elements of the register to the right, as illustrated in Figure 4. The expression for the shift register method is Equation 14:
where
Single sine waves are preferred for disturbance signal injection due to their minimal impact on system performance and high measurement reliability. However, they require multiple injections to measure broadband impedance, reducing efficiency. Multi-sine signals provide flexibility in designing frequency, amplitude, and phase for optimized frequency spectrum distribution, balancing precision and speed. They are easier to generate than chirp signals and need less complex equipment. Chirp and CPWM signals allow for dense measurement points but may have low average amplitude. MLBS offers more flexibility than square waves in amplitude-frequency characteristics, though it cannot modify individual harmonic amplitudes independently. These signals are tailored to meet specific impedance measurement requirements for accurate system analysis.
3.3 Measurement device impedance characteristics
3.3.1 DC voltage Sensor
The resistive-capacitive (RC) voltage divider-type DC voltage sensor offers advantages such as good amplitude-frequency characteristics and fast response speed. The measurable frequency range is broad, effectively covering the DC component, the fundamental frequency component, and the harmonic components.
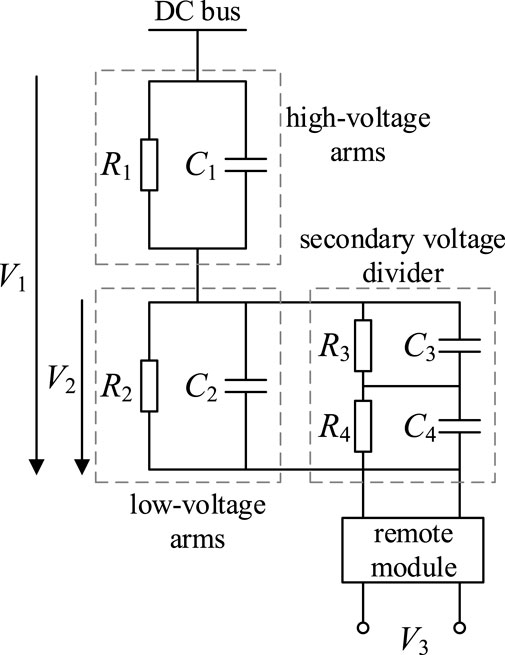
The RC voltage divider-type DC voltage sensor primarily consists of an RC voltage divider, a secondary voltage divider module, and an electronic isolation module. The RC voltage divider and secondary voltage divider module are composed of resistors and capacitors used for collecting voltage signals, as shown in the equivalent circuit diagram in Figure 5.
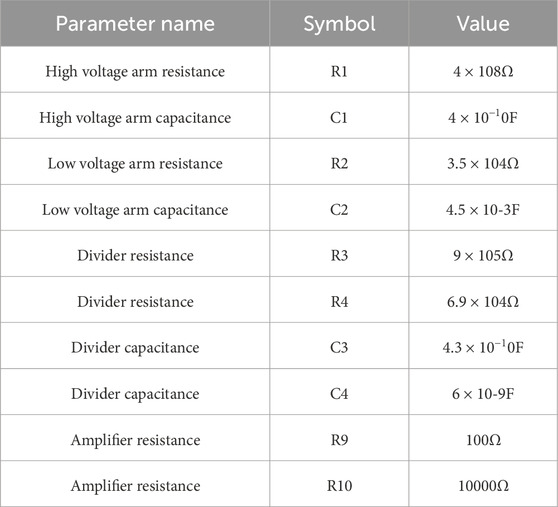
In the diagram, R1 and R2 are the resistors of the high-voltage and low-voltage arms, respectively; C1 and C2 are the capacitors of the high-voltage and low-voltage arms, respectively. R3 and R4 represent the resistors in the secondary voltage divider, while C3 and C4 are the corresponding capacitors. V1 is the bus voltage on the primary side, V2 is the voltage on the low-voltage arm, and V3 is the output voltage of the remote module.
Using the equivalent circuit in Figure 2, the transfer functions
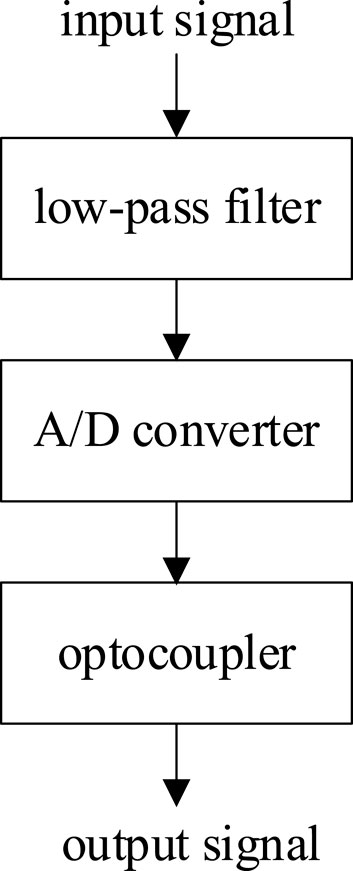
The structure of the remote module in the voltage sensor is shown in Figure 6. The A/D converter and optocoupler technologies are well-established, enabling precise signal conversion. Therefore, when considering the transfer function of the remote module, only the low-pass filter’s transfer function needs to be accounted for.
The remote module typically uses a second-order Butterworth filter for the low-pass filter, with a transfer function shown in Equation 17:
where,
By combining the transfer functions of the RC voltage divider, the secondary voltage divider, and the electronic isolation module, the overall transfer function
3.3.2 DC Current transformer
In high-voltage DC transmission systems, DC current sensors are typically either optical current sensors or zero-flux current sensors. Since optical current sensors are primarily used for busbar measurements and zero-flux sensors are used to measure current in the neutral region, this paper focuses on the impedance characteristics of optical current sensors and their impact on system impedance.
The optical current sensor includes both high-voltage and low-voltage components. The high-voltage part is responsible for measuring the signal and converting it into a digital signal, which is transmitted to the low-voltage part. The low-voltage part then processes the signal through signal conversion and filtering stages to output the final signal. The structure is shown in Figure 7.
When considering the transfer function of the optical current sensor, only the amplification circuit and filter transfer functions need to be considered, as the precision of the shunt resistor and signal conversion components is high enough to be regarded as ideal.
The amplification circuit uses a voltage-series negative feedback in-phase amplifier, with its transfer function expressed as Equation 20:
The filter also adopts a second-order Butterworth design, with the same transfer function as in Equation 17. Thus, the overall transfer function for the optical current sensor is Equation 21:
3.3.3 AC current transformer
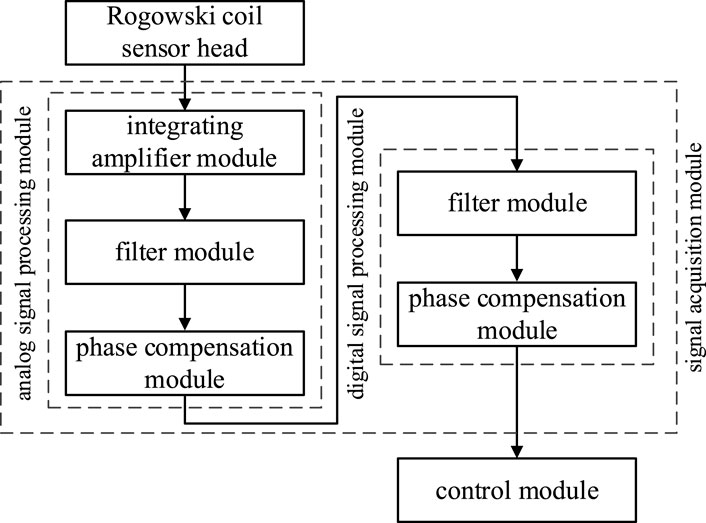
Rogowski coil current transformers are widely used in substations due to their high measurement accuracy and broad measurement range (Mingotti et al., 2019). The Rogowski coil current transformer consists of the Rogowski coil sensor head, signal acquisition module, and control module, as shown in Figure 8.
Similar to DC voltage sensors, when considering the transfer function of the AC current transformer, only the Rogowski coil sensor head, integrative amplification module, and filtering module are included.
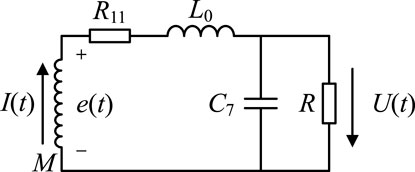
The Rogowski coil sensor head converts the input current signal into an output voltage signal. Its equivalent circuit diagram is shown in Figure 9.
In this diagram, I(t), U(t), and e(t) represent the input current, output voltage, and induced electromotive force, respectively. R11, L0, and C7 represent the Rogowski coil’s internal resistance, inductance, and distributed capacitance, respectively, and R is the load resistance. Based on the equivalent circuit, the transfer function of the Rogowski coil sensor head can be derived as Equation 22:
Since the Rogowski coil sensor head differentiates the signal, an integrative amplification module is required to restore the original signal. Its transfer function is shown in Equation 23:
The filter module also adopts a second-order Butterworth design. Combining Equations 22, 23 gives the overall transfer function of the Rogowski coil current transformer as Equation 24:
3.3.4 AC voltage transformer
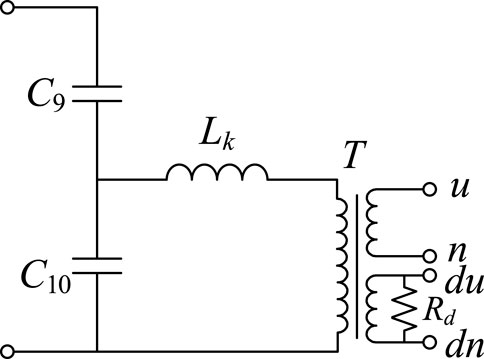
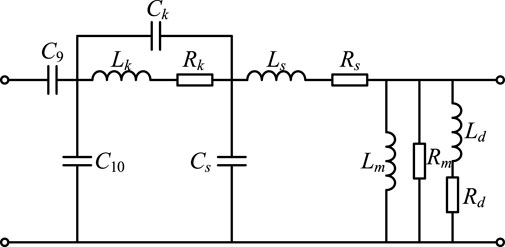
Capacitor Voltage Transformers (CVT) are widely used in flexible HVDC transmission systems. In this section, a fast saturation-type CVT is analyzed for its amplitude-frequency characteristics. The basic structure and equivalent circuit diagrams are shown in Figures 10, 11.
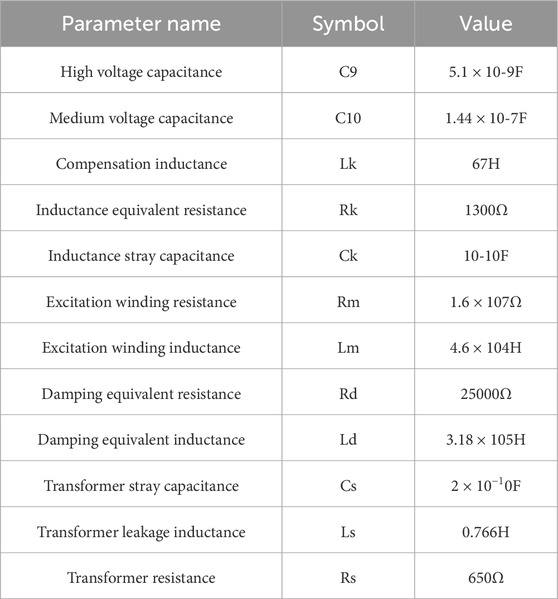
In Figure 9, C9 and C10 are the high-voltage and medium-voltage capacitors, respectively; Lk is the compensation inductor; T is the intermediate transformer; and Rd is the damping resistor. u, n, du, and dn represent the secondary winding terminals and damping unit terminals, respectively.
In Figure 11, Rk and Ck represent the equivalent resistance and stray capacitance of the compensation inductor Lk, while Ls, Rs, and Cs represent the leakage inductance, equivalent resistance, and stray capacitance of the intermediate transformer. Lm and Rm represent the equivalent inductance and resistance of the excitation winding, and Ld and Rd represent the equivalent inductance and resistance of the damping winding. For simplicity, we define: Zk(s) = (Rk + sLk)||[1/(sCk)], Z1(s) = 1/(s (C9+C10)), Zs(s) = Rs + sLs, Zd(s) = Rd + sLd, Zm(s) = RmLm/(Rm + sLm), ZCs(s) = 1/sCs. Based on the equivalent circuit, the transfer function of the CVT can be derived as Equation 25:
In dual-loop control systems, the inner control loop requires the acquisition and coordinate transformation of AC voltage signals. Therefore, when considering the impact of the measurement stage on the impedance results, the influence of the AC voltage transformer cannot be ignored.
4 Simulation validation
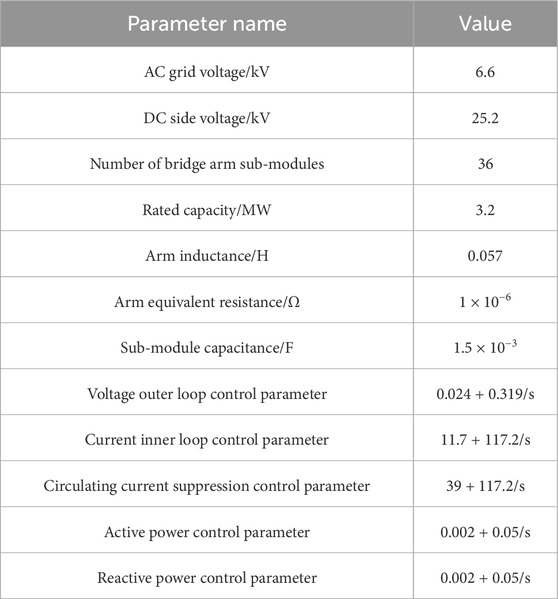
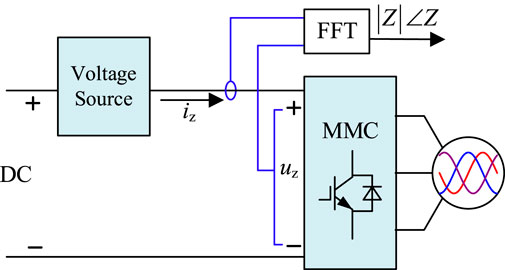
To verify the impact of disturbance signals and the characteristics of the measurement devices on system impedance, simulation tests were conducted in the MATLAB/Simulink environment. The simulation parameters for the main circuit and control loops are listed in Table 1, while the measurement device parameters are provided in Tables 2–4. The schematic diagram of the DC side impedance measurement is shown in Figure 12.
4.1 Impact of disturbance signals
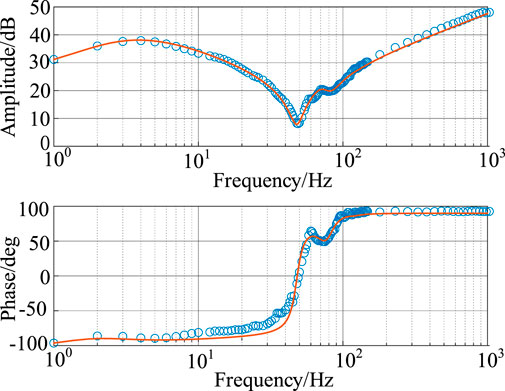
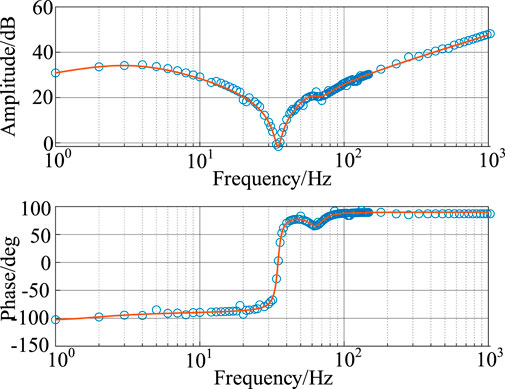
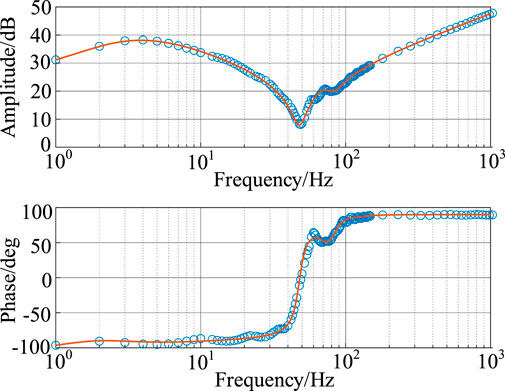
In MATLAB, the MMC DC-side impedance model established in Section 1 was implemented via an M function. Different disturbance signals were injected into the DC side to measure the MMC DC-side impedance. The results were compared with the theoretical impedance to assess the accuracy of impedance measurements using different disturbance signals. The M function results are shown as orange solid lines, while the impedance measurement results are displayed as blue circles.
Figure 13 shows the impedance characteristics of the MMC DC-side port when a single sinusoidal signal (1-1 kHz, 1 kV amplitude) was used as the disturbance signal. The measurement results accurately matched the theoretical model across the frequency spectrum.
Figure 14 presents the results using a multi-sine wave (1 kV amplitude). Significant deviations from the theoretical curve are evident, particularly between 10 and 100 Hz and at higher frequencies, indicating less accuracy compared to the single sine signal.
Figure 15 depicts the results when a chirp signal (1-1 kHz, 1 kV amplitude) was used. The results closely aligned with the theoretical curve, with slight discrepancies near low frequencies and the fundamental frequency. The measurement accuracy was higher than that of the multi-sine signal but slightly lower than that of the single sine signal.
Figure 16 shows the results using a PRBS signal (MLBS signal with a clock frequency of 511 Hz and 1 kV amplitude). The results closely matched the theoretical curve, with fewer deviations compared to the chirp signal and significantly better accuracy than the multi-sine signal.
Overall, the single sine signal produced the most accurate impedance measurements, but it was time-consuming. In contrast, the other broadband disturbance signals introduced varying degrees of error, with PRBS showing the smallest error and shortest measurement time.
4.2 Impact of measurement devices
PRBS was selected as the disturbance signal to analyze the influence of control loop acquisition on the impedance characteristics of the system. When measurement characteristics were not considered, the bandwidths of the outer, inner, and circulating current controllers were 25 Hz, 10 Hz, and 4 Hz, respectively.
Figure 17 illustrates the impact of control loop acquisition on the measured impedance characteristics. The control acquisition primarily affected the low-frequency and fundamental frequency regions, where amplitude increased, and phase variations were more pronounced.
Figure 18 compares the waveforms before and after considering the measurement device characteristics. Significant distortion in both DC voltage and AC current waveforms occurred when measurement device characteristics were considered, with reduced amplitude and extended stabilization time due to the gain reduction in the amplitude-frequency curve of the voltage and current sensors.

Figure 18. Comparison of DC voltage and AC current waveforms. (A) Without considering measurement characteristics, (B) with considering measurement characteristics.
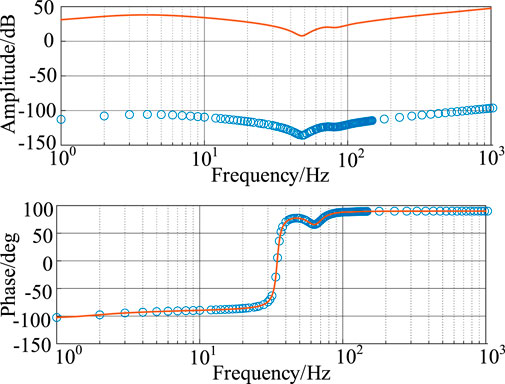
Figure 19 demonstrates the impact of impedance measurement acquisition on the impedance characteristics. The most noticeable effect was a significant reduction in the amplitude-frequency characteristics by over 100 dB, while the phase-frequency characteristics remained relatively unchanged.
These results show that the characteristics of measurement devices can introduce substantial errors into the impedance model and interfere with system operation, affecting system stability analysis.
5 Conclusion
This study has been conducted to analyze the impact of impedance measurement on system stability by modeling various aspects of the measurement process. The formation and frequency spectrum of different disturbance signals used for impedance measurement, as well as the influence of measurement device characteristics on system stability, have been examined. Simulation results have validated that different disturbance signals have varying effects on impedance measurement accuracy, and measurement device impedance characteristics can significantly affect system stability. The comprehensive impedance model developed in this research contributes to a more nuanced understanding of the role impedance measurement plays in system stability, paving the way for further studies in this field.
Data availability statement
The original contributions presented in the study are included in the article/supplementary material, further inquiries can be directed to the corresponding author.
Author contributions
DZ: Methodology, Validation, Writing–original draft, Writing–review and editing. ZC: Data curation, Validation, Writing–review and editing. JB: Data curation, Formal Analysis, Validation, Writing–review and editing. QuL: Data curation, Funding acquisition, Validation, Writing–review and editing. QiL: Methodology, Validation, Writing–review and editing. XR: Methodology, Validation, Writing–review and editing.
Funding
The author(s) declare that no financial support was received for the research, authorship, and/or publication of this article.
Conflict of interest
Authors QuL and QiL were employed by State Grid Jiangsu Electric Power Co., Ltd. Research Institute.
The remaining authors declare that the research was conducted in the absence of any commercial or financial relationships that could be construed as a potential conflict of interest.
Publisher’s note
All claims expressed in this article are solely those of the authors and do not necessarily represent those of their affiliated organizations, or those of the publisher, the editors and the reviewers. Any product that may be evaluated in this article, or claim that may be made by its manufacturer, is not guaranteed or endorsed by the publisher.
References
Amin, M., Molinas, M., Lyu, J., and Cai, X. (2016). Impact of power flow direction on the stability of VSC-HVDC seen from the impedance Nyquist plot. IEEE Trans. Power Electron. 32 (10), 8204–8217. doi:10.1109/TPEL.2016.2608278
Antonopoulos, A., Angquist, L., and Nee, H. P. (2009). “On dynamics and voltage control of the modular multilevel converter,” in 2009 13th European Conference on Power Electronics and Applications, Barcelona, Spain, 08-10 September 2009 (IEEE), 1–10.
Dewangan, L., and Bahirat, H. J. (2019). Controller interaction and stability margins in mixed SCR MMC-based HVDC grid. IEEE Trans. Power Syst. 35 (4), 2835–2846. doi:10.1109/TPWRS.2019.2959066
Huang, J., Corzine, K. A., and Belkhayat, M. (2009). Small-signal impedance measurement of power-electronics-based AC power systems using line-to-line current injection. IEEE Trans. Power Electron. 24 (2), 445–455. doi:10.1109/TPEL.2008.2007212
Kamala, S., Gorla, N. B. Y., and Panda, S. K. (2022). Small-signal stability improvement of microgrid with battery energy storage system based on real-time grid impedance measurement. IEEE Trans. Industry Appl. 58 (2), 2537–2546. doi:10.1109/TIA.2021.3140017
Liu, W., Fan, W., Hong, Y., and Chen, C. (2021). A study on the comprehensive evaluation and analysis of China’s renewable energy development and regional energy development. Front. Energy Res. 9, 635570. doi:10.3389/fenrg.2021.635570
Lu, X., Xiang, W., Lin, W., and Wen, J. (2018). Small-signal modeling of MMC based DC grid and analysis of the impact of DC reactors on the small-signal stability. Int. J. Electr. Power & Energy Syst. 101, 25–37. doi:10.1016/j.ijepes.2018.01.046
Lyu, J., Cai, X., and Molinas, M. (2015). Frequency domain stability analysis of MMC-based HVdc for wind farm integration. IEEE J. Emerg. Sel. Top. Power Electron. 4 (1), 141–151. doi:10.1109/JESTPE.2015.2498182
Mingotti, A., Peretto, L., and Tinarelli, R. (2019). Effects of multiple influence quantities on rogowski-coil-type current transformers. IEEE Trans. Instrum. Meas. 69 (7), 4827–4834. doi:10.1109/TIM.2019.2953419
Mu, H., Zhang, Y., Tong, X., Chen, W., He, B., Shu, L., et al. (2021). Impedance-based stability analysis methods for DC distribution power system with multivoltage levels. IEEE Trans. Power Electron. 36 (8), 9193–9208. doi:10.1109/TPEL.2021.3057874
Pierri, E., Binder, O., Hemdan, N. G., and Kurrat, M. (2017). Challenges and opportunities for a European HVDC grid. Renew. Sustain. Energy Rev. 70, 427–456. doi:10.1016/j.rser.2016.11.233
Roinila, T., Messo, T., and Santi, E. (2017). MIMO-identification techniques for rapid impedance-based stability assessment of three-phase systems in DQ domain. IEEE Trans. Power Electron. 33 (5), 4015–4022. doi:10.1109/TPEL.2017.2714581
Roinila, T., Puukko, J., Nousiainen, L., and Vilkko, M. (2012). Designing MLBS excitation for the frequency-response measurement of AC-connected power electronics systems. IFAC Proc. Vol. 45 (16), 1329–1334. doi:10.3182/20120711-3-BE-2027.00082
Rokicki, T., Koszela, G., Ochnio, L., Perkowska, A., Bórawski, P., Bełdycka-Bórawska, A., et al. (2022). Changes in the production of energy from renewable sources in the countries of Central and Eastern Europe. Front. Energy Res. 10, 993547. doi:10.3389/fenrg.2022.993547
Sanchis, G., Betraoui, B., Anderski, T., Peirano, E., Pestana, R., De Clercq, B., et al. (2014). The corridors of power: a pan-European “electricity highway” system for 2050. IEEE Power Energy Mag. 13 (1), 38–51. doi:10.1109/MPE.2014.2363528
Schuman, S., and Lin, A. (2012). China's Renewable Energy Law and its impact on renewable power in China: progress, challenges and recommendations for improving implementation. Energy policy 51, 89–109. doi:10.1016/j.enpol.2012.06.066
Sihvo, J., Stroe, D. I., Messo, T., and Roinila, T. (2019). Fast approach for battery impedance identification using pseudo-random sequence signals. IEEE Trans. power Electron. 35 (3), 2548–2557. doi:10.1109/TPEL.2019.2924286
Sun, J., Li, M., Zhang, Z., Xu, T., He, J., Wang, H., et al. (2017). Renewable energy transmission by HVDC across the continent: system challenges and opportunities. CSEE J. Power Energy Syst. 3 (4), 353–364. doi:10.17775/CSEEJPES.2017.01200
Sun, K., Yao, W., Yan, C., and Wen, J. (2021). Impedance modeling and analysis of medium-frequency oscillation caused by VSC-HVDC connected to local weak grid and DFIG-based wind farms. Front. Energy Res. 9, 693903. doi:10.3389/fenrg.2021.693903
Wang, Y., Zhang, D., Ji, Q., and Shi, X. (2020). Regional renewable energy development in China: a multidimensional assessment. Renew. Sustain. Energy Rev. 124, 109797. doi:10.1016/j.rser.2020.109797
Yang, D., Wang, X., Ndreko, M., and Winter, W. (2020). “Multi-frequency state-space model of MMC-HVDC system for design-oriented stability analysis,” in 2020 IEEE 9th International Power Electronics and Motion Control Conference (IPEMC2020-ECCE Asia), Nanjing, China, 29 November 2020–02 December 2020 (IEEE), 961–965. doi:10.1109/IPEMC-ECCEAsia48364.2020.9367899
Yin, S., Wang, Y., Yin, T., Wang, Z., An, R., Xu, P., et al. (2019). “Small-signal modeling and stability analysis of MMC with the consideration of internal harmonic interactions,” in 2019 IEEE Applied Power Electronics Conference and Exposition (APEC), Anaheim, USA, 17-21 March 2019 (IEEE), 2872–2876. doi:10.1109/APEC.2019.8722261
Keywords: impedance measurement, disturbance signal, stability analysis, measurement device, impedance characteristics, impedance modeling, stability criterion, system oscillation
Citation: Zhao D, Chen Z, Bu J, Li Q, Li Q and Rong X (2024) Analysis of the impact of measurement on the impedance stability of HVDC grids. Front. Energy Res. 12:1496025. doi: 10.3389/fenrg.2024.1496025
Received: 13 September 2024; Accepted: 04 November 2024;
Published: 21 November 2024.
Edited by:
Tao Ding, Xi’an Jiaotong University, ChinaReviewed by:
Kangli Liu, Southeast University, ChinaDongye Li, Nanjing Institute of Technology (NJIT), China
Copyright © 2024 Zhao, Chen, Bu, Li, Li and Rong. This is an open-access article distributed under the terms of the Creative Commons Attribution License (CC BY). The use, distribution or reproduction in other forums is permitted, provided the original author(s) and the copyright owner(s) are credited and that the original publication in this journal is cited, in accordance with accepted academic practice. No use, distribution or reproduction is permitted which does not comply with these terms.
*Correspondence: Zaiyu Chen, emFpeXVjaGVuMTIzQDEyNi5jb20=
 Dawei Zhao
 Zaiyu Chen
 Jing Bu1