- 1Energy Development Research Institute, China Southern Power Grid, Guangzhou, China
- 2Guangzhou Institute of Energy Conversion, Chinese Academy of Sciences, Guangzhou, China
- 3Planning and Research Center for Power Grid, Yunnan Power Grid Corp, Kunming, China
- 4Center for Energy and Environmental Management and Decision-making, China University of Geosciences, Wuhan, China
- 5School of Economics and Management, China University of Geosciences, Wuhan, China
With the advancement of distributed energy systems, energy sharing has emerged as a crucial trading mechanism on the demand-side, enabling participants to share self-generated energy with their neighbors through contractual agreements. Nevertheless, a comprehensive analysis is needed to balance the benefits among energy prosumers, given their distinct characteristics. This paper proposes a multi-energy sharing framework with flexible demand-side management based on full cooperation. We evaluate the economic and environmental performance of sharing participants, considering the impacts of different operation modes and diverse demand profiles. Cooperative game theory is employed to maximize the social welfare of all participants, with the different allocation schemes are used to distribute the cooperative surplus among stakeholders. The fairness of these schemes is assessed to ensure the feasibility and equity of the proposed framework. The results indicate that the centralized multi-energy sharing framework yields win-win outcomes for both individual and collective interests. Specifically, the total cost and carbon dioxide emissions of prosumers in the shared scenario are reduced by 13% and 16%, respectively, compared to individual operation scenarios. Moreover, thermal energy management is critically important for energy sharing. Furthermore, varying combinations of building types significantly affect cost savings and emission reductions, influencing energy sharing patterns and quantities.
1 Introduction
The global energy landscape is undergoing rapid transformation. With the proliferation of distributed energy resources, prosumers have emerged as key stakeholders capable of both producing and consuming energy on the demand side (Schwidtal et al., 2023; Zhang et al., 2022). The increasing number of prosumers has made the formation of comprehensive energy communities an effective strategy to enhance energy utilization efficiency and drive energy transition (Zhang Y. et al., 2024). A promising approach to establishing such communities involves facilitating energy exchange among prosumers (Zhou et al., 2024). However, as prosumers are inherently self-interested entities, coordinating and optimizing their interactions presents specific challenges (Li, 2021). Consequently, designing an effective energy sharing mechanism among prosumers is crucial.
Energy sharing has become a significant form of trading on the demand side (Minuto and Lanzini, 2022). This model allows citizens to share self-generated energy with neighbors on a contractual basis, with electricity trading among prosumers being a common mode (Yan X. et al., 2024). In this context, energy price determination and benefit allocation have garnered increasing attention. Liu et al. proposed a dynamic pricing mechanism to drive decentralized energy trading and optimize financial benefits for distributed energy resource owners (Liu et al., 2018). Their findings indicate that energy sharing facilitates the marketization of demand-side energy systems with a high proportion of distributed energy resources. Additionally, Bui et al. developed a multi-step hierarchical coordination framework for energy management across multiple microgrids, considering internal power flow to minimize the operation cost of the entire energy network (Bui et al., 2016). In recent years, game theory has been widely applied to the energy sharing domain. A hierarchical game structure is proposed for an energy sharing mechanism that considers AC power network constraints and encourages local electricity exchange (Yan D. et al., 2024; Wang D. et al., 2024). Under this mechanism, all participants engage in a generalized Nash game. Similarly, Wang et al. introduced a bi-level hierarchical optimization framework for building prosumers and utility grid operators, where the grid operator acts as a leader and prosumers as followers (Wang X. et al., 2024). Kumar et al. proposed a pricing strategy to coordinate energy sharing between distribution network operators and microgrid operators, demonstrating that pricing-based sharing mechanisms can encourage local power sharing and benefit participants’ operations (Kumar et al., 2024). Faraji et al. employed a Stackelberg game between community managers and sharing members to optimize internal electricity prices and energy exchanges (Faraji et al., 2024). To solve leader-follower problems, heuristic algorithms such as particle swarm optimization have been utilized (Gao et al., 2023). Alternative approaches include asymmetric bargaining solutions with alternating direction multiplier algorithms to address distributed transaction optimization problems in decentralized frameworks (Fan et al., 2024). In energy-sharing household communities, demand response is often considered through power load shifting (Mota et al., 2024).
Recently, multi-energy sharing has begun to attract attention. Li and Zhang proposed an auction-based electricity and heat sharing mechanism to facilitate energy interaction among participants and coordinate electricity and heat systems (Li and Zhang, 2021a). Furthermore, they analyzed the economic and environmental performance of energy sharing communities, considering carbon emission responsibilities and carbon tax policies (Li et al., 2021). Their key findings indicate that sharing communities exhibit the best economic performance under production responsibility, while achieving excellent environmental benefits under consumption responsibility schemes. Yang et al. formulated a multi-energy sharing problem using peer-to-peer trading based on a Nash bargaining solution (Yang et al., 2022). Zhang et al. realized the transaction of electric and thermal energy between microgrids under horizontal multi-energy system cooperation to improve energy utilization efficiency (Zhang K. et al., 2024). According to the principle of alternating direction multiplier method, the coordination problem is solved and the interests of all parties are balanced. In multi-energy sharing scenario, Jia et al. developed a hierarchical structure to optimize energy interaction between integrated community energy system operators and buildings through network charge prices and sale prices (Jia et al., 2024). To solve the bi-level problem, a distributed algorithm is introduced based on alternating direction method of multipliers.
While electricity sharing mechanisms have been extensively studied in the aforementioned literature, multi-energy sharing mechanisms under full cooperation frameworks remain understudied. To integrate all local resources and maximize incentives for local multi-energy sharing, cooperative game theory presents a promising approach. Moreover, the economic and environmental performance of sharing participants, especially under different building type scenarios, has not been thoroughly analyzed. To address these gaps, this paper aims to propose a multi-energy sharing mechanism based on full cooperation to maximize the social welfare of all sharing participants, analyze cooperative surplus allocation strategies, and valuate the economic and environmental performance of sharing participants under different load profiles. The main contributions of this study are twofold. First, a centralized multi-energy sharing framework is proposed, leveraging cooperative game theory to maximize the social welfare of all participants while ensuring a fair economic scheme. Both individual rationality and group rationality are guaranteed throughout the electricity and heat sharing process. Second, a detailed economic and environmental analysis is conducted to assess the effects of multi-energy sharing schemes and explore the impact of different building types on energy sharing performance.
2 Description of multi-energy sharing framework
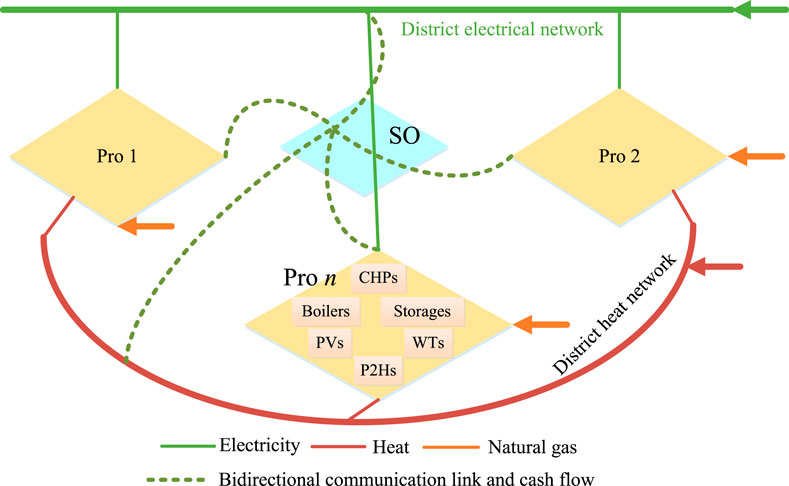
In a local area, multiple prosumers equipped with distributed energy systems operate. These prosumers utilize various small-scale generation assets, including natural gas-fired combined heat and power (CHP) systems, natural gas-fired boilers, renewable energy generation equipment, power-to-heat (P2H) equipment, energy storage, and other resources, as illustrated in Figure 1. They produce both electricity and heat to meet their energy demands. A centralized system operator (SO), managed by an energy service company, oversees the energy sharing among prosumers to optimize the economic performance of all participants. The SO collects data from the prosumers to balance energy supply and demand, providing dispatch schedules accordingly. To enhance system flexibility, the SO incorporates electrical and heat storage, as well as P2H equipment. Additionally, multiple energy demand responses are considered to encourage prosumers to adjust their consumption behaviors, thereby increasing system flexibility. Consequently, each prosumer must formulate strategies for production, conversion, storage, and consumption. They must also establish an energy sharing strategy with other prosumers in the local market and determine their energy transaction profile with external municipal energy networks, including the district electrical network, district heat network, and district gas network.
To coordinate the self-interested prosumers, a multi-energy sharing mechanism needs to be developed, establishing rules and institutions. The primary challenge in designing these interactive rules lies in defining the properties for multi-energy sharing. Below are the ideal properties for coordinating multiple stakeholders:
Maximizing social welfare: The social welfare of all sharing participants should be maximized, ensuring no stakeholder wishes to deviate from their dispatch schedule. This maximization also aligns with the profit-maximization of participants, maintaining the coalition as a whole and promoting cooperative benefits.
Stable Outcomes: No group of participants should benefit from splitting from the coalition. This property ensures stable outcomes and fair results through a reasonable allocation scheme, crucial for social acceptance.
When these properties are met, a social choice can be derived by aggregating the individual utilities of the participants. This mechanism incentivizes participants to coordinate, maximizing the social welfare of the entire system. The information submitted by each prosumer must accurately reflect their economic and physical characteristics. The SO then selects the optimal dispatch strategies to maximize social welfare based on the provided information, subsequently applying a payment rule to allocate the cooperative surplus.
3 Mathematical model for sharing participants
3.1 Mathematical model of prosumers
In the context of modern energy systems, each prosumer is treated as an individual subject with the primary objective of minimizing the total cost while fulfilling the energy demand of customers. This total cost encompasses various components, including the operational costs of generation, conversion, and storage equipment, the cost of energy trading with external municipal networks, the cost of energy sharing with other prosumers, management fees paid to the coordinator (SO), costs for demand response, and the cost associated with carbon dioxide emissions. The objective function of each prosumer is expressed as Equation 1:
where
The electricity output from photovoltaic (PV) systems and wind power plants (WPPs) is modeled as Equations 2, 3:
where
The generation of electricity and heat from natural gas-fired CHP systems and boilers is modeled in Equations 4–10. For CHP systems, low operation load leads to the low electric generation efficiency. To avoid the low efficiency, a threshold for load ratio
where
The power-to-heat technology converts low-grade heat into high-grade heat, modeled as Equations 11,12:
where
The charging and discharging processes for electrical and heat storage are given by Equations 13–17:
where
The demand response program adjusts energy consumption to align demand with supply. Load shifting-based incentive demand response is considered, modeled as Equations 18–21:
where
The electricity, heat, and natural gas balances for prosumer
3.2 Mathematical model of SO
In the multi-energy sharing framework, the SO plays a pivotal role in orchestrating the schedules of each prosumer, facilitating energy sharing among prosumers, and maintaining the balance of supply and demand within the district. To efficiently manage these tasks, the SO imposes a management fee, which is predetermined prior to participation in the energy-sharing program. The objective function of the SO can be expressed as Equation 25:
where
3.3 Coordination scheme of sharing participants
To maximize the social welfare of all stakeholders, the resources of all sharing participants should be effectively coordinated. Typically, these coordinated prosumers represent different interest groups. Without a SO, prosumers can only trade with external energy entities and cannot share energy with their neighbors. Therefore, we propose a centralized coordination scheme, introducing an independent system operator (ISO) as the supervisor. The ISO will integrate all objectives and constraints into a centralized optimization problem. Under contracts signed by the sharing participants, this centralized scheme can leverage all available resources to maximize the social welfare of the entire system. However, the centralized scheme requires all participants to disclose accurate information to the ISO, making it suitable for scenarios where all participants are rational and willing to cooperate. The ISO optimizes dispatch strategies to maximize profit based on the provided supply and demand information, and the cooperative surplus is then allocated according to a predefined payment rule.
The multi-energy sharing problem aims to minimize the total cost for all stakeholders. The coordination model for all participants is defined in Equation 27:
Equation 28 encompasses all the constraints for prosumers and the SO, detailed in Section 3.1 and Section 3.2.
The multi-energy sharing framework generates a cooperative surplus, which must be allocated to each participant. Let
A core solution in cooperative games must satisfy group, subgroup, and individual rationality. Hence, the following constraints are considered:
Equation 29 guarantees that the aggregate benefit for the coalition is equivalent to the sum of benefits accrued by each individual member. The benefit for any subset of participants should not exceed the allocation for each member within that subset, as stipulated by Equation 30. Equation 31 ensures that members derive greater benefits through collaboration than they would by operating independently. Satisfying these core conditions is crucial for the efficacy and fairness of the benefit distribution mechanism.
A fair and judicious benefit distribution mechanism is essential for sustaining a robust energy sharing alliance. In this study, three cost allocation schemes will be taken into account: the Shapley value, the Nucleolus, and the N-H solution. In the following, a short description of the three main existing approaches is provided.
3.3.1 The Shapley value
The Shapley value, a widely recognized approach, effectively captures the average marginal impact and significance of participants within the coalition (Shapley, 1953; Jin et al., 2018). In the context of multi-energy sharing, a prosumer’s marginal contribution, contingent upon their involvement in the coalition, serves as the basis for estimating their individual costs or benefits. For an
where
3.3.2 The Nucleolus
An alternative value function for a cooperative game is the Nucleolus, which represents a unique point within the Core, provided the Core is non-empty (Solymosi and Sziklai, 2016). To grasp the concept of the Nucleolus, let
3.3.3 The N-H solution
The N-H allocation seeks to maximize the difference between the profit generated from cooperation within a grand coalition and the scenario where no cooperation occurs, ensuring that all players gain equally (Wu et al., 2017). This solution must also adhere to the Core conditions, as specified in Equations 29–31. The formulation of this concept is detailed as follows:
3.4 Fairness evaluation criteria
While benefit distribution strategies derived from the three distribution mechanisms are encompassed within the core, certain participants may perceive these allocations as inequitable. Consequently, it is imperative to assess the fairness of the distribution mechanism. To assess the fairness of the distribution program from multiple perspectives, we introduce Shapley-Shubik Power index, Jain’s fairness index, and Gini coefficient in assessing the fairness of the distribution scheme (Wu et al., 2017; Soares et al., 2024).
For the Shapley-Shubik Power index, the degree of equity in the allocation outcomes is inversely proportional to the value of the Fairness Index
where
Jain’s fairness index (JFI) is also one of the most widely used criterion to measure fairness. JFI is calculated by dividing the square of the total sum of individual gains by the sum of the squares of individual gains, then multiplying by the number of users. In resource allocation contexts, “individual gains” typically refer to the amount of resources or benefits each user receives. The index ranges from
where
Another widely used fairness index is the
where
3.5 Model solving
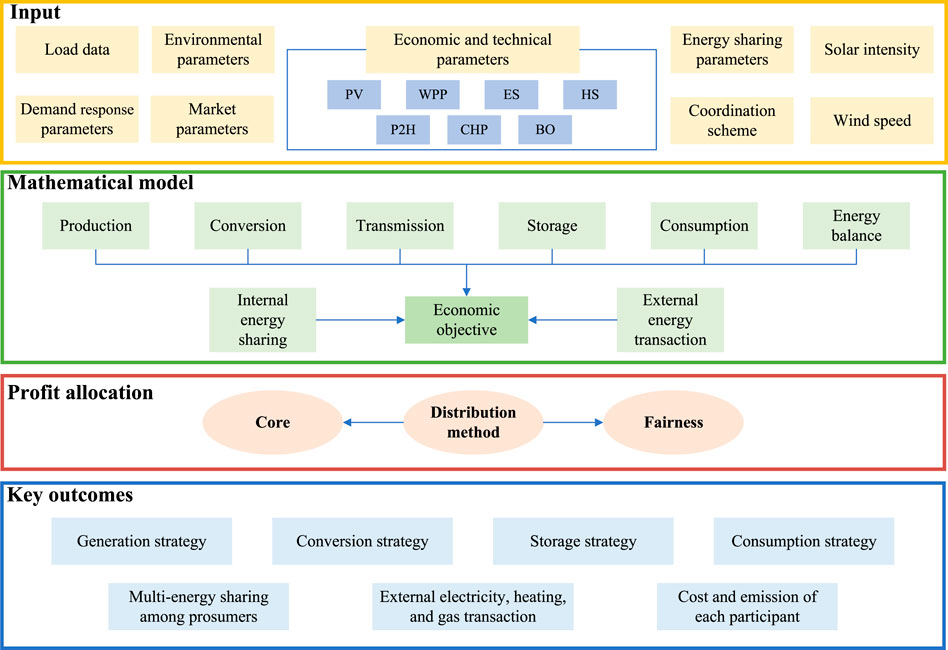
The decision-making process for multi-energy sharing and cost allocation among sharing participants is illustrated in Figure 2. To solve the optimization problem presented in our multi-energy sharing framework, we employ a two-stage approach:
1. Social Welfare Maximization: We use a Mixed Integer Linear Programming (MILP) solver to maximize the social welfare function (Equations (27) and (28)) subject to the constraints outlined in sections 3.1 and 3.2. Specifically, we utilize the Matlab and Gurobi optimizer due to its efficiency in handling large-scale MILP problems.
2. Cooperative Surplus Distribution: After obtaining the optimal solution for social welfare maximization, we apply the Shapley value, The Nucleolus, and N-H solution to distribute the cooperative surplus (Equations 29–34). The fairness evaluation criteria are then used to assess the fairness of the distribution mechanisms (Equations 35–38).
This two-stage approach allows us to efficiently solve the complex optimization problem while ensuring a fair distribution of benefits among participants.
4 Case study
4.1 Basic data
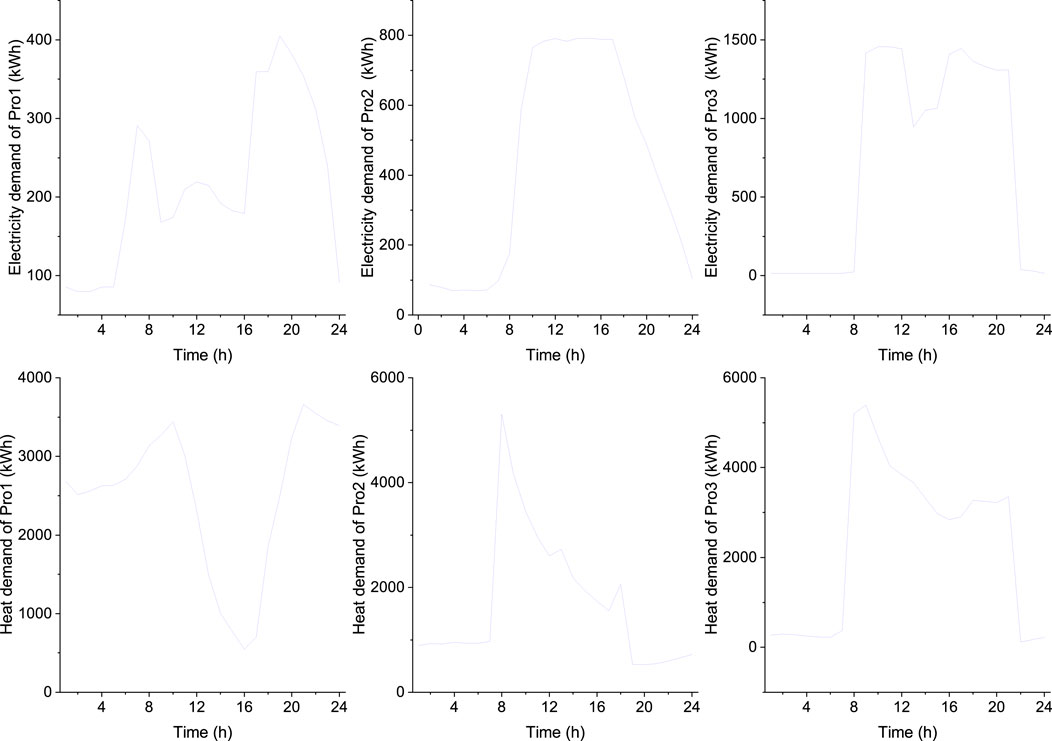
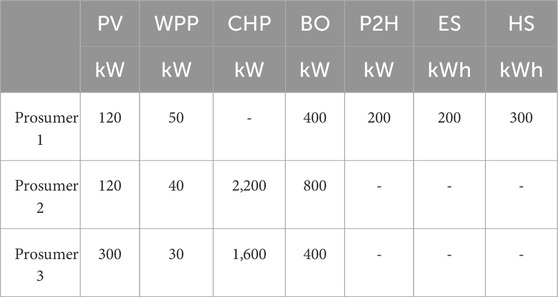
To assess the efficacy of the proposed multi-energy sharing model, we examined the strategic decision-making processes of residential, office, and commercial prosumers under different ownership structures in Dalian, China. Situated in a temperate climate zone, Dalian’s electricity and heating demand profiles are illustrated in Figure 3 (Li, 2017). The study encompasses two residential clusters, one office cluster, and one commercial cluster, with respective floor areas of 100,000, 50,000, and 50,000 square meters. Table 1 delineates the equipment capacities for each prosumer.
Table 2 outlines the time-of-use (TOU) tariffs for electricity and heat supplied by municipal energy entities. The electricity feed-in tariff is fixed at $0.04/kWh, while natural gas is priced at $0.032/kWh. Operation and maintenance costs are derived from (Li and Zhang, 2021b). The combined heat and power generation efficiency is set at 0.38. Storage systems operate with 0.95 charging and discharging efficiencies, power-to-heat systems achieve an efficiency of 3, and gas boilers function at 0.85 efficiency (Nielsen et al., 2016). The model incorporates demand response strategies, including both electrical and thermal load shifting. Buildings are equipped with various flexible loads, such as electric vehicles, air conditioning systems, and household appliances (e.g., washing machines, dryers, dishwashers). Thermal flexible loads encompass heating for air conditioning and domestic hot water systems. The maximum energy demand shift is capped at 20% (Alipour et al., 2017). Emission factors for externally sourced electricity, heat, and natural gas are 0.95 kg/kWh, 0.43 kg/kWh, and 0.18 kg/kWh, respectively (Hou et al., 2021; Li and Yu, 2020). To evaluate the environmental impact of energy sharing, a carbon tax of $15.27/t is applied (Sun et al., 2020).
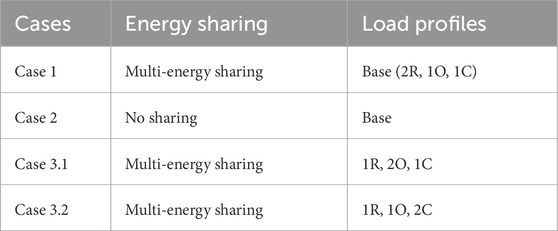
Multiple scenarios are devised to investigate the influence of building types and sharing strategies on the economic and environmental performance of the systems, as detailed in Table 3.
Case 1 serves as a baseline scenario where all prosumers engage in electricity and heat sharing. The load profile, depicted in Figure 3, comprises two residential clusters (R), one office cluster (O), and one commercial cluster (C), each spanning 50,000 square meters, totaling 200,000 square meters. Case 2, the no-sharing scenario, simulates a real-world situation where each prosumer operates autonomously. A comparative analysis of these two cases in Section 4.2 elucidates the economic and environmental advantages of energy sharing. To further explore the impact of diverse building types on energy sharing performance, Cases 3.1 and 3.2 are established, maintaining a constant total floor area but varying the composition of residential, office, and commercial clusters. This analysis is elaborated in Section 4.3. These scenarios facilitate a comprehensive examination of how building types and sharing strategies influence both economic and environmental outcomes, offering valuable insights into the benefits of multi-energy sharing models in urban contexts.
4.2 Impact of energy sharing on economic and environmental performance of prosumers
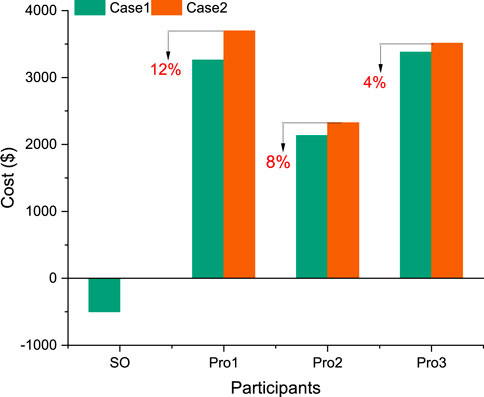
Figure 4 illustrates the financial outcomes for participants in Case 1 and Case 2. Case one represents a scenario where electricity and heat are shared among prosumers, while Case 2 simulates a real-world situation where all participants operate independently. A comparative analysis reveals substantial economic disparities between the two scenarios. For each entity (SO, Pro1, Pro2, and Pro3), expenses in Case 1 are consistently lower than in Case 2. In the following two subsections, the Shapley value is used to distribute the cooperative surplus. The other allocation methods will be compared in Section 4.4. The multi-energy sharing model in Case 1 results in a total cost of $8,276.45 for prosumers, which is 13.19% lower than the $9,533.97 in Case 2. Notably, Pro1 achieves the highest cost reduction (12%) through energy sharing, while Pro2 and Pro3 realize savings of 8% and 4%, respectively. The System Operator (SO) also derives financial benefits from the sharing arrangement. This cost reduction primarily stems from increased interactions among internal prosumers and decreased reliance on external energy entities, which typically impose higher time-of-use prices and offer lower feed-in tariff rates. These findings demonstrate that the multi-energy sharing framework effectively integrates local resources, minimizes overall system costs, and enhances benefits for all stakeholders, particularly Pro1.
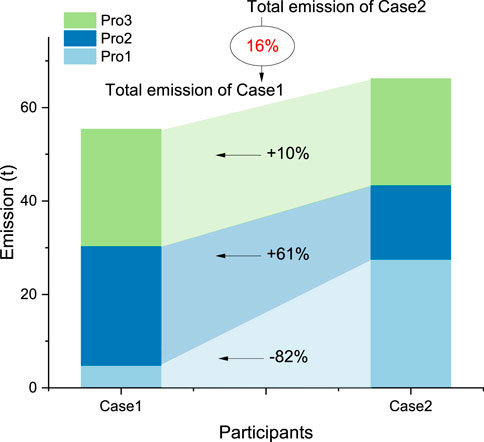
Figure 5 presents a comparison of carbon emissions between Case 1 and Case 2 for different prosumers (Pro1, Pro2, and Pro3), including the percentage change in emissions for Case 2 relative to Case 1. Overall, total emissions in Case 1 are 16% lower than in Case 2. For Prosumer 1, emissions in Case 1 decreased dramatically by 82%, from 27.55 tons to 4.85 tons, indicating that individual operation was less efficient for Pro1, or that increased generation and grid transactions in Case 2 led to higher emissions. Conversely, emissions for Prosumer two and Prosumer three increased by 61% and 10%, respectively. This increase is attributed to Pro2 and Pro3 functioning as energy sellers during most periods. Although emissions for Pro2 and Pro3 rise, their costs decrease, and the total emissions of the entire system are reduced.
Figure 6 illustrates the energy sharing strategies of prosumers in Case 1, detailing both electricity and heat sharing patterns. Positive values indicate energy purchasing, while negative values represent energy selling in the sharing market. The electricity sharing strategies in Figure 6A reveal distinct patterns among the three prosumers. Pro1 predominantly acts as a net consumer of electricity, showing positive values for most of the day. In contrast, Pro2 and Pro3 alternate between being net consumers and suppliers at different times.
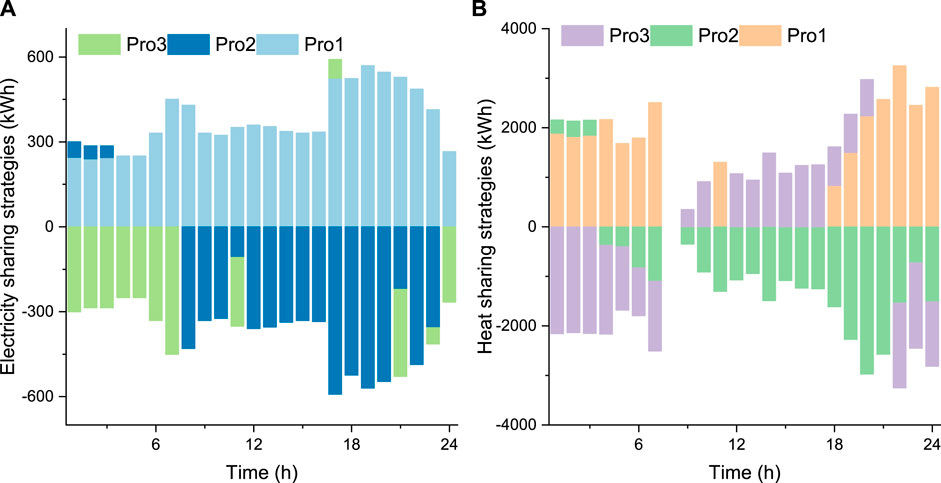
Figure 6. Energy sharing strategies of prosumers in Case 1: (A) electricity sharing; (B) heat sharing.
The heat sharing strategies in Figure 6B exhibit more pronounced fluctuations and larger magnitudes compared to electricity sharing. This suggests that thermal energy sharing plays a crucial role in the community’s energy balance. Pro1 consistently acts as a major heat consumer during both nighttime and daytime hours. Pro2 and Pro3 display complementary behaviors in heat sharing: when one is a net supplier, the other tends to be a net consumer. This complementarity indicates effective load balancing and resource utilization within the community.
The results demonstrate that energy sharing significantly enhances interactions among internal prosumers. By enabling prosumers to exchange energy based on their individual surpluses and deficits, the community improves both economic and environmental performance, as evidenced in Figures 4, 5. Energy sharing also achieves better overall energy balance, potentially reducing dependence on external grids and improving self-sufficiency. The complementary roles of different prosumers in both electricity and heat sharing contribute to a more efficient and balanced local energy system, underscoring the potential benefits of collaborative energy management strategies.
4.3 Impact of varied load profiles on economic and environmental performance of energy-sharing prosumers
This section maintains a constant total floor area of 200,000 square meters while analyzing cost-saving and emission reduction ratios by adjusting the proportions of different building types. This approach allows us to examine how various building compositions influence energy sharing. As outlined in Section 4.1 and Table 3, we establish Case 3.1 and Case 3.2 based on Case 1 by reducing residential floor area and increasing office and commercial building cluster areas, respectively.
Figure 7 illustrates the cost-saving and emission reduction ratios when comparing individual operation scenarios under different load profiles in Cases 1, 3.1, and 3.2. Figure 7A depicts cost-saving ratios for different prosumers across cases, clearly showing that adjusting building type proportions significantly impacts each prosumer’s cost-saving ratio. Figure 7B presents overall cost-saving and emission reduction ratios for each case. Case 3.2 achieves the highest cost-saving ratio (19.44%), followed by Case 1 (13.19%) and Case 3.1 (7.26%). The increasing cost-saving ratio from Case 3.1 to Case 1 and Case 3.2 indicates that modifying the proportions of residential, office, and commercial buildings can substantially enhance cost efficiency. Similarly, emission reduction ratios are highest in Case 3.2 (23.35%), followed by Case 1 (16.36%) and Case 3.1 (10.83%). The parallel trends in emission reduction and cost-saving ratios compared to individual operation scenarios suggest that optimizing building type proportions can significantly improve both economic and environmental performance. Among the three cases, Case 3.2 demonstrates superior performance in both cost savings and emission reduction, indicating a synergistic effect of optimizing building type proportions for both economic and environmental benefits. These findings support the strategic adjustment of building type proportions as an effective means to optimize energy sharing, reduce costs, and minimize carbon emissions.
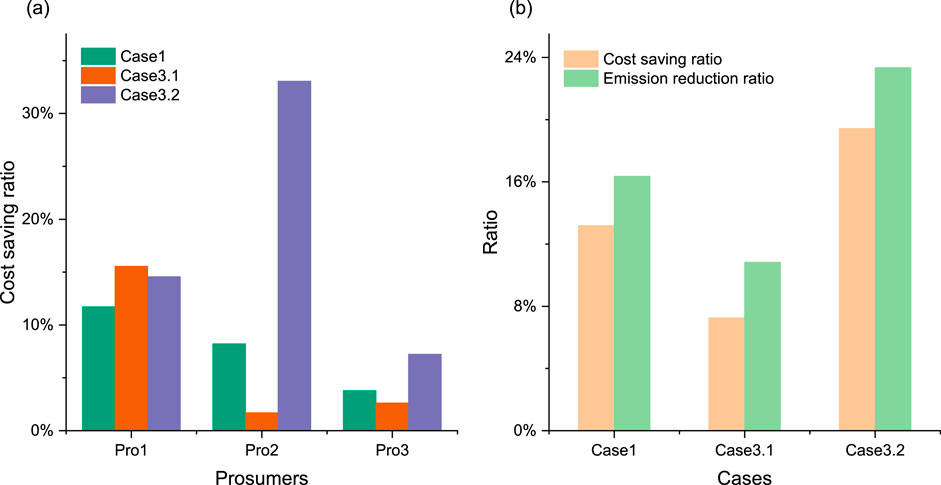
Figure 7. Impact of varied load profiles on economic and environmental performance of energy prosumers: (A) cost saving ratios for different prosumers; (B) overall cost-saving and emission reduction ratios for each case.
Figure 8 comprises four sub-figures (a, b, c, and d) illustrating various aspects of energy sharing among prosumers in Cases 1, 3.1, and 3.2. The electricity sharing patterns, heat sharing patterns, total energy sharing quantities, and total prosumer costs are analyzed to provide insights into how building type composition affects energy sharing strategies. Electricity sharing patterns in Figure 8A vary significantly across the three cases and throughout the day. Case 3.2 exhibits the highest peaks in electricity sharing, particularly during hours 9–21. Cases 3.1 and one display lower overall sharing quantities, with Case 3.1 showing the least variation. Heat sharing demonstrates distinct patterns compared to electricity sharing, as shown in Figure 8B. Case 1 exhibits the highest heat sharing quantities, with significant peaks during early morning hours (1–7) and evening hours (21–24). Cases 3.1 and 3.2 display lower heat sharing quantities, with Case 3.2 showing the least variation. These differences likely stem from the varying building type compositions in each case.
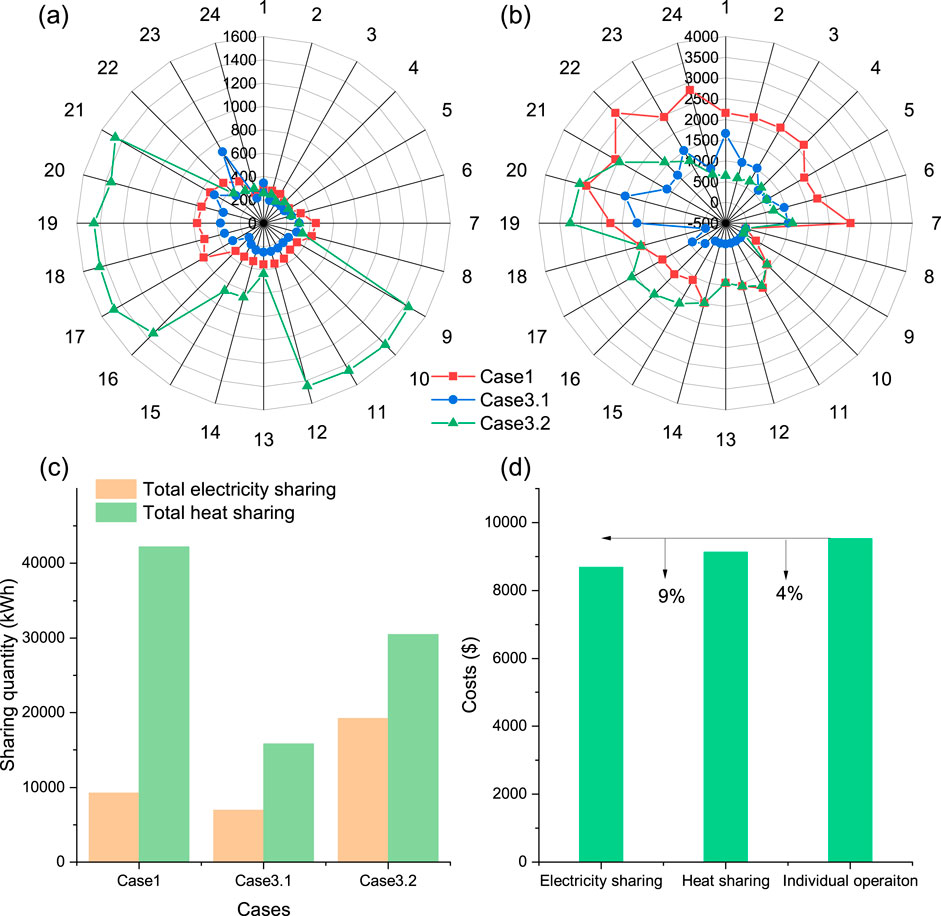
Figure 8. Multi-energy sharing strategies of prosumers in three cases: (A) electricity sharing during each period; (B) heat sharing during each period; (C) total energy sharing quantity; (D) total cost of prosumers considering electricity sharing and heat sharing.
As illustrated in Figure 8C, total energy sharing quantities are substantially higher for heat sharing than for electricity sharing across all cases. Moreover, Case 1 shows the highest total heat sharing, while Case 3.2 shows the highest electricity sharing. The predominance of heat sharing over electricity sharing suggests that multi-energy management offers greater potential for prosumers. The variation across cases further emphasizes how building type composition significantly influences energy sharing opportunities. The cost comparison in Figure 8D reveals that energy sharing leads to substantial cost reductions compared to individual operation. By comparing the contribution of cost reduction from electricity sharing and heat sharing, it is found that electricity sharing alone accounts for a 9% cost reduction, indicating a more substantial impact on cost savings than heat sharing. This is the primary reason for the high cost-saving ratio in Case 3.2 shown in Figure 7B.
4.4 Fairness of the distribution schemes
Table 4 presents a comparative fairness evaluation of three distribution schemes—Shapley value, Nucleolus, and N-H solution—within a multi-energy sharing framework in Case 1. The participants, denoted as SO, Pro1, Pro2, and Pro3, represent various agents involved in the energy sharing process. The fairness evaluation employs three indices: Shapley-Shubik power based Fairness Index (FI), Jain’s Fairness Index (JFI), and

Table 4. Fairness evaluation of three distribution schemes under the multi-energy sharing framework.
The Shapley value method yields a balanced distribution among participants, as evidenced by its moderate fairness indices: a Shapley-Shubik FI of 0.495 and a Jain’s FI of 0.803. The
The Shapley-Shubik power based FI offers insights into the fairness of distribution based on the concept of power in coalitions, with the N-H solution performing best in this regard. However, Jain’s FI, which measures the equality of distribution, ranks the N-H solution highest. This suggests that while the Nucleolus may prioritize fairness in coalition excess reduction, it may not necessarily ensure equal distribution among participants.
The selection of a distribution scheme depends on the specific objectives. If minimizing excess and ensuring coalition fairness are paramount, the Nucleolus scheme is most appropriate. Conversely, if equal distribution among participants is the primary concern, the N-H solution offers a more balanced approach. The Shapley value strikes a middle ground, providing a moderate balance between fairness and equality. These findings underscore the trade-offs between different fairness objectives and highlight the significant impact of the distribution mechanism on participants’ perceived fairness.
4.5 The potential impacts and limitations
The results of our study highlight several important potential impacts. First, the demonstrated cost savings for participants could serve as a strong incentive for the broader adoption of distributed energy resources and energy-sharing schemes. Additionally, the observed reductions in carbon dioxide emissions indicate that this multi-energy sharing framework could play a valuable role in supporting decarbonization efforts in the energy sector. Furthermore, the integration of thermal energy management into the sharing framework has the potential to optimize energy efficiency and cost-effectiveness, especially in diverse building environments that require both electricity and heat management.
To achieve multi-energy sharing, several challenges must be addressed, along with potential solutions. (1) Infrastructure upgrades. Implementing the framework requires advanced metering, communication, and control systems to enable real-time energy sharing and coordination. Upgrading the existing infrastructure, especially in older buildings and communities, may pose significant financial and logistical hurdles. A phased approach could be considered, starting with pilot projects in newer buildings or communities that already have compatible infrastructure, and then gradually expanding the framework as technologies become more accessible and cost-effective. (2) Prosumers’ engagement. Another challenge is that prosumers may be reluctant to participate due to the perceived complexity of the system or concerns about losing control over their energy usage. To address this, we propose the development of user-friendly interfaces and automated systems that simplify participation. In addition, educating users about the long-term benefits of energy sharing, including potential cost savings and environmental impacts, could help increase participation. Providing clear, transparent information on how the system operates will also build trust and encourage engagement.
However, we also acknowledge certain limitations. First, this study does not account for external factors such as energy policy and market competition, both of which can have significant impacts on the actual implementation of energy-sharing models. In future research, we plan to explore how these external factors affect the economic and environmental outcomes of energy sharing, and how the framework can be adapted to address these influences. Second, while this study focuses on economic and environmental benefits, we recognize the importance of incorporating risk-sharing mechanisms in future iterations of the framework. As energy systems are increasingly exposed to extreme weather events and other hazards, resilience will become a critical factor. Future research will aim to extend our current framework by integrating risk-sharing strategies among prosumers to ensure equitable distribution of both benefits and risks. This will help develop a more robust and resilient energy-sharing model suitable for a variety of future applications.
5 Conclusion
This study introduces a multi-energy sharing framework under centralized coordination for prosumers, utilizing the cost or profit distribution methods for comprehensive day-ahead scheduling. This approach integrates energy production, conversion, storage, demand response, and sharing strategies among stakeholders. The research highlights the economic and environmental benefits of coordinated multi-prosumer energy sharing, emphasizing the complementary roles of different prosumers in both electricity and heat sharing. This coordination leads to a more efficient and balanced local energy system.
Key findings indicate that the multi-energy sharing framework substantially reduces total system costs and increases stakeholder benefits. The analysis reveals that adjusting the proportions of different building types significantly impacts cost savings and emission reductions for each prosumer, influencing energy sharing patterns and quantities. The strategic adjustment of building type proportions emerges as a critical factor for optimizing energy sharing, reducing costs, and minimizing carbon emissions. The study also evaluates the fairness of the different allocation schemes. According to the performance evaluation of three alternative cost distribution schemes, the Shapely value and N-H solution may be recognized to be the most acceptable allocation scheme, from the fairness perspective.
Data availability statement
The original contributions presented in the study are included in the article/supplementary material, further inquiries can be directed to the corresponding authors.
Author contributions
JZ: Data curation, Writing–original draft. PW: Conceptualization, Writing–original draft. QW: Data curation, Software, Writing–review and editing. ML: Methodology, Software, Writing–review and editing. XL: Methodology, Writing–review and editing. GHu: Formal Analysis, Visualization, Writing–original draft. GHe: Formal Analysis, Writing–review and editing. SY: Formal Analysis, Writing–review and editing. LL: Conceptualization, Funding acquisition, Supervision, Writing–review and editing.
Funding
The author(s) declare that financial support was received for the research and/or publication of this article. This work was supported by the National Natural Science Foundation of China (72274184, 71904179) and the China Southern Power Grid Innovation Program (YNKJXM20230013).
Conflict of interest
Authors JZ, QW, XL, GHu, GHe, and SY were employed China Southern Power Grid. Author ML was employed by Yunnan Power Grid Corp.
The remaining authors declare that the research was conducted in the absence of any commercial or financial relationships that could be construed as a potential conflict of interest.
Correction Note
A correction has been made to this article. Details can be found at: 10.3389/fenrg-2025-1634044.
Publisher’s note
All claims expressed in this article are solely those of the authors and do not necessarily represent those of their affiliated organizations, or those of the publisher, the editors and the reviewers. Any product that may be evaluated in this article, or claim that may be made by its manufacturer, is not guaranteed or endorsed by the publisher.
References
Alipour, M., Zare, K., and Abapour, M. (2017). Minlp probabilistic scheduling model for demand response programs integrated energy hubs. IEEE Trans. Industrial Inf. 14, 79–88. doi:10.1109/tii.2017.2730440
Bui, V. H., Hussain, A., and Kim, H. M. (2016). A multiagent-based hierarchical energy management strategy for multi-microgrids considering adjustable power and demand response. IEEE Trans. Smart Grid 9, 1323–1333. doi:10.1109/tsg.2016.2585671
Fan, W., Fan, Y., Yao, X., Yi, B., Jiang, D., and Wu, L. (2024). Distributed transaction optimization model of multi-integrated energy systems based on nash negotiation. Renew. Energy 225, 120196. doi:10.1016/j.renene.2024.120196
Faraji, J., Vallée, F., and De Grève, Z. (2024). A preference-informed energy sharing framework for a renewable energy community. IEEE Trans. Energy Mark. Policy Regul., 1–16. doi:10.1109/tempr.2024.3415123
Gao, H., Cai, W., He, S., Liu, C., and Liu, J. (2023). Stackelberg game based energy sharing for zero-carbon community considering reward and punishment of carbon emission. Energy 277, 127629. doi:10.1016/j.energy.2023.127629
Hou, J., Wang, J., Zhou, Y., and Lu, X. (2021). Distributed energy systems: multi-objective optimization and evaluation under different operational strategies. J. Clean. Prod. 280, 124050. doi:10.1016/j.jclepro.2020.124050
Jia, H., Wang, X., Jin, X., Cheng, L., Mu, Y., Yu, X., et al. (2024). Optimal pricing of integrated community energy system for building prosumers with p2p multi-energy trading. Appl. Energy 365, 123259. doi:10.1016/j.apenergy.2024.123259
Jin, Y., Chang, C. T., Li, S., and Jiang, D. (2018). On the use of risk-based shapley values for cost sharing in interplant heat integration programs. Appl. Energy 211, 904–920. doi:10.1016/j.apenergy.2017.11.097
Kumar, A., Kiran, D., and Padhy, N. P. (2024). Pricing strategy for local power-sharing between distribution network and microgrid operators. Int. J. Electr. Power and Energy Syst. 157, 109820. doi:10.1016/j.ijepes.2024.109820
Li, L. (2017). “Benefits evaluation of building-scale and district-scale cooling heating and power system,” in thesis, Benefits evaluation of building-scale and district-scale cooling heating and power system.
Li, L. (2021). Coordination between smart distribution networks and multi-microgrids considering demand side management: a trilevel framework. Omega 102, 102326. doi:10.1016/j.omega.2020.102326
Li, L., and Yu, S. (2020). Optimal management of multi-stakeholder distributed energy systems in low-carbon communities considering demand response resources and carbon tax. Sustain. Cities Soc. 61, 102230. doi:10.1016/j.scs.2020.102230
Li, L., and Zhang, S. (2021a). Peer-to-peer multi-energy sharing for home microgrids: an integration of data-driven and model-driven approaches. Int. J. Electr. Power and Energy Syst. 133, 107243. doi:10.1016/j.ijepes.2021.107243
Li, L., and Zhang, S. (2021b). Techno-economic and environmental assessment of multiple distributed energy systems coordination under centralized and decentralized framework. Sustain. Cities Soc. 72, 103076. doi:10.1016/j.scs.2021.103076
Li, L., Zhang, S., Cao, X., and Zhang, Y. (2021). Assessing economic and environmental performance of multi-energy sharing communities considering different carbon emission responsibilities under carbon tax policy. J. Clean. Prod. 328, 129466. doi:10.1016/j.jclepro.2021.129466
Liu, Y., Zuo, K., Liu, X. A., Liu, J., and Kennedy, J. M. (2018). Dynamic pricing for decentralized energy trading in micro-grids. Appl. energy 228, 689–699. doi:10.1016/j.apenergy.2018.06.124
Minuto, F. D., and Lanzini, A. (2022). Energy-sharing mechanisms for energy community members under different asset ownership schemes and user demand profiles. Renew. Sustain. Energy Rev. 168, 112859. doi:10.1016/j.rser.2022.112859
Mota, B., Faria, P., and Vale, Z. (2024). Energy cost optimization through load shifting in a photovoltaic energy-sharing household community. Renew. Energy 221, 119812. doi:10.1016/j.renene.2023.119812
Nielsen, M. G., Morales, J. M., Zugno, M., Pedersen, T. E., and Madsen, H. (2016). Economic valuation of heat pumps and electric boilers in the Danish energy system. Appl. Energy 167, 189–200. doi:10.1016/j.apenergy.2015.08.115
Schwidtal, J. M., Piccini, P., Troncia, M., Chitchyan, R., Montakhabi, M., Francis, C., et al. (2023). Emerging business models in local energy markets: a systematic review of peer-to-peer, community self-consumption, and transactive energy models. Renew. Sustain. Energy Rev. 179, 113273. doi:10.1016/j.rser.2023.113273
Shapley, L. S. (1953). A value for n-person games. Contributions Theory Games 2, 307–317. doi:10.1515/9781400829156-012
Soares, J., Lezama, F., Faia, R., Limmer, S., Dietrich, M., Rodemann, T., et al. (2024). Review on fairness in local energy systems. Appl. Energy 374, 123933. doi:10.1016/j.apenergy.2024.123933
Solymosi, T., and Sziklai, B. (2016). Characterization sets for the nucleolus in balanced games. Operations Res. Lett. 44, 520–524. doi:10.1016/j.orl.2016.05.014
Sun, Y., Zhi, Y., and Zhao, Y. (2020). Indirect effects of carbon taxes on water conservation: a water footprint analysis for China. J. Environ. Manag. 279, 111747. doi:10.1016/j.jenvman.2020.111747
Wang, D., Zhang, C., Li, J., Zhu, L., Zhou, B., Zhou, Q., et al. (2024a). A novel interval power flow method based on hybrid box-ellipsoid uncertain sets. IEEE Trans. Power Syst. 39, 6111–6114. doi:10.1109/tpwrs.2024.3391921
Wang, X., Jia, H., Jin, X., Mu, Y., Wei, W., Yu, X., et al. (2024b). Bi-level optimal operations for grid operator and low-carbon building prosumers with peer-to-peer energy sharing. Appl. Energy 359, 122723. doi:10.1016/j.apenergy.2024.122723
Wu, Q., Ren, H., Gao, W., and Ren, J. (2017). Benefit allocation for distributed energy network participants applying game theory based solutions. Energy 119, 384–391. doi:10.1016/j.energy.2016.12.088
Yan, D., Li, T., Zhao, C., Wang, H., and Chen, Y. (2024b). Hierarchical game for coupled power system with energy sharing and transportation system. IEEE Trans. Transp. Electrification, 1. doi:10.1109/tte.2024.3398988
Yan, X., Gao, C., Meng, J., and Abbes, D. (2024a). An analytical target cascading method-based two-step distributed optimization strategy for energy sharing in a virtual power plant. Renew. Energy 222, 119917. doi:10.1016/j.renene.2023.119917
Yang, J., Xu, W., Ma, K., and Li, C. (2022). A three-stage multi-energy trading strategy based on p2p trading mode. IEEE Trans. Sustain. energy 14, 233–241. doi:10.1109/tste.2022.3208369
Zhang, C., Liu, Q., Zhou, B., Chung, C. Y., Li, J., Zhu, L., et al. (2022). A central limit theorem-based method for dc and ac power flow analysis under interval uncertainty of renewable power generation. IEEE Trans. Sustain. Energy 14, 563–575. doi:10.1109/tste.2022.3220567
Zhang, K., Gao, C., Zhang, G., Xie, T., and Li, H. (2024b). Electricity and heat sharing strategy of regional comprehensive energy multi-microgrid based on double-layer game. Energy 293, 130655. doi:10.1016/j.energy.2024.130655
Zhang, Y., Robu, V., Cremers, S., Norbu, S., Couraud, B., Andoni, M., et al. (2024a). Modelling the formation of peer-to-peer trading coalitions and prosumer participation incentives in transactive energy communities. Appl. Energy 355, 122173. doi:10.1016/j.apenergy.2023.122173
Keywords: economic performance, environmental performance, energy prosumers, multi-energy sharing, load profiles
Citation: Zeng J, Wang P, Wang Q, Liu M, Liu X, Huang G, He G, Yao S and Li L (2024) Performance analysis of multi-energy sharing prosumers considering different load profiles. Front. Energy Res. 12:1470769. doi: 10.3389/fenrg.2024.1470769
Received: 26 July 2024; Accepted: 11 November 2024;
Published: 22 November 2024; Corrected: 09 June 2025.
Edited by:
Zhong Ge, Yunnan University, ChinaReviewed by:
Cong Zhang, Hunan University, ChinaBAI Xiaoxia, Yunnan University, China
Fanhan Liu, Jiaxing University, China
Copyright © 2024 Zeng, Wang, Wang, Liu, Liu, Huang, He, Yao and Li. This is an open-access article distributed under the terms of the Creative Commons Attribution License (CC BY). The use, distribution or reproduction in other forums is permitted, provided the original author(s) and the copyright owner(s) are credited and that the original publication in this journal is cited, in accordance with accepted academic practice. No use, distribution or reproduction is permitted which does not comply with these terms.
*Correspondence: Longxi Li, bGlseEBjdWcuZWR1LmNu; Peng Wang, d2FuZ3BlbmdAbXMuZ2llYy5hYy5jbg==
 Jincan Zeng1
 Peng Wang
 Longxi Li