 Yuanyuan Li1
 Shuyan Zhang
- 1Beijing Key Laboratory of Research and System Evaluation of Power, China Electric Power Research Institute, Power Automation Department, Beijing, China
- 2PKU-Changsha Institute for Computing and Digital Economy, Changsha, China
Introduction: This paper constructs a revenue model for an independent electrochemical energy storage (EES) power station with the aim of analyzing its full life-cycle economic benefits under the electricity spot market.
Methods: The model integrates the marginal degradation cost (MDC), energy arbitrage, ancillary services, and annual operation and maintenance (O&M) costs to calculate the net profits of the EES power station. Using an iterative optimization approach, we determine the optimal MDC and analyze the economic end of life (EOL) for different types of EES power stations.
Results: By examining real-world examples from the California energy market, we find that the full life-cycle benefits of an EES power station peak when its MDC is optimal, at $45/MWh-throughput. Under these conditions, the economic and physical EOL of commercial/industrial EES power station is 9 years, while the economic EOL of residential-grade EES power station is 8 years, which is shorter than their physical EOL of 9 years.
Discussion: The study further indicates that the economic life of an EES power station is influenced by multiple factors, and operators need to determine the optimal economic EOL to maximize revenue based on battery degradation characteristics, market conditions and operational strategy.
1 Introduction
With the global energy structure transition and the large-scale integration of renewable energy, research on energy storage technologies and their supporting market mechanisms has become the focus of current market domain (Zhu et al., 2024). Electrochemical energy storage (EES) not only provides effective energy storage solutions but also offers new business opportunities and operational strategies for electricity market participants. At present, the configuration of energy storage projects mainly focuses on the source-side renewable energy configuration and independent energy storage applications.
In some areas, energy storage is applied in the frequency regulation market transactions in the form of an integrated system (Zhang and Wang, 2021), (Liang et al., 2021). From the perspective of specific practices, energy storage is primarily bundled with thermal power, wind power, and photovoltaic in the form of a consortium to participate in market transactions in the early stages (Chen et al., 2021), (Zhu et al., 2022). However, due to the small scale of EES devices in integrated systems, their effectiveness in achieving time-shifting of electrical energy and promoting peak shaving and valley filling is limited (Wang et al., 2024). With the rapid development of renewable energy, the power system urgently needs independent energy storage to participate in the electricity market (He et al., 2022). Independent EES systems, with their fast response and efficient charging and discharging characteristics, bring new vitality and opportunities to the electricity spot market, especially in promoting the integration of renewable energy, improving system reliability, and optimizing energy utilization efficiency.
From the perspective of top-level design, EES will recover most of its revenue through the electricity market, especially the spot market. The operation mechanism involves industrial and commercial users obtaining the electricity prices for each time period of the following day based on the clearing results of the day-ahead electricity market. Combining the capacity, cycle efficiency of the EES power station, and the load forecast for the next day, the charging and discharging plan of the power station is formulated. During the low price periods, the EES power station acts as an electricity demand-side participant, purchasing electricity from the grid at relatively lower prices to charge the batteries and store cheap electricity (Sakti et al., 2017), (Xu et al., 2018). During the peak price periods, which usually coincide with the peak load periods, the EES power station switches to an electricity supply-side participant, with the storage batteries supplying electricity to the load and outputting to the grid, realizing peak load shifting and obtaining price difference revenue from peak-valley price arbitrage (Padmanabhan et al., 2020; Hesse et al., 2019; Fares and Webber, 2018). Through the flexible operation of the above-mentioned dual roles, the EES power station can earn arbitrage profits from the fluctuations of intraday power load and spot prices, becoming an important profit-increasing entity in the electricity spot market. Cui et al. (2021) and his partner proposed an optimal operation strategy with the goal of maximizing the expected revenue by considering the operating cost of the storage device and the prediction deviation of the new energy generation, so as to avoid the loss of revenue caused by the prediction deviation. For the problem of bidding strategy in the integrated system electric energy spot market, the researchers propose a spot declaration strategy aiming at maximising the expected benefits, which is applied to the electric energy spot market trading (Schram et al., 2020).
When rare high price differentials become part of the revenue, a longer calendar life may be more beneficial for energy arbitrage than an extended cycle life (Kumtepeli et al., 2020). In addition, EES power stations can also utilize their flexible and fast charging and discharging regulation capabilities to provide backup services, frequency regulation, and other ancillary services to the power grid, obtaining service revenue by participating in the bidding of the electricity ancillary service market or signing long-term agreements, which becomes an important way for the commercialized operation of EES power stations.
The core elements of an EES power station are energy transmission, battery management, and potential application scenarios in the power system. As an independent entity participating in the electricity spot market, the EES power station gains revenue during the battery energy transmission process. This paper aims to construct a revenue model for an independent EES power station that comprehensively considers the above factors to analyze its economic benefits in the electricity spot market. By studying the profit model of EES power stations in the electricity spot market, under limited battery life and different electricity price fluctuations, the owners and operators of EES power stations consider the marginal degradation cost (MDC) and annual operation and maintenance (O&M) costs. At the same time, they optimize the battery charging and discharging plan through operational decisions to extend battery life and improve the revenue of the EES power station. This research provides a new perspective for the operators of EES power stations, helping them better understand the economic potential of the EES station and formulate corresponding operation strategies to maximize revenue. Furthermore, this research also contributes to promoting the healthy development and market application of EES technology.
2 Methods
2.1 EES power station profit model
As an independent market entity, the EES power station needs to interact and collaborate with the power grid and users through electricity market mechanisms and technical means to ensure project revenue. The business model of an independent EES power station participating in the electricity market transactions is shown in Figure 1. Currently, energy storage only participates in the market as a spot price taker, usually reporting quantity without reporting price. From the declaration perspective, energy storage only needs to declare the next day’s charging and discharging dispatch curve in the day-ahead market. On the operation day, the charging and discharging are arranged according to the actual cleared power plan, and the actual clearing depends on the power grid dispatch arrangement. Theoretically, the power grid will prioritize dispatching according to the energy storage declaration curve, and the actual charged and discharged electricity is settled at the spot price.
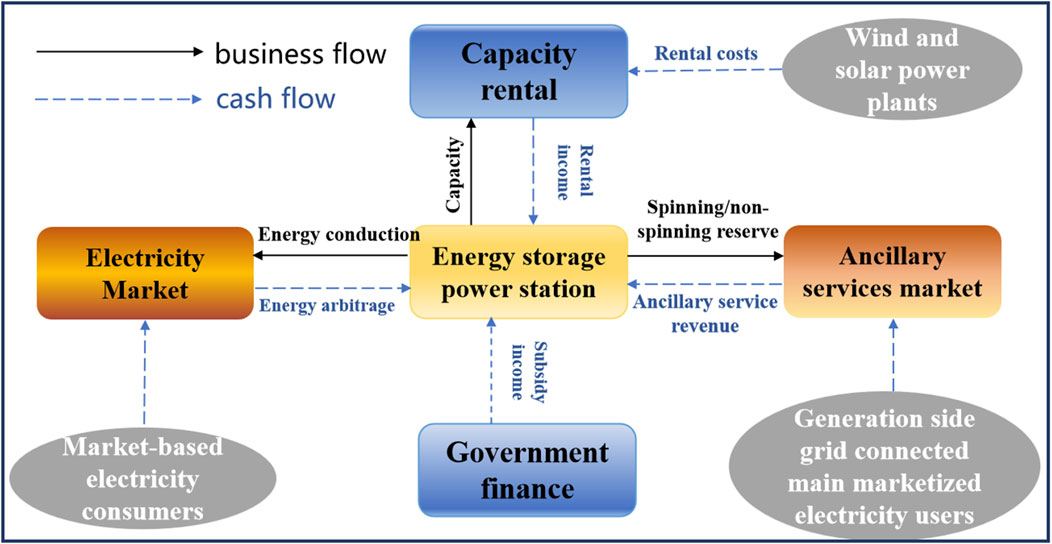
Figure 1. Graphical illustration of the business model for participation of EES plants in electricity market trading.
Based on the analysis of the main revenue and operating costs of the EES power station, and combining the short-term dispatch and long-term decision models, this paper adopts an itemized method to calculate the net operating revenue of the EES power station over its entire life cycle. The mathematical formula of the model is as follows (1)--(8):
Formula 1 utilizes the exponential discount factor (
2.2 Parameter settings
We utilize the net revenue model of the EES power station to simulate the life-cycle operation of the energy storage power station and analyze the main revenue items of the EES power station under the electricity spot market. The main parameters and data used in the analysis case are as follows: We use the local marginal prices and non-spinning reserve service prices of the California Independent System Operator (CAISO) in 2018 to represent the price situation for each year during the battery’s life cycle, with an average peak-valley price difference of about $32/MWh. The power station adopts LFP battery energy storage, with an initial battery charging and discharging efficiency of 95% and no self-discharge effect, i.e., a self-discharge rate of 0. Assuming that after operating 2000 cycles at 100% depth of discharge, the capacity retention rate of the energy storage power station is about 80% of the original battery (Ecker et al., 2014), at which point the battery energy efficiency is low, and the battery is considered to have ended its physical life. The average calendar degradation of the energy storage power station is estimated to be a 1% capacity loss per year (Schuster et al., 2016; Keil et al., 2016). Independent EES power stations require 24 h staffing, and labor operation and maintenance costs and equipment maintenance costs are relatively high. The annual operation and maintenance costs for large-scale industrial-grade EES power stations and commercial and industrial EES are $16/kW-year and $27/kW-year, respectively (Chen et al., 2023; He et al., 2020).
3 Results
3.1 Battery life and SOH
Figure 2 demonstrates the SOH trend of battery over time, considering different marginal degradation cost (MDC) values. As the battery inevitably experience cycling degradation and performance degradation with increasing charge-discharge cycles, its SOH also shows a decreasing trend with the increase in the usage time. However, from the figure, we can observe that the larger the value of MDC, the slower the SOH decline and the longer the physical life of the battery. When MDC = 0, that is, without considering the degradation cost of the battery, the SOH of the battery has dropped to below 80% in about 2 years. In contrast, when MDC = 65, the battery’s SOH can still remain above 85% after 10 years of use. This indicates that considering MDC in the operational optimization of EES power stations and moderately controlling charge-discharge power can effectively extend battery life. Therefore, MDC is also considered an opportunity cost that characterizes the long-term future value of EES power stations. In other words, if the MDC is relatively large in the battery’s full life-cycle, future benefits may be higher. However, it is not the case that the higher the MDC is the better. Excessively high MDC can lead to reduced battery utilization, potentially decreasing EES benefits. Thus, it is necessary to seek a balance between prolonging the battery life and increasing the battery utilization to select the optimal MDC value.
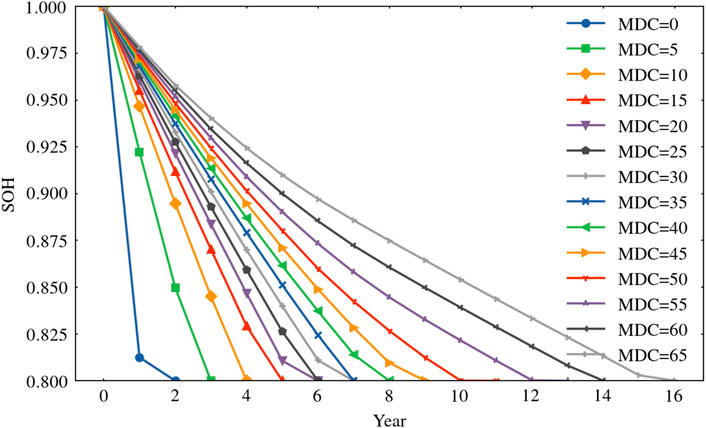
Figure 2. Physical life of batteries at different marginal degradation costs.
3.2 Full life-cycle benefits of EES
We utilize an EES revenue model to evaluate the life-cycle profits of EES power stations. To determine the optimal MDC value, we employed an iterative optimization approach. We simulated the EES power station’s operation over its lifetime for a range of MDC values from $0 to $100/MWh-throughput, in increments of $5/MWh-throughput. For each MDC value, we calculated the total life-cycle revenue using our comprehensive model. Figure 3 illustrates the relationship between different MDCs and the profitability of EES power stations. As the MDC increases, the life-cycle revenue of EES power station rises sharply. When the MDC value increases from 0 to around $45/MWh-throughput, the revenue grows rapidly. This indicates that within this range, the higher the MDC, the stronger the EES power station’s profitability. The profits reach its peak when the MDC value is approximately $45/MWh-throughput, which represents the optimal operating point for maximizing the EES power station’s life-cycle earnings. This optimal value was identified as the MDC that resulted in the highest total revenue in our simulations. When the MDC exceeds $45/MWh-throughput, profits begin to decline slowly. Excessively high MDC lead to accelerated battery degradation, shortened battery life and reduced overall profitability. Therefore, as the MDC value becomes increasingly large, approaching $100/MWh-throughput, earnings begin to decrease dramatically.
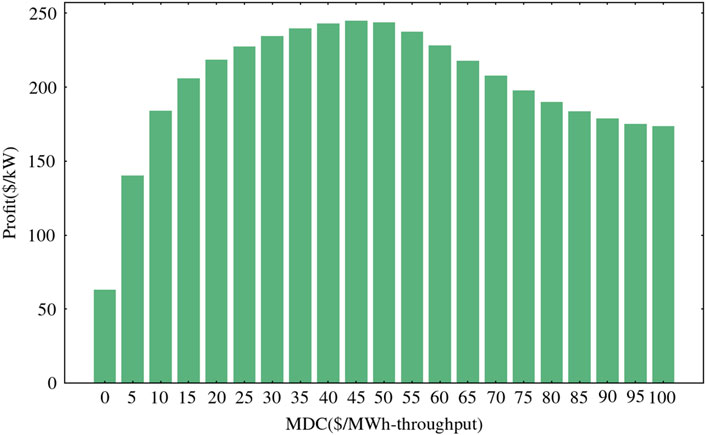
Figure 3. The relationship between the profits of EES and MDC.
For independent EES power stations, the profitability can be realized by the way of auxiliary service (specifically referring to reserve services in this context) in addition to the energy arbitrage through the participation of EES in the electricity trading in the spot market. As shown in Figure 2, at the optimal MDC ($45/MWh-throughput), the battery’s SOH decreases to 80% in the ninth year. Figure 4 illustrates the profitability of an EES power station over its entire life-cycle under optimal MDC conditions. The graph shows that the station’s profitability is highest in the early stages of the project. Initially, energy arbitrage revenue is $29.9/kW, and reserve services contribute $14.0/kW, resulting in a total revenue of $43.9/kW. Energy arbitrage accounts for a larger proportion of the revenue at this stage. However, as the EES power station operates over its life-cycle, battery degradation intensifies, causing a steady decline in energy arbitrage revenue. Ancillary services, being less affected by battery degradation, maintain relatively stable demand and prices for reserve service capacity. Consequently, the total annual revenue shows a downward trend. By the eighth year, energy arbitrage revenue decreases to $16.9/kW, while reserve services contribute $15.2/kW, resulting in a total revenue of $32.0/kW.
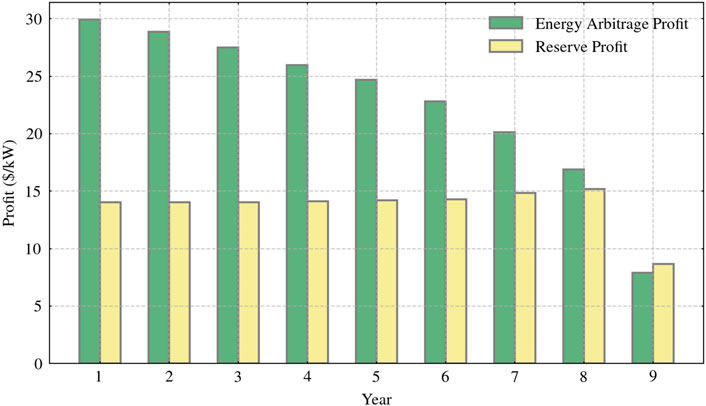
Figure 4. Trends in life-cycle profits of EES power stations under different operating models in the spot market.
In the last year of the battery’s life, all revenues drop sharply, with total revenue amounting to only $16.6/kW. This trend shows that, over time, battery degradation increases, the number of charge-discharge times used for price arbitrage increases, and both battery capacity and efficiency decrease, forcing the profitability of the power station to decline. Providing reserve services, however, has lower requirements for battery performance, needing only to maintain a certain energy and power reserve, and is thus less affected by battery degradation.
Therefore, EES power stations should focus on life-cycle profitability and plan their operational strategies accordingly. In the early stages of the project, emphasis can be placed on energy arbitrage to fully utilize battery performance and obtain high returns. As the battery degradation, the focus should gradually shift towards increasing the proportion of ancillary services to maintain a stable income.
3.3 Battery physical and economic life
Depending on the region and type of energy storage project, the fixed operation and maintenance (O&M) costs for EES power stations are estimated to range between 0 - $30/kW-year (Hledik et al., 2018). Figures 5A, B show the relationship between the life-cycle net revenue and the battery’s SOH for EES projects in the spot market under different O&M cost levels (16 $/kW-year for commercial/industrial energy storage, and 27 $/kW-year for distributed/residential energy storage). As the years of use increase, the battery capacity irreversibly decreases. When the SOH drops to 80%, it is typically considered the physical end of the life (EOL) of battery. He et al. (Ecker et al., 2014) proposed that if an EES project cannot achieve positive net profits during operation, this point should be considered the economic end of life for the EES power station. To analyze the net revenue situation of EES power stations in the spot market, this paper introduces the concept of the battery’s economic end of life.
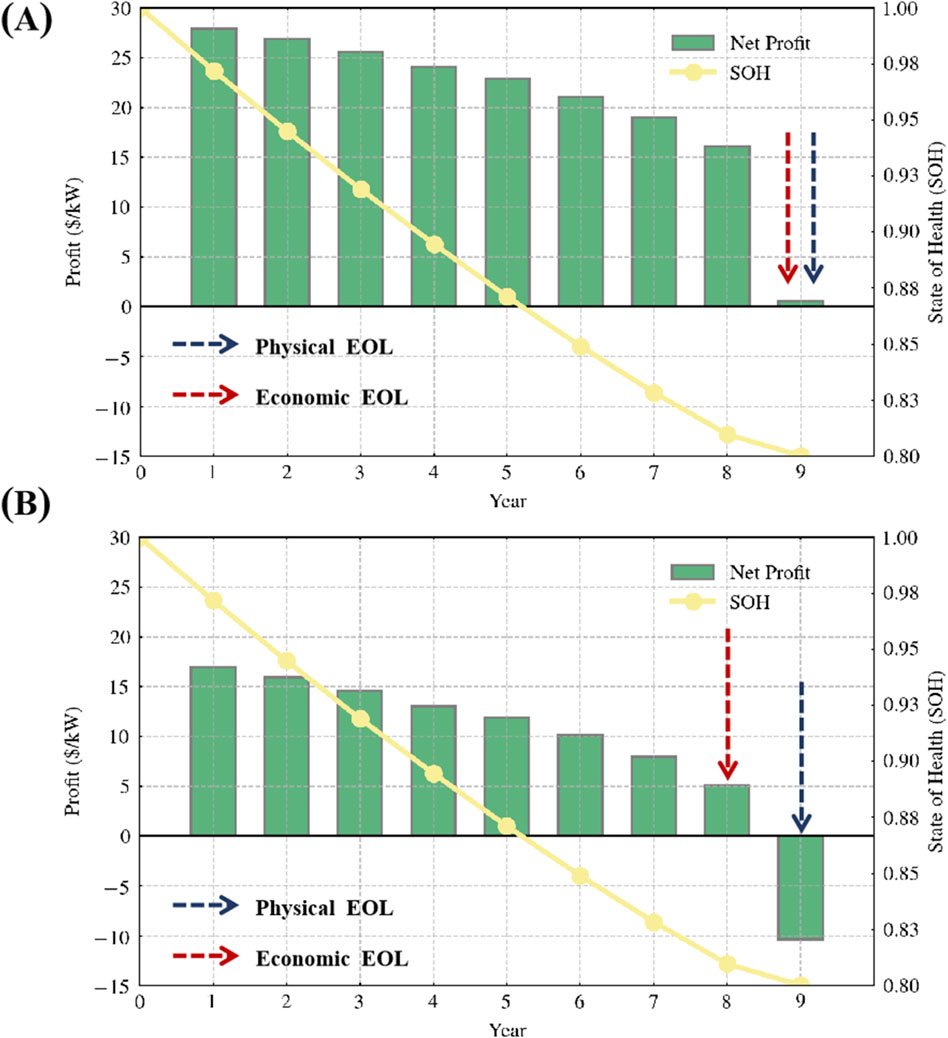
Figure 5. Changes in net profit from California EES power stations with battery cycle-life for different fixed O&M costs, (A) fixed O&M costs of $16/kW-year for commercial/industrial energy storage, and (B) fixed O&M costs of $27/kW-year for distributed/residential energy storage. Energy arbitrage and providing non-spinning reserve.
In this case, when the MDC is set at its optimal value ($45/MWh-throughput), the physical life of the LiFePO4 battery is 9 years. However, from an economic perspective, when the annual net revenue drops to 0, the continuing operation loses its economic value even if the battery has not reached the end of its physical life. In Figure 5A, the commercial/industrial energy storage scale reaches the end of both its economic and physical life in the ninth year. For distributed/residential energy storage (Figure 5B), the economic EOL of the station (8 years) is notably shorter than its physical EOL (9 years). Higher O&M costs accelerate the decline in net revenue, causing the battery to lose its economic value before physical EOL. In other words, in the ninth year, even though the EES power station’s battery can still operate, its revenue is insufficient to cover the fixed operation and maintenance costs, resulting in no net profit for the EES power stations. At this point, the battery can be recycled or repurposed for other economically advantageous applications. This approach ensures that resources are utilized efficiently, maximizing the overall economic benefit of the energy storage system throughout its life-cycle.
4 Discussion and conclusion
EES power stations play a crucial role in power systems. However, their profitability in the electricity spot market faces uncertainties due to several factors: their limited power generation capacity, constraints in providing ancillary services, and the current imperfections in electricity market trading mechanisms. Given these challenges, the key to improving the economic benefits of small-scale EES power stations lies in how to promote their active participation in electricity market trading and maximize their advantages through reasonable scheduling and flexible operations.
This paper proposes a revenue model for EES power stations to evaluate their life-cycle profits. The model focuses on the impact of MDC on the physical EOL of batteries and incorporates annual fixed O&M costs to illustrate the net revenue of EES power stations under the electricity spot market. Additionally, the concept of economic EOL for EES power stations is introduced. Through data analysis, the paper demonstrates that using the economic EOL as the operational life for EES power stations is more meaningful than relying solely on physical EOL metrics.
Energy arbitrage and ancillary services currently represent the primary and most mature sources of revenue. In a case study of EES power station arbitrage in the California energy market, it is found that when the battery completes 2000 cycles and its capacity reduces to 80% of the original (i.e., physical EOL), the optimal MDC for the EES power station is $45/MWh-throughput. Under these conditions, the EES power station achieves its highest life-cycle revenue. For commercial/industrial-scale EES power station, both the economic and physical EOL are 9 years. However, for residential-scale EES power station, the economic EOL is earlier than the physical EOL, at 8 and 9 years respectively. This indicates that continuing to operate the residential-scale EES power station in the ninth year would result in revenues lower than operating costs.
Therefore, operators need to carefully balance battery degradation characteristics, market conditions, and operational strategies to determine the optimal economic EOL of residential-scales. This balance is crucial for making appropriate investment and operational decisions. By considering these factors, operators can maximize the economic benefits of their residential-scales while ensuring they do not operate beyond the point where costs exceed revenues. This approach allows for more efficient use of resources and better long-term planning in the rapidly evolving energy storage market. Future research could explore the impact of emerging battery technologies on the economic lifespan of EES power stations. Additionally, investigating the potential synergies between EES power stations and other grid assets, such as renewable energy sources or demand response systems, could uncover new economic opportunities in the evolving energy landscape.
Data availability statement
The raw data supporting the conclusions of this article will be made available by the authors, without undue reservation.
Author contributions
YL: Conceptualization, Investigation, Methodology, Writing–original draft. SZ: Conceptualization, Supervision, Writing–review and editing. LY: Formal Analysis, Methodology, Software, Writing–original draft. QG: Methodology, Software, Writing–review and editing. XL: Formal Analysis, Writing–review and editing. BF: Investigation, Writing–review and editing.
Funding
The author(s) declare that financial support was received for the research, authorship, and/or publication of this article. This work was financially supported by the State Grid Corporation Headquarters Management Science and Technology Project “Research on Co-operation Technology of Multi-Level Electricity Spot Market for High Percentage of New Energy” (5108-202218280A-2-286-XG). The funder was not involved in the study design, collection, analysis, interpretation of data, the writing of this article, or the decision to submit it for publication.
Conflict of interest
The authors declare that the research was conducted in the absence of any commercial or financial relationships that could be construed as a potential conflict of interest.
Publisher’s note
All claims expressed in this article are solely those of the authors and do not necessarily represent those of their affiliated organizations, or those of the publisher, the editors and the reviewers. Any product that may be evaluated in this article, or claim that may be made by its manufacturer, is not guaranteed or endorsed by the publisher.
References
Chen, Q., Fang, X., Guo, H., He, G., Zhang, D., and Xia, Q. (2021). Participation mechanism of energy storage in electricity market: status quo and prospect. Automation Electr. Power Syst. 45 (16), 14–28. doi:10.7500/AEPS20210227001
Chen, X., Yang, Y., Wang, J., Song, J., and He, G. (2023). Battery valuation and management for battery swapping station. Energy 279, 128120. doi:10.1016/j.energy.2023.128120
Cui, H., Song, K., Dou, W., Nan, Z., Wang, Z., and Zhang, N. (2021). Bidding strategy of a flexible CHP plant for participating in the day-ahead energy and downregulation service market. IEEE Access 9, 149647–149656. doi:10.1109/ACCESS.2021.3116981
Ecker, M., Nieto, N., Kaebitz, S., Schmalstieg, J., Blanke, H., Warnecke, A., et al. (2014). Calendar and cycle life study of Li(NiMnCo)O2-based 18650 lithium-ion batteries. J. Power Sources 248, 839–851. doi:10.1016/j.jpowsour.2013.09.143
Fares, R., and Webber, M. E. (2018). What are the tradeoffs between battery energy storage cycle life and calendar life in the energy arbitrage application? J. Energy Storage. 16, 37–45. doi:10.1016/j.est.2018.01.002
He, G., Ciez, R., Moutis, P., Kar, S., and Whitacre, J. F. (2020). The economic end of life of electrochemical energy storage. Appl. Energy 273, 115151. doi:10.1016/j.apenergy.2020.115151
He, X., Lou, S., Wu, Y., Liang, Y., and Chen, X. (2022). Two-stage market bidding and scheduling strategy of integrated wind power and energy. Automation Electr. Power Syst. 46(4), 47–55.
Hesse, H., Kumtepeli, V., Schimpe, M., Reniers, J., Howey, D., Tripathi, A., et al. (2019). Ageing and efficiency aware battery dispatch for arbitrage markets using mixed integer linear programming. Energies 12 (9), 999. doi:10.3390/en12060999
Hledik, R., Chang, J., Lueken, R., Pfeifenberger, J., Pedtke, J. I., and Vollen, J. (2018). The economic potential for energy storage in Nevada. Boston, MA: The Brattle Group, prepared for Public Utilities Commission of Nevada Governor’s Office of Energy. Available at: https://www.brattle.com/wpcontent/uploads/2021/05/14618_economic_potential_for_storage_in_nevada_-_final.pdf.
Keil, P., Schuster, S. F., Wilhelm, J., Travi, J., Hauser, A., Karl, R. C., et al. (2016). Calendar aging of lithium-ion batteries i. impact of the graphite anode on capacity fade. J. Electrochem Soc. . 163, 1872–1880. doi:10.1149/2.0411609jes
Kumtepeli, V., Hesse, H., Schimpe, M., Tripathi, A., Wang, Y., and Jossen, A. (2020). Energy arbitrage optimization with battery storage: 3D-MILP for electro-thermal performance and semi-empirical aging models. IEEE Access 8, 204325–204341. doi:10.1109/ACCESS.2020.3035504
Liang, Y., Chen, X., Lou, S., Liu, Q., Lin, Q., and Deng, W. (2021). Formation mechanism analysis of cartel in frequency regulation ancillary service market in Southern China (starting from Guangdong Province). Automation Electr. Power Syst. 45 (15), 93–100. doi:10.7500/AEPS20201102003
Padmanabhan, N., Ahmed, M., and Bhattacharya, K. (2020). Battery energy storage systems in energy and reserve markets. IEEE Trans. Power Syst. 35 (1), 215–226. doi:10.1109/TPWRS.2019.2936131
Sakti, A., Gallagher, K., Sepulveda, N., Uckun, U., Vergara, C., de Sisternes, F., et al. (2017). Enhanced representations of lithium-ion batteries in power systems models and their effect on the valuation of energy arbitrage applications. J. Power Sources. 342, 279–291. doi:10.1016/j.jpowsour.2016.12.063
Schram, W., Alskaif, T., Lampropoulos, I., Henein, S., and Van Sark, W. G. J. H. M. (2020). On the trade-off between environmental and economic objectives in community energy storage operational optimization. IEEET ransactions Sustain. Energy 11 (4), 2653–2661. doi:10.1109/tste.2020.2969292
Schuster, S., Brand, M., Campestrini, C., Gleissenberger, M., and Jossen, A. (2016). Correlation between capacity and impedance of lithium-ion cells during calendar and cycle life. J. Power Sources. 305, 191–199. doi:10.1016/j.jpowsour.2015.11.096
Wang, D., Zhang, C., Li, J., Zhu, L., Zhou, B., Zhou, Q., et al. (2024). A novel interval power flow method based on hybrid box-ellipsoid uncertain sets. IEEE Trans. Power Syst. 39 (4), 6111–6114. doi:10.1109/tpwrs.2024.3391921
Xu, B., Zhao, J., Zheng, T., Litvinov, E., and Kirschen, D. (2018). Factoring the cycle aging cost of batteries participating in electricity markets. IEEE Trans. Power Syst. 33 (2), 2248–2259. doi:10.1109/TPWRS.2017.2733339
Zhang, H., and Wang, Y. (2021). Mechanism experience of foreign grid-side storage participating in frequency regulation auxiliary service market and its enlightenment to China. Energy Storage Sci. Technol. 10 (2), 766–773. doi:10.19799/j.cnki.2095-4239.2020.0370
Zhu, H., Xu, J., Liu, G., Yue, F., Yu, Z., and Zhang, X. (2022). UK policy mechanisms and business models for energy storage and their applications to China. Energy Storage Sci. Technol. 11 (1), 370–378. doi:10.19799/j.cnki.2095-4239.2021.0290
Zhu, L., Wen, W., Qu, Y., Shen, F., Li, J., Song, Y., et al. (2024). Robust representation learning for power system short-term voltage stability assessment under diverse data loss conditions. IEEE Trans. Neural Netw. Learn. Syst. 35 (5), 6035–6047. doi:10.1109/tnnls.2023.3325542
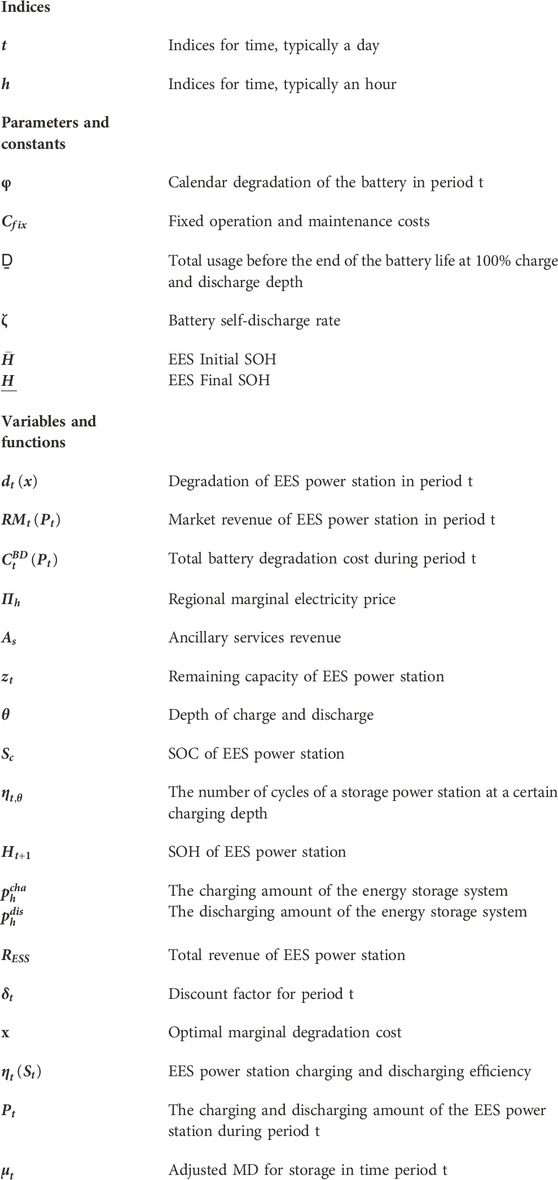
Nomenclature
Keywords: electricity spot market, electrochemical energy storage, profit model, energy arbitrage, economic end of life
Citation: Li Y, Zhang S, Yang L, Gong Q, Li X and Fan B (2024) Optimal scheduling strategies for electrochemical energy storage power stations in the electricity spot market. Front. Energy Res. 12:1469594. doi: 10.3389/fenrg.2024.1469594
Received: 24 July 2024; Accepted: 13 September 2024;
Published: 01 October 2024.
Edited by:
Lipeng Zhu, Hunan University, ChinaReviewed by:
Junjie Hu, North China Electric Power University, ChinaERSHUN DU, Tsinghua University, China
Copyright © 2024 Li, Zhang, Yang, Gong, Li and Fan. This is an open-access article distributed under the terms of the Creative Commons Attribution License (CC BY). The use, distribution or reproduction in other forums is permitted, provided the original author(s) and the copyright owner(s) are credited and that the original publication in this journal is cited, in accordance with accepted academic practice. No use, distribution or reproduction is permitted which does not comply with these terms.
*Correspondence: Shuyan Zhang, NDM3MzgwMDA1QHFxLmNvbQ==