 Yanyu Yan1
 Shiwei Xie
- 1School of Electrical Engineering and Automation, Fuzhou University, Fuzhou, China
- 2Electric Power Research Institute of CSG, Guangzhou, China
- 3Guangdong Provincial Key Laboratory of Intelligent Measurement and Advanced Metering for Power Grid, Guangzhou, China
A virtual power plant (VPP) has the ability to aggregate numerous decentralized distributed energy resources using advanced control technology, offering a promising approach for low-carbon development. In order to enhance the VPP’s contribution to reducing carbon emissions, a bi-level framework is proposed that incorporates an integrated energy-carbon price response mechanism. This model allows VPPs to participate in a multi-energy system through a multi-agent Stackelberg game framework. Initially, a transaction model is established where the power distribution system operator and the gas distribution system operator act as leaders, while the virtual power plant operator acts as a follower in the multi-energy system. Subsequently, an integrated energy-carbon pricing method, rooted in carbon emission flow theory, is introduced to encourage VPPs to proactively adjust their energy-use and trading strategies within multi-energy systems, thereby promoting multi-principal interactive trading. To achieve a distributed solution among multiple entities while maintaining the privacy of each entity’s information, the adaptive step-size alternating direction multiplier method is employed. The feasibility and effectiveness of the proposed model and method are then demonstrated through case studies.
1 Introduction
The construction of a new type of power system primarily based on new energy resources is being accelerated, emphasizing both centralized and distributed energy resources. However, distributed energy resources (DERs), characterized by strong uncertainty, decentralization, and heterogeneity (Chen et al., 2021), pose significant threats to the security of grid-connected power systems due to their large numbers. Virtual power plants (VPPs) are widely employed to effectively aggregate large, dispersed, and diverse DERs through advanced control, metering, communication, and other technologies (Vasirani et al., 2013; Zhao et al., 2018; Bhuiyan et al., 2021). This facilitates accurate control of internal resources, providing a viable pathway for low-carbon development. In the context of the interactive integration of multiple energy systems (Wang et al., 2018), VPPs participating in both the power distribution and gas distribution systems can leverage the complementary characteristics of electricity and gas. This enables the realization of synergistic operations within a multi-energy network, enhancing the economic efficiency and promoting low-carbon objectives for all stakeholders involved.
To advance the role of VPPs in the low carbon economy, several research studies have been conducted. Previous works in (Zhang et al., 2023) examine the interactions between VPPs and the higher-level grid based on peak and off-peak time-sharing tariffs. It also developed an operational model for VPPs under carbon trading and green certificate trading mechanisms, considering both economic and low-carbon aspects. Reference (Yi et al., 2020a) addresses power flow constraints in the distribution network by formulating a two-layer planning problem involving VPPs and the distribution network, optimizing dynamic pricing for VPPs. Reference (Yi et al., 2020b) proposes a two-layer model for VPPs and the distribution system, achieving co-optimization of multiple VPPs with the distribution network through an integrated active and reactive power pricing approach. These studies primarily focus on transaction pricing strategies for VPPs in the distribution market, with an increasing involvement of VPPs in multi-energy system transactions due to the close integration of various energy systems. Reference (Yang et al., 2021) introduces a model for energy trading in micro-energy networks that considers electricity-heat multi-energy sharing, ultimately reducing energy costs for multi-energy micro-grids. Additionally, works in (Zhang and Hu, 2022) suggest an optimal scheduling model for VPPs to engage in simultaneous trading within the electricity-gas multi-energy market, considering security constraints of the natural gas network and bidirectional flow of electricity and natural gas. However, the majority of these studies view VPPs predominantly as passive recipients of energy prices, ignoring their potential for active participation in multi-energy system trading and interactions with other entities.
With the advancement of VPP technology, conflicts of interest stemming from the involvement of various entities in competitive multi-energy markets have become inevitable. Game theory is increasingly being utilized to address optimization problems related to VPPs. In (Xu et al., 2022), a VPP pricing strategy is proposed within a two-tier market structure involving multiple VPPs and distribution markets. A non-cooperative pricing game model is established to enhance the economic efficiency of multiple entities. Meanwhile, Reference (Liu, 2022) introduces a cooperative game model for VPP scheduling in the context of multiple regional integrated energy systems. This model aims to optimize multiple energy sources to meet the electricity-heat-gas demand of each integrated energy system within the VPP coordinated scheduling strategy, fostering cooperative benefit sharing among members. In analyzing the intricate interactions among providers and responders of energy prices across multiple entities in multi-energy system transactions, a master-slave game model is deemed more appropriate for understanding the sequential order of the game. The research in (Zangeneh et al., 2018) adopts a multi-leader-follower master-slave game model to describe the competition between multiple VPPs and the superior market, determining the optimal pricing strategy for multiple parties to realize optimal transactions for each entity. The study in (Wei et al., 2017) investigates multi-energy interaction transaction strategies between multiple distributed energy stations and users by constructing an energy transaction model based on a multi-leader-multiple-follower game. A model in (Chen et al., 2023) constructs a Stackelberg game trading model involving energy retailers and VPPs, where the energy operator guides the power purchase and sale behavior of VPP through tariff optimization. Research in (Lu Q. et al., 2023) proposes a one-master-many-slave game optimization model for community integrated energy systems, considering carbon trading mechanisms and integrated demand response, which realizes interactive equilibrium between energy suppliers and load aggregators, significantly improving the economic and low-carbon benefits of each entity.
However, there are still research gaps in the above studies, which are mainly manifested in the following two aspects: 1) Existing studies on low-carbon operation of VPPs primarily focus on carbon emission measurement from the power supply side, with less emphasis on the demand side. This limitation hinders the ability to guide load-side low-carbon electricity consumption behavior. Carbon emission flow (CEF) theory, as an effective analytical method for the low-carbon development of power systems (Cheng et al., 2019a; Cheng et al., 2019b; Sun et al., 2023), offers new perspectives on load-side carbon emission responsibility sharing and facilitates low-carbon demand response. Studies (Lu Z. et al., 2023; Yan et al., 2023) have proposed low-carbon optimal dispatch models for multi-energy systems based on CEF theory. These models implement carbon-aware distribution locational marginal pricing (CDLMP) and stepped carbon pricing to actively guide loads in reducing system carbon emissions. 2) The measurement methods of VPP carbon emissions in existing studies are not sufficiently accurate. Most studies only consider the internal carbon emissions of VPPs, neglecting the indirect carbon emissions resulting from purchasing electricity from the higher grid and gas from the gas grid. Furthermore, the purchase and sale of energy are usually based on fixed or time-based pricing, which does not account for the significant potential of integrated energy-carbon pricing to reduce VPP carbon emissions.
This paper proposes a bi-level model that optimizes a multi-agent Stackelberg game with VPP participation in multi-energy systems under an integrated energy-carbon price response mechanism. In this model, the distribution system operator (DSO) and gas system operator (GSO) act as leaders, while the VPP operator (VPPO) acts as a follower. The model focuses on VPP participation in a multi-energy system under the energy-carbon integrated price response mechanism. The paper also introduces an integrated energy-carbon pricing method based on CEF theory to help VPPs adjust their energy consumption and trading strategies to reduce carbon emissions. The study includes carbon flow tracking for distributed VPP energy transactions, taking into account the carbon emission responsibilities of VPPs when purchasing electricity and natural gas. To ensure privacy, the adaptive step-size alternating direction method of multipliers (ADMM) is used for a distributed solution. The effectiveness of the proposed model and method is demonstrated through case analysis.
2 Electric-gas multi-energy system and VPP low-carbon operation bi-level framework
The study aims to develop a low-carbon economic operational model suitable for power distribution networks, gas distribution networks, and VPPs. Due to conflicting objective functions among the three stakeholders, i.e., DSO, GSO, and VPPO, and the presence of multiple variables, a bi-level model for the interactions between multi-energy systems and the VPP considering integrated energy-carbon pricing is proposed. The transaction dynamics between DSO, GSO, and VPPO are modeled as a multi-agent Stackelberg game, where DSO and GSO are considered as the leaders and VPPO as the follower. The bi-level transaction framework is illustrated in Figure 1.
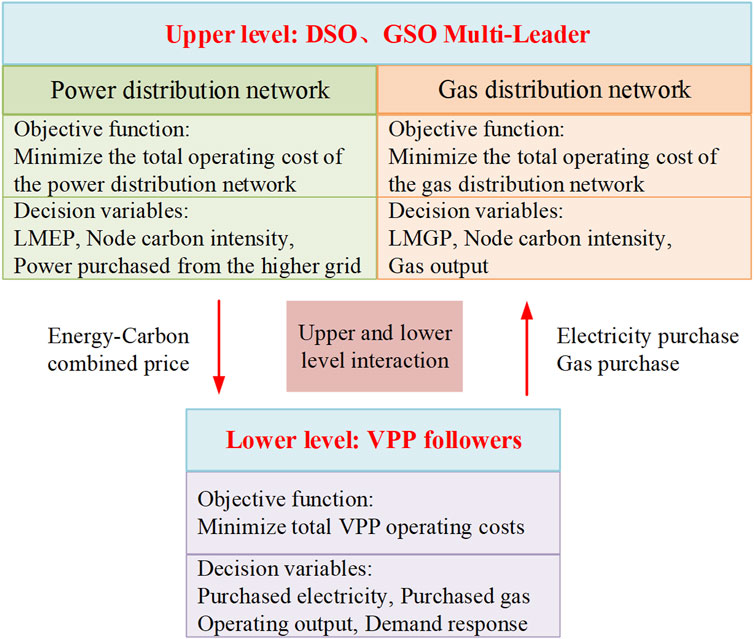
Figure 1. A bi-level framework for electric-gas multi-energy systems and VPP transactions.
The upper level features the optimal scheduling model for the electricity-gas multi-energy system. The DSO and GSO calculate the optimal power flow (OPF) for the power distribution network and the gas distribution network based on the energy purchasing demand transmitted from the lower level. Their objective is to minimize the total operating cost for each of them. They also integrate the distribution network trends to solve the distribution of the CEF and formulate the integrated energy-carbon price. For energy pricing, this paper adopts the locational marginal electricity price (LMEP) and locational marginal gas price (LMGP). The decision information derived from this process is then provided back to the lower-level model.
The follower VPP at the lower level responds to the integrated energy-carbon price information by optimizing the energy use of internal gas turbine CHP units, gas boilers, power storage equipment, and distributed wind power, with the goal of minimizing the total operating cost. The VPP develops the internal optimal scheduling strategy and uploads the power purchasing demand and gas purchasing demand information to the upper-level DSO and GSO, respectively.
In summary, the power distribution network and the gas distribution network optimize OPF and CEF based on the energy purchase demand of the VPP and its internal optimization results. They then pass the integrated energy-carbon price and node carbon intensity obtained from the solution back to the VPP. The VPP uses this information to formulate the latest internal optimization scheduling strategy and update its energy purchase demand. This iterative process continues until the transactions of each subject in the bi-level model reach a consensus and meet the convergence conditions, thus achieving the overall optimal operation of the power distribution network, gas distribution network, and VPP.
3 A bi-level formulation for energy transaction
Since DSOs, GSOs, and VPPOs represent different stakeholders, it is essential to establish transaction models for each party that consider the interaction of electricity and natural gas between the distribution and the VPP. This includes the energy pricing model of the upper-tier electricity-gas multi-energy system, the carbon pricing model, and the lower-level VPP energy optimization model.
3.1 Energy pricing modeling for electric-gas multi-energy systems
3.1.1 Pricing model for power distribution networks
In this section, the LMEP pricing model for power distribution networks based on second order cone programming (SOCP) is constructed with the objective of minimizing the operating cost of power distribution networks (Xie et al., 2023; Xie et al., 2024).
3.1.1.1 Objective function
The objective of the DSO is to minimize the total operating cost
where
3.1.1.2 Power system constraints
where
3.2 Pricing model for gas distribution networks
This section constructs a SOCP-based LMEP pricing model for gas distribution networks with the objective of minimizing the gas distribution network operating costs.
3.2.1 Objective function
The gas distribution network consists of the gas source, gas pipeline, air compressor, and gas load, and in this paper it is assumed that the flow of natural gas in the gas pipeline has been determined. The objective of the GSO is to minimize the operating cost
where
3.2.2 Gas system constraints
where
3.3 Carbon pricing model for multi-energy systems based on CEF theory
3.3.1 CEF modeling for multi-energy systems
While most of the CO2 in the energy industry is generated on the source side, the ultimate driver of carbon emissions is on the load side. The focus of this paper is on how to price carbon emissions from generation to end-users so that the right incentives can be provided between electricity-gas multi-energy systems. The theory of CEF, which is based on the energy flow of the system, can intuitively characterize the flow direction of carbon emission during the system operation, and improve the new analysis perspective for the low-carbon economic dispatch (Cheng et al., 2020). In the CEF model, the carbon flow index is usually used to describe the carbon emission apportionment, this paper mainly needs to obtain the carbon intensity of each node of the electric-gas multi-energy system as a carbon signal, and through the carbon tax to establish the link between the carbon price and the node carbon intensity accessed by the VPP, and the CEF model is established as follows.
3.3.1.1 CEF modeling of power distribution networks
The node carbon intensity represents the value of carbon emissions equivalent to the generation side caused by a unit of electricity consumed at that node, calculated in Eq. 19 as follows:
where
The branch carbon intensity denotes the equivalent value of carbon emission on the generation side caused by a unit of electricity transmitted by a tributary. According to the proportional sharing principle (Kang et al., 2015), the carbon flow intensity of all transmission lines flowing from node
3.3.1.2 CEF modeling of gas distribution networks
The gas distribution network CEF model is similar to that of the power distribution network, and the carbon intensity of each node and the branch carbon intensity are calculated as follows:
where
3.3.1.3 An integrated energy-carbon pricing approach based on the CEF theory
As consumers, the VPP must acknowledge their carbon emission responsibility when procuring electricity and gas from the power distribution and gas distribution networks. By utilizing the CEF model to calculate the nodal carbon intensity of these networks, a connection is established between the carbon price and nodal carbon intensity through carbon tax. Subsequently, the integrated electricity/gas energy-carbon pricing method is developed by combining the LMEP/LMGP with the carbon price in Eqs 23, 24 as follows:
where
3.4 VPP energy optimization model
The operational framework of the VPP established in this study is illustrated in Figure 2. It comprises gas turbine combined heat and power (CHP) units, gas boilers, distributed wind power, and energy storage units. The flexible loads encompass electric and thermal loads, with consideration given to demand response for both to assist users in making informed energy demand adjustments. The VPP interfaces with the power distribution network via an electric power contact line and transports natural gas through a pipeline connecting it to the gas distribution network. Notably, this paper does not address the scenario of natural gas sales to the GSOs at this time.

Figure 2. VPP operational framework.
3.4.1 VPP Objective Function
The objective of the VPP energy optimization model is to minimize the total operating cost
where
3.4.2 VPP operational constraints
3.4.2.1 Power balance constraints
The power balance constraints for multiple energy flows within the VPP are given in Eq. 29 as follows:
where
3.4.2.2 Gas turbine CHP unit constraints
The mathematical model and constraints for power and heat supply of CHP units are in Eq. 30 as follows:
where
3.4.2.3 Gas boiler output constraints
where
3.4.2.4 Energy storage unit constraints
The introduction of energy storage devices can further improve the operational flexibility of the VPP, the energy storage device is modeled in Eq. 32 as follows:
where
3.4.2.5 Electric heat integrated demand response constraints
Eq. 33 represents the Electric heat integrated demand response constraints, where
4 Solution method for the muti-agent stackelberg game trading model
In the context of a multi-agent Stackelberg game transaction model involving the leader DSO, GSO, and follower VPP in an electricity-gas multi-energy system, each participant optimizes its operation state according to individual interest objectives and devises energy transaction strategies accordingly. Given the intricate internal information and substantial transaction volume, traditional centralized optimization algorithms are inadequate in meeting the information privacy needs of each participant within this model. Therefore, the proposed solution involves solving the multi-participant Stackelberg game model through a distributed approach using the adaptive ADMM algorithm.
4.1 Stackelberg game trading model
The game model contains three elements: the set of participants, the set of strategies and the set of benefits (Li et al., 2022), and the Stackelberg game is modeled in Eq. 34 as follows:
(1) Participant set:
(2) Strategy set: the strategy of the leader DSO is the amount of electricity purchased from each distributed generator and the higher grid at each moment and the integrated electricity-carbon price set, denoted as
(3) Benefits: The benefits to each participant are their objective functions, which can be expressed as
4.2 Distributed solution of stackelberg game transaction model based on adaptive ADMM algorithm
The adaptive ADMM algorithm is utilized in this study for distributed solving of the proposed multi-agent Stackelberg game model. This approach ensures that the interaction between participating subjects does not compromise their internal privacy. Only the boundary information of each subject at the time of the transaction is required, enabling distributed and efficient solving while safeguarding the privacy of transactional information.
Based on the principle of ADMM algorithm, the auxiliary condition is introduced as shown in Eq. 35 as follows:
where
Distributed models for optimal pricing of power distribution network, optimal pricing of gas distribution network and VPP energy optimization are obtained based on ADMM principle, respectively.
4.2.1 Optimal pricing of power distribution network
The optimal pricing of power distribution network is presented in Eq. 36, where
4.2.2 Optimal pricing of gas distribution network
The optimal pricing of gas distribution network is presented in Eq. 37, where
4.2.3 Distributed model for VPP energy optimization
Distributed model for VPP energy optimization is presented in Eq. 38, where
The coupled variables and Lagrange multipliers are updated as follows:
where
The original residuals, pairwise residuals are calculated and the convergence conditions are provided in Eqs 40, 41 as follows:
where
The choice of step size significantly affects the speed of the ADMM solution. An inappropriate value can hinder convergence. This paper proposes an adaptive ADMM algorithm that dynamically updates the step size based on the relationship between original residuals and pairwise residuals. This approach aims to enhance algorithm convergence and reduce iteration time, as formulated in Eq. 42:
where
The coupling variables are updated by the iterative form shown in Eq. 39 until the convergence condition in Eq. 41 is satisfied, and the specific algorithmic solution flowchart is shown in Figure 3.
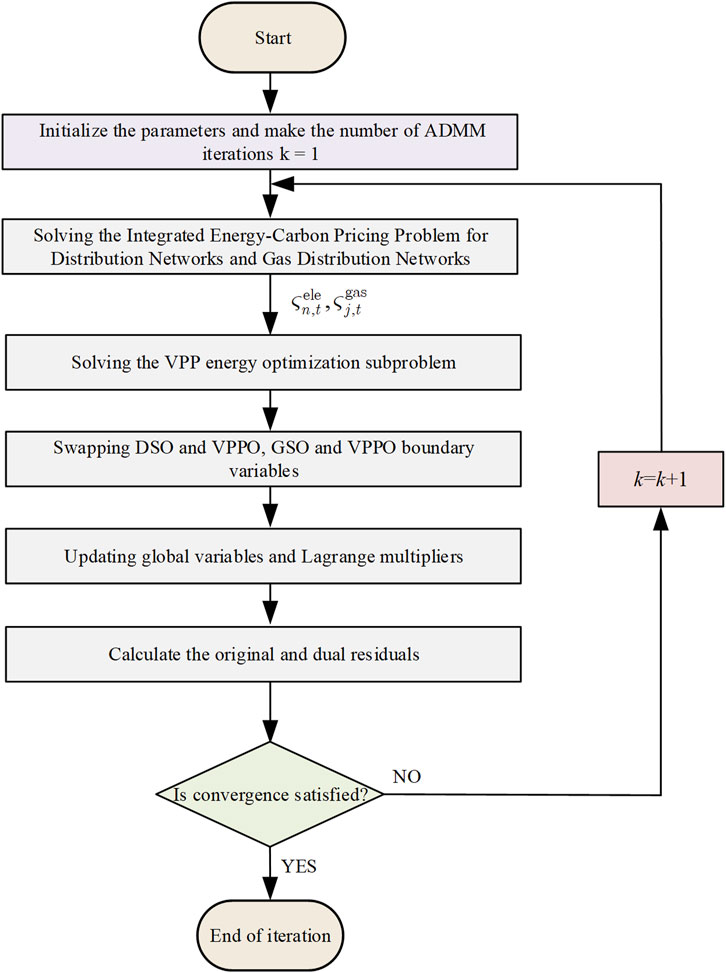
Figure 3. Flowchart for solving the multiagent Stackelberg game model based on integrated energy-carbon price.
5 Case study
5.1 Case description
In order to validate the models and algorithms proposed in this paper, the IEEE 33-bus power distribution network, 7-node gas distribution network, and 1 VPP coupling composition are utilized. The network topology is illustrated in Figure 4, where W represents the wind turbine located at node 31 in the power distribution network. Additionally, G1 to G5 represent five coal-fired units situated at nodes 3, 9, 29, 14, and 21, with their operating parameters detailed in Supplementary Appendix Table SA1; Supplementary Appendix Figure SA1. W1 and W2 denote the gas distribution stations connected to nodes six and seven of the gas distribution network. Prediction curves for renewable energy output and load within the VPP can be found in Supplementary Appendix Figure SA2, along with unit parameters in Supplementary Appendix Table SA2.
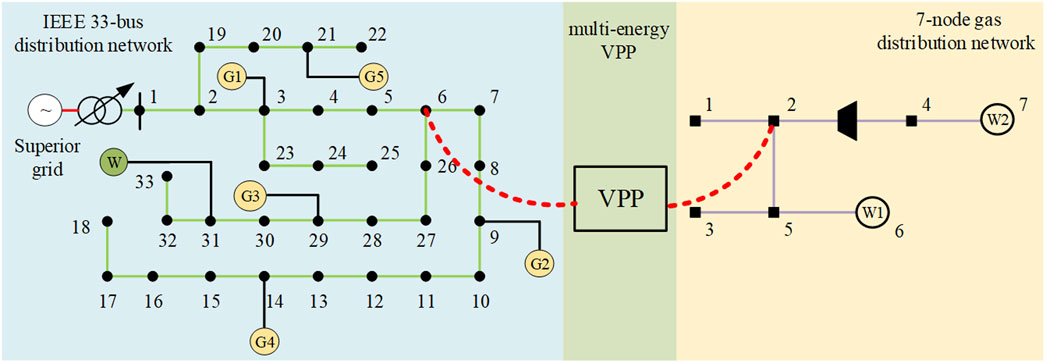
Figure 4. Containing multi-energy VPP E33-G7 test system topology diagram.
It is assumed that the power factor
In order to verify the impact of the multi-agent Stackelberg game on electricity-gas trading and the cost of energy purchase by each subject under the energy-carbon integrated price response mechanism, the following four energy settlement scenarios are set up.
Case 1 . The settlement electricity price adopts fixed time-sharing electricity price, the settlement gas price adopts fixed natural gas price, the specific data are shown in Supplementary Appendix Table SA3, carbon emission flow is not considered, VPPOs completely act as the recipient of the price for the electricity-natural gas transaction, and the flexible loads in VPPs are not considered for the optimal scheduling.
Case 2. Based on Case 1, and the flexible loads within the VPP are considered for integrated demand response for electricity and heat.
Case 3. The LMEP and LMGP obtained after the game equilibrium of each subject are used for the power distribution network settlement price and the gas distribution network settlement price, respectively, without considering the carbon emission flow, and the flexible loads within the VPP are considered for optimal dispatch; Case 4: the electricity-carbon integrated price and gas-carbon integrated price obtained after the game equilibrium of each subject are adopted for the power distribution network settlement price and gas distribution network settlement price respectively, carbon emission flow is considered, and optimal dispatch is considered for the flexible loads within the VPP, i.e., the model proposed in this paper.
5.2 Analysis of VPP simulation results
5.2.1 Comparative analysis of operation under different scenarios
The simulation results of the above four scenarios are shown in Table 1.
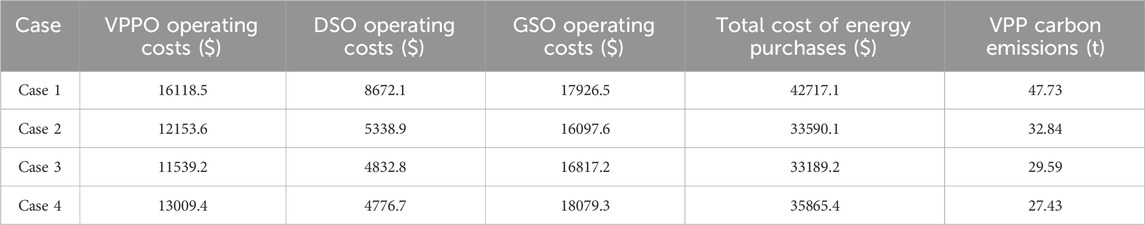
Table 1. Comparison results of operating costs and carbon emissions of each subject under different scenarios.
Table 1 illustrates that operating costs decrease and carbon emissions are effectively reduced when considering integrated demand response in Cases 2, 3, and 4 compared to Case 1. The dependency of VPP on power and gas distribution networks is also reduced through demand response of flexible loads, leading to decreased electricity and gas purchases. Case 3, which incorporates the interaction of VPPO with DSO and GSO master-slave game, shows a reduction in total energy purchase cost and carbon emissions by $400.9 and 3.25 t CO2, respectively, compared to Case 2 with fixed energy settlement price. This demonstrates that settling energy prices using LMEP and LMGP can guide VPP energy optimization in a more cost-effective manner, enhancing both economic and environmental aspects of VPP.
By comparing Case 3 and Case 4, it is evident that in Case 4, the integrated energy-carbon price led to a 7.29% decrease in carbon emissions from the VPP compared to Case 3. However, the energy purchase costs and total costs of the VPP increased in Case 4 due to the higher carbon price. Moreover, the inclusion of a carbon price incentivized VPPs to use more natural gas over purchased electricity, resulting in increased operating costs for GSOs and decreased costs for DSOs in Case 4. Overall, the proposed multi-agent Stackelberg game trading strategy proves beneficial in enhancing the economic and low-carbon advantages for each agent.
5.2.1.2 Analysis of price response mechanism.
The impact of different pricing methods on the power purchased by VPPs is analyzed by examining the power distribution network settlement tariffs and carbon price change curves for the nodes where the VPPs are located in Cases 3 and 4, as shown in Figure 5. Additionally, Figure 6 illustrates the carbon intensity for all nodes of the power distribution network under Case 4.
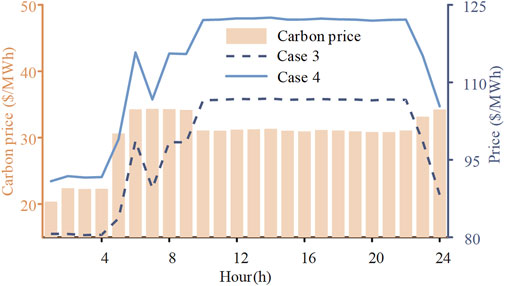
Figure 5. Electricity prices in different scenarios.

Figure 6. Variation of carbon intensity at power distribution network nodes under Case 4.
As shown in Figure 5, considering the carbon tax on VPP’s electricity demand from the power distribution network increases the purchase price. The integrated energy-carbon price is consistently higher than the LMEP, with its incremental increase varying over time. The difference between the integrated energy-carbon price and the LMEP is more pronounced at certain times (e.g., from 05:00 to 09:00) when the nodes have higher carbon emission densities. In contrast, while the combined gas-carbon price also rises, its change is minimal because the carbon intensity of each node in the gas distribution network is relatively uniform. The carbon emissions for VPPs purchasing gas from the gas distribution network depend solely on the amount of gas used. Consequently, the combined gas-carbon price remains essentially unchanged over time. In this paper, the LMGP of VPP coupled with the gas distribution network is calculated to be 0.5120 $/m³, and the integrated gas-carbon price, considering the carbon tax, is 0.6174 $/m³.
An examination of the carbon intensity of individual nodes in both Figure 6 and the IEEE 33-node system topology diagram indicates that nodes with wind turbines and their adjacent nodes have lower carbon intensity, attributed to the low carbon emissions of wind turbines. On the other hand, nodes connected to VPPs’ power distribution network are situated near coal-fired units with high carbon emissions, impacting their carbon intensity. Nevertheless, the carbon intensity of these nodes aligns closely with that of thermal units. As a result, the carbon pricing of nodes linked to the power distribution network, as depicted in Figure 5, demonstrates minimal fluctuations over time.
To further investigate the impact of carbon pricing on the amount of electricity and gas purchased by VPPs, Figure 7 illustrates a comparison between the two scenarios. The results show that during the 05:00-10:00, Case 4, with carbon pricing, acquires less electricity but more natural gas compared to Case 3, without carbon pricing. This is due to the higher carbon intensity at the node connected to the power distribution network, as depicted in Figure 5. The node’s carbon intensity is higher during 05:00-10:00, leading to a greater use of natural gas over electricity. Therefore, incorporating a carbon price incentivizes VPPs to utilize more natural gas and decrease electricity consumption.
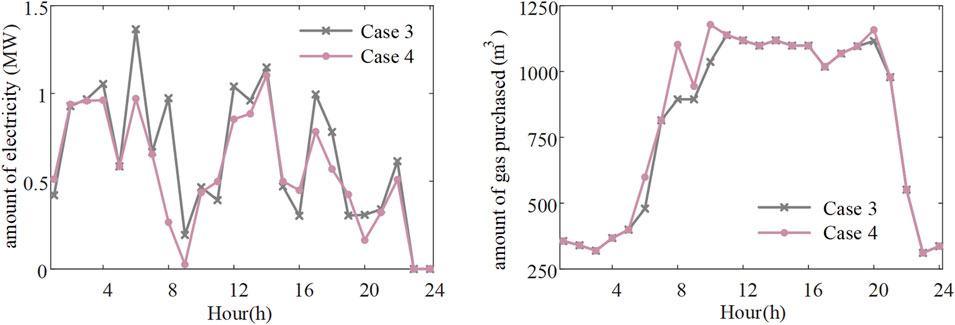
Figure 7. Power and gas purchases of VPP in different scenarios.
In order to better understand the demand for purchased energy and carbon emissions of a VPP utilizing an integrated energy-carbon price response mechanism, a comparison and analysis between Case 3 and Case 4 is conducted. The results of this comparison are illustrated in Figure 8. The visualization in Figure 8 demonstrates that, in Case 4 where carbon price is considered, natural gas becomes a more competitive option compared to Case 3 where carbon price is not a factor. Consequently, the VPP tends to procure natural gas with lower carbon intensity, leading to an increase in total gas volume purchased and a decrease in the purchase of electricity from the power distribution network with higher carbon intensity. This results in a reduction of 1.91 MWh in the total purchased electricity of the VPP. Furthermore, with the inclusion of carbon price, the total carbon emissions of the VPP decrease from 29585.8 kg to 27436.6kg, showcasing a significant reduction in carbon emissions due to the integrated energy-carbon price response mechanism. These findings suggest that the proposed multi-agent Stackelberg game energy settlement price effectively facilitates carbon emission reduction and enhances the low-carbon benefits of the VPP.
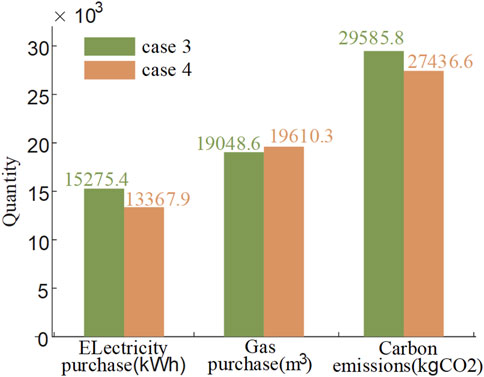
Figure 8. Comparison of VPP energy purchase demand and Carbon emissions under different scenarios.
5.2.2 Analysis of VPP optimal schedule
The results of the optimization of electric power and thermal power inside the VPP are shown in Figure 9. For the VPP internal units, new energy consumption has the highest priority to minimize wind abandonment, and the VPP completes the internal optimal scheduling according to the combined energy-carbon price. The gas turbine CHP unit generates electricity and heat within the output range, and the electric energy storage is mainly charged when the energy-carbon integrated price is lower, such as 01:00-04:00 and 07:00 moments, and discharged at 06:00 and 12:00-14:00 when the electricity-carbon integrated price is higher, so as to reduce the purchase of electricity from the power distribution network and reduce the total operating cost and carbon emissions, while the electric and heat loads are considered Comprehensive demand response can realize peak shaving and valley filling to alleviate the pressure of grid peaking; only when the internal unit output cannot meet its load demand, it purchases electricity from the power distribution network and gas from the gas distribution network. Considering that the heat load demand within the VPP is prioritized to be met by the gas turbine CHP unit, after considering the heat load demand response, the vast majority of the moments are heat production by the gas turbine only, and only when the gas turbine is not enough to supply heat at the 23:00-24:00 moments, the gas boiler GB unit will be powered up.
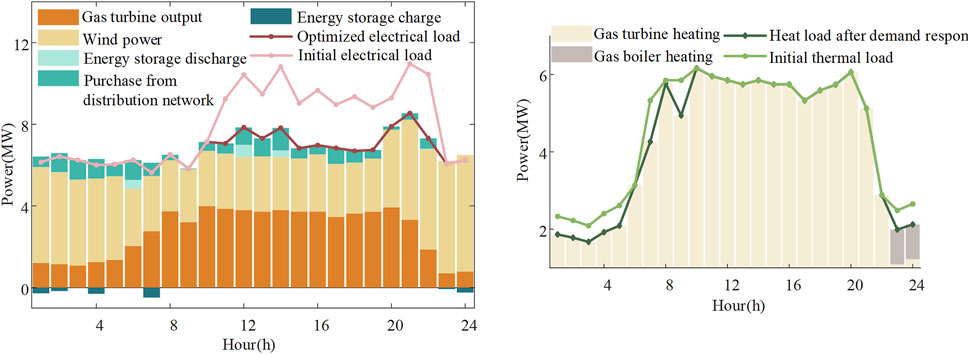
Figure 9. VPP internal optimization results.
5.3 Algorithm convergence analysis
This section examines the iterative convergence of the proposed multi-agent Stackelberg game trading strategy. Figure 10A illustrates the converged iterations of the original and pairwise residuals in Case 4, while Figure 10B demonstrates the iterative convergence of the game interactions among DSO, GSO, and VPPO.
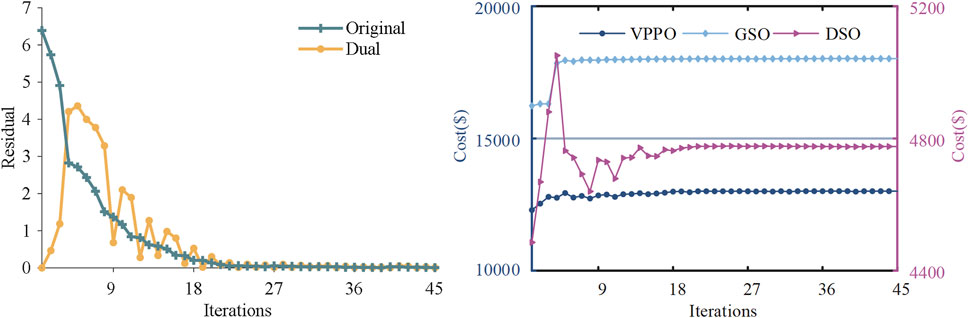
Figure 10. Convergence result for interactive iterative of multi-agent Stackelberg game.
Based on the residual convergence analysis presented in Figure 10A, it is evident that the proposed algorithm achieves the desired level of accuracy after 45 iterations, converging within 10–3, with a computation time of 329 s. Figure 10B visually demonstrates that the cost of purchased energy for the leading DSO and GSO converges to $4776.7 and $18,079.3, respectively, while the cost for the follower VPPO converges to $13009.4. This convergence indicates that the Stackelberg game between the DSO, GSO, and VPPO has reached equilibrium, where each agent cannot further reduce its operational cost by adjusting its trading strategy in isolation. These results highlight the strong convergence performance and computational efficiency of the distributed optimization algorithm proposed in this study.
In order to further validate the effectiveness of the adaptive ADMM algorithm proposed in this study, a comparative analysis with the fixed-step ADMM is conducted. The solution performance is documented in Table 2 for both fixed step size and adaptive step size ADMM. It is evident from Table 2 that the adaptive step-size ADMM, as opposed to the traditional ADMM, diminishes the reliance on the initial value selection through step size correction. This results in fewer iterations, reduced solving time, and enhanced solving efficiency.

Table 2. Comparison between traditional ADMM and ADMM with adaptive step size.
6 Conclusion
This paper introduces a bi-level model and its solution method for a multi-agent Stackelberg game focused on synergistic low-carbon trading within Virtual Power Plants (VPPs) participating in multi-energy systems under an energy-carbon integrated price response mechanism. The proposed trading strategy is analyzed and validated through an arithmetic example, leading to the following conclusions.
(1) The integrated energy-carbon pricing approach, based on the CEF theory, is more effective in incentivizing VPPs to adjust their energy-use and trading strategies with multi-energy systems compared to LMEP and LMGP pricing approaches. This encourages VPPs to procure energy from both power distribution and gas distribution networks during periods of low carbon intensity, thereby reducing carbon emissions.
(2) The proposed trading framework and multi-participant Stackelberg game model enhance energy interactions among participants, improving the economics and low-carbon benefits for each participant. Compared to traditional energy settlement methods, the integrated energy-carbon pricing method is shown to be more effective in this regard.
This study focuses on the trading of electricity and natural gas within a VPP with a multi-energy system. Future research will explore trading multiple energy sources and carbon emissions to achieve synergistic low-carbon trading. Furthermore, the impacts of renewable energy integration and load demand uncertainty in VPPs are also important areas for further investigation.
Data availability statement
The original contributions presented in the study are included in the article/Supplementary Material, further inquiries can be directed to the corresponding author.
Author contributions
YY: Writing–original draft, Writing–review and editing. SX: Conceptualization, Investigation, Methodology, Software, Supervision, Writing–review and editing. JT: Data curation, Funding acquisition, Methodology, Resources, Writing–review and editing. BQ: Investigation, Supervision, Visualization, Writing–original draft. XL: Software, Supervision, Validation, Writing–review and editing. FZ: Data curation, Formal Analysis, Software, Supervision, Validation, Writing–review and editing.
Funding
The author(s) declare that financial support was received for the research, authorship, and/or publication of this article. Project supported by Guangdong Provincial Key Laboratory of Intelligent Measurement and Advanced Metering of Power Grid Open-end Fund.
Conflict of interest
The authors declare that the research was conducted in the absence of any commercial or financial relationships that could be construed as a potential conflict of interest.
Publisher’s note
All claims expressed in this article are solely those of the authors and do not necessarily represent those of their affiliated organizations, or those of the publisher, the editors and the reviewers. Any product that may be evaluated in this article, or claim that may be made by its manufacturer, is not guaranteed or endorsed by the publisher.
Supplementary material
The Supplementary Material for this article can be found online at: https://www.frontiersin.org/articles/10.3389/fenrg.2024.1459667/full#supplementary-material
References
Bhuiyan, E. A., Hossain, M. Z., Muyeen, S. M., Fahim, S. R., Sarker, S. K., and Das, S. K. (2021). Towards next generation virtual power plant: technology review and frameworks. Renew. Sustain. Energy Rev. 150, 111358. doi:10.1016/j.rser.2021.111358
Chen, S., Conejo, A. J., Sioshansi, R., and Wei, Z. (2019). Unit commitment with an enhanced natural gas-flow model. IEEE Trans. Power Syst. 34 (5), 3729–3738. doi:10.1109/tpwrs.2019.2908895
Chen, W., Qiu, J., Zhao, J., Chai, Q., and Dong, Z. Y. (2023). Customized rebate pricing mechanism for virtual power plants using a hierarchical game and reinforcement learning approach. IEEE Trans. Smart Grid 14 (1), 424–439. doi:10.1109/tsg.2022.3185138
Chen, W., Qiu, J., Zhao, J., Chai, Q., and Dong, Z. Y. (2021). Bargaining game-based profit allocation of virtual power plant in frequency regulation market considering battery cycle life. IEEE Trans. Smart Grid 12 (4), 2913–2928. doi:10.1109/tsg.2021.3053000
Cheng, Y., Zhang, N., Lu, Z., and Kang, C. (2019b). Planning multiple energy systems toward low-carbon society: a decentralized approach. IEEE Trans. Smart Grid 10 (5), 4859–4869. doi:10.1109/tsg.2018.2870323
Cheng, Y., Zhang, N., Wang, Y., Yang, J., Kang, C., and Xia, Q. (2019a). Modeling carbon emission flow in multiple energy systems. IEEE Trans. Smart Grid 10 (4), 3562–3574. doi:10.1109/tsg.2018.2830775
Cheng, Y., Zhang, N., Zhang, B., Kang, C., Xi, W., and Feng, M. (2020). Low-carbon operation of multiple energy systems based on energy-carbon integrated prices. IEEE Trans. Smart Grid 11 (2), 1307–1318. doi:10.1109/tsg.2019.2935736
Kang, C., Zhou, T., Chen, Q., Wang, J., Sun, Y., Xia, Q., et al. (2015). Carbon emission flow from generation to demand: a network-based model. IEEE Trans. Smart Grid 6 (5), 2386–2394. doi:10.1109/tsg.2015.2388695
Li, Y., Wang, B., Yang, Z., Li, J., and Chen, C. (2022). Hierarchical stochastic scheduling of multi-community integrated energy systems in uncertain environments via Stackelberg game. Appl. Energy 308, 118392. doi:10.1016/j.apenergy.2021.118392
Liu, X. (2022). Research on optimal dispatch method of virtual power plant considering various energy complementary and energy low carbonization. Int. J. Electr. Power and Energy Syst. 136, 107670. doi:10.1016/j.ijepes.2021.107670
Lu, Q., Guo, Q., and Zeng, W. (2023a). Optimal dispatch of community integrated energy system based on Stackelberg game and integrated demand response under carbon trading mechanism. Appl. Therm. Eng. 219, 119508. doi:10.1016/j.applthermaleng.2022.119508
Lu, Z., Bai, L., Wang, J., Wei, J., Xiao, Y., and Chen, Y. (2023b). Peer-to-Peer joint electricity and carbon trading based on carbon-aware distribution locational marginal pricing. IEEE Trans. Power Syst. 38 (1), 835–852. doi:10.1109/tpwrs.2022.3167780
Sun, G., Zhang, Z., Zhou, Y., Han, H., Zang, H., and Wei, Z. (2023). Bi-level model for integrated energy service providers in joint electricity and carbon P2P market. J. Clean. Prod. 393, 136303. doi:10.1016/j.jclepro.2023.136303
Vasirani, MATTEO, Kota, RAMACHANDRA, Cavalcante, RENATO L. G., Ossowski, S., and Jennings, N. R. (2013). An agent-based approach to virtual power plants of wind power generators and electric vehicles. IEEE Trans. Smart Grid 4 (3), 1314–1322. doi:10.1109/tsg.2013.2259270
Wang, C., Wei, W., Wang, J., Liu, F., and Mei, S. (2018). Strategic offering and equilibrium in coupled gas and electricity markets. IEEE Trans. Power Syst. 33 (1), 290–306. doi:10.1109/tpwrs.2017.2698454
Wei, F., Jing, Z. X., Wu, P. Z., and Wu, Q. (2017). A Stackelberg game approach for multiple energies trading in integrated energy systems. Appl. energy 200, 315–329. doi:10.1016/j.apenergy.2017.05.001
Xie, S., Wu, Q., Hatziargyriou, N. D., Zhang, M., Zhang, Y., and Xu, Y. (2023). Collaborative pricing in a power-transportation coupled network: a variational inequality approach. IEEE Trans. Power Syst. 38 (1), 783–795. doi:10.1109/tpwrs.2022.3162861
Xie, S., Wu, Q., Zhang, M., and Guo, Y. (2024). Coordinated energy pricing for multi-energy networks considering hybrid hydrogen-electric vehicle mobility. IEEE Trans. Power Syst., 1–13. doi:10.1109/TPWRS.2024.3369633
Xu, Z., Guo, Y., and Sun, H. (2022). Competitive pricing game of virtual power plants: models, strategies, and equilibria. IEEE Trans. Smart Grid 13 (6), 4583–4595. doi:10.1109/tsg.2022.3184171
Yan, Z., Li, C., Yao, Y., Lai, W., Tang, J., Shao, C., et al. (2023). Bi-level carbon trading model on demand side for integrated electricity-gas system. IEEE Trans. Smart Grid 14 (4), 2681–2696. doi:10.1109/tsg.2022.3229278
Yang, Z., Hu, J., Ai, X., Wu, J., and Yang, G. (2021). Transactive energy supported economic operation for multi-energy complementary microgrids. IEEE Trans. Smart Grid 12 (1), 4–17. doi:10.1109/tsg.2020.3009670
Yi, Z., Xu, Y., Gu, W., and Wu, W. (2020a). A multi-time-scale economic scheduling strategy for virtual power plant based on deferrable loads aggregation and disaggregation. IEEE Trans. Sustain. Energy 11 (3), 1332–1346. doi:10.1109/tste.2019.2924936
Yi, Z., Xu, Y., Zhou, J., Wu, W., and Sun, H. (2020b). Bi-level programming for optimal operation of an active distribution network with multiple virtual power plants. IEEE Trans. Sustain. Energy 11 (4), 2855–2869. doi:10.1109/tste.2020.2980317
Zangeneh, A., Shayegan-Rad, A., and Nazari, F. (2018). Multi-leader–follower game theory for modelling interaction between virtual power plants and distribution company. IET Gener. . Transm. Dis. 12 (21), 5747–5752. doi:10.1049/iet-gtd.2018.5798
Zhang, L., Liu, D., Cai, G., Lyu, L., Koh, L. H., and Wang, T. (2023). An optimal dispatch model for virtual power plant that incorporates carbon trading and green certificate trading. Int. J. Electr. Power and Energy Syst. 144, 108558. doi:10.1016/j.ijepes.2022.108558
Zhang, T., and Hu, Z. (2022). Optimal scheduling strategy of virtual power plant with power-to-gas in dual energy markets. IEEE Trans. Industry Appl. 58 (2), 2921–2929. doi:10.1109/tia.2021.3112641
Keywords: virtual power plant, multiple energy systems, carbon emission flow, energy-carbon integrated price, multi-agent Stackelberg game
Citation: Yan Y, Xie S, Tang J, Qian B, Lin X and Zhang F (2024) Transaction strategy of virtual power plants and multi-energy systems with multi-agent Stackelberg game based on integrated energy-carbon pricing. Front. Energy Res. 12:1459667. doi: 10.3389/fenrg.2024.1459667
Received: 04 July 2024; Accepted: 19 July 2024;
Published: 09 August 2024.
Edited by:
Yitong Shang, Hong Kong University of Science and Technology, Hong Kong SAR, ChinaReviewed by:
Jian Chen, Shandong University, ChinaJiehui Zheng, South China University of Technology, China
Copyright © 2024 Yan, Xie, Tang, Qian, Lin and Zhang. This is an open-access article distributed under the terms of the Creative Commons Attribution License (CC BY). The use, distribution or reproduction in other forums is permitted, provided the original author(s) and the copyright owner(s) are credited and that the original publication in this journal is cited, in accordance with accepted academic practice. No use, distribution or reproduction is permitted which does not comply with these terms.
*Correspondence: Shiwei Xie, c2hpd2VpX3hpZUAxMjYuY29t