- 1Institute of Chemical Engineering and Environmental Technology, Graz University of Technology, Graz, Austria
- 2Institute of Solid State Physics, Graz University of Technology, Graz, Austria
Polytetrafluoroethylene (PTFE) is used as commercial hydrophobic treatment for gas diffusion layers (GDL) in polymer electrolyte fuel cells. This commercial hydrophobic treatment can reduce the electrical conductivity of GDLs and is facing an uncertain future due to the pending restriction of perfluoroalkyl substances (PFAS). Previously, we proposed surfactant doped polyaniline (PANI) coatings as a fluorine-free alternative hydrophobic treatment. Due to their anti-corrosion properties as well as the electrical conductivity, these coatings offer additional benefits for the GDL compared to PTFE. Prior work demonstrated improved maximum power of a low temperature polymer electrolyte fuel cell (LT-PEFC) using the PANI coated GDL compared to the commercial PTFE treated reference. Based on these findings, additional investigations are needed to optimize the coating and assess possible areas of applications. With this study, we propose the use of the coating in high temperature PEFCs due to its thermal stability determined via thermogravimetric analysis of polyaniline doped with different types of surfactants. A main focus of this work is the investigation of the uniformity and overall porosity of the polyaniline coatings on GDLs via µCT supported by deep learning. This analysis is complemented with fluid dynamics simulations to determine the tortuosity and the gas flow through the GDL. In the future, this approach could enable the optimization of the fluorine-free hydrophobic coatings in combination with the different layers of the membrane electrode assembly (MEA) such as the GDL and the catalyst layer to prevent mass transport limitations.
1 Introduction
Fuel cells can convert chemical energy to electrical energy via the oxidation of a fuel. Polymer electrolyte fuel cells (PEFCs) are gaining popularity due to their carbon neutral reaction principle based on the oxidation of hydrogen with water as waste product (Ozden et al., 2019).
Gas diffusion layers (GDLs) are a crucial component of PEFCs, responsible for the transport of reactant gases, water, electrons and heat (Okonkwo and Otor, 2021). State-of-the-art GDLs are designed as a porous structure to facilitate both the transport of reactant gases and water through their voids as well as the conduction of electrons through their solid structure (Ozden et al., 2019). In practice, this is achieved by the utilization of carbon paper or carbon cloth as a microporous substrate (MPS) and the deposition of a microporous layer (MPL) (Nanadegani et al., 2019). The MPL is added to the GDL to improve the performance and durability of the GDL and has a thickness between 10 and 100 µm (Ozden et al., 2019). The MPL has different functions such as suppressing the leaching of phosphoric acid from the membrane in high temperature polymer electrolyte fuel cells (HT-PEFCs) and supporting the GDL in the removal of liquid water in low temperature polymer electrolyte fuel cells (LT-PEFCs). (Nanadegani et al., 2019; Zucconi et al., 2024; Halter et al., 2020).
An optimization of the water management inside the cell is critical for PEFCs (Jiao and Li, 2011). On the one hand, water needs to be removed at high current densities to prevent flooding of the cell. When a cell is flooded, the water is blocking the pores of the GDL and is hindering the oxygen transport to the catalyst layer (Jiao and Li, 2011; Sasabe et al., 2013; Liu S. et al., 2021). On the other hand, water needs to be retained at low current densities to ensure a sufficient humidification of the membrane facilitating proton transport. Therefore, an optimized GDL needs to possess both hydrophobic and hydrophilic pores to be suitable for a wide range of operating conditions (Hao and Cheng, 2012).
Nowadays, PTFE or related fluorinated compounds are used for the hydrophobic treatment of the GDLs (Ozden et al., 2019). Commercially, the PTFE treatment is carried out by immersion coating. In this process, the carbon paper substrate is immersed into an aqueous suspension of PTFE, followed by drying the carbon paper in a furnace to remove the solvent (Ozden et al., 2019; Schweiss et al., 2016). However, PTFE tends to agglomerate, which can block the pores, inhibit oxygen and water transport and make the properties of the GDL nonuniform (Ozden et al., 2019; Liu S. et al., 2021; Rofaiel et al., 2012). Furthermore, whereas PTFE supports the removal of the water, excessive PTFE can reduce the thermal and electrical conductivity of the GDL (Lee et al., 2022). Therefore, substantial research went into the investigation of the deposition of PTFE and the optimization of the PTFE content by adjusting the concentration of PTFE in the solution as well as the subsequent drying step (Ozden et al., 2019; Li et al., 2021; Fishman and Bazylak, 2011; Biesdorf et al., 2015).
Apart from the engineering issues, there are also environmental considerations pressing for the development of a substitute to the PTFE-based hydrophobic treatments. PTFE belongs to the class of per- and polyfluoroalkyl substances (PFAS), which are a subject of concerns regarding human health and the environment. While some related chemicals such as perfluorooctanoic acid (PFOA) have been banned, the European Chemical Agency (ECHA) is striving for a general ban of PFAS (OECD, 2024; Blum et al., 2015; Iwabuchi et al., 2017; Bhhatarai and Gramatica, 2011; Kudo and Kawashima, 2003).
As shown in our previous work, surfactant doped polyaniline (PANI) coatings promise a fluorine-free alternative to conventional hydrophobic treatments (Tritscher et al., 2023). The surfactants are critical for the hydrophobicity of the coating since their hydrophilic heads are bonding to the charged polymer backbone of PANI and the hydrophobic tails are facing outward (Leng et al., 2012). In addition, the application of conductive polymers such as polyaniline could increase the overall conductivity of the GDL by substituting the insulating PTFE. Our in-situ tests of a low temperature PEFC operating around 85°C indicated an up to 42% higher maximum power when employing a polyaniline coated carbon paper as cathode GDL compared to the PTFE-treated reference (Tritscher et al., 2023).
The thermal stability of PANI could also enable applications in a higher temperature range of 120°C–200°C, such as the ones that HT-PEFCs generally operate in (Choi et al., 2017; Han et al., 2002; Kulkarni et al., 1989). Although here the removal of water is less critical and more independent from the morphology due to the formation in gaseous state, PTFE is needed to prevent the phosphoric acid from leaching (Zucconi et al., 2024; Mack et al., 2014). The loss of phosphoric acid from the membrane is one of the key degradation mechanism of this technology (Zucconi et al., 2024). Furthermore, optimized GDLs for HT-PEFCs in general have a lower porosity of 25%–45% (Zucconi et al., 2024; Xia et al., 2021), compared to 60%–90% for LT-PEFCs (see Table 1), (Zucconi et al., 2024) which simplifies the potential application of a coating. The lower porosity has the advantages of increasing the electrical conductivity of the GDL and preventing phosphoric acid loss (Chun et al., 2023; Huang et al., 2010). The pore size of the GDL has a key influence on the capillary pressure, which can prevent the phosphoric acid from penetrating from the membrane through the MPL and the CL towards the flow field (Halter et al., 2019). However, the MPL and CL can contain cracks up to 100 µm that require less capillary pressure to be penetrated by phosphoric acid (Halter et al., 2020; Chun et al., 2023). These aspects illustrate the importance of controlling the microstructure of porous materials to improve the durability of fuel cells.
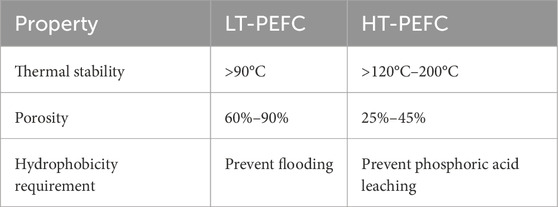
Table 1. Thermal stability, porosity and hydrophobicity requirements for LT and HT-PEFC (Zucconi et al., 2024).
In our prior work, we demonstrated the fabrication of these PANI coated GDLs via two different types of single step polymerization and coating techniques, namely, dip-coating based on chemical oxidative polymerization as well as electropolymerization (Tritscher et al., 2023). These tests showed a remarkable potential for the usage of PANI as PFAS-free coating, yet much remains to be understood regarding the layer structure. In particular the coating homogeneity through plane of the GDL and the potential to control it are subject to further analysis in the present work.
Scanning electron microscopy (SEM) is a well-known method for the investigation of the microstructure of a sample and has extensively been used for the material development of fuel cell components such as the GDL (Ha et al., 2011; Farmer et al., 2012). However, to reveal the internal structure, a technique called X-ray micro-computed tomography (µCT) is more applicable. µCT is a non-destructive technique that can be used for a wide range of sample materials, spanning from biological materials to electronic devices as well as for fuel cell material development (Vásárhelyi et al., 2020; van der Heijden et al., 2022; van Gorp et al., 2023).
To investigate the internal structure of the samples, µCT takes advantage of the varying X-ray attenuation of different materials or material phases. Projections are recorded from different directions and reconstructed to three-dimensional images (Stock, 2019). All singular slices of this three-dimensional sample representation then have to be segmented into different phases (e.g., pore and solid) to allow porosity analysis. The U-net convolutional network architecture uses strong data augmentation and allows fast training with relatively few manually segmented training images (Ronneberger et al., 2015). To improve the result even further, the segmentation process inside the Dragonfly analysis software (Comet Technologies Canada Inc.) can be performed 2.5-dimensional, taking the two neighbouring slices into account when deciding the phase of the voxel in question. Once the phase of all voxels is identified, the image can be refined by only keeping the largest 26-connected voxel structure (voxels connected through their six faces, twelve edges and eight corners) and by removing isolated, unconnected small islands. Further, the surface of a highly porous material can be defined with the help of the “rolling ball”-approach. A virtual sphere with a diameter of the approximate average diameter of the largest pore openings is moved over the surface. All pore voxels which were not intercepted by the sphere are kept and considered in the subsequent porosity calculations. Porosity is the ratio of the voxel volumes of pore and total (solid and pore) phase and is usually expressed as percentage (Gitis et al., 2021). The gathered µCT data also allows to calculate the porosity in a virtual box close to the coated surface and compare it to the porosity of another box inside the sample bulk. Furthermore, it is possible to use deep learning to recognize the long and straight carbon paper fibres and distinguish them from other solid material. With sufficient resolution, this could be used to calculate the ratio of exposed fibre surface area. The generation of three dimensional images and the assessment of the properties based on deep learning lays the basis for further analysis methods like pore network modelling (openPNM/poreSpy). This opens the possibility of investigating the tortuosity of the samples, which is a key parameter for the mass transport through the GDL.
Therefore, µCT supported by machine learning is used in this work to examine the local and overall porosity as well as the tortuosity of PANI coated GDLs and enable an optimization of the coating thickness. In the future, this approach could be used to optimize the interaction of the novel PANI-based hydrophobic treatment and the porous layers in PEFCs to avoid mass transport limitations and improve the performance. This structural analysis is complemented by TGA, FTIR and CA measurements to assess a possible extension of the application of the coating from LT to HT-PEFCs.
2 Materials and methods
2.1 Materials
All chemicals were used as received without further purification. Aniline (≥99.5%) was purchased from Roth, HCl and p-toluene sulphonic acid (≥98.5%, pTSA) were purchased from Sigma-Aldrich. Sodium dodecylsulphate (>85%, SDS) and (NH4)2SO4 (98%, ammonium persulphate (APS)) were purchased from Merck. Deionized water was used for the synthesis and for washing the samples. The commercially available carbon paper AvCarb EP40 was used as substrate for the dip-coating and the electrocoating. Further, the commercially PTFE-treated AvCarb EP40T is used as a reference. EP40T is the PTFE treated version of EP40 and has a PTFE content of 13 wt%.
2.2 Synthesis
The polyaniline coated gas diffusion layers were produced by two different techniques that are based on the procedures previously reported (Tritscher et al., 2023). Both, the chemical oxidative polymerization, as well as the electropolymerization, consist of a single combined polymerization and coating step, that is performed to synthesize and deposit the polyaniline on the carbon paper substrate.
In brief, for the electrochemical synthesis, carbon paper was used as working electrode, Ag/AgCl (3 M KCl) was used as reference electrode and a glassy carbon rod was used as counter electrode. Monomer and counter ion concentration as well as electrochemical parameters are depicted in Table 2.
For the chemical polymerization, 150 mL of solution A containing aniline and primary dopants as well as 150 mL of solution B, containing oxidant APS and primary dopant were prepared. For all the solutions, the pH value was adjusted to 1 using HCl or pTSA. The concentrations for the chemicals used are depicted in Table 2. To start the polymerization, solution A was quickly added to solution B. The solution was vigorously stirred for 30 s, before adjusting the stir rate to 100 RPM and dipping the carbon paper into the solution. After 21 h the carbon paper was removed. Further, the PANI formed in the solution was collected and vacuum filtrated afterwards. Subsequently, the powder was used for analysis.
After the synthesis, the collected PANI powder as well as the electrochemically and the chemically coated GDLs were washed with deionized water and dried in a furnace at 60°C for 24 h.
The samples are labelled as “E” for electropolymerization, “D” for dip-coating and “P” for powder as well as with the name of the primary dopant (see Table 2).
2.3 Contact angle (CA) measurement
The Ossila Contact Angle Goniometer L2004A1 was used to determine the contact angle of the coated carbon paper as well as the reference. Using a syringe, 10 µL of deionized water were deposited on the sample and the contact angle was measured after 3 s. For each sample, three positions were investigated and for the electrocoated samples both sides were tested. The highest and the lowest determined values are used to provide the range of the contact angle of the samples.
2.4 Thermogravimetric analysis (TGA)
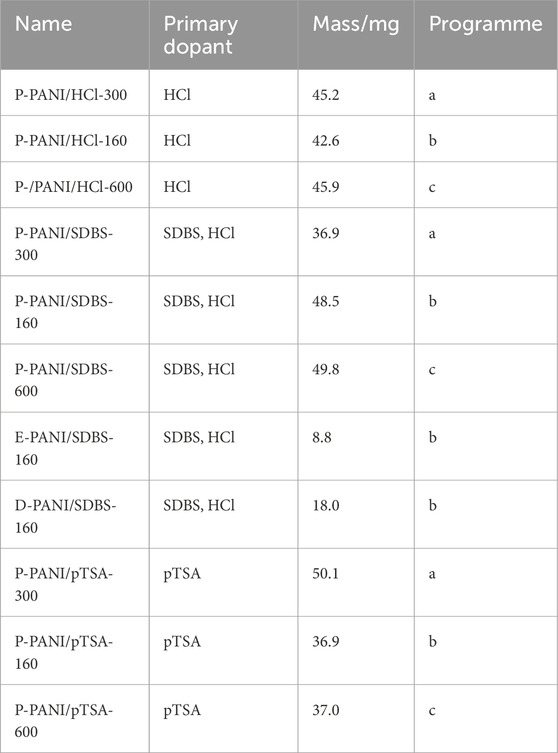
The Netzsch STA 449 C Jupiter thermogravimetric balance was used to perform the TGA. The dried powder and coated carbon paper from the chemical oxidative polymerization as well as the coated carbon paper from the electropolymerization were investigated. From each carbon paper, a 14 mm diameter disc was punched out using a hole punch. The samples were placed in a corundum plate sample carrier. Nitrogen was used as a purge gas with a flow of 150 mL/min, 100 mL/min coming from the top and 50 mL/min coming from the bottom towards the sample carrier. Three different heating programmes were used to study the thermal stability of the samples. Programme a) consists of a 3°C/min ramp to 300°C, constant temperature hold for 1 h and cooling to 90°C with a 3°C/min ramp. Programme b) consists of five one hour temperature holds at 160°C, interrupted by four 120°C temperature holds for 1 hour. The heating and cooling rate was set to 3°C/min. Programme c) consists of a 3°C/min ramp up to 600°C, holding the temperature for 1 h, before cooling down with 3°C/min to 90°C.
For the samples subjected to the thermal stability testing, the highest temperature is added to the label of the sample for identification. In Table 3 the mass and dopants of each sample are depicted.
2.5 Fourier-transformed infrared spectroscopy (FTIR)
The Fourier-transform infrared spectrometer Bruker Alpha II was used to record the IR spectra of the PANI before and after the TGA. PANI powder as well as PANI coated carbon papers were tested. Prior to each measurement, the samples were dried in a furnace at 60°C for 24 h. The measurement was performed in the range of 400–4,000 cm−1. For the analysis, a concave rubber band baseline correction was applied and the recorded spectra were normalized based on their most dominant peak.
2.6 X-ray micro-computed tomography (µCT)
Two Kapton tubes (inner diameter: 1.9 mm), each containing four sample carbon paper strips and several Kapton spacer sheets were prepared for the µCT measurements (see Supplementary Material). These measurements were performed using an UniTOM HR system. This system generates the X-ray beam in transmission, features a CMOS detector and has a maximal spatial resolution of 0.6 µm. For the measurement, the voxel size was selected to be 1.506 µm as a trade-off to allow the analysis of a sufficient sample size, while ensuring that the carbon fibres can be resolved. For samples E-PANI/SDBS-3 and 4 as well as EP40-3 and 4 the STAMINA method was used to investigate a larger sample size (De Samber et al., 2021). The tube was set to “microfocus” at 50 kV tube voltage, 6 W tube power and an emission current of 658 mA. For the detector, the “HW2SW1High”/“Bin 2 fast” mode was activated, meaning that neighbouring pixels were grouped together (2 by 2 pixels form one group) as if they were just one pixel to improve the signal-to-noise-ratio. The 3,048 × 1920 pixel detector therefore produced images of 1,524 × 960 pixels after binning. The images were recorded at 1,320 m exposure time, averaging over six images. 2,286 projections (360°) were acquired, resulting in a total acquisition time of 359 min.
The subsequent reconstruction was carried out using Panthera (TESCAN XRE). After adjusting the offset angle in top view to align the sample strips horizontally, the automatically determined centre of rotation was optimised manually to 764.881 for the first scan and 748.551 for the second scan. For both scans, a ring filter with the standard parameters (filter width 10° and 110° arc) was applied in addition. After reconstruction, the sample strips were cropped and analysed separately. During the cropping, attention was paid to exclude regions which were possibly damaged by the cutting process (0.1–0.2 mm from the edge) and to include the whole thickness from upper surface to the lower surface of the remaining part of the sample strips.
The segmentation for the porosity calculation was done using Dragonfly’s deep learning tool. All used models featured U-Net architecture with five depth levels, 64 initial filters and were 2.5-dimensional. The training was done by manually segmenting a few slices or slice regions and then training the model until the validation loss stagnated. Subsequently, if the targeted validation loss of 0.02 was not reached, more slices or frames were segmented manually, added to the training data and the model was trained again. After the segmentation, the solid phase was refined by removing small, unconnected islands. The “rolling ball” method and the “minimum bounding box” method were used to define the surface and therefore the extent of the total (solid and pore phase) volume (see Figure 1). (Hasanpour et al., 2015).
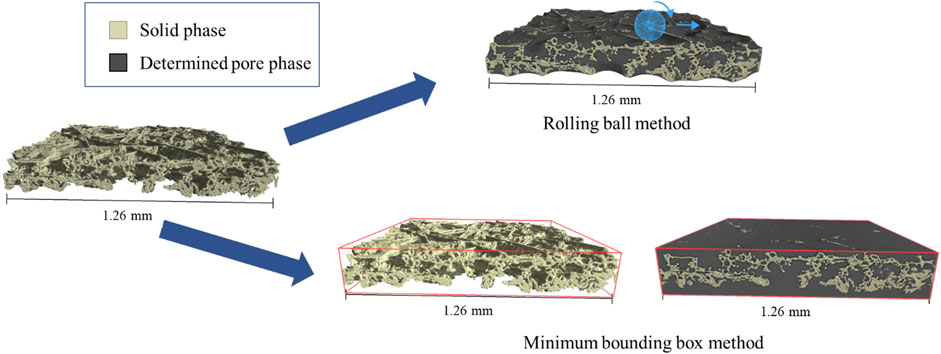
Figure 1. Graphic representation of defining the boundaries of the pore phase with the “rolling ball” method and the “minimum bounding box” method.
To compare the porosity of different regions within the GDL, two virtual boxes were defined in these regions of the cropped sample and the “rolling ball” method was used to define the surface. Within the boxes, the surface-area-to-volume ratio was calculated with the Dragonfly software using the marching cubes algorithm (Lorensen and Cline, 1987).
2.7 Pore network model
The pore network modeling approach, that was implemented by using the openPNM (Gostick et al., 2016) and poreSpy (Gostick et al., 2019) Python packages. The well-established numerical methods implemented in these packages, seeks to predict transport and tries to characterize the geometry in a geometrically simplified, graph-like representation of the pore space. Correspondingly, the transport simulation is approximated in two steps: (i) Create pore network from simple shapes to mimic the pore space and (ii) perform fluid dynamics simulation on the obtained pore network to predict characteristic parameters, like tortuosity or the gas permeability.
The pore network consists of spheres representing the pore bodies and cylinders representing the connecting pore throats. Relying on smooth elements like spheres connected via cylinders, as dynamic intrusion or drainage effects due to corners (e.g., snap-offs) will not be relevant for a stationary flow of air through originally air-filled pores. The stepwise method, which results in the flow simulations, starts by determining the pore network representation with the SNOW algorithm as implemented in the PoreSpy Python package (Gostick et al., 2019). The SNOW algorithm divides the pore space into non-overlapping regions. For each segmented 3D image, a distance map is acquired and the local maxima therein are recorded. The distance map provides a quantitative measure of the proximity of a void voxel to the solid phase within the porous material (ISO 5636-5, 2013). Local maxima in distance map represent specific points or locations within the porous structure at which the distance to the nearest solid phase is at its maximum value within a localized region, i.e., the positions of the local maxima will serve as pore centers. Processing of the distance map (i) eliminates maxima located on saddles and plateaus of the image and (ii) merges local maxima that are very close to each other. The voxelated nature of the binary segmentation images may introduce artifacts in the distance map such that artificial local maxima are introduced (Candemil et al., 2021). To mitigate such artificial maxima, we apply a Gaussian filter to the distance map prior passing it to the SNOW algorithm as suggested by Mayasari and Heryana (2019).
The number of maxima registered by SNOW depends on two parameters: Rmax, the maximum radius of the spherical structuring element in the watershed segmentation, and σ, the standard deviation of the Gaussian filter applied to the distance map, which primarily determine the configuration of the model structure. To make the pore networks of the individual segmentations as comparable as possible, the values of Rmax = 5 and σ = 0.3 were determined in an iterative process. Starting out from the distance transform, we systematically tested different values of σ in the range from 0 to 0.5 for Rmax values of 1–20, respectively. After getting the final set of local maxima, the maxima are transformed into a set of markers. A marker-based watershed technique assigns void voxels to each marker so that distinct regions (pores) can be discriminated (Gostick, 2017). Subsequently, the centroid of each region serves as coordinates of a sphere, which represents a certain region of the pore space. Furthermore, the same procedure was also applied to the background-region outside the sample. The spheres generated from this outer-regions are used in the fluid simulations to define the connectivity of the internal pore structure to the surrounding environment in the form of outlet- and inlet-pores (Gostick, 2017).
The pore volume is the total volume of all voxels in a region. The associated pore radius of the induvial spheres is the maximum value within the global distance map contained within each pore region, i.e., corresponds to the radius of the largest possible sphere that is fully contained in the pore region. The pore surface area is given by the number of solid-void interface voxels of the region multiplied by the area of a single voxel face (Gostick, 2017).
The connections between the regions governed by the SNOW algorithm (spheres) are represented as cylinders, which are referred to as throats. The dimensions of these throats depend on the shape of the of the connecting cross section area, between two neighboring regions. Therefore, the flow-simulations through such systems strongly depend on these connections which guide as the basis for the fluid dynamic analysis (Gostick, 2017).
Based on these pore networks, the openPNM package was used to determine the diffusional tortuosity, by applying a constant concentration difference
With the effective diffusivity
3 Results and discussion
3.1 Structure and porosity of the PANI-coated GDL
The porosity of the GDL is a key aspect for the mass transport and conductivity (Ozden et al., 2019; Omrani and Shabani, 2017). The application of a coating on a GDL could block pores and increase the mass transport resistance. Therefore, it is crucial to investigate the microstructure, porosity as well as the tortuosity when developing a coating.
To assess the capability of the µCT for structural investigations of coated GDLs, four different materials were examined. The pristine commercial carbon paper EP40, the PTFE-treated EP40T, a GDL electrocoated with 2.3 mg/cm2 PANI/SDBS as well as a dip-coated GDL with 8.3 mg/cm2 PANI/SDBS. Each of these material samples was investigated on multiple positions, the recorded data is referred to with the indices 1 to 4 (see Table 4, 5). Our approach was to train the model with a small section of each recorded position, for the software to learn how to distinguish between the different phases in the whole GDLs. Due to the similarity in the X-ray attenuation and the thin coating layer, it was not possible to differentiate between the graphitized binder of the carbon paper, the PTFE and the polyaniline. Nevertheless, it was possible to distinguish between the aforementioned components as one phase and the carbon fibres as another phase. Therefore, with this model, we were able to classify the samples of EP40, EP40T as well as E-PANI/SDBS into the phases i) carbon fibres, ii) graphitized binder and coating and iii) pores. However, for D-PANI/SDBS this was not possible and more training data of D-PANI/SDBS was needed to enable a classification in the phases.
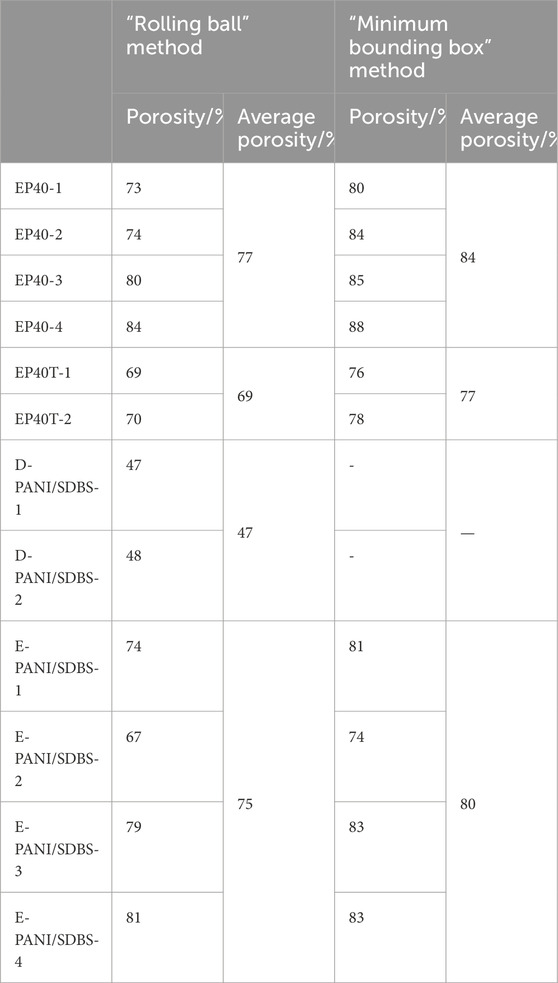
Table 4. Calculated average porosity of the dip-coated GDL D-PANI/SDBS, the electrocoated GDL E-PANI/SDBS and the commercial references. Porosity determined via i) “rolling ball” method and ii) “minimum bounding box” method.
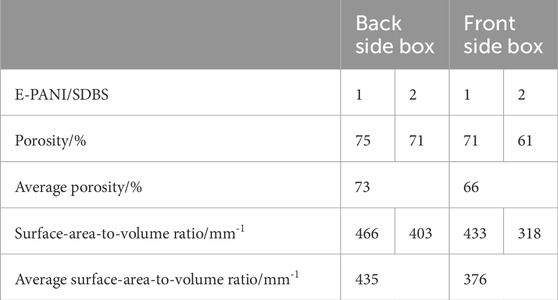
Table 5. Calculated overall and local porosity of the electrocoated GDLs with the “rolling ball” method.
Figure 2 shows the reconstructed three dimensional images of the samples. The carbon fibres are depicted as grey (see Figure 2A) and the binder, the PTFE and the PANI coating are coloured orange. When comparing EP40 in Figure 2B with EP40T in Figure 2C, more pores are closed off in EP40T due to the PTFE content. Figure 2D shows the dip-coated sample, which is covered in orange, indicating a thick layer of PANI.
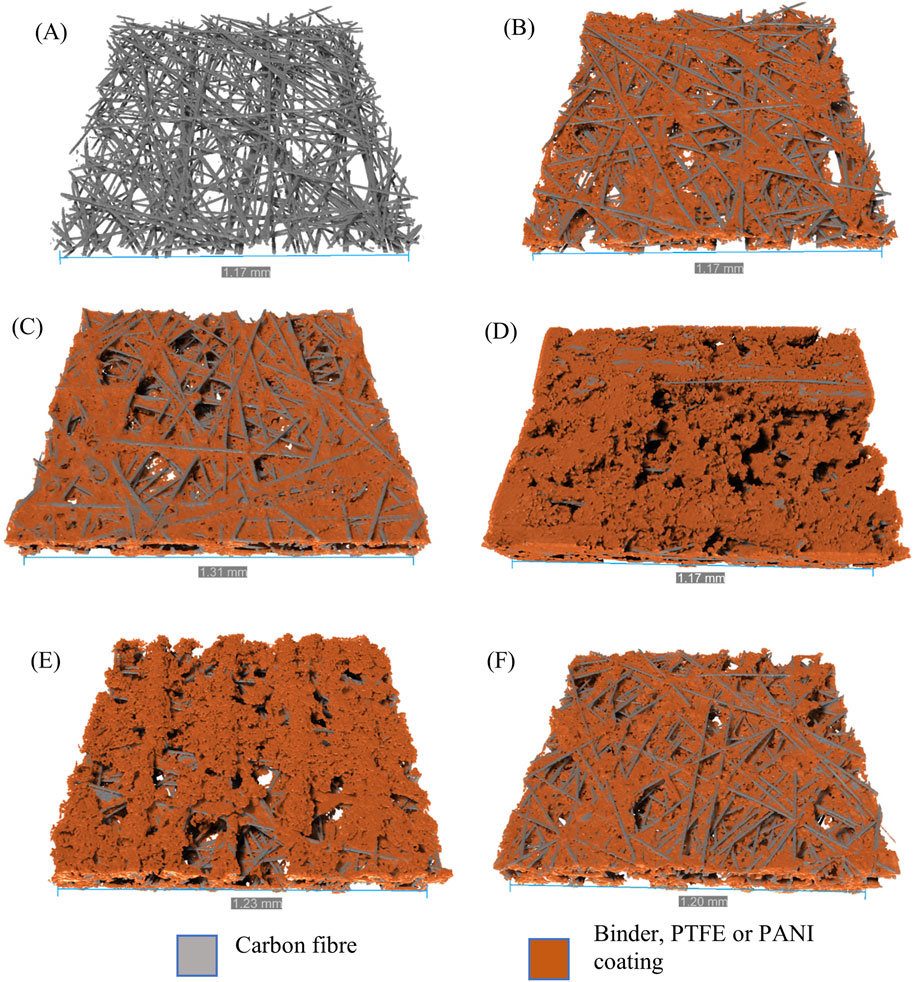
Figure 2. 3D reconstruction of samples (A) carbon fibres of EP40, (B) EP40, (C) EP40T, (D) D-PANI/SDBS, (E) E-PANI/SDBS (front) and (F) E-PANI/SDBS (back) via X-ray micro-computed tomography. Carbon fibres are depicted grey, binder, PTFE and PANI coating are orange.
The microstructure of the samples determined via µCT is depicted in Figure 3. Comparing the morphology of the uncoated sample EP40 in Figure 3A with the PANI coated carbon paper in Figures 3C, D, the globular shaped, porous structure of the polyaniline coating can be seen. With this magnification, the individual voxels that form the solid structure are visible and illustrate the limitation of the resolution with this method. With the selected voxel size of 1.506 µm it is possible to resolve the carbon fibres with a diameter of 9–11 µm (see Figure 3), but it is not possible to assess smaller pores.
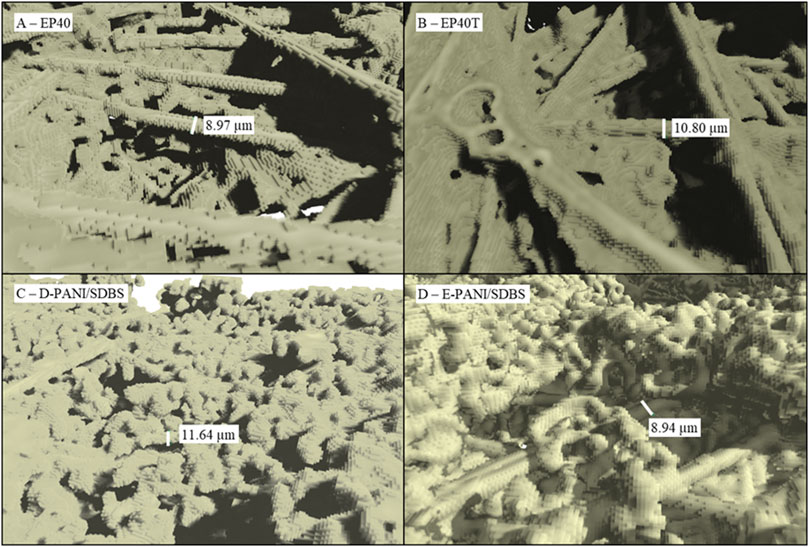
Figure 3. X-ray micro-computed tomography images of the morphology of (A) EP40, (B) EP40T, (C) D-PANI/SDBS and (D) E-PANI/SDBS.
In addition to the qualitative visual examination of the samples, the porosity was calculated from the recorded µCT data. The calculated porosities based on the two methods are depicted in Table 4. In general, the values determined with the “minimum bounding box” method are higher compared to “rolling ball”. In the “minimum bounding box” method a box is used to define the boundaries of the sample and consequently the pore space. Whereas in the “rolling ball” method, a sphere is moved over the surface of the sample and pore volumes that are intercepted by the sphere are not included in the pore volume. The size of the sphere depends on the average diameter of the largest. Therefore, only values calculated with the same method can be compared.
According to Odaya et al., the commercial carbon paper EP40 has a porosity of 82%, whereas Ozden et al. determined a porosity of 74% (Odaya et al., 2015; Ozden et al., 2018). With the “rolling ball” method, we calculated a mean porosity of 77% for EP40, whereas with the “box” method 84% were calculated. For EP40T we determined with the different methods 69% and 77%, respectively. Due to the PTFE content of EP40T the porosity is lower compared to EP40.
As can be seen in the three-dimensional images, the porosity of A-PANI/SDBS is lower compared to the other samples. An average porosity of 47% was calculated with the “rolling ball” method. While this porosity is too low for LT-PEFC applications where optimized GDLs have a porosity of 60%–90%, other technologies could benefit from these dense GDL structures.
The mean porosity of the electrocoated sample E-PANI/SDBS was determined to be 75% (“rolling ball”) and 80% (“box), which is slightly higher compared to EP40T, indicating less PANI deposited on the sample than PTFE deposited on EP40T. As can be seen in Figures 2E, F, the porosity is not uniformly distributed throughout the sample E-PANI/SDBS. In our previous study, we were using SEM to observe the preferred deposition of the coating on the side of the carbon paper that was facing the counter electron during the electrosynthesis. In this study, we are able to investigate the porosity gradient inside the sample via µCT. This gradient could improve the performance of a PEFC, since a porosity gradient increasing from the side of the catalyst layer toward the bipolar plates has been shown to improve the transport of reactants and the removal of water (Omrani and Shabani, 2017; Kong et al., 2017).
Figure 4D shows a cross-section image of the sample with white and turquoise features as well as a yellow and a red frame. The white features indicate a solid phase at this position in the depicted cross section image, whereas turquoise represents a pore in the depicted cross section, but has a solid phase in the background in one of the other cross section images. The grey box is the boundary of the measurement. The frames represent three dimensional boxes inside the sample (see Figure 5), that can be used to calculate the local porosity. One of the boxes is closer to the frontside (red, Figures 4D, 5A) and one is closer to the backside (yellow, Figures 4D, 5B) of the carbon paper.
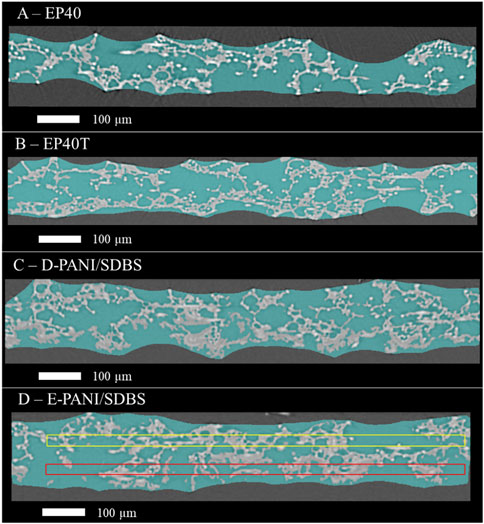
Figure 4. Cross-section (slice) of the segmented samples (A) EP40, (B) EP40T, (C) D-PANI/SDBS and (D) E-PANI/SDBS. Solid phase in this slice is depicted as white, solid phase in any of the other slices is turquoise. In (D) virtual boxes close to frontside and close to backside are depicted red and yellow, respectively.
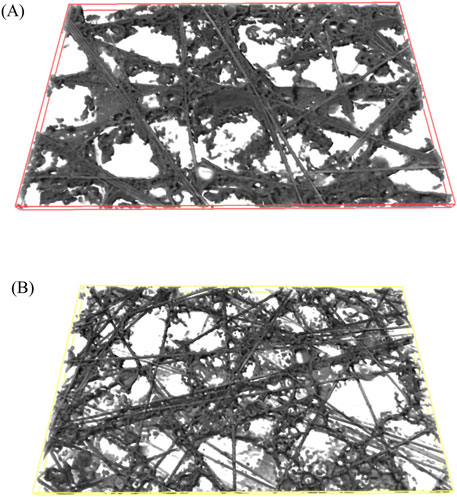
Figure 5. 3D reconstruction of the virtual boxes inside the sample E-PANI/SDBS. Solid phase is grey, voids are white. (A) shows the box closer to the frontside, (B) shows the box closer to the backside of the coated carbon paper.
In Table 5, the local porosities of the two E-PANI/SDBS samples are depicted. The boxes closer to the front have a lower porosity compared to the boxes in the back, which points towards a porosity gradient through the carbon paper.
When comparing the porosity values of the boxes between the two samples, the heterogeneous distribution of pore sizes in the pristine carbon paper substrate has to be considered. Carbon paper contains sections with large pores that can have a big influence on the determined porosity (Odaya et al., 2015; Phillips et al., 2012; Maheshwari et al., 2008). Therefore, the determined porosities of both boxes in E-PANI/SDBS-1 are higher compared to E-PANI/SDBS-2. Due to the pore size variations, the determined local porosity of the box in the back of the coated sample E-PANI/SDBS-2 is similar to the porosity values of the pristine sample EP40.
In addition to the porosity, the surface-area-to-volume ratio was calculated in the boxes depicted in Figure 4D. From the values given in Table 5 it is evident that the coated boxes have a lower surface-area-to-volume ratio compared to the uncoated boxes. This would indicate a lower ruggedness and fewer small pores in the coated region. However, since the voxel size of the µCT measurements was selected prioritizing the investigation of a sufficient sample area over high resolution, small pores might not have been detected (see Figure 3). PANI structures as well as the related pores frequently have pores below 1 µm (Tritscher et al., 2023; Reza et al., 2019). This limitation also influences the assessment of the coverage of the fibres with PANI, which cannot be answered by the produced three-dimensional images without increasing the resolution. However, in our last study we recorded SEM showing the fibres being covered with a layer of electrodeposited PANI (Tritscher et al., 2023).
Lastly, the fluid dynamics simulations on basis of the pore network model were performed. Although the base material carbon paper is strongly anisotropic because of the horizontally oriented fibers (Holzer et al., 2017), simulations were only performed in the through plane directions, since this is of primary interest for the transport of the reactants and the removal of water. Since these simulations are strongly influenced by local variations, a sample volume of approximately twice the size was examined. The new sets of measurements were performed on EP40-3 and EP40-4 as well as E-PANI/SDBS-3 and E-PANI/SDBS-4. In Table 6, the averaged values for the materials are depicted and the individual measurements can be found in the Supplementary Material. Based on the simulations, the tortuosity and the molar flow rate were calculated.

Table 6. Computed parameters for EP40 and E-PANI/SDBS, based on the average values of EP40-3 and EP40-4 as well as E-PANI/SDBS-3 and E-PANI/SDBS-4, respectively.
The value for the molar flow rate is normalized to the inlet area of the sample, that is described by its height and width to make the value of each measurement more comparable. Consequently, the molar flow rate has the unit mol s−1m−2. Due to the highly porous structure, of the EP40 and E-PANI/SDBS, many straight paths from the inlet to the outlet are present, which can be visually identified as non-obstructed pathways through the sample. As a result of that, the tortuosity would be expected to be 1. Therefore, the meaningfulness of this parameters as a comparison value would not be given. Since the aim is to identify parameters that represent the influence of the coating, the simulation was adapted in such a way that straight paths from the inlet to the outlet were ignored, and therefore a larger tortuosity, that represents the coating influence on more complex paths, is expected.
Following the normalization of the molar flow rate and the adaptation of the tortuosity, the absolute values of these parameters should not be considered as precise or definitive, rather it should be interpreted as comparing parameters between the different samples to indicate the changes in the flow simulation.
When comparing the values of the porosity of both methods, an expected decrease can be identified from EP40 to E-PANI/SDBS, due to the coating. This difference is also well represented by comparing the molar flow rate, as some pathways are now blocked, the adapted tortuosity is increased for E-PANI/SDBS.
In the future the gas permeability parameter obtained from a Stokes flow simulation, could also be obtained for the sample, but this would require some adjustments from the standard implementation of this procedure in the Python packages in order to cope for macropores, that were already discussed for the tortuosity parameter, and is also debated in Sadeghi et al. (2017)
In the framework of this work, these simulations enable a qualitative comparison between the properties of the samples. By increasing the sample volume, the accuracy could be improved in the future. Furthermore, during the sample preparation a compression or mechanical damage to the samples needs to be avoided to prevent an influence on the determined values.
3.2 Thermal stability of the PANI-coated GDL
The thermal stability of PANI has been extensively studied in literature (Kulkarni et al., 1989; Yue et al., 1991; Traore et al., 1991; Luo et al., 2006; Ansari and Keivani, 2006). In general, the TGA plot of PANI consists of three regions (Lee and Char, 2002). The initial mass loss can be attributed to the removal of moisture and water, which acts as a secondary dopant (Sinha et al., 2009). Rathod reported the removal of trapped moisture up to 120°C (Rathod et al., 2011), whereas Sinha et al. reported the removal of strongly bonded water between 150°C and 350°C (Sinha et al., 2009). The second mass loss is due to the loss of primary dopants and the related temperature range strongly depends on the type of dopants. Chloride ions have been reported to be removed from PANI in a wide temperature range of 100°C–300°C (Yue et al., 1991; Traore et al., 1991; Lee and Char, 2002; Chen et al., 2009), whereas surfactant dopants have been reported to be stable beyond 200°C (Choi et al., 2017; Kulkarni et al., 1989; Lee and Char, 2002). This is due to the large surfactants being trapped in the polymer and while the loss of chloride is facilitated by the formation of gaseous HCl (Sinha et al., 2009). The third mass loss region is due to the thermal degradation of the polymer backbone, which has been reported above temperatures of 400°C–500°C (Lee and Char, 2002; Sinha et al., 2009). The decomposition of the polymer is due to crosslinking reactions and graphitization (Sinha et al., 2009).
In HT-PEFCs, the system is commonly operated in a temperature range of 120°C up to 200°C (Zucconi et al., 2024). To assess the suitability of the PTFE-free PANI coatings for high temperature applications, a TGA was performed with PANI powder as well as with PANI coated carbon paper. Before and after the heat treatment, FTIR was recorded to investigate changes in the chemical composition.
Figure 6A shows the FTIR of the pristine powder. The conductive form of PANI is called emeraldine salt and consists of both benzenoid and quinoid structures in a theoretical ratio of 1:1. The stretching of the quinoid and benzenoid units can be used to identify emeraldine salt and the peaks can be seen at 1,574 cm−1 and 1,485 cm−1, respectively (Reza et al., 2019). The peak at 1,135 cm−1 corresponds to the protonated imine group and the peak at 1,245 cm−1 to the bipolaron stretching vibration. Both are structural features necessary for the electrical conductivity of emeraldine salt (Reza et al., 2019; Song and Xia, 2014; Govindaraj and Parida, 2019).
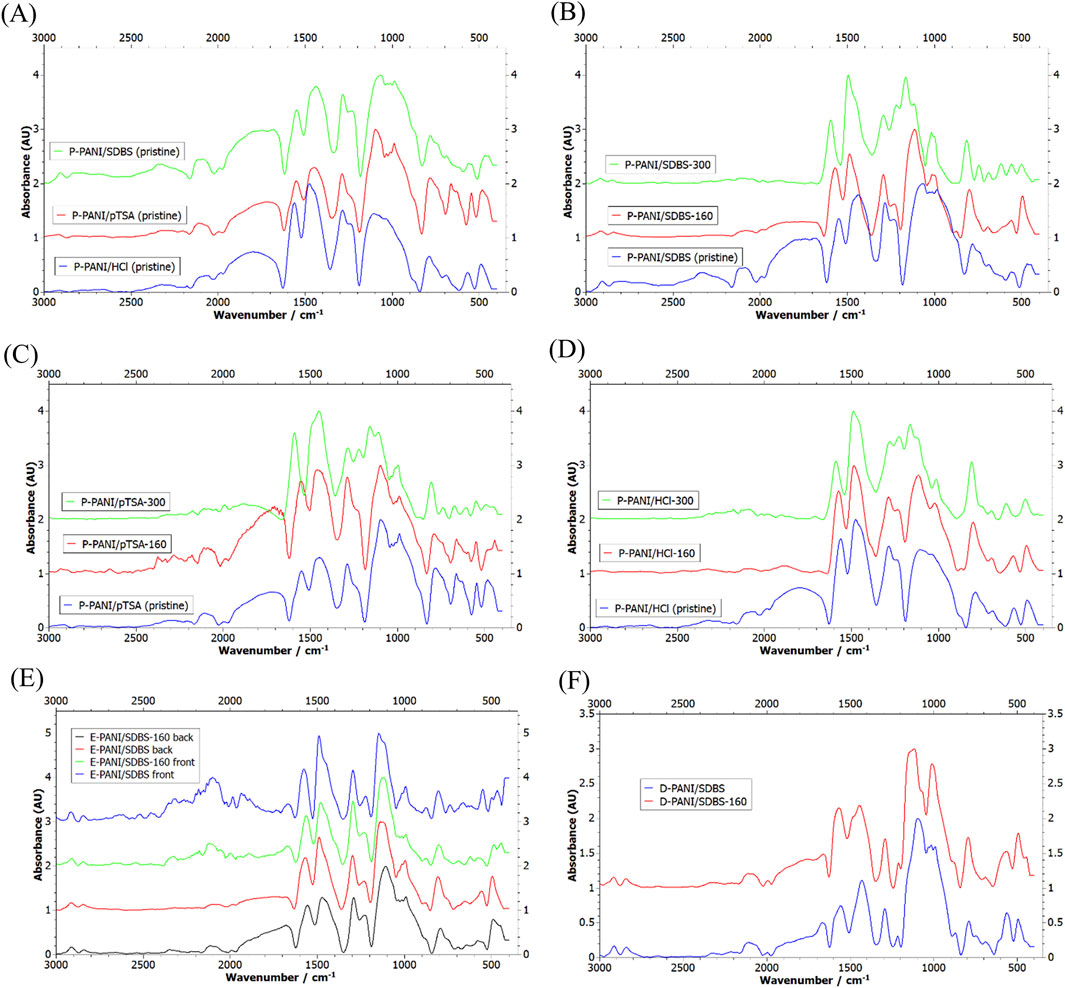
Figure 6. Recorded FTIR spectrum of (A) pristine PANI powder doped with HCl (blue), pTSA (red) and SDBS (green), (B) P-PANI/HCl after TGA, (C) P-PANI/pTSA after TGA, (D) P-PANI/SDBS after TGA, (E) E-PANI/SDBS frontside and backside, before and after TGA, and (F) D-PANI/SDBS before and after TGA.
Comparing the FTIR of the PANI powder before and after the heat treatment b) with five temperature holds at 160°C, it can be seen that the ratio of quinoid to benzenoid units is constant (see Figures 6B–D). This indicates the tested PANI powders are stable up to 160°C. The peak at 1,010 cm−1 can be assigned to the S=O stretching, which indicates the presence of the dopants SDBS and pTSA. However, during the chemical polymerization the oxidant APS was used, introducing hydrogensulphate as dopant (Stejskal et al., 2008). Therefore, this peak can be expected in all the samples.
When examining the recorded TGA of the PANI powders of programme a) consisting of a temperature hold at 300°C (see Figure 7A), it is evident that the structure has changed. The ratio of benzenoid units is increased for P-PANI/SDBS and P-PANI/HCl, which points towards a higher content of the not charged, reduced units that cannot bond with dopants. Further, for all the samples a reduction in the peak assigned to the S=O stretching is visible, implying a loss of the dopants. In addition, due to the heat treatment the characteristic peaks related to the protonated imine group and bipolaron stretching between 1,100 and 1,300 cm−1 are shifted and the valley at 1,200 cm−1 is missing. This suggests the conductive structure being altered and initial degradation of the polymer.
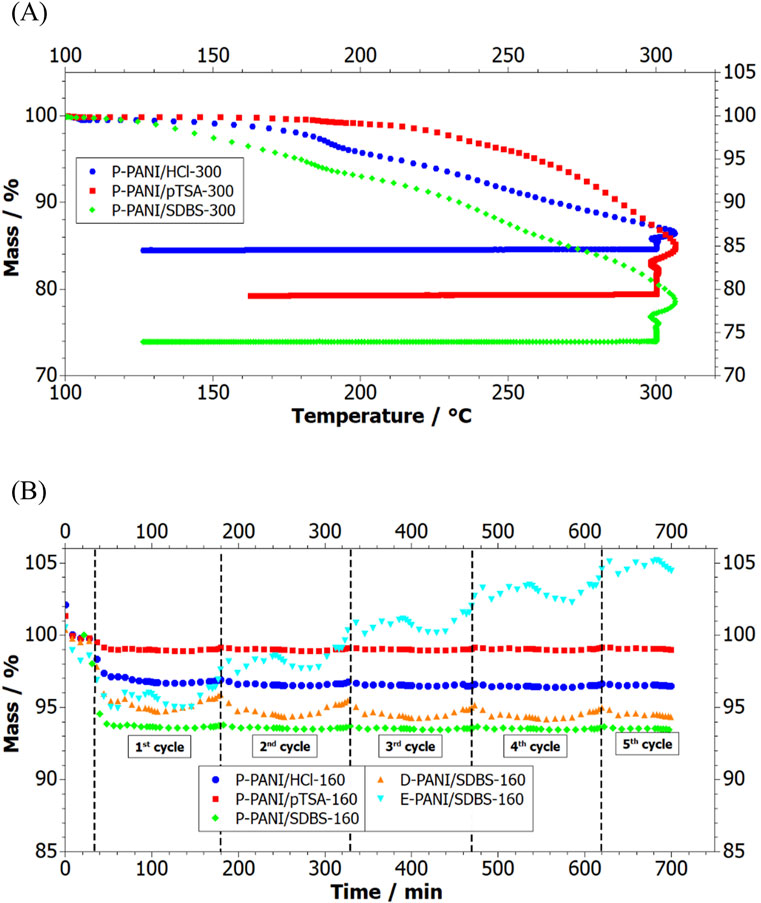
Figure 7. (A) TGA plot of PANI powder P-PANI/HCl-300, P-PANI/pTSA-300 and P-PANI/SDBS, (B) mass loss over time of powder P-PANI/HCl-160, P-PANI/pTSA-160, P-PANI/SDBS-160 as well as of coated carbon paper E-PANI/SDBS-160 and D-PANI/SDBS-160.
Looking at the recorded mass loss during the TGAs of the PANI powders (see Figure 7A), it can be seen that P-PANI/SDBS-300 has a continuous mass loss starting from 120°C and P-PANI/HCl-300 starts losing mass around 150°C, whereas P-PANI/pTSA-300 is stable until 200°C. The stable S=O peak in the recorded FTIR after heating to 160°C suggests the dopant SDBS being stable, the mass loss could be attributed to the removal of HCl or strongly bonded water. For the synthesis of P-PANI/SDBS and P-PANI/HCl HCl was used to adjust the pH to form the conductive form emeraldine salt, thereby introducing Cl− as dopant. An adjustment of the pH was not necessary when the acidic pTSA was used as a dopant, which could explain why the mass of P-PANI/pTSA is not altered below temperatures of 200°C. While HCl is one of the dopants known to provide PANI with the highest conductivity, it has no beneficial effect on the hydrophobicity. Therefore, and elimination of HCl does not set a limit to the operating temperature of the coating.
A comparison between the behaviour of the powder and the coated carbon papers when exposed to temperature programme b) is depicted in Figures 6B–F. For both D-PANI/SDBS-160 and E-PANI/SDBS-160 the recorded spectrum is similar compared to the one before the heat treatment, except for an increase in the ratio of benzenoid to quinoid units of E-PANI/SDBS. However, the intensity of the S=O peak is steady in both samples, indicating the presence of the dopant SDBS. This is in agreement with the stable mass of the samples during the heating, depicted in Figure 7B.
The reported temperature stability up to 160°C is sufficient for HT-PEFC applications. However, to reach the full operating temperature range and increase long term stability, an optimization of the process parameters of the PANI synthesis could be needed. This optimization could consist of mixing multiple dopants such as SDBS and pTSA or adjusting the electrochemical parameters to favour the formation of crystallin PANI. The reported thermal stability of doped PANI and PANI blends of over 250°C promises potential for future applications at even higher temperatures (Choi et al., 2017; Han et al., 2002). However, in addition to thermal stability, also the influence of the chemical environment, such as the pH value and the reactant gases in the cell, needs to be tested.
3.3 Wettability of the PANI-coated GDL
To investigate whether the surfactant doped polyaniline coatings are a possible substitute for the PTFE-based hydrophobic treatment, the contact angle of the GDLs were measured. Since the study of Halter et al. suggests the wetting behaviour of phosphoric acid at 160°C of GDLs is similar to water at room temperature (Halter et al., 2019), the testing was conducted with deionized water. In Table 7 the contact angle of the carbon paper substrate EP40, the commercially PTFE-treated carbon paper EP40T, the electrocoated carbon paper E-PANI/SDBS and E-PANI/HCl can be seen. In addition, the CA of E-PANI/SDBS of the front and back side are tested before and after the heat treatment. In Figure 8, the images of the CA measurements yielding the highest value of each samples are shown.
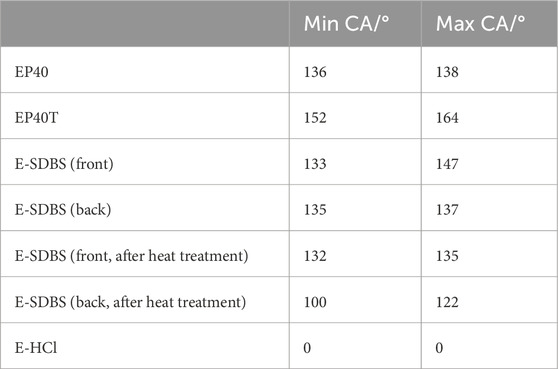
Table 7. Determined minimum and maximum contact angles (CA) of the PANI-coated GDLs and commercial reference.
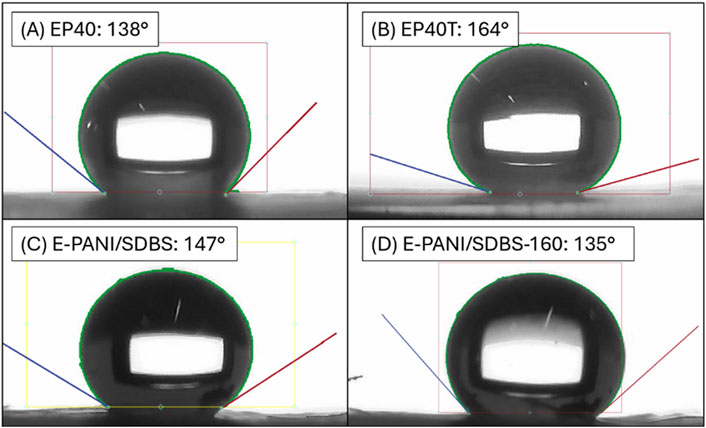
Figure 8. Images of the highest recorded contact angle of (A) EP40, (B) EP40T, (C) P-PANI/SDBS, and (D) P-PANI/SDBS-160.
It can be seen that both the pristine carbon paper and the PTFE treated carbon paper have a very high contact angle. The contact angle of E-PANI/SDBS is slightly below the PTFE-treated carbon paper and comparable to the pristine carbon paper. The reported CA are in the range of commercial GDLs which is about 100°–155° (Choi et al., 2023; Liu C. P. et al., 2021). On the front side of E-PANI/SDBS the highest measured CA is with 147° slightly higher than on the back side, but also a broader range was determined indicating less uniformity. This is due to the higher amount of PANI deposited on the front. After the heat treatment, the CA on the front side was reduced by about 1°–12°, whereas on the back side it was reduced by 10°–35°. Therefore, the coatings are able to sustain their hydrophobic properties after the heat treatment with 160°C.
It is known in literature that the microstructure of a sample can influence its hydrophobicity (Hosseini et al., 2019; Tian et al., 2022). Figure 3 shows the alteration of the microstructure of the carbon paper due to the deposition of the coating. However, the CA measurement of the GDL coated with PANI containing no surfactants demonstrates the importance of selecting the dopant. E-PANI/HCl consists of PANI with chloride ions as primary dopants that turn the coating hydrophilic. Hence, the water drop was absorbed by the carbon paper and it was not possible to determine a CA (see Table 7). The principle behind the surfactants turning PANI hydrophobic is explained Leng et al. with the hydrophilic heads of the surfactants bonding to the PANI backbone and their hydrophobic tails facing outward (Leng et al., 2012). The structure of the hydrophobic tail is an important characteristic being responsible for the maximum hydrophobicity.
In our previous study, we demonstrated the fabrication of fluorine-free GDLs for LT-PEFCs based on surfactant doped PANI. Using SDBS we were able to achieve contact angles up to 144°, whereas with other dopants such as pTSA the highest obtained value was 124° (Tritscher et al., 2023). High contact angles are required for an efficient removal of liquid water in LT-PEFCs, however operating temperature beyond the boiling point of water like in HT-PEFC, could enable the use of other dopants as well. These other dopants could be beneficial, since the large SDBS can disrupt the structure of polyaniline and increasing the distance between polymer chains (Oh and Kim, 2012). Therefore, alternative dopants such as pTSA have been reported to provide a higher conductivity, which could increase the overall performance of the fuel cell (Stejskal et al., 2008).
4 Conclusion
In this work, commercially available carbon paper was coated with a surfactant doped polyaniline via electropolymerization or chemical oxidative polymerization to fabricate fluorine-free GDLs for PEFCs. The PANI coated GDLs achieved a contact angle of up to 147°, which is comparable to commercially PTFE-treated GDLs. Since the surfactants are critical for the hydrophobic properties, the thermal stability of these dopants was examined by performing TGA followed by FTIR of the coated carbon paper and PANI powder. The recorded TGA points towards the PANI doped with SDBS being stable at temperatures of 160°C, which is supported by the FTIR measurements since the detected peaks were not altered. After the heat treatment, the coating was able to sustain contact angles of up to 135°. The recorded TGA PANI doped by pTSA indicates an even higher thermal stability of over 200°C (Choi et al., 2017; Han et al., 2002).These experiments suggest the surfactant doped PANI coatings being a suitable fluorine-free alternative to conventional hydrophobic treatments for both LT- and HT-PEFCs.
The structure and porosity of the PANI coated GDLs were analysed using µCT. The µCT was supported by deep learning, that helped identifying the different phases based on the different X-ray attenuation of the materials and characteristic feature shapes, by taking into account the voxels in neighbouring slices as well. Ultimately, it was possible to distinguish in the generated 3D images between phase 1 carbon fibres, phase 2 graphitized binder and PANI coating as well as phase 3 the voids in the porous GDL.
Based on this segmentation, the porosity, the surface-to-volume ratio as well as the tortuosity of the samples were determined. Using the “rolling ball” method, the porosity of the commercial carbon paper EP40 was determined to be 77%, which agrees with literature values (Odaya et al., 2015; Ozden et al., 2018). The commercially PTFE-treated sample EP40T and the electrocoated sample have a mean porosity of 69% and 75%, respectively, whereas the determined value of the dip-coated sample is 47%.
By defining boxes inside the electrocoated sample, it was possible to calculate the local porosity within these boxes, which allowed for an assessment of the porosity gradient that is introduced via the electrocoating of the sample. The box closer to the side facing the counter electrode during the synthesis had a porosity of 66%, whereas the box in the back had a porosity of 73%. Optimizing this porosity gradient within the GDL could support or take over the function of the MPL and improve the transport through the GDL.
Data availability statement
The original contributions presented in the study are included in the article/Supplementary Material, further inquiries can be directed to the corresponding author.
Author contributions
FT: Writing–review and editing, Writing–original draft, Methodology, Investigation, Data curation, Conceptualization. AP: Writing–review and editing, Writing–original draft, Methodology, Data curation. FB: Writing–review and editing, Data curation. WN: Writing–review and editing, Writing–original draft, Methodology, Data curation. MF: Writing–review and editing, Writing–original draft, Methodology, Data curation. EM-C: Writing–review and editing, Supervision, Methodology. VH: Writing–review and editing, Formal Analysis. MB: Writing–review and editing, Supervision, Project administration, Methodology, Conceptualization.
Funding
The author(s) declare that financial support was received for the research, authorship, and/or publication of this article. This work was funded by “Horizon Europe” of the European Union under the project MEAsureD (grant agreement No. 101101420). This research received support by the TU Graz Open Access Publishing Fund.
Conflict of interest
The authors declare that the research was conducted in the absence of any commercial or financial relationships that could be construed as a potential conflict of interest.
Publisher’s note
All claims expressed in this article are solely those of the authors and do not necessarily represent those of their affiliated organizations, or those of the publisher, the editors and the reviewers. Any product that may be evaluated in this article, or claim that may be made by its manufacturer, is not guaranteed or endorsed by the publisher.
Supplementary material
The Supplementary Material for this article can be found online at: https://www.frontiersin.org/articles/10.3389/fenrg.2024.1457519/full#supplementary-material
References
Ansari, R., and Keivani, M. B. (2006). Polyaniline conducting electroactive polymers: thermal and environmental stability studies. E. J. Chem 3, 202–217.
Bhhatarai, B., and Gramatica, P. (2011). Oral LD50 toxicity modeling and prediction of per- and polyfluorinated chemicals on rat and mouse. Mol. Divers 15, 467–476. doi:10.1007/s11030-010-9268-z
Biesdorf, J., Forner-Cuenca, A., Schmidt, T. J., and Boillat, P. (2015). Impact of hydrophobic coating on mass transport losses in PEFCs. J. Electrochem Soc. 162, F1243–F1252. doi:10.1149/2.0861510jes
Blum, A., Balan, S. A., Scheringer, M., Trier, X., Goldenman, G., Cousins, I. T., et al. (2015). The Madrid Statement on poly- and perfluoroalkyl substances (PFASs). Environ. Health Perspect. 123, A107–A111. doi:10.1289/ehp.1509934
Candemil, A. P., Salmon, B., Ambrosano, G. M. B., Freitas, D. Q., Haiter-Neto, F., and Oliveira, M. L. (2021). Influence of voxel size on cone beam computed tomography artifacts arising from the exomass. Oral Surg. Oral Med. Oral Pathol. Oral Radiol. 132, 456–464. doi:10.1016/j.oooo.2020.12.003
Chen, T., Dong, C., Li, X., and Gao, J. (2009). Thermal degradation mechanism of dodecylbenzene sulfonic acid-hydrochloric acid co-doped polyaniline. Polym. Degrad. Stab. 94, 1788–1794. doi:10.1016/j.polymdegradstab.2009.06.011
Choi, H., Choi, H. J., Kang, S. Y., Kim, J., Choi, H., Ahn, C. Y., et al. (2023). Optimization of hydrophobic additives content in microporous layer for air breathing PEMFC. J. Electroanal. Chem. 952, 117963. doi:10.1016/j.jelechem.2023.117963
Choi, Y. K., Kim, H. J., Kim, S. R., Cho, Y. M., and Ahn, D. J. (2017). Enhanced thermal stability of polyaniline with polymerizable dopants. Macromolecules 50, 3164–3170. doi:10.1021/acs.macromol.6b02586
Chun, H., Kim, D. H., Jung, H. S., Sim, J., and Pak, C. (2023). Effects of gas-diffusion layer properties on the performance of the cathode for high-temperature polymer electrolyte membrane fuel cell. Int. J. Hydrogen Energy 48, 27790–27804. doi:10.1016/j.ijhydene.2023.03.416
Comet Technologies Canada Inc Dragonfly, version 2022.2. Available at: https://www.theobjects.com/dragonfly (Accessed June, 2024).
De Samber, B., Renders, J., Elberfeld, T., Maris, Y., Sanctorum, J., Six, N., et al. (2021). FleXCT: a flexible X-ray CT scanner with 10 degrees of freedom. Opt. Express 29, 3438. doi:10.1364/oe.409982
Farmer, J., Duong, B., Seraphin, S., Shimpalee, S., Martínez-Rodríguez, M. J., and Van Zee, J. W. (2012). Assessing porosity of proton exchange membrane fuel cell gas diffusion layers by scanning electron microscope image analysis. J. Power Sources 197, 1–11. doi:10.1016/j.jpowsour.2011.08.064
Fishman, Z., and Bazylak, A. (2011). Heterogeneous through-plane porosity distributions for treated PEMFC GDLs I. PTFE effect. J. Electrochem Soc. 158, B841. doi:10.1149/1.3594578
Fu, J., Thomas, H. R., and Li, C. (2021). Tortuosity of porous media: image analysis and physical simulation. Earth Sci. Rev. 212, 103439. doi:10.1016/j.earscirev.2020.103439
Gitis, V., Rothenberg, G., Gitis, V., Rothenberg, G., Kiss, A. A., and Eisenberg, D. (2021). Handbook of porous materials, Singapore: World Scientific.
Gostick, J., Aghighi, M., Hinebaugh, J., Tranter, T., Hoeh, M. A., Day, H., et al. (2016). OpenPNM: a pore network modeling package. Comput. Sci. Eng. 18, 60–74. doi:10.1109/mcse.2016.49
Gostick, J., Khan, Z., Tranter, T., Kok, M., Agnaou, M., Sadeghi, M., et al. (2019). PoreSpy: a Python toolkit for quantitative analysis of porous media images. J. Open Source Softw. 4, 1296. doi:10.21105/joss.01296
Gostick, J. T. (2017). Versatile and efficient pore network extraction method using marker-based watershed segmentation. Phys. Rev. E. 96, 023307. doi:10.1103/PhysRevE.96.023307
Govindaraj, Y., and Parida, S. (2019). Autogenous chemical and structural transition and the wettability of electropolymerized PANI surface. Appl. Surf. Sci. 481, 174–183. doi:10.1016/j.apsusc.2019.03.075
Ha, T., Cho, J., Park, J., Min, K., Kim, H. S., Lee, E., et al. (2011). Experimental study on carbon corrosion of the gas diffusion layer in polymer electrolyte membrane fuel cells. Int. J. Hydrogen Energy 36, 12436–12443. doi:10.1016/j.ijhydene.2011.06.098
Halter, J., Bevilacqua, N., Zeis, R., Schmidt, T. J., and Büchi, F. N. (2020). The impact of the catalyst layer structure on phosphoric acid migration in HT-PEFC – an operando X-ray tomographic microscopy study. J. Electroanal. Chem. 859, 113832. doi:10.1016/j.jelechem.2020.113832
Halter, J., Gloor, T., Amoroso, B., Schmidt, T. J., and Büchi, F. N. (2019). Wetting properties of porous high temperature polymer electrolyte fuel cells materials with phosphoric acid. Phys. Chem. Chem. Phys. 21, 13126–13134. doi:10.1039/c9cp02149c
Han, M. G., Byun, S. W., and Im, S. S. (2002). Thermal stability study of conductive polyaniline/polyimide blend films on their conductivity and ESR measurement. Polym. Adv. Technol. 13, 320–328. doi:10.1002/pat.192
Hao, L., and Cheng, P. (2012). Capillary pressures in carbon paper gas diffusion layers having hydrophilic and hydrophobic pores. Int. J. Heat. Mass Transf. 55, 133–139. doi:10.1016/j.ijheatmasstransfer.2011.08.049
Hasanpour, S., Hoorfar, M., and Phillion, A. B. (2015). Different methods for determining porosity of gas diffusion layer using X-ray microtomography. Electrochim Acta 185, 34–39. doi:10.1016/j.electacta.2015.10.083
Holzer, L., Pecho, O., Schumacher, J., Marmet, P., Stenzel, O., Büchi, F. N., et al. (2017). Microstructure-property relationships in a gas diffusion layer (GDL) for Polymer Electrolyte Fuel Cells, Part I: effect of compression and anisotropy of dry GDL. Electrochim Acta 227, 419–434. doi:10.1016/j.electacta.2017.01.030
Hosseini, S., Savaloni, H., and Gholipour Shahraki, M. (2019). Influence of surface morphology and nano-structure on hydrophobicity: a molecular dynamics approach. Appl. Surf. Sci 536–546.
Huang, Y. X., Cheng, C. H., Wang, X. D., and Jang, J. Y. (2010). Effects of porosity gradient in gas diffusion layers on performance of proton exchange membrane fuel cells. Energy 35, 4786–4794. doi:10.1016/j.energy.2010.09.011
ISO 5636-5 (2013). Paper and board: determination of air permeance (Medium range) – Part 5: gurley method. Standard, Geneva: Standard: International Organization for Standardization.
Iwabuchi, K., Senzaki, N., Mazawa, D., Sato, I., Hara, M., Ueda, F., et al. (2017). Tissue toxicokinetics of perfluoro compounds with single and chronic low doses in male rats. J. Toxicol. Sci. 42, 301–317. doi:10.2131/jts.42.301
Jiao, K., and Li, X. (2011). Water transport in polymer electrolyte membrane fuel cells. Prog. Energy Combust. Sci. 37, 221–291. doi:10.1016/j.pecs.2010.06.002
Kong, I. M., Jung, A., Kim, Y. S., and Kim, M. S. (2017). Numerical investigation on double gas diffusion backing layer functionalized on water removal in a proton exchange membrane fuel cell. Energy 120, 478–487. doi:10.1016/j.energy.2016.11.100
Kulkarni, V. G., Campbell, L. D., and Mathew, W. R. (1989). Thermal stability of polyaniline. Synth. Met. 30, 321–325. doi:10.1016/0379-6779(89)90654-1
Lee, D., and Char, K. (2002). Thermal degradation behavior of polyaniline in polyaniline/Na+-montmorillonite nanocomposites. Polym. Degrad. Stab. 75, 555–560. doi:10.1016/s0141-3910(01)00259-2
Lee, F. C., Ismail, M. S., Ingham, D. B., Hughes, K. J., Ma, L., Lyth, S. M., et al. (2022). Alternative architectures and materials for PEMFC gas diffusion layers: a review and outlook. Renew. Sustain. Energy Rev. 166, 112640. doi:10.1016/j.rser.2022.112640
Leng, W., Zhou, S., Gu, G., and Wu, L. (2012). Wettability switching of SDS-doped polyaniline from hydrophobic to hydrophilic induced by alkaline/reduction reactions. J. Colloid Interface Sci. 369, 411–418. doi:10.1016/j.jcis.2011.11.080
Li, T., Wang, K., Wang, J., Liu, Y., Han, Y., Xu, Z., et al. (2021). Optimization of GDL to improve water transferability. Renew. Energy 179, 2086–2093. doi:10.1016/j.renene.2021.08.026
Liu, C. P., Saha, P., Huang, Y., Shimpalee, S., Satjaritanun, P., and Zenyuk, I. V. (2021). Measurement of contact angles at carbon fiber–water–air triple-phase boundaries inside gas diffusion layers using X-ray computed tomography. ACS Appl. Mater Interfaces 13, 20002–20013. doi:10.1021/acsami.1c00849
Liu, S., Wippermann, K., and Lehnert, W. (2021). Mechanism of action of polytetrafluoroethylene binder on the performance and durability of high-temperature polymer electrolyte fuel cells. Int. J. Hydrogen Energy 46, 14687–14698. doi:10.1016/j.ijhydene.2021.01.192
Lorensen, W. E., and Cline, H. E. (1987). Marching cubes: a high resolution 3D surface construction algorithm. Comput. Graph. 21, 163–169. doi:10.1145/37402.37422
Luo, K., Shi, N., and Sun, C. (2006). Thermal transition of electrochemically synthesized polyaniline. Polym. Degrad. Stab. 91, 2660–2664. doi:10.1016/j.polymdegradstab.2006.04.027
Mack, F., Klages, M., Scholta, J., Jörissen, L., Morawietz, T., Hiesgen, R., et al. (2014). Morphology studies on high-temperature polymer electrolyte membrane fuel cell electrodes. J. Power Sources 255, 431–438. doi:10.1016/j.jpowsour.2014.01.032
Maheshwari, P. H., Mathur, R. B., and Dhami, T. L. (2008). The influence of the pore size and its distribution in a carbon paper electrode on the performance of a PEM Fuel cell. Electrochim Acta 54, 655–659. doi:10.1016/j.electacta.2008.07.029
Mayasari, R., and Heryana, N. (2019). Reduce noise in computed tomography image using adaptive gaussian filter. Int. J. Comput. Tech. 7, 17–20. doi:10.48550/arXiv.1902.05985
Nanadegani, F. S., Lay, E. N., and Sunden, B. (2019). Effects of an MPL on water and thermal management in a PEMFC. Int. J. Energy Res. 43, 274–296. doi:10.1002/er.4262
Odaya, S., Phillips, R. K., Sharma, Y., Bellerive, J., Phillion, A. B., and Hoorfar, M. (2015). X-Ray tomographic analysis of porosity distributions in gas diffusion layers of proton exchange membrane fuel cells. Electrochim Acta 152, 464–472. doi:10.1016/j.electacta.2014.11.143
OECD (2024). Portal on per and poly fluorinated chemicals - about PFAS. Available at: https://www.oecd.org/chemicalsafety/portal-perfluorinated-chemicals/aboutpfass/, (Accessed June 2024).
Oh, M., and Kim, S. (2012). Synthesis and electrochemical analysis of polyaniline/TiO2 composites prepared with various molar ratios between aniline monomer and para-toluenesulfonic acid. Electrochim Acta 78, 279–285. doi:10.1016/j.electacta.2012.05.109
Okonkwo, P. C., and Otor, C. (2021). A review of gas diffusion layer properties and water management in proton exchange membrane fuel cell system. Int. J. Energy Res. 45, 3780–3800. doi:10.1002/er.6227
Omrani, R., and Shabani, B. (2017). Gas diffusion layer modifications and treatments for improving the performance of proton exchange membrane fuel cells and electrolysers: a review. Int. J. Hydrogen Energy 42, 28515–28536. doi:10.1016/j.ijhydene.2017.09.132
Ozden, A., Shahgaldi, S., Li, X., and Hamdullahpur, F. (2018). A graphene-based microporous layer for proton exchange membrane fuel cells: characterization and performance comparison. Renew. Energy 126, 485–494. doi:10.1016/j.renene.2018.03.065
Ozden, A., Shahgaldi, S., Li, X., and Hamdullahpur, F. (2019). A review of gas diffusion layers for proton exchange membrane fuel cells—with a focus on characteristics, characterization techniques, materials and designs. Prog. Energy Combust. Sci. 74, 50–102. doi:10.1016/j.pecs.2019.05.002
Phillips, R. K., Friess, B. R., Hicks, A. D., Bellerive, J., and Hoorfar, M. (2012). Energy procedia. Elsevier Ltd 29, 486–495.
Rathod, R. C., Didolkar, V. K., Umare, S. S., and Shambharkar, B. H. (2011). Synthesis of processable polyaniline and its anticorrosion performance on 316LN stainless steel. Trans. Indian Inst. Metals 64, 431–438. doi:10.1007/s12666-011-0099-0
Reza, M., Srikandi, N., Amalina, A. N., Benu, D. P., Steky, F. V., Rochliadi, A., et al. (2019). Variation of ammonium persulfate concentration determines particle morphology and electrical conductivity in HCl doped polyaniline in: IOP conference series: materials science and engineering (Bandung, Indonesia: Institute of Physics Publishing), 599.
Rofaiel, A., Ellis, J. S., Challa, P. R., and Bazylak, A. (2012). Heterogeneous through-plane distributions of polytetrafluoroethylene in polymer electrolyte membrane fuel cell gas diffusion layers. J. Power Sources 201, 219–225. doi:10.1016/j.jpowsour.2011.11.005
Ronneberger, O., Fischer, P., and Brox, T. (2015). Medical image computing and computer-assisted intervention – miccai 2015, 234–241.
Sadeghi, M. A., Aghighi, M., Barralet, J., and Gostick, J. T. (2017). Pore network modeling of reaction-diffusion in hierarchical porous particles: the effects of microstructure. Chem. Eng. J. 330, 1002–1011. doi:10.1016/j.cej.2017.07.139
Sasabe, T., Inoue, G., Tsushima, S., Hirai, S., Tokumasu, T., and Pasaogullari, U. (2013). Investigation on effect of PTFE treatment on GDL micro-structure by high-resolution X-ray CT. ECS Trans. 50, 735–744. doi:10.1149/05002.0735ecst
Schweiss, R., Meiser, C., Damjanovic, T., Galbiati, I., and Haak, N. (2016). SIGRACET® gas diffusion layers for PEM fuel cells, electrolyzers and batteries. Meitingen, Germany: Electrolyzers and Batteries.
Sinha, S., Bhadra, S., and Khastgir, D. (2009). Effect of dopant type on the properties of polyaniline. J. Appl. Polym. Sci. 112, 3135–3140. doi:10.1002/app.29708
Stejskal, J., Prokeš, J., and Trchová, M. (2008). Reprotonation of polyaniline: a route to various conducting polymer materials. React. Funct. Polym. 68, 1355–1361. doi:10.1016/j.reactfunctpolym.2008.06.012
Stock, S. R. (2019). MicroComputed tomography. Second edition. Boca Raton, FL: CRC Press/Taylor and Francis.
Tian, Y., Yan, S., Song, C., Wang, C., and Chen, J. (2022). Research on the influence of Micro-morphology on the hydrophobicity of material surface. Colloids Interface Sci. Commun. 46, 100556. doi:10.1016/j.colcom.2021.100556
Traore, M. K., Stevenson, W. T. K., Mccormick, B. J., Dorey, R. C., Wen, S., and Meyers, D. (1991). Thermal analysis of polyaniline Part I. Thermal degradation of HCl-doped emeraldine base. Synth. Met. 40, 137–153. doi:10.1016/0379-6779(91)91770-b
Tritscher, F., Mularczyk, A., Forner-Cuenca, A., Hacker, V., and Bodner, M. (2023). Surfactant doped polyaniline coatings for functionalized gas diffusion layers in low temperature fuel cells. Mater Adv. 4, 2573–2585. doi:10.1039/d2ma01104b
van der Heijden, M., van Gorp, R., Sadeghi, M. A., Gostick, J., and Forner-Cuenca, A. (2022). Assessing the versatility and robustness of pore network modeling to simulate redox flow battery electrode performance. J. Electrochem Soc. 169, 040505. doi:10.1149/1945-7111/ac5e46
van Gorp, R., van der Heijden, M., Amin Sadeghi, M., Gostick, J., and Forner-Cuenca, A. (2023). Bottom-up design of porous electrodes by combining a genetic algorithm and a pore network model. Chem. Eng. J. 455, 139947. doi:10.1016/j.cej.2022.139947
Vásárhelyi, L., Kónya, Z., and Vajtai, R. (2020). Microcomputed tomography–based characterization of advanced materials: a review. Mater Today Adv. 8, 100084. doi:10.1016/j.mtadv.2020.100084
Xia, L., Ni, M., He, Q., Xu, Q., and Cheng, C. (2021). Optimization of gas diffusion layer in high temperature PEMFC with the focuses on thickness and porosity. Appl. Energy 300, 117357. doi:10.1016/j.apenergy.2021.117357
Yue, J., Epstein A’b, A. J., Zhong, Z., Gallagher, P. K., and Macdiarmid, A. G. (1991). Synth. Met. 41-43, 765–768. doi:10.1016/0379-6779(91)91180-I
Keywords: polymer electrolyte fuel cell, gas diffusion layer, coatings, fluorine-free, micro computed tomography, deep learning model, porosity, pore network modelling
Citation: Tritscher F, Pranter A, Blaschke F, Napetschnig W, Fuchs M, Machado-Charry E, Hacker V and Bodner M (2024) Thermal stability and microstructure of fluorine-free hydrophobic coatings of gas diffusion layers for fuel cell applications. Front. Energy Res. 12:1457519. doi: 10.3389/fenrg.2024.1457519
Received: 30 June 2024; Accepted: 13 November 2024;
Published: 27 November 2024.
Edited by:
Xianguo Li, University of Waterloo, CanadaCopyright © 2024 Tritscher, Pranter, Blaschke, Napetschnig, Fuchs, Machado-Charry, Hacker and Bodner. This is an open-access article distributed under the terms of the Creative Commons Attribution License (CC BY). The use, distribution or reproduction in other forums is permitted, provided the original author(s) and the copyright owner(s) are credited and that the original publication in this journal is cited, in accordance with accepted academic practice. No use, distribution or reproduction is permitted which does not comply with these terms.
*Correspondence: Florian Tritscher, dHJpdHNjaGVyQHR1Z3Jhei5hdA==
 Florian Tritscher
 Alexander Pranter
 Fabio Blaschke1
 Werner Napetschnig
 Maximilian Fuchs
 Viktor Hacker
 Merit Bodner
