 Ning Zhou
 Jin-shuai Zhang
- State Grid Henan Electric Power Research Institute, Zhengzhou, China
Accurate prediction of photovoltaic power generation is of great significance to stable operation of power system. To improve the prediction accuracy of photovoltaic power, a photovoltaic power generation prediction machine learning model based on Transformer model is proposed in this paper. In this paper, the basic principle of Transformer model is introduced. Correlation analysis tools such as Pearson correlation coefficient and Spearman correlation coefficient are introduced to analyze the correlation between various factors and power generation in the photovoltaic power generation process. Then, the prediction results of traditional machine learning models and the Transformer model proposed in this paper were compared and analyzed for errors. The results show that: for long-term prediction tasks such as photovoltaic power generation prediction, Transformer model has higher prediction accuracy than traditional machine learning models. Moreover, compared with BP, LSTM and Bi-LSTM models, the Mean Square Error (MSE) of Transformer model decreases by 70.16%, 69.32% and 62.88% respectively in short-term prediction, and the Mean Square Error (MSE) of Transformer model decreases by 63.58%, 51.02% and 38.3% respectively in long-term prediction, which has good prediction effect. In addition, compared with the long-term prediction effect of Informer model, Transformer model has higher prediction accuracy.
1 Introduction
With the proposal of the Dual Carbon goals in China, reaching Carbon Peaking in the power industry has become an inevitable requirement for the development of the industry. The application of clean energy power generation technologies such as photovoltaic is an important measure to serve the country to achieve the goal of Carbon Peaking and Carbon Neutrality (Caineng et al., 2020; Han et al., 2022). With the large-scale expansion of photovoltaic power generation throughout the country, photovoltaic power generation prediction has gradually become an important issue in the photovoltaic power generation industry, and accurate photovoltaic power generation prediction is of great significance for the power station scale planning and power grid planning.
At present, there are many kinds of machine learning models used for photovoltaic power generation prediction. Among them, the more common machine learning models include long short-term memory network (LSTM), Bi-directional Long Short-Term Memory (Bi-LSTM), Back Propagation neural network (BP), Recurrent Neural Network (RNN), Gated Recurrent Unit (GRU) and Bidirectional Gated Recurrent Unit (Bi-GRU). These models are based on the extension and improvement of RNN structure (Nwaigwe et al., 2019; Liu, 2022), and have good prediction effect for the conventional data volume. However, with the rapid expansion of the scale of photovoltaic power generation and the substantial increase in the amount of data, the limitations of the traditional machine learning models have gradually shown. For example, for the large data volume tasks, the traditional machine learning models has a long computing time and limited data processing capacity, which may lead the prediction accuracy to be reduced (Liu, 2022). Due to its unique self-attention mechanism, the Transformer model greatly improves the computing power and processing efficiency, and performs well in the face of sequential problems and various regression problems. At present, researchers have mainly applied it to machine translation, semantic understanding, speech recognition, dialogue system and other fields, many results have been achieved, but it is not used much in the field of photovoltaic power generation prediction. Similarly, among the newly proposed models in recent years, Informer model, as an optimization of Transformer model, is innovative in that it adopts ProbSparse attention mechanism, self-attention distilling and generative decoder to improve the computational efficiency of the model. The model is good at extracting key information and optimizing the self-attention mechanism. At present, this model is rarely used in the field of photovoltaic power generation prediction.
Additionally, in the current photovoltaic power generation forecasting work, the selection of prediction factors is lack of unity, different researchers have great differences in the selection of prediction factors when predicting photovoltaic power generation. However, as a complex problem affected by many factors, the absence of important prediction factors will greatly affect the accuracy of the final prediction results. In addition, the selection of redundant factors not only increases the workload of data collection, but also may lead to excessive irrelevant factors and reduce the prediction effect. However, at present, few researchers have systematically analyzed the selection of prediction factors. This results in the current photovoltaic power prediction process lacking clear guidance for the selection of prediction factors. To solve the above problems, this paper will comprehensively discuss the correlation of prediction factors and the prediction results of various models.
In this paper, firstly, the basic principle of Transformer model is introduced, and its advantages in photovoltaic power generation prediction are analyzed. Secondly, the correlation analysis of each factor in the prediction of photovoltaic power generation is carried out, and the effective factors which can be used in the prediction of power generation is selected according to the analysis results. Finally, three traditional machine learning models, LSTM, Bi-LSTM and BP models, as well as the Transformer-like model (Informer), are compared with Transformer model, and the prediction accuracy and data fitting degree of each machine learning model have been analyzed.
2 Transformer model
The Transformer model was first proposed in 2017. Its biggest feature is that it abandons the traditional CNN and RNN structure, and the entire network structure is completely composed of self-attention mechanism. The network structure of Transformer model is shown in Figure 1, where the left half is the encoder block and the right half is the decoder block. The encoder consists of input, self-attention mechanism and feed-forward network. The structure of the decoder is similar to that of the encoder. Its input information is provided by the output, with the difference that the input to the encoder is the source sequence, while the output to the decoder is the target sequence. The self-attention mechanism of the decoder contains two Multi-Head Attention layers, and the first Multi-Head Attention layer adopts Masked operation. The main function of Masked operation is to use only the past information (the previous sequence tensor) when parameters are updated, rather than the present or future information. The second Multi-Head Attention layer integrates encoder and decoder output information. Finally, the decoder block output is converted to the final output by a fully connected layer Linear and Softmax (Vaswani et al., 2017).
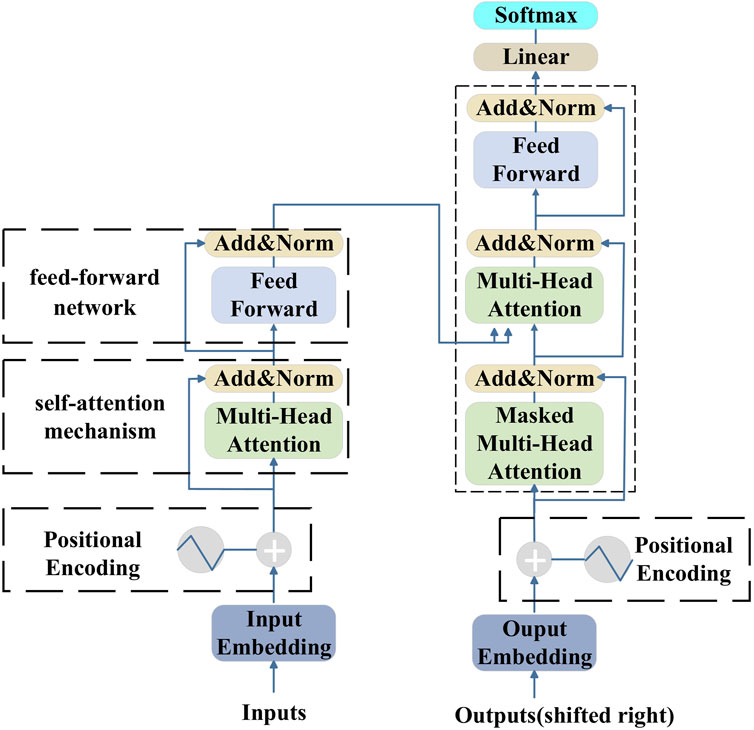
Figure 1. Architecture of the Transformer model.
Since Transformer model does not adopt the structure of RNN, it cannot directly capture the order information of the input sequence. Therefore, it is necessary to use the positional encoder to add position information to the word vector in Transformer model. Positional encoding is composed of positional encoder. The positional encoder obtains the word vector matrix with position information by adding the word vector and position vector, in which the position information PE is arranged according to the trigonometric formulas 1–3 as follows:
Where pos is the absolute position of the word vector in the context, dmodel represents the dimension of the word vector, and i represents the dimension of each value in the position vector.
Multi-Head Attention is the main component of encoder and decoder, which is realized by combining several self-attention mechanisms. Figures 2, 3 show the self-attention mechanism implementation method and calculation flow respectively. Each input vector an has a unique corresponding output vector bn, and each output vector bn is generated by the joint action of all input vectors an. This is sufficient to ensure that all output results are associated with their input sequences. The self-attention mechanism is calculated as shown in formulas 3–6:
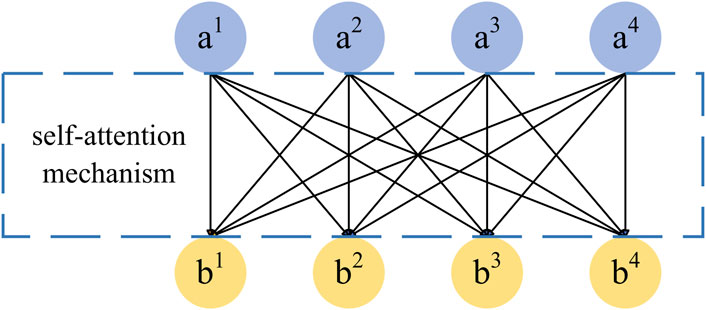
Figure 2. The flow chart of the self-attention mechanism.
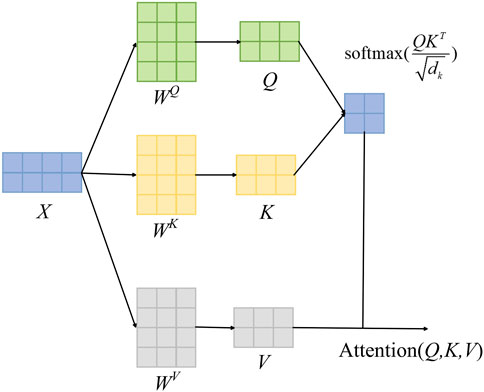
Figure 3. The calculation flow chart of the self-attention mechanism.
In the formula, X matrix is the word vector matrix processed by the position encoder, WQ, WK and WV are all weight matrices, and X matrix is dot multiplied with them respectively to obtain corresponding Q, K and V matrices. The V matrix is the Value matrix, and the Q and K matrices are the Query matrix and the Key matrix.
Multi-Head Attention consists of eight sets of self-attention mechanisms. By concatenating the calculation results of these eight self-attention mechanisms, the output of the Multi-Head Attention is obtained.
For the photovoltaic power generation prediction studied in this paper, it generally has high requirements on the prediction length, and it is necessary to obtain the predicted value of photovoltaic power generation in a long period of time in the future as much as possible to help the power grid to carry out power scheduling. At the same time, there are many factors affecting photovoltaic power generation, including the global horizontal radiation, humidity and other environmental factors, so photovoltaic power generation prediction essentially belongs to a long-sequence prediction problem. However, in the long-sequence forecasting, the traditional machine learning models has some limitations, such as LSTM and Bi-LSTM are difficult to accurately and comprehensively capture the feature relationship between variables when solving the multi-variable forecasting, which results in the increase of the model prediction error (Das et al., 2018; Sansa et al., 2021). In addition, in the face of complex functions with multiple variables, traditional machine learning models (such as BP model) are easily limited to local extreme values, leading to training failures, and thus affecting the prediction accuracy (Qing and Niu, 2018; Wang et al., 2019; Jiang et al., 2021; Yin and Xie, 2021). Compared with the above traditional machine learning models, the Transformer model can better capture the dependencies among long sequence input variables due to its unique self-attention mechanism, and can train global information at the same time, which makes the Transformer model show great potential in the face of multivariate long-sequence forecasting (Vaswani et al., 2017).
Therefore, this paper will use Transformer model to forecast photovoltaic power generation, and compare with traditional machine learning models such as LSTM, Bi-LSTM and BP model, as well as Transformer-like model (Informer) to verify the practical application effect of Transformer model in photovoltaic power generation prediction.
3 Correlation analysis of photovoltaic power generation prediction factors
In this study, the data comes from the Australian Desert Knowledge Solar Centre (DKASC), Alice Spring Photovoltaic System (Dkasolarcentre, 2024), their data is open and free to use. The photovoltaic system comprises 22 modules with a capacity of 265W, has a peak power output of 5.83kW, and the material of the photovoltaic cells is poly-Si. The array tilt of the photovoltaic power generation system is 20°, azimuth is/0° (solar north) (Zhou et al., 2020). The sampling time was from 1 January 2019 to 31 December 2023, and the sampling frequency was 5 min. A total of 456,217 pieces of data were obtained after data preprocessing and removal of incomplete data. Among them, the number of feature attributes is 7, including time, global horizontal radiation (GHR), diffuse horizontal radiation (DHR), rainfall, temperature, humidity and power generation, which are widely used by scholars for photovoltaic prediction. In the training phase, in order to reduce the influence of outliers, 12 sets of data per hour were summarized. Besides, the global horizontal radiation, diffuse horizontal radiation and power generation were summed, and the rainfall, temperature and humidity were averaged. After that, the results of photovoltaic power generation data with 1-h sampling frequency can be obtained, and a total of 38019 data were obtained in this paper.
Five characteristic attributes except power generation and time are used as the initial factors of photovoltaic power generation prediction, Pearson correlation coefficient and Spearman correlation coefficient are introduced as the basis of correlation analysis and judgment, and the correlation between each factor and photovoltaic power generation is studied.
3.1 Correlation coefficient
Pearson correlation coefficient r is one of the main means to analyze the correlation of factors, which can be used to measure the linear relationship between two random variables, and its formula is shown in formula 7:
Where Xi and Yi respectively represent the i th observation value of the two variables,
The use of Pearson correlation coefficient has a specific premise, that is, the evaluation data should meet the principle of continuous, linear, and normal distribution. However, for the photovoltaic power generation forecast data in this paper, it is impossible to judge the variable distribution relationship of the original data. Therefore, Spearman correlation coefficient ρ is also introduced for correlation evaluation. This method is used for correlation analysis based on the rank size of variables and does not require the distribution of original variables. It belongs to non-parametric statistical method and has a wide application range. The calculation formula of Spearman correlation coefficient is shown in formula 8:
In the formula, di represents the rank difference between Xi and Yi, that is, the difference between the positions of data after Xi and Yi data are sorted from smallest to largest (Li et al., 2022).
Correlation coefficients evaluation is described in Table 1, in which no correlation includes two cases of no correlation between variables and nonlinear correlation between variables. The correlation coefficient alone cannot be used to distinguish, so the scatter plot distribution of variables is needed to further judge the relationship between variables.
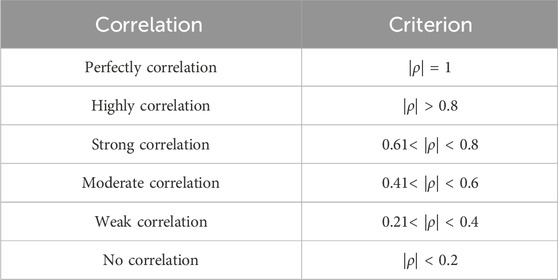
Table 1. Classification of correlation coefficients.
3.2 Correlation calculation result
Bring the above five prediction factors into the correlation coefficient calculation formula to calculate the correlation between each factor and photovoltaic power generation, and the results are shown in Table 2:
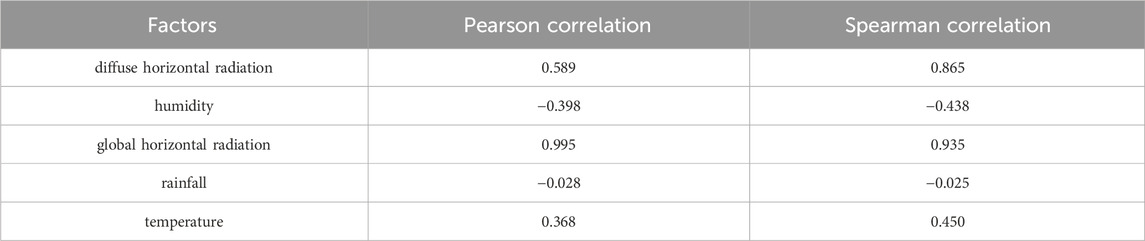
Table 2. Results of correlation coefficients.
For the convenience of presentation, the absolute value of the correlation coefficient is plotted as a bar chart, as shown in Figure 4. It can be found from the figure that there is a strong correlation between the global horizontal radiation and photovoltaic power generation, and the correlation coefficient reaches more than 0.93. Secondly, there is a moderate correlation between temperature, humidity and photovoltaic power generation, and the correlation coefficient is about 0.4. The absolute value of correlation coefficient between rainfall and power generation is very low, showing no correlation. The correlation between the diffuse horizontal radiation and the power generation has a large difference in the Pearson correlation coefficient and Spearman correlation coefficient, but both remain above 0.5, showing a strong correlation.
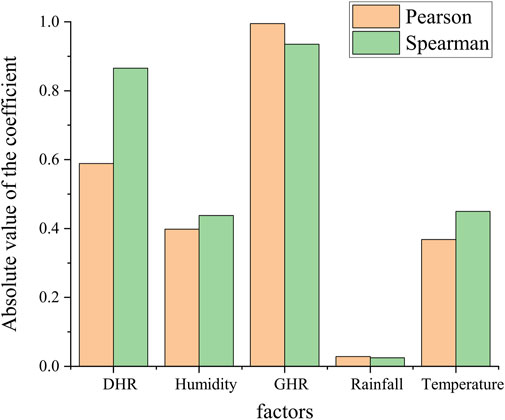
Figure 4. Analysis of prediction factors correlation.
Furthermore, to analyze whether there is a non-linear relationship between various prediction factors and power generation, 38019 data points were plotted as scatter plots of “prediction factors-power generation”, as shown in Figure 5. From the graph, it can be observed that the scatter plots of total solar radiation, humidity, and temperature all exhibit strong data concentration, which is consistent with the calculated correlation coefficients. In addition, it can be observed that the scatter plot of diffuse horizontal radiation also exhibits strong distribution characteristics in the dataset. However, there is not a complete linear relationship between the diffuse horizontal radiation and power generation. This finding explains the phenomenon that there is a significant difference in the Pearson correlation coefficient and Spearman correlation coefficient values in the correlation analysis between the diffuse horizontal radiation and power generation. The Pearson correlation coefficient has representation defects when facing non-linear relationship analysis problems such as scattered radiation value--power generation, and cannot accurately represent the strength of correlation between variables. The reason for this phenomenon is that photovoltaic power generation is influenced by multiple factors, and diffuse horizontal radiation is only one of the influencing factors. Therefore, there may be a non-linear relationship between diffuse horizontal radiation and photovoltaic power generation. The author believes that diffuse horizontal radiation still needs to be considered in photovoltaic power generation prediction. The scatter plot of rainfall shows obvious dispersion, indicating that its impact on photovoltaic power generation is minimal, and this factor can be ignored in power generation prediction.
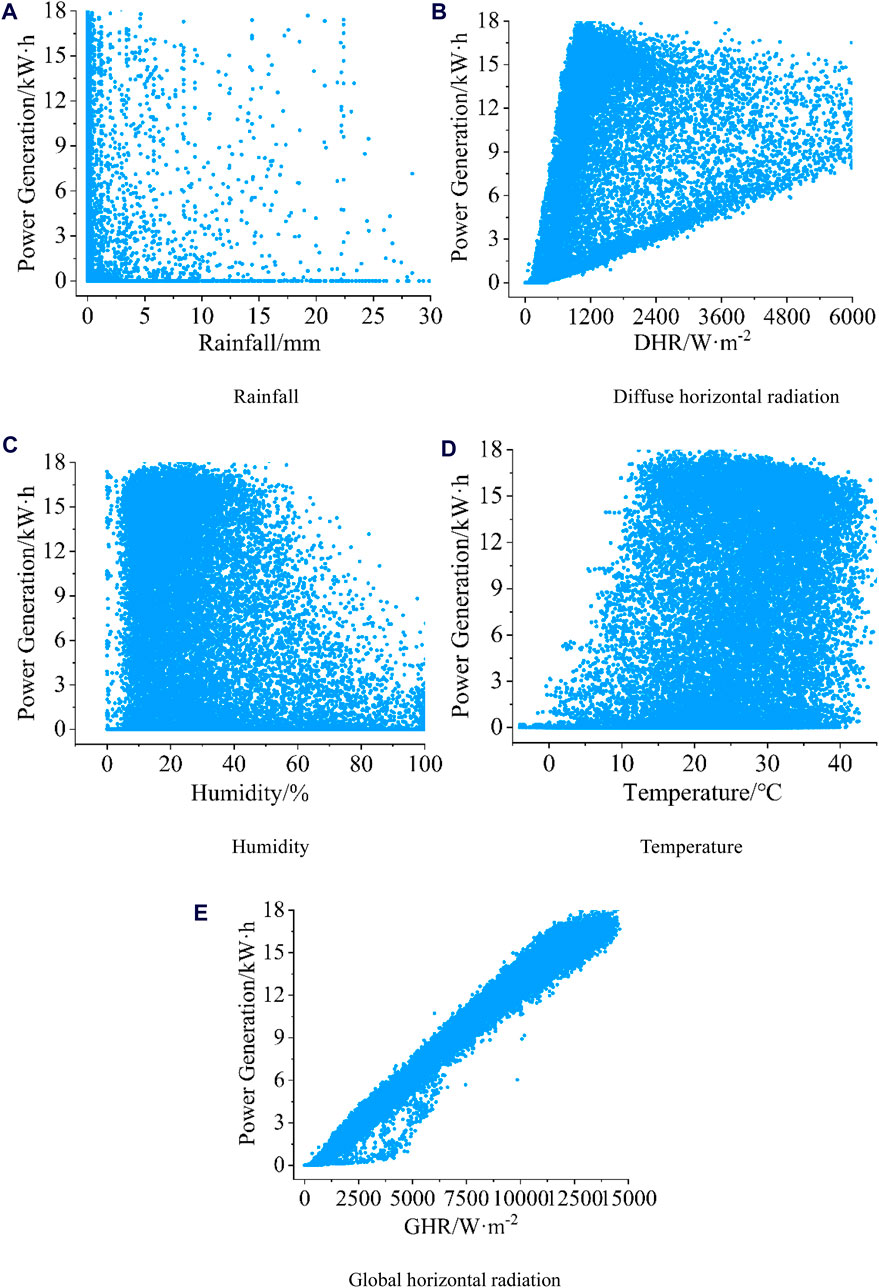
Figure 5. Scatter plots of prediction factors-power generation. (A) Relationship between Rainfall and power generation. (B) Relationship between diffuse horizontal radiation and power generation. (C) Relationship between Humidity and power generation. (D) Relationship between Temperature and power generation. (E) Relationship between global horizontal radiation and power generation.
In summary, in the prediction of photovoltaic power, temperature, humidity, global horizontal radiation and diffuse horizontal radiation should be used as the main prediction factors, while the rainfall and other factors should be reduced.
4 Prediction results and analysis of photovoltaic power generation
In this study, the training set and the test set were divided according to the 4:1 ratio, that is, the first 80% of the data set sequence was divided into the training set and the last 20% into the test set. Photovoltaic power generation is predicted using Python on the Windows operating system. Based on the prediction factors analyzed in Section 2.2, power generation is predicted under the same data set, and the prediction results of Transformer model are compared with those of traditional machine learning models.
4.1 Short-term prediction results
During the training of data set, epochs were set to 100 times, and the learning rate was continuously optimized and adjusted to get the best training model (Luo et al., 2021). Figure 6 shows the change trend of loss value for each model response with training epoch. When the training epoch reaches 100, the training loss of LSTM, Bi-LSTM, BP, Informer and Transformer are 0.252, 0.378, 0.397,0.761 and 0.075, respectively. It can be found that Transformer has the lowest training loss among all models.
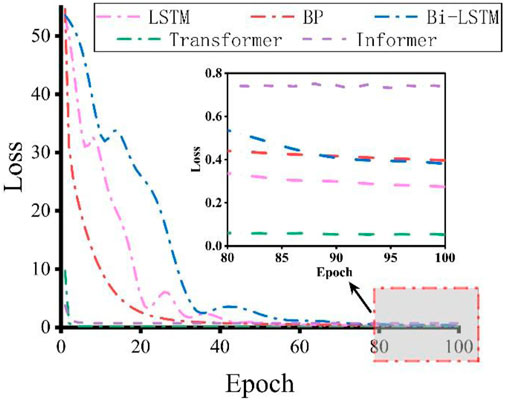
Figure 6. Training loss curves of different models.
Then, under the background of a 7-day short-term prediction, the training model was used to test the test set. Due to the large amount of data, 30 data prediction results were randomly selected from the test set to compare with the actual power generation for convenience of display, as shown in Figure 7.
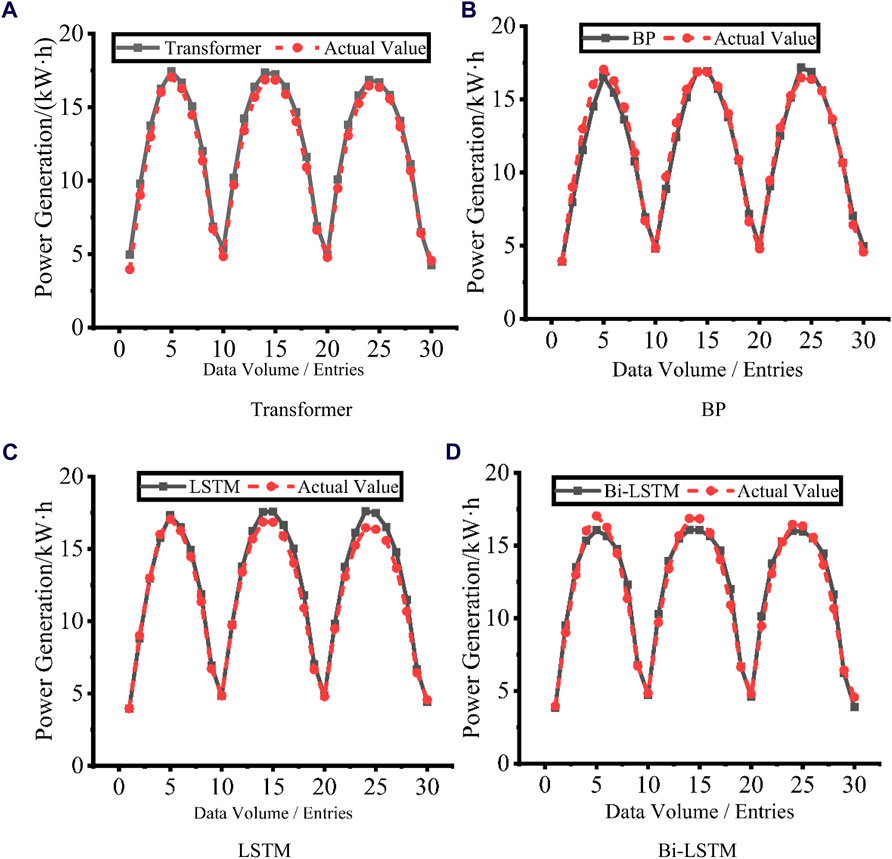
Figure 7. Comparison of actual and predicted values in short-term prediction. (A) Power generation comparison between the Transformer model and actual values over 30 data entries. (B) Power generation comparison between the BP model and actual values over 30 data entries. (C) Power generation comparison between the LSTM model and actual values over 30 data entries. (D) Power generation comparison between the Bi-LSTM model and actual values over 30 data entries.
As can be seen from the figure, the prediction result of Transformer model is basically consistent with the actual value, and BP, LSTM and Bi-LSTM models also achieve good prediction effect. Furthermore, in order to quantify the prediction accuracy of the four models, Mean Squared Error (MSE) and Coefficient of Determination (R2) are introduced to evaluate the prediction effect of each model. The calculation formula is shown in formulas 9, 10:
Where yi represents the actual value,
The predicted values and actual values of the four machine learning models for 7-day prediction are respectively brought into the error calculation formula, and the error analysis results are shown in Figures 8, 9.
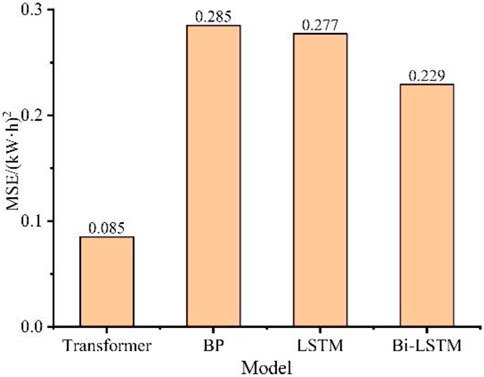
Figure 8. The Mean Squared Error (MSE) of PV power generation prediction results.
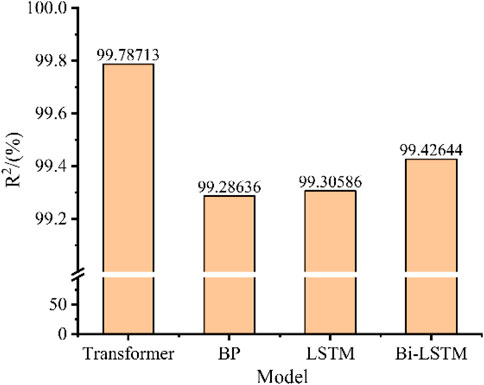
Figure 9. The Coefficient of Determination (R2) of PV power generation prediction results.
It can be seen from Figure 8 that the MSE of the four machine learning models in descending order is: Transformer < Bi-LSTM < LSTM < BP, in which the MSE of Transformer model is the smallest (0.085 (kW·h)2) and the MSE of BP model is the largest (0.285 (kW·h)2). Compared with three traditional machine learning models, BP, LSTM and Bi-LSTM, the Mean Squared Error of Transformer model is reduced by 70.16%, 69.32% and 62.88% respectively. This shows that Transformer model has better accuracy in short-term prediction of photovoltaic power generation.
As can be seen from Figure 9, the difference between the three machine learning models in the R2 of PV power generation prediction results is not as obvious as in MSE, and the results are consistent with MSE according to the ranking of the coefficients from the largest to the smallest. Among them, the R2 of Transformer model is the largest, reaching 99.82%, while the R2 of BP model is the smallest, reaching 99.29%. It can be shown that in the short-term prediction of photovoltaic power, Transformer model is significantly better than traditional machine learning models in terms of prediction accuracy and data fitting, and it has good prediction effect and application value.
4.2 Medium and long-term prediction results
Further, in order to study Transformer model’s performance in the context of medium to long-term prediction, Figure 10 shows the prediction results of various models for 21, 30, 90, 180, and 360 days, respectively. It can be seen from the Figure 10 that the calculated results of BP model differ greatly from the actual values under each prediction duration. The overall prediction effect of Transformer, LSTM and Bi-LSTM is relatively good, and the error does not change significantly with the increase of prediction time. The prediction results of Transformer model under different prediction time are basically consistent with the actual value curve, and the prediction effect is the best. MSE and R2 of the prediction results of the four machine learning model under different prediction duration are calculated, and the results are shown in Tables 3, 4. The best results are shown in bold. It can be found that Transformer model’s MSE and R2 are significantly better than other models under different prediction time, and Transformer model can still maintain high prediction accuracy with the increase of prediction time. When the predict time is 360 days, the Mean Square Error of Transformer model is reduced by 63.58%, 51.02% and 38.3% compared with BP, LSTM and Bi-LSTM, respectively. It can be shown that Transformer model has great advantages and good prediction effect in the face of multivariate long-sequence tasks such as long-term prediction of photovoltaic power.
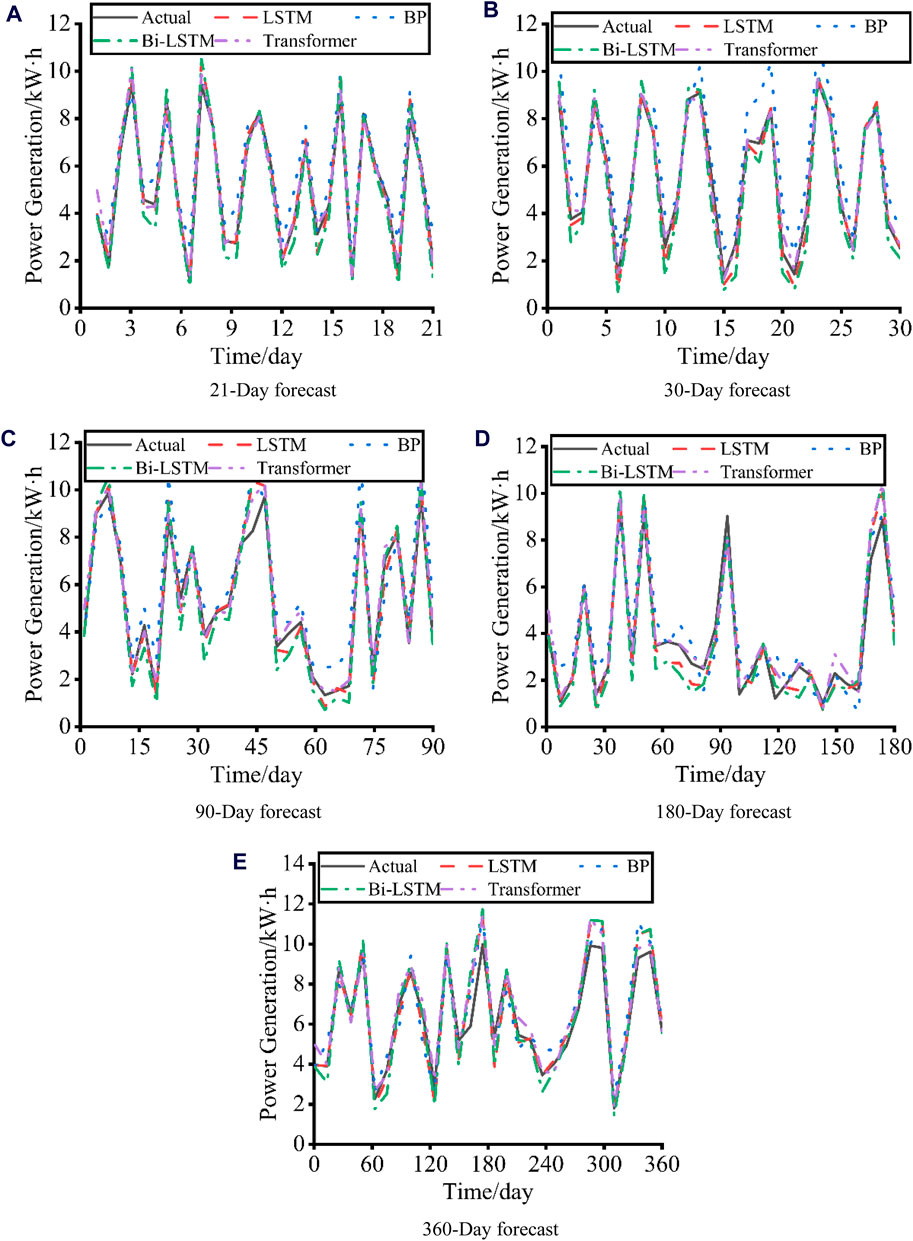
Figure 10. Comparison of actual and predicted values in long-term prediction.
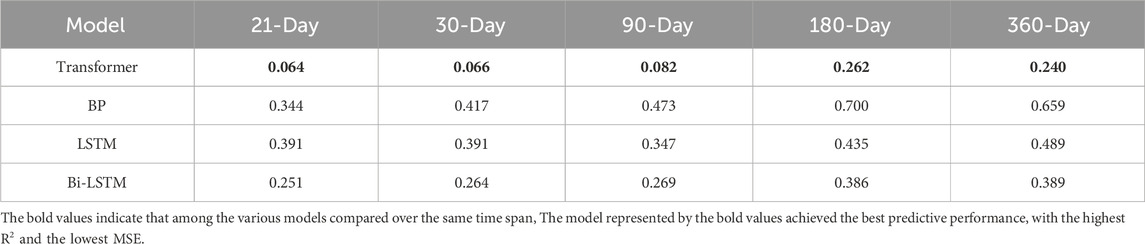
Table 3. MSE of each machine learning model in long-term prediction.
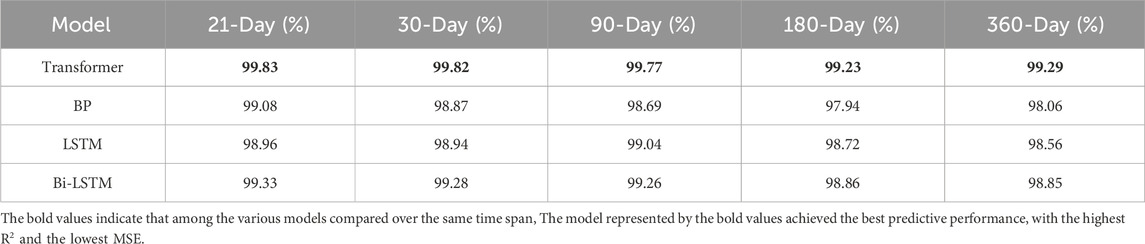
Table 4. R2 of each machine learning model in long-term prediction.
Since the effect of traditional machine learning model for short-term prediction has been enough to meet the production needs, so in this study, the author mainly compares the 180-day and 360-day prediction effects of Transformer model and Informer model, as shown in the Figure 11. As can be seen from the figure, when the prediction time is 180 days, the prediction results of the two models are more in line with the actual value. Transformer model is prone to deviation when predicting peak value, while Informer model is more stable. At 360 days, the Informer model starts to show occasional large prediction deviations, while the Transformer model’s prediction results are still accurate and stable. In order to make the prediction effect more concrete, MSE and R2 were introduced for analysis, and the results were shown in Tables 5, 6. It can be found that from the analysis of MSE and R2, the prediction effect of Transformer model is significantly better than that of Informer model, and the prediction effect of Informer model is even lower than that of traditional machine learning model. The author believes that this phenomenon may be caused by the following reasons: As the author has screened the predictive factors of photovoltaic power generation in Section 3, the Informer model pays less attention to influential factors in the self-attentional distilling process, which makes the Informer model fail to capture the relationship between factors and the final prediction effect is not ideal.
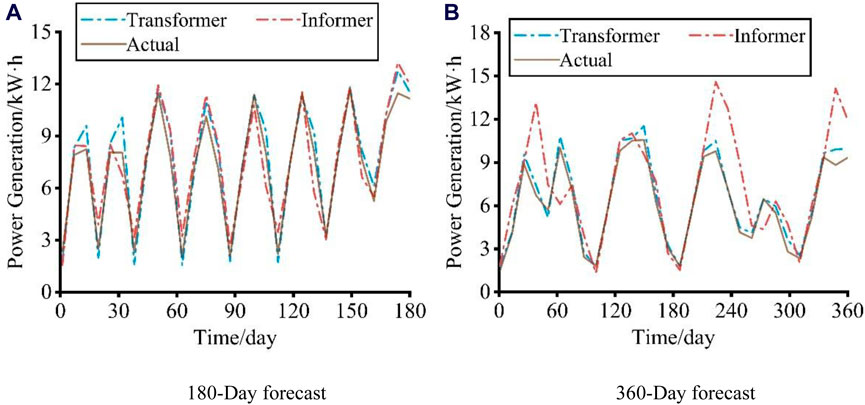
Figure 11. Comparison of Transformer and Informer forecast results. (A) Comparison of power generation predictions between the Transformer model, the Informer model, and actual values over a 180-day forecast period. (B) Comparison of power generation predictions between the Transformer model, the Informer model, and actual values over a 360-day forecast period.
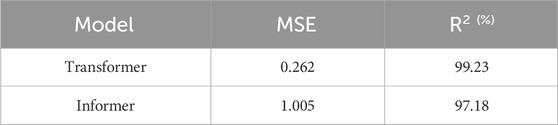
Table 5. Comparison between informer and transformer for 180-day predictions.
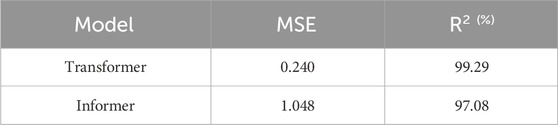
Table 6. Comparison between informer and transformer for 360-day predictions.
5 Conclusion
In this paper, the correlation between various factors and power generation in the photovoltaic power generation process has been analyzed, and a photovoltaic power generation prediction model based on Transformer model is proposed, which has been used to compare with the traditional machine learning model. The following conclusions can be drawn:
(1) In the process of photovoltaic power generation, there is a significant correlation between the global horizontal radiation, diffuse horizontal radiation, humidity and temperature and the power generation, which should be used as the main factors in the prediction of photovoltaic power, while other environmental factors such as rainfall and the correlation of photovoltaic power generation is very low, and can be ignored in the prediction of photovoltaic power.
(2) Under the same training set and test set, the Mean Square Error (MSE) of the short-term prediction results of Transformer model decreases by 70.16%, 69.32% and 62.88% respectively compared with three traditional machine learning models, namely, BP, LSTM and Bi-LSTM. The Mean Square Error (MSE) of the long-term forecast results decreased by 63.58%, 51.02% and 38.3%, respectively.
(3) Transformer model has great advantages in the face of long-term prediction tasks such as photovoltaic power. It is significantly superior to traditional machine learning models and a transformer-like model (Informer) in terms of prediction accuracy and data fitting degree. Traditional machine learning models (such as BP model, etc.) should be considered to adopt the combination of multiple machine learning models to improve the prediction accuracy in photovoltaic power generation prediction.
Data availability statement
Publicly available datasets were analyzed in this study. This data can be found here: https://dkasolarcentre.com.au/download?location=alice-springs.
Author contributions
NZ: Writing–original draft, Writing–review and editing, Formal Analysis, Funding acquisition, Project administration, Resources, Validation. B-wS: Methodology, Writing–original draft, Investigation. J-sZ: Data curation, Writing–original draft. M-mX: Validation, Writing–review and editing.
Funding
The author(s) declare that financial support was received for the research, authorship, and/or publication of this article. This work is supported by the funding of State Grid Henan Electric Power Research Institute of China [52170223000K].
Acknowledgments
The author is grateful for the financial support of State Grid Henan Electric Power Research Institute.
Conflict of interest
The authors declare that the research was conducted in the absence of any commercial or financial relationships that could be construed as a potential conflict of interest.
Publisher’s note
All claims expressed in this article are solely those of the authors and do not necessarily represent those of their affiliated organizations, or those of the publisher, the editors and the reviewers. Any product that may be evaluated in this article, or claim that may be made by its manufacturer, is not guaranteed or endorsed by the publisher.
References
Caineng, Z. O. U., Songqi, P. A. N., and Qun, H. A. O. (2020). On the connotation, challenge and significance of China’s “energy independence” strategy. Pet. Explore. Dev. 47, 449–462. doi:10.1016/S1876-3804(20)60062-3
Das, U. K., Tey, K. S., Seyedmahmoudian, M., Mekhilef, S., Idris, M. Y. I., Van Deventer, W., et al. (2018). Forecasting of photovoltaic power generation and model optimization: a review. Renew. Sustain. Energy Rev. 81, 912–928. doi:10.1016/j.rser.2017.08.017
Dkasolarcentre (2024). Dkasolarcentre. Available at: http://dkasolarcentre.com.au/.
Han, R., Li, J. L., and Guo, Z. (2022). Optimal quota in China’s energy capping policy in 2030 with renewable targets and sectoral heterogeneity. Energy 239, 121971. doi:10.1016/j.energy.2021.121971
Jiang, Y., Zheng, L., and Ding, X. (2021). Ultra-short-term prediction of photovoltaic output based on an LSTM-ARMA combined model driven by EEMD. J. Renew. Sustain. Energy 13, 046103. doi:10.1063/5.0056980
Li, P., Gao, X., Li, Z., and Zhou, X. (2022). Effect of the temperature difference between land and lake on photovoltaic power generation. Renew. Energy 185, 86–95. doi:10.1016/j.renene.2021.12.011
Liu, F., Dong, T., and Liu, Y. (2022). An improved informer model for short-term load forecasting by considering periodic property of load profiles. Front. Energy Res. 10, 1015. doi:10.3389/fenrg.2022.950912
Liu, Y. (2022). Short-term prediction method of solar photovoltaic power generation based on machine learning in smart grid. Math. Problems Eng. 2022 (1), 1–10. doi:10.1155/2022/8478790
Luo, K., Rui, T., and Hu, C. (2021). “Research on prediction of photovoltaic power generation probability interval based on Gaussian mixture model,” in 2021 IEEE 16th Conference on Industrial Electronics and Applications (ICIEA), Chengdu, China, 01-04 August 2021 (IEEE), 396–401.
Nwaigwe, K. N., Mutabilwa, P., and Dintwa, E. (2019). An overview of solar power (PV systems) integration into electricity grids. Mater. Sci. Energy Technol. 2 (3), 629–633. doi:10.1016/j.mset.2019.07.002
Qing, X., and Niu, Y. (2018). Hourly day-ahead solar irradiance prediction using weather forecasts by LSTM. Energy 148, 461–468. doi:10.1016/j.energy.2018.01.177
Sansa, I., Boussaada, Z., and Bellaaj, N. M. (2021). Solar radiation prediction using a novel hybrid model of ARMA and NARX. Energies 14, 6920. doi:10.3390/en14216920
Vaswani, A., Shazeer, N., Parmar, N., et al. (2017). Attention is all you need. Adv. neural Inf. Process. Syst., 30. doi:10.48550/arXiv.1706.03762
Wang, K., Qi, X., and Liu, H. (2019). Photovoltaic power forecasting based LSTM-Convolutional Network. Energy 189, 116225. doi:10.1016/j.energy.2019.116225
Wu, Z., Pan, F., Li, D., He, H., Zhang, T., and Yang, S. (2022). Prediction of photovoltaic power by the informer model based on convolutional neural network. Sustainability 14 (20), 13022. doi:10.3390/su142013022
Yin, L., and Xie, J. (2021). Multi-temporal-spatial-scale temporal convolution network for short-term load forecasting of power systems. Appl. Energy 283, 116328. doi:10.1016/j.apenergy.2020.116328
Keywords: photovoltaic power generation, machine learning, transformer model, correlation analysis, long-term prediction
Citation: Zhou N, Shang B-w, Zhang J-s and Xu M-m (2024) Research on prediction method of photovoltaic power generation based on transformer model. Front. Energy Res. 12:1452173. doi: 10.3389/fenrg.2024.1452173
Received: 20 June 2024; Accepted: 23 July 2024;
Published: 05 August 2024.
Edited by:
Christian A. Rojas, Federico Santa María Technical University, ChileCopyright © 2024 Zhou, Shang, Zhang and Xu. This is an open-access article distributed under the terms of the Creative Commons Attribution License (CC BY). The use, distribution or reproduction in other forums is permitted, provided the original author(s) and the copyright owner(s) are credited and that the original publication in this journal is cited, in accordance with accepted academic practice. No use, distribution or reproduction is permitted which does not comply with these terms.
*Correspondence: Bo-wen Shang, c2hhbmdidzY5QDE2My5jb20=