- National Key Laboratory of Nuclear Reactor Technology, Nuelear Power Institute of China, Chengdu, China
Blister behavior is one of the main failure modes of UMo/Zr monolithic fuel elements during irradiation. The temperature of fuel elements may increase greatly so that the fuel elements may be destroyed. Post-irradiation annealing tests are used to study the blister behaviors of fuel elements under high temperature. In this study, a simulation method is developed based on the finite element method to study the evolution of blister behaviors of UMo/Zr monolithic fuel elements in the blister tests, taken into considering that the evolution of bubble pressure should be coupled with the deformation of cladding. The influence of creep rate of the cladding on the evolution of blister height is analyzed. The study shows that the unrecoverable creep deformation of the cladding, which occurs under high temperature, is the major factor in the increment of bubble height. The increase of bubble height mainly occurs during the heat preservation process and the initial stage of cooling process. The creep rate of cladding is positively related to the evolution of bubble height.
1 Introduction
To prevent nuclear proliferation, the Reduced Enrichment for Research and Test Reactors (RERTR) program proposes the use of low-enrichment uranium fuel in research reactors (Burkes et al., 2016; Burkes et al., 2014; Burkes et al., 2015). In this situation, UMo fuel has emerged as one of the most promising candidate fuels for research reactors due to its high equivalent uranium density and stable irradiation performance (Kim et al., 2013). Compared to dispersion-type UMo fuel, monolithic UMo fuel offers a higher equivalent uranium density, meeting the neutron flux requirements of high-performance research reactors (Ozaltun et al., 2015), and is generally clad with Al or Zr alloys (López et al., 2017).
During irradiation, UMo/Zr monolithic fuel elements experience complex thermo-mechanical coupling behaviors (Yan et al., 2019; Zhao et al., 2015; Kong et al., 2018). The fission of UMo fuel generates fission heat and products, leading to intense thermodynamic interactions between the UMo fuel and Zr alloy cladding under irradiation-induced swelling (Zhao et al., 2015). Under transient conditions such as rapid reactor heating, the fuel core near the cladding interface is prone to cracking, releasing fission gases into the cracks, generating pressure, and forming macroscopic blisters on the cladding surface (Wachs et al., 2012; Beeston et al., 1980; Rice et al., 2010). The formation of blisters can obstruct coolant flow channels, affecting the heat dissipation performance of the fuel assemblies and the safety of the reactor (Hongsheng et al., 2020; Lijun et al., 2012). In severe cases, it can lead to the burnout of the fuel elements. Therefore, blister behavior is a critical consideration in the design of fuel elements.
To investigate the formation and evolution of blisters, annealing tests are currently employed, wherein irradiated fuel elements are heated to observe the formation of blisters on their surface (Rice et al., 2010; Ozaltun et al., 2012; Zhouzhi et al., 2024). Annealing tests help identify the temperature and location of blister formation but do not allow continuous observation of the evolution of blisters. Gao et al. analyzed the mechanism of blister formation in plate-type fuel element (Lijun et al., 2012). Long et al. developed a method to predict the crack behaviors of nuclear materials (Chongsheng et al., 2014; Hongsheng et al., 2020). However, the mechanism of blister formation is still unclear and worthy studying. For monolithic fuel elements, considering the main thermo-mechanical behaviors during annealing tests and the coupling between gas pressure and crack volume, a numerical simulation method for the evolution of blisters is established. This helps identify the contributions of various mechanical behaviors to the growth of blister height and explore the key factors influencing blister evolution.
This study focuses on UMo/Zr monolithic fuel elements with localized cracking, establishing a 2D finite element geometric model with a pre-cracked zone. Considering the coupling relationship between gas pressure, the number of gas atoms, and the volume of the crack zone, a corresponding simulation method is developed, achieving numerical simulation of gas pressure evolution behavior. For the cladding material, the main thermo-mechanical behaviors during the annealing process are considered, combining cladding deformation with the evolution of gas pressure to achieve numerical simulation of the evolution behavior of blisters during annealing tests. The evolution law of blister height with temperature is obtained, and the influence of creep rate on blister behavior is investigated.
2 Material models
2.1 Thermal conductivity model
The thermal conductivity of zirconium alloy from room temperature to its melting point is given by (MacDonald and Thompson, 1976):
where k is the thermal conductivity in W/m·K shown as Equation 1 and T is the temperature in K.
2.2 Thermal expansion coefficient
The thermal expansion coefficient of zirconium alloy is 5.58 × 10⁻⁶/K (MacDonald and Thompson, 1976).
2.3 Elastic constants
The elastic modulus and Poisson’s ratio of zirconium alloy are given by the Fisher model (Fisher and Renken, 1964):
where E is the elastic modulus in Pa shown as Equation 2; T is the temperature in K; and ν is the Poisson’s ratio shown as Equation 3.
Under irradiation conditions, the elastic modulus of zirconium alloy increases. The elastic modulus under irradiation can be expressed as (Hagrman and Reymann, 1979):
in Equations 4, 5
2.4 Plasticity model
The stress-strain curve for non-irradiated zirconium alloy is given by (Hagrman and Reymann, 1979):
in Equation 6
To account for the irradiation effects of fast neutrons, the strength coefficient K is modified by a correction factor k2 shown as Equation 7:
Similarly, the strain hardening exponent n is adjusted by a dimensionless correction factor
where
2.5 Creep model
During the annealing process, the high-temperature creep behavior of zirconium alloy is modeled by (Suzuki and Saitou, 2006):
where
3 Numerical simulation methods
3.1 Finite element geometric model
Results from annealing tests indicate that the core section near the interface is most prone to cracking, forming crack cavities. The fission gas products generated during irradiation are released into these crack cavities, generating pressure that causes the cladding above the crack cavities to deform, forming macroscopic blisters on the surface of the fuel elements, as shown in Figure 1. The size of these blisters ranges from approximately 3–5 mm (Meyer et al., 2012).

Figure 1. Blister formed on the surface of fuel plates (Meyer et al., 2012).
To simulate the blistering behavior of fuel elements during annealing tests, a finite element geometric model, as shown in Figure 2, was established. This model is axisymmetric, with the axis of symmetry indicated by the red line in the figure. The cladding part of the finite element geometric model has a thickness of 0.35 mm (Yan et al., 2018), a crack cavity radius of 2.5 mm, and an initial height of 0.005 mm. The finite element model is discretized into 4,820 elements using the axisymmetric element CAX4T in ABAQUS. The outer surface of the cladding is subjected to atmospheric pressure, applying a pressure load of 0.1 MPa. The thickness of the fuel meat is 0.20 mm, the fission density of fuel meat is
3.2 Temperature variation during the annealing process
The annealing test consists of 24-h cycles. Each cycle starts from room temperature, heats up to the target temperature, holds for 1 hour at the target temperature (Miller et al., 2012), and then returns to room temperature. The target temperature for the first annealing cycle is 400°C. Each subsequent cycle increases the target temperature by 10°C, up to a maximum of 600°C.
The temperature variation during the annealing tests is illustrated in Figure 3. It is important to note that Figure 3 only shows the temperature changes for the first three annealing cycles, while the actual numerical simulation considers a total of 21 annealing cycles.
3.3 Simulation method for blistering behavior
Due to the relatively large volume of the crack cavities formed by cracking, the gas pressure within these cavities is relatively low. The behavior of the gas within the crack cavities can be described using the ideal gas law:
where P is the gas pressure in Pa; V is the volume of the crack cavity in m³; N is the number of gas atoms;
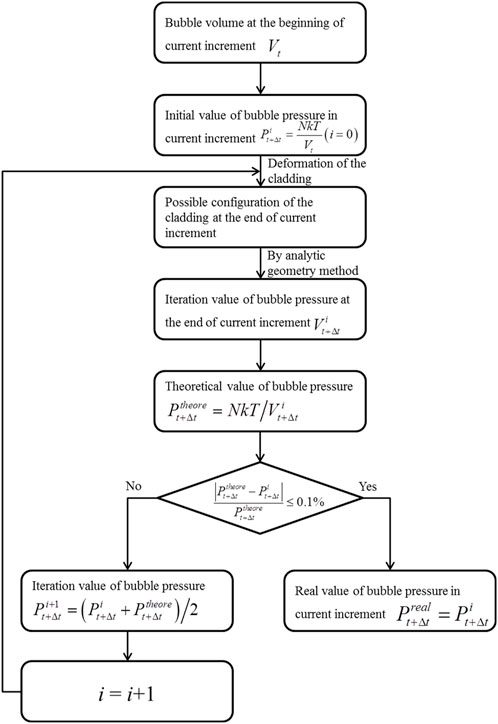
During the bubble evolution process of fuel elements, the cladding continuously deforms under the pressure within the crack cavity, causing changes in the volume of the crack cavity. According to the ideal gas law, shown as Equation 10, the volume change of the cavity affects the pressure, indicating a coupled relationship between the two. To study the bubble evolution behavior of the fuel element, an iterative calculation method was employed, as shown in Figure 4. For a typical increment step
3.4 Stress update algorithm
To simulate the bubble evolution process of the cladding material during the annealing test, the primary thermo-mechanical behavior of the cladding material must be considered. This involves establishing a three-dimensional large deformation incremental constitutive relation in a rotating coordinate system, deriving the stress update algorithm, and consistent stiffness matrix, and writing a UMAT subroutine for implementation on the commercial finite element platform ABAQUS.
During the annealing test, the contributions of elastic strain, thermal expansion strain, plastic strain, and creep strain of the cladding material are primarily considered:
where
4 Results and discussion
4.1 Study on the mechanism of bubble height evolution
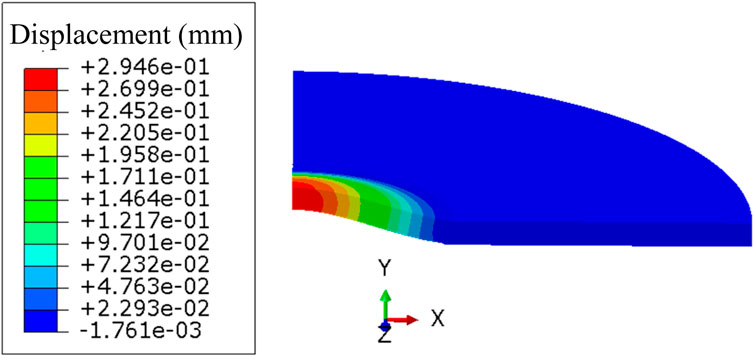
Figure 5 shows the displacement contour plot of the cladding at the end of the annealing cycle at a target temperature of 500°C. It can be observed that, at this temperature, the bubble height on the cladding reaches approximately 0.294 mm, forming a notable bubble. As the annealing test progresses, the bubble height on the cladding will continue to increase, which can significantly obstruct coolant flow if severe.
The annealing test consists of multiple annealing cycles. To investigate the mechanism of bubble height evolution within a single annealing cycle, a cycle with a target temperature of 500°C was selected. It is the eleventh cycle during the annealing process, which starts at 264 h and ends at 288 h. The bubble height variation process is shown in Figure 6A. The bubble height could be calculated by the displacement of the cladding, as shown in Figure 6B. At the beginning of this annealing cycle, the bubble height is approximately 0.257 mm. During the heating and holding processes, the bubble height gradually increases with the progression of the annealing test. In the early stage of the cooling process, the bubble height continues to increase due to the high temperature of the fuel plate. About 2 hours after the cooling process starts, the bubble height reaches a maximum of approximately 0.287 mm and then slowly decreases to around 0.281 mm. Compared to the initial stage, the bubble height in this annealing cycle increases by about 0.024 mm.
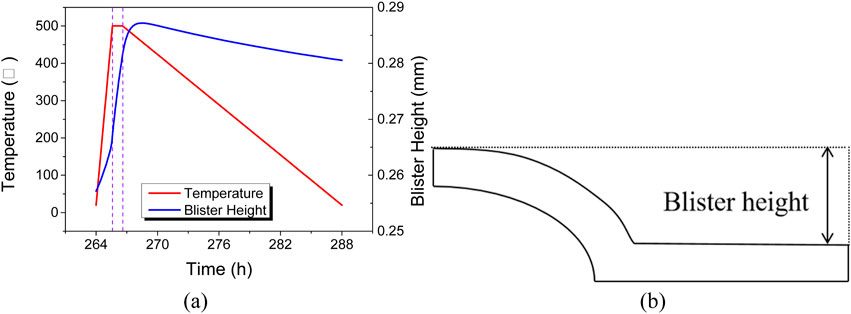
Figure 6. (A) Evolution of Temperature and Bubble Height during the Annealing Cycle at 500°C; (B) The sketch of blister height.
The variation of bubble height during the annealing cycle is influenced not only by temperature but also by the coupled gas pressure inside the bubble. Figure 7A shows the gas pressure variation during the 500°C annealing cycle. During the heating process, the temperature rise rate is high, and according to Equation 1, the gas pressure inside the bubble increases rapidly, causing continuous deformation of the cladding under the gas pressure, manifested macroscopically as a continuous increase in bubble height. During the holding and initial cooling processes, as the temperature stops rising and starts to decrease slowly, the gas pressure decreases accordingly. However, the gas pressure still remains around 6–7 MPa, higher than the external environmental pressure, leading to continued creep deformation of the cladding under pressure, which macroscopically appears as a continuous increase in bubble height. According to Equation 1, the increase in bubble volume will result in a decrease in gas pressure. After about 2 hours of cooling, the gas pressure drops to a level insufficient to drive further outward deformation of the cladding, leading to a reduction in bubble height and gas pressure as the temperature decreases. Figure 7B shows the evolution of gas cavity volume. During the 500°C annealing cycle, the evolution pattern of the gas cavity volume is similar to that of the bubble height, indicating that the bubble height variation reflects the changes in gas cavity volume.
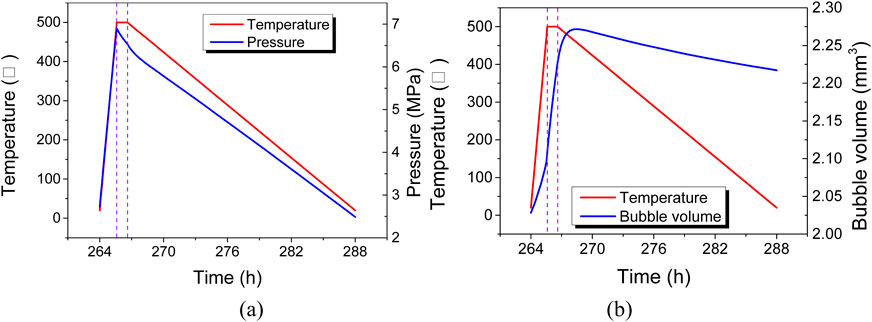
Figure 7. Evolution of (A) bubble pressure and (B) bubble volume during the annealing cycle at 500°C.
Within the temperature range of the annealing test, the elastic and thermal expansion strains of the cladding material are relatively small and insufficient to cause significant bubbling in the fuel element. Therefore, the distribution and evolution of equivalent creep strain and equivalent plastic strain in the cladding during the annealing test are the focus. Figure 8 shows the contour plots of equivalent creep strain and equivalent plastic strain at the end of the 500°C annealing cycle. Significant creep strain and plastic strain occur in the cladding, with maximum values located at the base of the bubble.
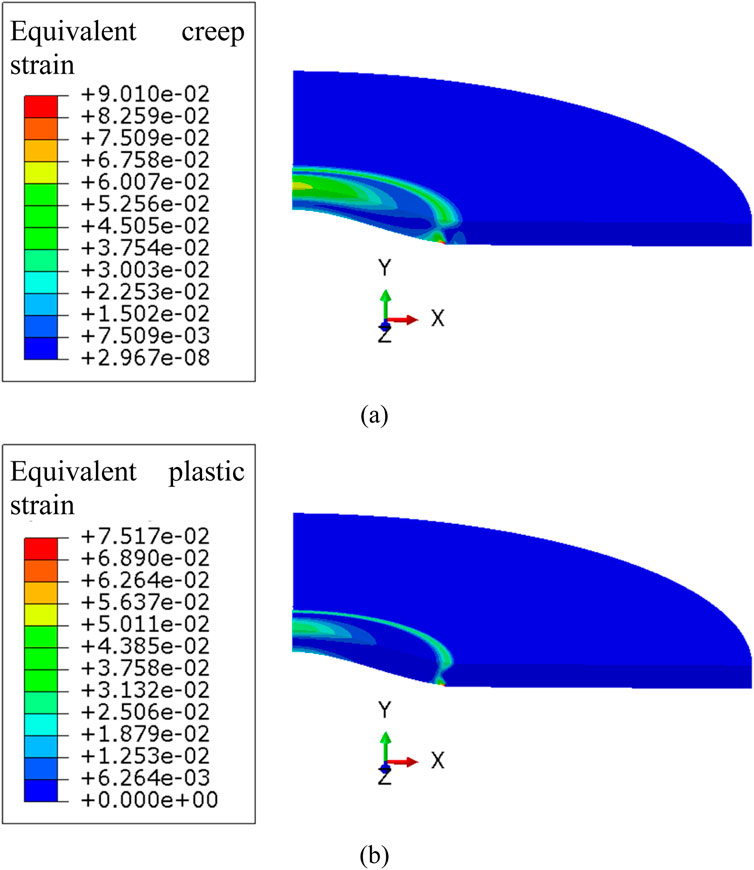
Figure 8. Contour plot of (A) Equivalent creep strain and (B) Equivalent plastic strain at the end of the annealing cycle at 500°C.
Figure 9 illustrates the variation of maximum equivalent creep strain and equivalent plastic strain in the cladding during the 500°C annealing cycle. During the heating process, the accumulated creep strain remains largely unchanged, with bubble height variations mainly caused by elastic deformation and thermal expansion due to temperature increase. During the holding process, equivalent creep strain in the cladding rises rapidly, while during the cooling process, equivalent creep strain initially increases and then stabilizes. Comparing Figures 6, 9, the period of increased equivalent creep strain aligns with the period of increased bubble height, indicating that the bubble height increase primarily results from creep strain during the holding and initial cooling stages, with a minor contribution from elastic strain and thermal expansion. According to Equation 7, the cladding material exhibits high creep rates at elevated temperatures. Prolonging the holding period would result in continuous creep strain increase in the cladding, further increasing bubble height until cladding rupture or gas pressure reduction halts further deformation.
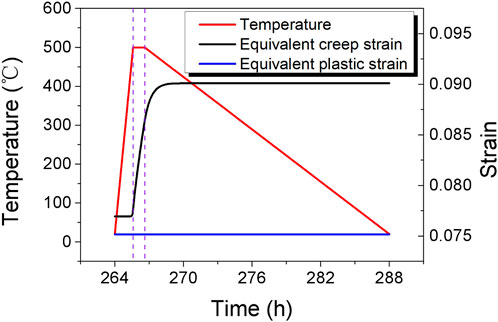
Figure 9. Evolution of equivalent creep strain and equivalent plastic strain of cladding during the annealing cycle at 500°C.
After more than 2 hours of cooling, the cladding creep rate approaches zero due to lower temperatures, as per Equation 7, resulting in stable creep strain. During this period, thermal expansion strain decreases with temperature, leading to a reduction in bubble height due to combined thermal expansion and elastic strain effects. However, since creep strain remains unchanged, the bubble height at the end of the annealing cycle remains higher than at the initial stage.
Figure 9 also shows that equivalent plastic strain in the cladding remains unchanged throughout the annealing cycle. This indicates that creep strain predominates over plastic strain in the bubble evolution process, with plastic deformation mainly occurring in the initial stage of bubble evolution. The next section will examine the evolution patterns of creep and plastic strains in the cladding throughout the entire annealing test.
4.2 Effect of creep rate on bubble evolution
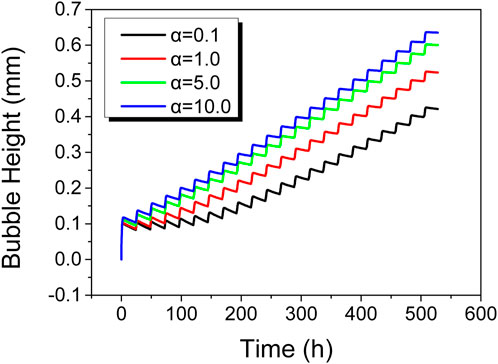
The previous analysis indicates that bubble growth is mainly influenced by creep, and the creep behavior of the cladding material significantly impacts its growth. To further investigate the effect of creep rate on bubble growth, the original cladding creep model, shown as Equation 7, was modified to examine bubble evolution under different creep magnification factors: 0.1, 1.0, 5.0, and 10.0.
Figure 10 shows the variation in bubble height of the fuel element under different creep rates. As seen in Figure 10, higher creep rates result in faster bubble height growth during the heating process. Ultimately, models with higher creep rates exhibit greater final bubble heights after undergoing the same bubble test temperature profile.
Figure 11A shows the variation in maximum equivalent creep strain of the cladding over time for different creep rates. As shown in Figure 11A, the trend of creep strain variation is similar to that of bubble height, with higher creep rates corresponding to greater creep strain. However, the differences in creep strain do not scale linearly with creep rate. This is because higher creep rates lead to greater bubble heights, which in turn reduce gas pressure inside the bubble. Consequently, although bubbles with higher creep rates reach greater heights, their internal pressures are lower, leading to non-linear relationships between creep rate and the resulting creep strain and bubble height.
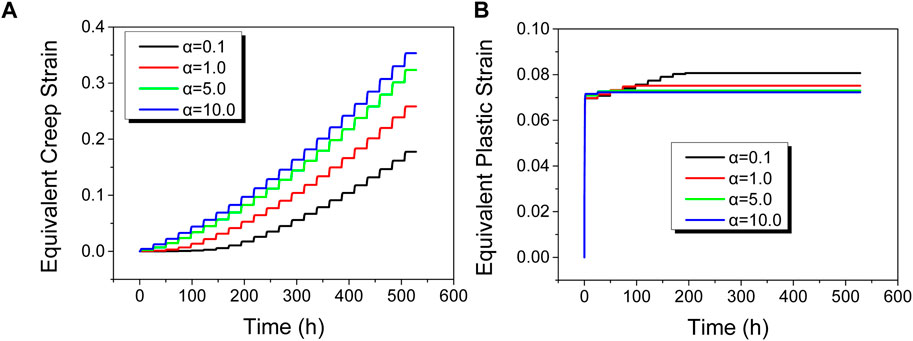
Figure 11. Effects of creep rate on the evolution of (A) maximum equivalent creep strain and (B) maximum equivalent plastic strain of cladding.
Figure 11B illustrates the evolution of maximum equivalent plastic strain of the cladding under different creep rates. At the initial stage of the annealing test, significant equivalent plastic strain is observed in the cladding. This is due to the low temperature and low creep rate at the beginning of the annealing test, making significant creep deformation difficult. During this stage, bubble height growth mainly results from plastic deformation of the cladding. After a certain period of the annealing test, equivalent plastic strain in the cladding stabilizes, while equivalent creep strain continues to increase. After more than 400 h of the annealing test, equivalent creep strain in the cladding significantly exceeds equivalent plastic strain, indicating that creep deformation primarily contributes to bubble height growth.
5 Conclusion
This study establishes a simulation method for bubble evolution in the annealing test of UMo/Zr monolithic fuel elements that exhibit local cracking, considering the primary thermo-mechanical behavior of the cladding material, and the evolution of crack cavity pressure and volume. The following key conclusions are drawn regarding the influence of cladding creep rate on bubble height:
(1) Cladding plastic deformation mainly affects the initial slight bubbling, while the subsequent increase in bubble height is primarily due to creep, with plastic deformation having a relatively limited impact.
(2) The duration of the holding period significantly affects bubble height. Longer high-temperature stages result in greater bubble height increments. In a specific annealing cycle, the accumulation of bubble height mainly arises from the holding period, with a minor contribution from the initial stage of the cooling period.
(3) Reducing the creep rate of the cladding material helps to suppress the growth of bubble height, but the effect is relatively small. Improving the creep properties of the material to slow down the growth of bubbles during the process has a relatively limited impact.
(4) The evolution of bubble height is driven by bubble pressure. It is supposed that the coolant pressure has an negative effect on bubble height, which should be considered in engineering practices.
Data availability statement
The original contributions presented in the study are included in the article/supplementary material, further inquiries can be directed to the corresponding author.
Author contributions
TC: Funding acquisition, Software, Supervision, Writing–original draft, Writing–review and editing. YF: Investigation, Software, Writing–review and editing. JY: Project administration, Supervision, Writing–review and editing. XY: Supervision, Writing–review and editing. PZ: Formal Analysis, Supervision, Writing–review and editing. XZ: Conceptualization, Project administration, Supervision, Writing–review and editing.
Funding
The author(s) declare that financial support was received for the research, authorship, and/or publication of this article. The authors thank for the supports of Natural Science Foundation of Sichuan Province (2023NSFSC1316) and Young Talents Program of CNNC.
Conflict of interest
The authors declare that the research was conducted in the absence of any commercial or financial relationships that could be construed as a potential conflict of interest.
Publisher’s note
All claims expressed in this article are solely those of the authors and do not necessarily represent those of their affiliated organizations, or those of the publisher, the editors and the reviewers. Any product that may be evaluated in this article, or claim that may be made by its manufacturer, is not guaranteed or endorsed by the publisher.
References
Beeston, J. M., Hobbins, R. R., Gibson, G. W., and Francis, W. C. (1980). Development and irradiation performance of uranium aluminide fuels in test reactors. Nucl. Technol. 49 (1), 136–149. doi:10.13182/nt80-a32515
Burkes, D. E., Casella, A. J., and Casella, A. M. (2016). Measurement of fission gas release from irradiated U Mo dispersion fuel samples. J. Nucl. Mater 478, 365–374. doi:10.1016/j.jnucmat.2016.05.039
Burkes, D. E., Casella, A. M., Buck, E. C., Casella, A. J., Edwards, M. K., MacFarlan, P. J., et al. (2014). Development and validation of capabilities to measure thermal properties of layered monolithic U-Mo alloy plate-type fuel. Int. J. Thermophys. 35 (8), 1476–1500. doi:10.1007/s10765-014-1683-4
Burkes, D. E., Casella, A. M., and Huber, T. K. (2015). Modeling the influence of interaction layer formation on thermal conductivity of U-Mo dispersion fuel. J. Alloy Compd. 618, 7–13. doi:10.1016/j.jallcom.2014.08.123
Chongsheng, L., Yi, Z., Wen, G., Hongxing, X., and Tianguo, W. (2014). A model for cracking of ceramic fuel particles in dispersion fuel. Nucl. Power Eng. 35 (1).
Fisher, E. S., and Renken, C. J. (1964). Single-crystal elastic moduli and the hcp → bcc transformation in Ti, Zr, and Hf. Phys. Rev. 135 (2A), 482–494. doi:10.1103/physrev.135.a482
Hagrman, D. L., and Reymann, G. A. C. (1979). MATPRO-Version 11: a handbook of materials properties for use in the analysis of light water reactor fuel rod behavior. United States.
Hongsheng, C., Chongsheng, L., and Hongjun, X. (2020a). Crack characteristic model of metal matrix induced by dispersion fuel. Atomic Energy Sci. Technol. 54 (02), 334–339.
Kim, Y. S., Hofman, G. L., Cheon, J. S., Robinson, A. B., and Wachs, D. M. (2013). Fission induced swelling and creep of U-Mo alloy fuel. J. Nucl. Mater 437 (1-3), 37–46. doi:10.1016/j.jnucmat.2013.01.346
Kong, X., Ding, S., and Tian, X. (2018). Research on in-pile thermal-mechanical behavior of UMo/Zr monolithic fuel plates. Nucl. Power Eng. 39 (02), 109–113. doi:10.1515/eng-2018-0029
Lijun, G., Bingde, C., Shengyao, J., Zhong, X., Jiyang, Y., Lin, Z., et al. (2012). Analysis of blistering mechanism for dispersion-type fuel plates during irradiation. Atomic Energy Sci. Technol. 46, 819–825.
López, M., Picchetti, B., and Taboada, H. (2017). Influence of temperature and compressive stress on the UMo/Zry-4 interdiffusion layer. Prog. Nucl. Energ 94, 101–105. doi:10.1016/j.pnucene.2016.10.006
MacDonald, P. E., and Thompson, L. B. (1976). Matpro - a handbook of materials properties for use in the analysis of light water reactor. Fuel Rod. Behav.
Meyer, M. K., Moore, G. A., Jue, J. F., and Keiser, D. D. (2012). Investigation of the cause of low blister threshold temperatures in the RERTR-12 and AFIP-4 experiments. Report. ID, USA: Idaho National Laboratory.
Miller, S. J., and Ozaltun, H. (2012). “Evaluation of U10Mo fuel plate irradiation behavior via numerical and experimental benchmarking,” in Imece 2012. Editors S. J. Miller, and H. Ozaltun (Houston, Texas: ASME).
Ozaltun, H., Medvedev, P. G., and Rabin, B. H. (2015). Effects of the foil flatness on irradiation performance of U10Mo monolithic mini-plates. J. Nucl. Eng. and Radiat. Sci. 1. doi:10.1115/1.4030982
Ozaltun, H., and Miller, S. J. (2012). “Evaluation of blister behavior for U10Mo mini fuel plates with cold rolled foils,” in International mechanical engineering congress and exposition. Editors H. Ozaltun, and S. J. Miller (Houston, Texas, USA).
Rice, F. J., Wachs, D. M., Robinson, A. B., Keiser, D. D., and Jue, J. F. (2010). U-Mo plate blister anneal interim report. Report. Lisboa, Portugal: Idaho National Laboratory.
Suzuki, M., and Saitou, H. (2006). Light water reactor fuel analysis code FEMAXI-6 (Ver.1); Detailed structure and user's manual. Report.
Wachs, D., Rice, F., Glagalenko, I., Robinson, A., Rabin, B., and Meyer, M. (2012). “Blister threshold based thermal limits for the U-Mo monolithic fuel system,” in International meeting on reduced enrichment for research and test reactors. Editors D. Wachs, F. Rice, I. Glagalenko, A. Robinson, B. Rabin, and M. Meyer (Warsaw, Poland).
Yan, F., Ding, S., Yuanming, L., Zhou, Y., Tang, C., and Yong, X. (2018). Numerical simulation of blistering behavior in UMo/Zr monolithic fuel plate. Atomic Energy Sci. Technol. 52, 1063–1069. 06.
Yan, F., Kong, X., Ding, S., He, D., Li, Y., Chen, P., et al. (2019). Effects of porous fuel structure on the irradiation-induced thermo-mechanical coupling behavior in monolithic fuel plates. Sci. Sinica Phys. Mech. and Astronomica 49 (11), 114606. doi:10.1360/SSPMA2018-00297
Zhao, Y., Gong, X., and Ding, S. (2015). Simulation of the irradiation-induced thermo-mechanical behaviors evolution in monolithic U-Mo/Zr fuel plates under a heterogeneous irradiation condition. Nucl. Eng. Des. 285, 84–97. doi:10.1016/j.nucengdes.2014.12.030
Zhao, Y., Gong, X., Ding, S., and Huo, Y. (2014). A numerical method for simulating the non-homogeneous irradiation effects in full-sized dispersion nuclear fuel plates. Int. J. Mech. Sci. 81, 174–183. doi:10.1016/j.ijmecsci.2014.02.012
Keywords: UMo/Zr monolithic fuel element, annealing test, creep rate, blister height, finite element method
Citation: Changbing T, Feng Y, Yongjun J, Yong X, Zengping P and Zhong X (2024) Simulation research on the blister evolution behaviors of UMo/Zr monolithic fuel elements. Front. Energy Res. 12:1450488. doi: 10.3389/fenrg.2024.1450488
Received: 17 June 2024; Accepted: 25 November 2024;
Published: 18 December 2024.
Edited by:
Jiankai Yu, Massachusetts Institute of Technology, United StatesReviewed by:
Wei Li, Xi’an Jiaotong University, ChinaYunmei Zhao, Tongji University, China
Kai Chen, Shanghai Jiao Tong University, China
Copyright © 2024 Changbing, Feng, Yongjun, Yong, Zengping and Zhong. This is an open-access article distributed under the terms of the Creative Commons Attribution License (CC BY). The use, distribution or reproduction in other forums is permitted, provided the original author(s) and the copyright owner(s) are credited and that the original publication in this journal is cited, in accordance with accepted academic practice. No use, distribution or reproduction is permitted which does not comply with these terms.
*Correspondence: Xiao Zhong, cWl1bWkzMzJAMTI2LmNvbQ==
 Tang Changbing
 Yan Feng
 Jiao Yongjun
 Xin Yong

