 Li Chunzhe1
 Liu Jiarong
 Ge Zeqi
- 1State Grid Baicheng Power Supply Company, Baicheng, China
- 2Power Science Research Institute of State Grid Jilin Electric Power Co, Ltd, Jilin, China
- 3School of Economics and Management, Northeast Electric Power University, Jilin, China
This study evaluates the impact of China’s carbon finance development on carbon emission reduction and its role in promoting low-carbon economic growth. We construct an evaluation index system and employ Systematic Cluster Analysis (SCA) and Data Envelopment Analysis (DEA) methods to analyze the carbon finance markets in five representative Chinese provinces (autonomous regions). Utilizing the DEA-BCC model and DEA-Malmquist index, we conducted an in-depth analysis of the carbon emission reduction effects between 2022 and 2023. Our findings reveal that while China’s carbon finance development significantly contributes to carbon emission reduction, there are considerable regional disparities in effectiveness. Beijing and Guangdong achieved DEA efficiency, whereas Jilin, Ningxia, and Xinjiang experienced efficiency losses, suggesting a need for structural optimization. The study provides insights into challenges and potential improvements in China’s carbon finance sector and offers policy recommendations for enhancing market mechanisms, technological innovation, and social engagement to support China’s carbon peak and neutrality goals.
1 Introduction
In light of the serious challenge of global warming, the Chinese government has put forward the strategic goal of “carbon peak and carbon neutral,” which not only marks a significant change in the allocation of financial resources but also promotes the rapid development of green finance. Carbon finance, as an important part of green finance, promotes the regulation of the energy market and industry-wide energy saving and emission reduction through the power of the capital market and plays an important role in realizing the effective control of greenhouse gas emissions. Over the next 30 years, we expect China’s investment demand in the green and low-carbon sector to reach RMB 487 trillion, underscoring the crucial role of carbon finance in fostering the development of a low-carbon economy. The Chinese government has introduced a series of policies to support the construction of a carbon finance market, including the establishment of a carbon emissions trading market and the promotion of financial products such as green bonds and green credits, which have provided financial support for the low-carbon transition of high-carbon industries and accelerated the development of China’s low-carbon economy. However, evaluating the actual impact of carbon finance in promoting energy transition, energy saving, and carbon reduction, as well as its contribution to sustainable development, is a significant topic currently under discussion. The purpose of this paper is to assess the carbon emission reduction effect of China’s carbon finance development and to investigate its role in promoting a low-carbon economy. To study, this paper uses systematic cluster analysis (SCA) and data envelopment analysis (DEA) to build an evaluation index system and looks at the carbon financial markets of five Chinese provinces that are meant to be representative. We utilize the DEA-BCC model and DEA-Malmquist index method to examine the impact of carbon emission reduction in 2022–2023, aiming to establish a scientific foundation for policy development. We also suggest recommendations to foster the robust growth of China’s carbon financial market and contribute to the achievement of the national “dual carbon” objective. We aim to contribute to the achievement of the national “double carbon” goal.
2 Literature review
In the current global context of low-carbon development, many scholars are committed to exploring the effectiveness of carbon emission reduction. They have not only analyzed the key influencing factors of different industries and social sectors in the process of carbon emission reduction at the macro level, but also studied in depth the intrinsic link between carbon finance and carbon emissions from the financial perspective (Guo et al., 2024). proposed the generalized Luenberger productivity index (GLPI) to analyze the GTFP in Chinese cities by using distance elasticity shares as the input weights of the production function and used stochastic frontier analysis (SFA) to perform a parametric decomposition to obtain the technological change (TC), technological efficiency change (TEC), and scale efficiency change (SEC). The results indicate that it is feasible to measure and decompose GLPI using the parametric method, and the saving ratio of all kinds of inputs reaches 3.43%, which makes the sustainable development of Chinese cities effective (Zheng et al., 2023). investigated the potentials and trade-offs of using global abandoned cropland for recultivation and forest restoration through natural regeneration using spatially explicit modeling and scenario analysis. The findings suggest that applying spatial prioritization is key to maximizing the achievable potential of abandoned farmland (Guo et al., 2023). analyzed the spatio-temporal convergence characteristics of APE in the Yangtze River Economic Belt from 2000 to 2020 using meta-semiparametric linear programming and a spatial convergence model. The results show that: (1) using meta-frontier analysis, the APE goes up while keeping the stable olive-shaped structure of “sharp at both ends and wide in the middle”; (2) the agricultural production area and the middle reaches of the region are much less efficient than the non-agricultural production area; and (3) both non-spatial and spatial factors work together to make the convergence happen (Feng et al., 2024a). pointed out that digitalization, as an important engine to promote sustainable development, has opened up new prospects for enterprises’ green transformation (Lu et al., 2024). indicate that digital transformation has become a key way to achieve high-quality development in the context of the current technological revolution and economic framework transformation (Feng et al., 2024b). used the data of 282 cities in China from 2010 to 2020 and adopted the dual machine learning model and the chain mediation effect model to explore the impact of regional integration of the Yangtze River Economic Belt on inclusive green growth and its internal mechanism. The findings suggest that the regional integration of the Yangtze River Economic Belt has a substantial impact on inclusive green growth, providing valuable insights for optimizing and upgrading inclusive green growth strategies in China and other emerging economies. In this paper (Ling et al., 2024), show that in order to deal with environmental problems such as pollution emission and climate change, sustainable development in the field of transportation has gradually become a hot spot of attention from all sectors of society, and promoting the green and low-carbon transformation of China’s transportation is also an important topic in the new era (Shen et al., 2023a). pointed out that informal environmental regulation represented by public participation plays an increasingly important role in the field of environmental management in the context of global carbon peak and carbon neutrality goals. These studies aim to identify and verify the multi-dimensional factors that affect the effectiveness of carbon emission reduction, and on this basis, focus on the financial perspective to explore the relationship between carbon finance and carbon emissions (Yang and Peng, 2024). evaluated the impact of experimental zone policy on carbon emission intensity using time-varying difference-in-difference (DID) model based on data from 265 Chinese cities from 2005–2021.The study concludes that the experimental zone policy significantly reduces the carbon emission intensity, and the effect is more prominent in the cities with larger scale of credit and bond financing. In regions with greater financial pressure, the government should rely more on green finance to reduce carbon emission intensity (Zhou et al., 2023). analyzed the impact of China’s green finance pilot policy (GFPP) on total factor energy efficiency (TFEE) based on data from 280 prefecture-level cities in China from 2008–2019 using difference-in-differences (DID) modeling, and further investigated the mediating and heterogeneous effects of GFPP were further investigated. The results show that China must expand the scope of GFPP, further improve local green finance practice, actively guide green funds to support energy technology innovation, accelerate the transformation of green industries, and gather social forces to jointly promote the green development of the economy. According to research by (Liao and Zhou, 2023), money can be a significant factor in encouraging green agricultural innovation and lowering carbon emissions from agriculture. The study focused on the function and influence of finance on carbon emission reduction in industrial and urban areas (Feng et al., 2023). Based on the annual panel data of 77 countries and regions from 2007 to 2019, this paper studies the impact and mechanism of low-carbon energy transition on energy intensity by using a multimetric model. It is proved that external factors such as government effectiveness and environmental policy rigor as threshold variables, low-carbon energy transition can reduce energy intensity by promoting green innovation and improving the use of sustainable energy.According to (Lei et al., 2023) study on the relationship between finance and carbon emissions as well as its internal mechanisms, digital finance should be leveraged to further the environmentally friendly development of financial services. The study also found that the depth and breadth of finance’s application play a significant role in reducing the intensity of regional carbon emissions. Using the FE model, GMM model, DID model, and mediation effect model (Ran and Zhang, 2023), investigated the relationship between green finance and carbon emissions as well as its mechanism. They discovered that the influence of green finance on reducing carbon emissions is more pronounced in developed and western regions. Based on the panel data of 285 prefecture-level cities in China from 2008 to 2019, the spatial econometric model constructed by (Shen et al., 2023b) shows that environmental regulations significantly reduce local sulfur dioxide emissions, while producing positive spatial spillover effects on surrounding areas. It reflects the “beggar-thy-neighbor” dilemma of China’s environmental governance. This study confirms the positive equivalence effect of environmental regulation, supports the combination of “top-down” and “bottom-up” ecological governance methods, and provides new research ideas for the research direction of this paper (Liu et al., 2023). establish an environmental governance system that considers synergistic reductions in pollution and carbon emissions, and find that the synergistic effect of financial development on pollution and carbon abatement depends on regional development endowments, such as green technology innovation capacity, lower accessibility to traditional finance, and carbon sink reserves. Utilizing panel data from 186 countries spanning the years 2003–2020 (Feng et al., 2024a), conducted an empirical assessment of the overall impact of digital government on carbon intensity (CI) and delved into its underlying mechanisms. Their findings suggest that enhancing governance efficiency, reducing corruption, and increasing public environmental engagement could effectively address the carbon dilemma (Zhang et al., 2023). explored the impacts of market-driven green finance and government-guided green finance on the carbon emission intensity of manufacturing enterprises based on system theory and Pareto efficiency theory, and found that market-driven green finance, government-guided green finance and the carbon emission intensity of manufacturing enterprises showed a negative U-shaped relationship. It is found that market-driven green finance, government-guided green finance and carbon emission intensity of manufacturing enterprises have a negative “U-shaped” relationship, which provides inspiration for the government to formulate relevant low-carbon development policies. In their study (Niu et al., 2024), utilized data from 284 cities in China spanning the years 2004–2019 and employed a series of econometric models to examine the impact of industrial structure optimization on urban eco-efficiency growth. The findings indicated that upgrading industrial structure could significantly enhance urban eco-efficiency, while low-quality GDP and financial development models were found to impede urban eco-efficiency. Furthermore, it was observed that rationalizing industrial structure did not lead to a significant reduction in urban ecological efficiency. In 2024 (Wang et al., 2024), employed a geographically and time-weighted regression model to examine the influence of finance on the carbon emissions and carbon emission intensity of manufacturing enterprises. Additionally, they examined the impact of green finance on these same parameters. the impact of financial resources on the spatial and temporal variability of carbon emissions and the intensity of those emissions. The study’s findings demonstrate that the financial sector may dramatically lower carbon emissions and carbon emission intensity (Shen et al., 2024). utilized panel data from 30 provinces in China spanning the years 2004–2017 and employed empirical methodologies including dynamic panel model, diff-gmm model, intermediary effect model, and regulatory effect model to investigate the direction and mechanism of inclusive finance’s impact on various aspects of CO2 emissions in China. The findings indicate that the advancement of inclusive finance significantly influences CO2 emissions.
The assessment of the impact of carbon financial development on reducing carbon emissions is the subject of a variety of existing literature, and the majority of research findings now under consideration concentrate primarily on the assessment methodology of this impact. Based on China’s green finance pilot program (Feng and Sun, 2023), employed a comprehensive control method to evaluate the impact of the green finance pilot policy on carbon intensity reduction. The findings indicate that the green finance policy can promote carbon intensity reduction through financial agglomeration and green innovation, evaluate the efficacy of China’s green finance program, and offer empirical support for the development of China’s green financial system. In order to create a green finance assessment index system (Lin et al., 2023), employed the entropy weight approach. They then conducted an empirical study using the Dynamic Spatial Durbin Model (DSDM) to investigate the impact mechanism of how green financing influences carbon dioxide emissions. Based on the PLSR model (Xu and Liu, 2023), analyzed the impact of carbon finance on the green transformation of China’s marine industry through a discussion of examples. They did this by using the AHP entropy method to construct a comprehensive evaluation index system for the green transformation of China’s marine industry from the five levels of economic growth, energy saving and emission reduction, marine ecology, structural adjustment, and scientific and technological innovation. In order to determine the impact of green credit efficiency and scale on carbon emissions (Cao et al., 2023), used the LMDI decomposition model. They also used system dynamics to predict the trend of carbon emissions in various industries, examined the decoupling effect of green credit and carbon emissions in various scenarios, and ultimately came to the conclusion that increasing the scale of green credit can effectively. By integrating the environmental impact indicators with the sustainable development goals (Gibon et al., 2020), suggested a green bond role in an environmental impact assessment system based on the life cycle, which revealed the effect of green bonds on corporate water consumption and carbon emissions. The impact of green bonds on corporate water use and carbon emissions was examined by (Wang et al., 2023) using difference-in-difference analysis. Based on China’s panel data from 2006 to 2020, the study examined the effect of the energy consumption permit trading scheme policy on carbon emission performance. The findings indicated that the scheme can effectively improve carbon emission performance by altering the pattern of energy consumption and promoting the potential for technological innovation.
Although there are abundant researches on how to promote carbon emission reduction through carbon finance at home and abroad, there are still some key areas that need to be improved. First of all, most existing studies focus on analyzing the direct relationship between carbon finance and carbon emissions, but pay little attention to the mutual influence between carbon emission reduction effect and carbon finance development, resulting in the lack of a comprehensive evaluation system to measure the carbon emission reduction effect of carbon finance development. Secondly, although many studies have adopted entropy weight method and difference analysis method to evaluate the carbon emission reduction effect of carbon finance, the accuracy of these methods still needs to be improved. In view of these deficiencies, this paper proposes a set of innovative methodology. Through systematic cluster analysis, this paper screens and constructs a set of targeted carbon finance development carbon emission reduction effect evaluation index system. In addition, this paper selected Guangdong Province, Beijing City, Jilin Province, Ningxia Hui Autonomous Region and Xinjiang Uygur Autonomous Region as cases, and used DEA-BCC model and DEA-Malmquist index method to conduct in-depth evaluation and analysis on the development of carbon finance and carbon emission reduction effects in these regions. This study not only provides a supplement to the existing literature, but also provides a scientific basis and reference for the government to formulate emission reduction policies. Through these innovative work, this paper aims to provide a more rigorous and professional perspective for understanding and optimizing the role of carbon finance in promoting carbon emission reduction, and attempts to carry out the following work and innovation.
(1) Examine the interplay between the development of carbon finance and the reduction of carbon emissions; surmount the research constraints associated with the current findings of carbon financial development as a singular stimulus to the process of carbon emission reduction; and encourage the long-term coexistence of carbon finance and the development of carbon emission reduction.
(2) To create a set of targeted carbon emission reduction effect evaluation indexes for carbon financial development, the carbon emission reduction effect of financial development will be assessed. Datatable carbon emission reduction effect evaluation indexes will be chosen, and the indexes will be screened using systematic cluster analysis.
(3) Use a data envelopment analysis model to assess the impact of reducing carbon emissions, take into account input and output relaxation, identify the relationship between the impact of carbon financial development and the reduction of carbon emissions, assess the improvement space of particular input and output components, and present recommendations for improving carbon emission reduction policy based on this analysis.
3 Research methods
3.1 Systematic cluster analysis
Data analysis and classification are done using a statistical exploratory data analysis method called Hierarchical Cluster Analysis (HCA). It is a type of cluster analysis, which is mostly used to create “clusters” or “tree structures” made up of related things by grouping cases or objects in a data set. A hierarchical structure known as a “cluster tree” can be created from the results of systematic cluster analysis to represent the similarity between data points. To separate out the most relevant and useful indicator variables, cluster analysis can classify not only the sample data but also the indicator variables that have been chosen.
This research evaluates the impact of carbon finance development on reducing carbon emissions by screening and establishing an indicator system using a systematic cluster analysis technique. As of right now, China’s carbon finance lacks strong standards and trade regulations, which could have an impact on the evaluation indicator system’s representativeness and scientificity. An excellent way to reduce the number of redundant indicators in this paper is to use the systematic clustering analysis method, which can fully excavate the intrinsic laws and characteristics of the data during the analysis process. It can also support the classification of processing multiple variable decisions and guarantee the objectivity, representativeness, and relevance of the indicator system. The specific calculation formula involved in the model is Equations 1–10 below.
Using the Euclidean distance calculation approach, the systematic clustering model calculates the sample spacing as follows:
Let
where
The closest samples are combined into one class according to the closest distance matrix, and clustering is performed based on the Euclidean distance method using the sum of squared deviations, and the recursive formula for the distance from other
Where
3.2 Analysis of data envelopment
The concept of relative efficiency, which was put forth by academics like A. Charnes and W.W. Coopor in 1978, serves as the foundation for the efficiency evaluation technique known as data envelope analysis (DEA). By maintaining the same input or output, the approach projects each decision-making unit onto the DEA production frontier. The degree to which each DMU deviates from the DEA frontier is used to compare the relative effectiveness of the DMUs. The BCC model and the CCR model are currently the most used DEA models.
Under particular input conditions, DEA may quantify the carbon emission reduction output efficiency of decision-making units involved in carbon financing activities, such as financial institutions and investment projects, and give a thorough evaluation of these units. Without the need for predetermined weights or production function forms, the method can handle the complexity of numerous inputs and outputs. It is especially well-suited for evaluating the overall success of carbon finance programs. Ineffective decision-making units and the particular issues they face can be found through DEA analysis, which paves the way for better management, more effective resource allocation, and increased carbon emission reduction efficiency.
In the study of evaluating the carbon emission reduction effect of carbon finance, DEA-BCC model and DEA-Malmquist model have significant advantages over other models. First, the DEA-BCC model, as a kind of data enveloping analysis (DEA), allows variable returns to scale (VRS), which can more accurately measure the pure technical efficiency (PTE) of DMU than the constant returns to scale (CRS) assumption of CCR model, because it takes into account the effect of scale efficiency (SE). This is particularly important when evaluating carbon finance projects, which may operate at different scales, and the BCC model can reveal the true efficiency performance at different scales.Secondly, the DEA-Malmquist model can dynamically analyze the efficiency of DMU, which evaluates the change of technical efficiency and technological progress by calculating the efficiency change between two periods. This dynamic analysis capability makes the DEA-Malmquist model particularly suitable for assessing the effect of carbon reduction over time, and is able to identify the relative contribution of technological advances and efficiency changes to carbon reduction.
The combination of DEA-BCC model and DEA-Malmquist model is beneficial to the research mainly in that it can comprehensively analyze the efficiency of DMU from both static and dynamic dimensions. The DEA-BCC model reveals the immediate efficiency level of the DMU by measuring pure technical efficiency and scale efficiency at a specific point in time, while the DEA-Malmquist model provides an in-depth understanding of the dynamic changes in efficiency by analyzing efficiency changes over time, including technical efficiency changes and technological advances. This combined method can not only process time series data, but also identify the driving factors of efficiency change, so as to provide a more accurate basis for policy making and practice improvement.
3.2.1 DEA- BCC model
The two most popular DEA models are the BCC and CCR models. The BCC model more thoroughly breaks down the comprehensive effect that the CCR model measures into scale efficiency and pure technical efficiency. The CCR model deals with the effectiveness of decision-making units under the assumptions of constant returns to scale, whereas the BCC model deals with variable returns to scale. This research chooses the BCC model with variable scale reward as the evaluation model since the influence of China’s carbon finance development on reducing carbon emissions is dependent on a number of factors, including the internal and external environment.
Given n decision making units DMU {
Here the decision variables are
The efficiency value of the measured decision unit, or the ratio of input efficiency to output efficiency, represents the optimal solution of the model
where
The validity of the DEA-BCC model is judged as follows.
(i) If
(ii) If
(iii) If
3.2.2 DEA-Malmquist modeling
The BCC model measures a relative frontier efficiency, where the efficiency value indicates how far the assessed unit’s observed value is from the current period’s production frontier envelope. The Malmquist index of frontier efficiency must be introduced in order to observe the dynamic change of the efficiency level in different eras, as the level of production technology will vary over time and the frontier surface will be moved in different periods. The fundamental concept is that an index is created to evaluate the two sets of data when two sets of efficiency values are compared, with the undifferentiated curves of one set serving as the reference set. The particular mode of communication is:
where the Malmquist index,
The result:
If
4 Building for the reduction of carbon emissions carbon financial development indicators for effect evaluation
4.1 Reduction of carbon emissions financial Development’s impact on carbon
Carbon finance is a green financial service that contributes significantly to sustainable social and economic growth as well as environmental conservation. This paper integrates the theory of China’s carbon emission reduction effect with the development of China’s carbon financial market, and it defines the evaluation of China’s carbon emission reduction effect as two main aspects: on the one hand, carbon financial development can effectively provide price signals for the carbon emission right trading market, promote the balance of supply and demand, and provide flexible and diversified emission reduction means for the primary emission reduction body; on the other hand, China’s carbon financial development has a significant impact on the industrial structure and regional economic structure by optimizing and adjusting the industrial This conceptual framework serves as the foundation for the next phase, which chooses and builds an indicator system to assess how China’s carbon finance development has reduced carbon emissions across input and output dimensions.
4.2 Indicator selection
Selecting the appropriate evaluation index according to the characteristics of the research object is one of the key steps to build the model. Based on the characteristics of carbon emission trading mechanism and the current situation of China’s carbon financial market, this paper constructs the input-output index required by the BCC model after the calculation and screening of the systematic cluster analysis model. Figure 1 shows the establishment method of carbon emission reduction effect evaluation index system for the development of carbon finance in China.
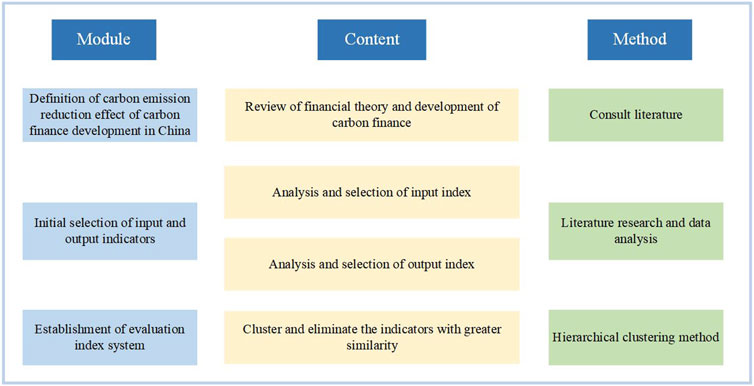
Figure 1. Methods for establishing the evaluation index system of carbon emission reduction effect of carbon finance development in China
4.2.1 Input indicators
Numerous research have demonstrated that the amount of carbon dioxide emission reduction is critical to the carbon emission reduction effect of carbon financial development. Additionally, the socio-economy is the most significant influencing variable. In this study, we argue that the three most significant elements influencing the carbon emission reduction effect of carbon finance development are government public expenditure, carbon trading market mechanism, and policy regulations. These are the fundamental building blocks of China’s development of carbon finance: government public spending correlates with socio-economic factors, policy laws and the carbon trading market mechanism with institutional design considerations.
In order to assess the impact of China’s development of carbon finance on the reduction of carbon emissions, this article chooses input indicators. The first selection of these indicators is displayed in Table 1. The carbon quota norm, the quantity of policies pertaining to carbon finance, the rate of development of green technologies, and so forth are the primary indicators pertaining to policy regulations. The carbon quota standard is not regarded as one of the input indicators since it is influenced by factors related to regional growth, which gives rise to its quantitative relevance. Yet, the extent of green technology development does not match that of its market implementation and application, and its actual contribution to reducing carbon emissions may be minimal. For these reasons, this paper selects the number of policies related to carbon finance as the input indicator for policy regulations; regarding the carbon trading market mechanism, most researchers use data to select indicators from green financial product innovation and green securities issuance scale to examine market efficiency. In terms of government public expenditure, this paper reflects the government’s input in the carbon market with the percentage of government public expenditure on energy-saving industry. The scale of green credit is chosen as the evaluation index in terms of the carbon trading market mechanism based on the feasibility of data accounting.
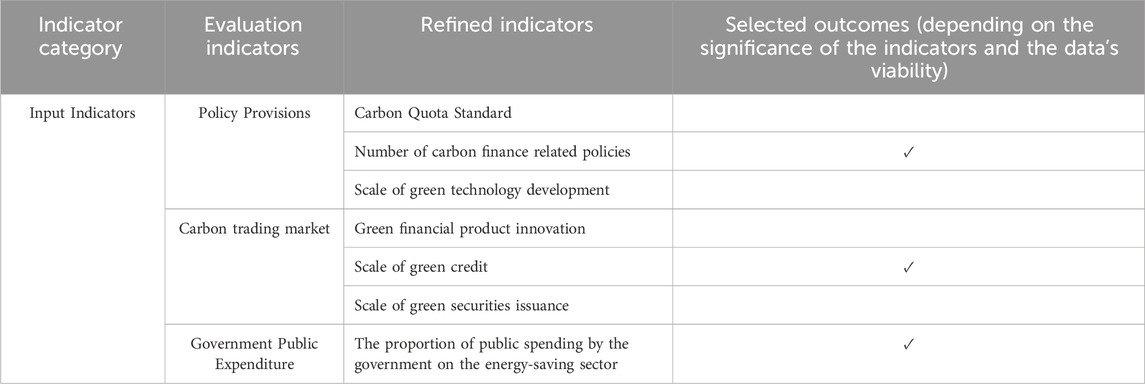
Table 1. Choosing input indicators to assess the efficiency of China’s carbon financial development in reducing emissions of carbon.
Below are the indicators’ thorough explanations.
(1) The number of policies pertaining to carbon finance(X1)
This research uses the number of policies connected to carbon financing as an input indicator for policy regulations. The quantity of policies can be interpreted as a measure of the government’s efforts to reduce carbon emissions in the development of China’s carbon finance and the range of industries and fields in which it is applied. Additionally, the flexibility and adaptability of policies related to carbon finance are crucial in enabling the government to respond to changes in the market and achieve long-term carbon emission reduction targets, which in turn determines the significance of the government’s efforts to develop carbon finance. It is a significant input variable that influences how China’s carbon finance is developing in relation to the reduction of carbon emissions.
(2) The Green Credit Scale(X2)
The balance of credit funds given by financial institutions to green businesses and projects during a specific time frame following the changeover is referred to as the “green credit scale,” and it is a measure of how strongly the country’s financial sector supports low-carbon economic activity. The expansion of the green credit balance is typically seen as a tangible example of the financial market’s support for eco-friendly initiatives. This support not only gives green projects the money they need, but also makes it easier for social capital to move to the green sector through the credit mechanism, which supports the green transformation of the economic structure and offers a variety of financing options for carbon emission reduction initiatives.
(3) Government public spending as a percentage of GDP on sectors that use less energy(X3)
This indicator is a direct reflection of the government’s policy tendency to promote carbon emission reduction initiatives and the growth of green economies. It also shows the extent of government financial involvement in the development of energy-saving companies. An increase in the share of public expenditure by the government typically indicates that energy efficiency and carbon emission reduction are priorities for the government. The financial support provided by the government for carbon finance serves to expedite the marketization of low-carbon technology and decrease the barrier to adoption for businesses and individuals utilizing green technologies. It directs more private capital to flow to green and low-carbon sectors, creating a situation in which the market and the government work together to promote carbon emission reduction. As demonstrated by the particular calculation Formula 11:
Where x3 is the percentage of government public expenditure on energy-saving industries in that year, ye is the government expenditure on energy-saving industries in that year, and Y is the total public expenditure of the government in that year.
4.2.2 Output indicators
To assess the impact of China’s development of carbon finance on the reduction of carbon emissions, this article will select output indicators from the three dimensions of economic, social, and environmental advantages, as indicated in Table 2. The indicator of social benefit selected for this article is universal access to carbon. It also helps to form green lifestyles and consumption patterns, which promotes carbon emission reduction at the social level. This embodies the role of carbon finance in enhancing public participation and promoting social awareness of low carbon. By providing incentives for individuals and small and micro enterprises to engage in emission reduction activities, it not only promotes widespread social recognition of and participation in carbon emission reduction actions. The market value of carbon financial products and the level of activity in the carbon financial market are reflected in the trading volume of carbon emission rights, which has positive economic effects. In addition to encouraging businesses to implement affordable emission reduction strategies and offering financial institutions investment opportunities to support the growth of carbon finance, an active carbon market can efficiently distribute emission reduction resources through the price mechanism. Lastly, a direct and important way to gauge the environmental advantages of carbon financing development is to look at the reduction of carbon emission intensity, which is the reduction of carbon emissions when producing the same amount of economic production. Carbon emission intensity is used as an environmental output metric because, when compared to energy consumption intensity and carbon quota flow rate, it provides a more accurate assessment of the contribution of carbon financing development to environmental betterment.
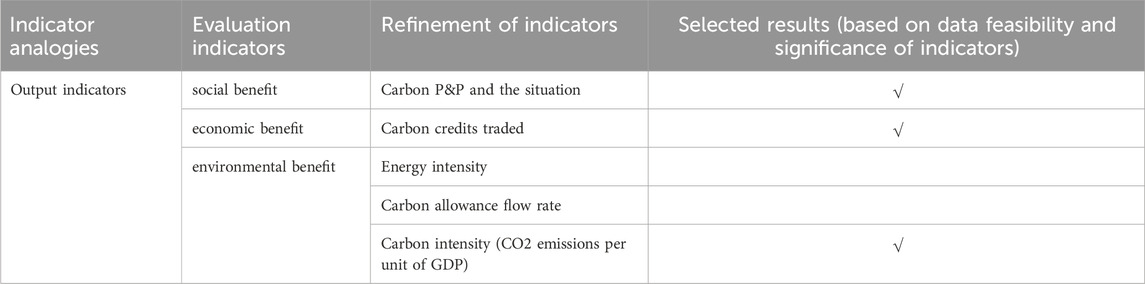
Table 2. Choosing output indicators to assess the efficiency of China’s carbon finance development in reducing emissions of carbon.
Below are the indicators’ thorough explanations.
(1) Growing Acceptance of Carbon Inclusion(X4)
The Carbon P&G mechanism is intended to encourage individuals and micro- and small-scale businesses to engage in market-based strategies for reducing carbon emissions. Its widespread use as a social benefit output indicator can also be used to gauge how well society is doing at reducing carbon emissions, which in turn indicates how well the government is doing at encouraging public participation in environmental protection and raising public awareness of low- and green-carbon products as part of the process of developing carbon finance in China. The following are the quantifiable outcomes of carbon popularization as reported in this paper: This indicator is quantified as one if the local government has successfully made the carbon popularization mechanism known to the public; it is quantified as 0 if the public has not been made aware of the carbon popularization mechanism by the local government.
(2) Volume of Carbon Emission Trading(X5)
An important metric for gauging the activity of the carbon financial market and the liquidity of carbon financial products is the trading volume of the carbon emission rights trading market, which reflects the market’s capacity to price carbon emission rights as well as the scope of financial activities, which reflects the role of the carbon financial market in resource allocation. The economic efficiency of carbon emission rights trading volume can be used to measure the advantages and disadvantages of reducing carbon emissions, as well as the size and activity of the carbon financial market, the efficacy of carbon financial policies, and the extent to which the market has responded to the reduction of carbon emissions.
(3) Intensity of Carbon Emissions(X6)
The term “carbon emission intensity” refers to the amount of carbon dioxide emissions per unit of gross national product (GNP). This measure primarily reflects the impact of China’s carbon financial development on reducing carbon emissions from an environmental perspective. Reducing carbon emission intensity implies that the country’s development of carbon financial development reduces carbon dioxide emissions while creating economic value, which is a more logical way to reflect the effects of carbon emission reduction and the sustainability of China’s carbon financial development. The precise formula for calculating carbon emission intensity is as follows. As illustrated in (12):
where
4.2.3 Preliminary construction of indicator system
The preliminary selection of carbon emission reduction effect evaluation indexes of China’s carbon financial development is displayed in Figure 2, which is based on the study above.
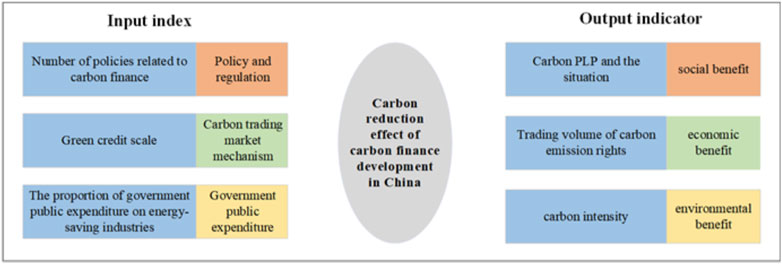
Figure 2. preliminary metrics chosen to assess how China’s implementation of carbon financing has reduced carbon emissions.
Three input indications and three output indicators make up the tentatively built indicator system, as seen in the figure. The purpose of this paper is to assess the impact of carbon financial development on reducing carbon emissions in five administrative regions in the years 2022–2023. There are ten total decision-making units, and the total of the current input and output indicators is double that number (12 > 10). In order to prepare the data for the DEA model’s future calculation, this paper filters the indicators using the systematic clustering method, removes redundant indicators, and investigates and cleans the data.
4.3 Indicator screening based on systematic clustering
4.3.1 Indicator base data summarization
The indicator gathers panel data from five carbon financial markets in Jilin, Beijing, Guangdong, Ningxia, and Xinjiang between 2022 and 2023. It primarily sources the number of policies related to carbon finance from financial regulatory platforms and government documents in each region, thereby ensuring the data’s credibility. We then obtain the green credit scale data from the statistical reports of financial institutions and regulators, which reflect the evolution of green finance. We directly obtain the data on carbon emissions trading volume from the green finance trading platforms or carbon emissions exchanges in each region, which provide real-time information on market transactions. The finance department provides data on the government’s percentage public expenditure on the energy-saving industry, demonstrating the government’s financial backing for this sector. Enterprises’ energy consumption and carbon emission data, derived from their annual reports and environmental assessment reports, serve as the basis for calculating carbon intensity. We obtain Carbon P&E from the official websites of local governments and policy documents. The cWe systematically organize and analyze the panel data collection, which spans indicators from 2022 to 2023, to ensure data continuity and comparability. detailed data sources and collection methods provide a solid scientific basis for the study. Table 3 summarizes the collated input-output data.
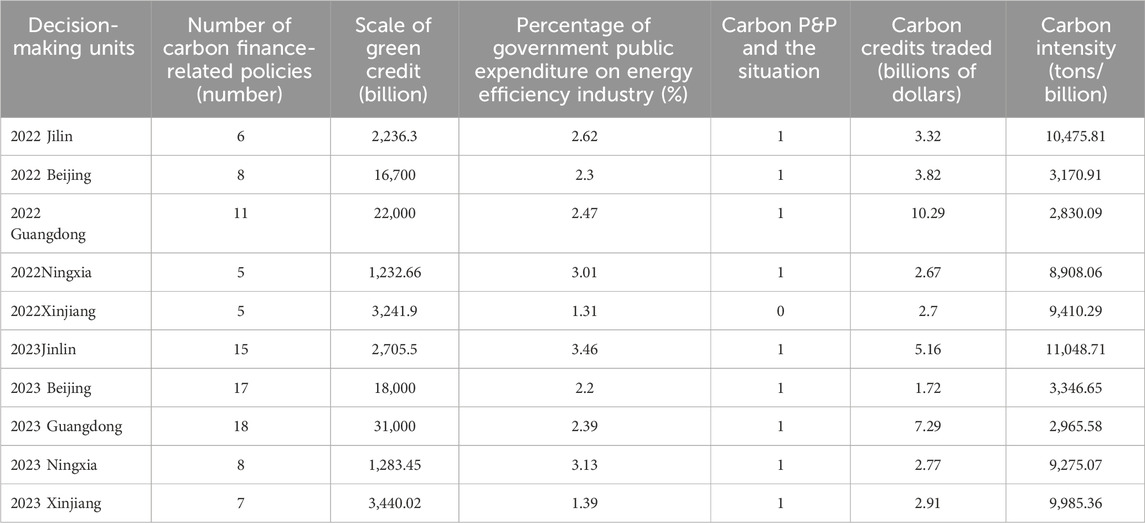
Table 3. Summary of indicator base data.
4.3.2 Systematic clustering results
Table 2’s data was standardized with the use of SPSS26.0. The processed data was then split into three input and three output indicators. The systematic clustering method was chosen, with the square Euclidian distance serving as the standard. The approximation matrix for the correlation analysis was chosen, and the results are displayed in Table 4. Figure 3 displays the outcomes of the clustering process, which was carried out based on the standard distance between the variables.
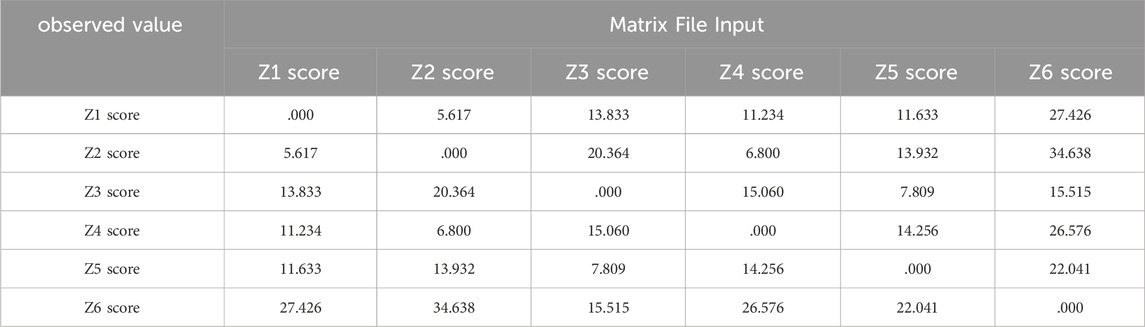
Table 4. Matrix of approximations.
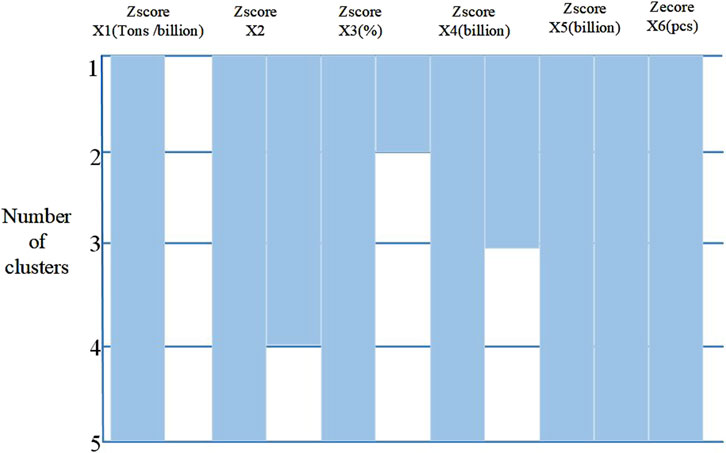
Figure 3. Vertical icicle diagram for systematic cluster analysis.
Table 4 indicates that there is a good degree of match between the two indicators (number of policies related to carbon finance and carbon inclusion and access) and other indicators. These indicators should be further examined in conjunction with the icicle diagram in Figure 3.
The indicators are culled from bottom to top beginning with the last row, as the vertical icicle diagram with a single link in Figure 3 illustrates. The indicators with equal horizontal observations have more similarity and are comparatively less representative. The carbon universal access situation and the government’s share of public expenditures on energy-saving industries are clustered into one category when the clustered indicators are clustered into four categories; at this point, the input and output indicators are clustered into four categories, which is in line with the DEA model’s requirement on the number of policies related to carbon finance. When the clustered indicators are clustered into five categories, the scale of green credit and the number of policies related to carbon finance are clustered into one category, and each of the other indicators is clustered into one category. The input-output indicators will not be further clustered at this point since they have been combined into four categories, which satisfies the DEA model’s criteria for the total number of indicators.
Consequently, this paper does the following two things: first, it removes the number of policies related to carbon finance, which is very similar to the green credit scale, and keeps the green credit scale as a representative indicator; second, it removes the carbon universalization and accessibility, which is very similar to the government’s share of public expenditures on energy-saving industries, and keeps the latter as a representative indicator. Table 5 displays the finished carbon emission reduction effect evaluation index system of China’s carbon financial development, which consists of two input indicators and two output indicators following the screening of the systematic cluster analysis model.
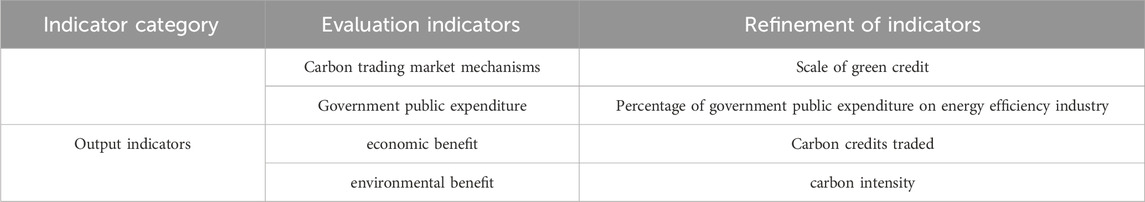
Table 5. China’s carbon financial development indicator system for emissions reduction and effect evaluation.
5 DEA-based assessment of carbon financial development’s impact on reducing emissions
5.1 Static analysis based on DEA-BCC modeling
The data of carbon emission reduction effect related indicators of carbon financial development in China by DEA are analyzed in this paper using the DEAP2.1 software. Select the input production mode, input the scale of green credit, the proportion of government public expenditure on energy-saving industry, the amount of carbon emission right trading, and the intensity of carbon emission, respectively, and run the program in accordance with the results of systematic clustering and the requirements of the DEA model’s input-output index arrangement. Under the condition of variable returns to scale (VRS), the carbon emission reduction effect values of the carbon financial development in five regions—Jilin, Beijing, Guangdong, Ningxia, and Xinjiang—from 2022 to 2023 are estimated. The detailed results are displayed in Figures 4, 5.
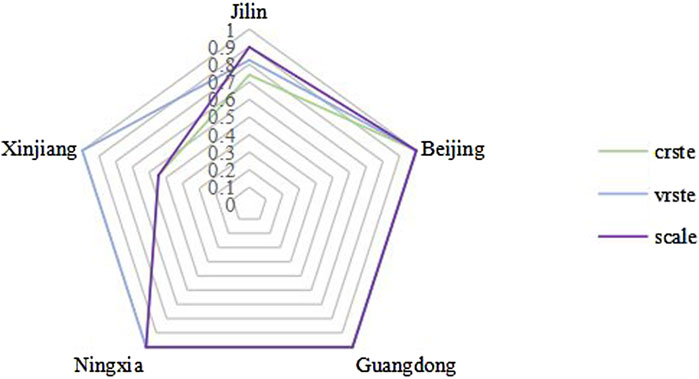
Figure 4. Carbon reduction effect value by region in 2022.
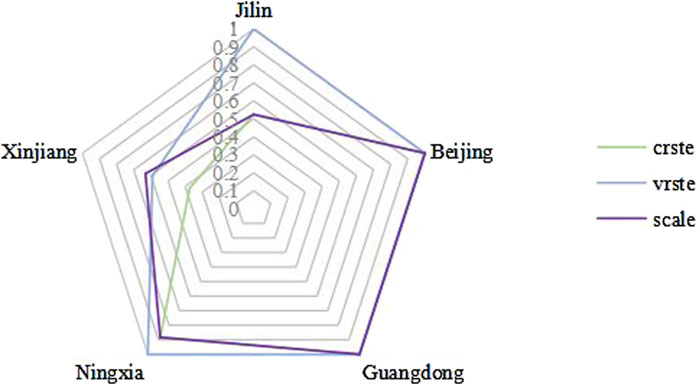
Figure 5. Carbon reduction effect value by region in 2023.
Figures 4, 5 show that the overall impact of China’s carbon emission reduction program on carbon financial development is between 0 and 1. The optimum carbon emission reduction effect of carbon financial development in the region is reached when the comprehensive effect is 1, and when the value of the comprehensive effect is less than 1, it suggests that the region’s carbon emission reduction effect needs to be enhanced. The overall average of the five administrative regions’ carbon emission reduction effect from the carbon financial development in 2022–2023 is 0.848, with 15.2% of the ineffective portion still requiring improvement. In 2022, the carbon emission reduction impact value of one was found in three regions: Beijing, Guangdong, and Ningxia. However, in 2023, the carbon emission reduction effect value of one was found in just two regions: Beijing and Guangdong. By 2023, the fraction of inefficient carbon financial development increases, and just two regions—Beijing and Guangdong—have a DEA-effective carbon emission reduction effect. Xinjiang is in the stage of rising returns to scale in both years, indicating that the benefit of reducing carbon emissions can still be improved because the scale of carbon financial development is too modest. However, each market’s average pure technical efficiency is close to pure technical efficiency at 0.942, meaning that when the scale factor is ignored, each region is better able to modify the input-output structure in order to maximize input-output utility.
5.2 DEA-Malmquist modeling-based dynamic analysis
This paper uses the DEA-Malmquist index to measure the changes in total factor productivity, comprehensive efficiency, technical progress, pure technical efficiency, and scale efficiency of the carbon emission reduction effect of carbon financial development in each province and region in 2022–2023. This is done in order to reflect the dynamic change in the carbon emission reduction effect in five provinces and regions. The measurement of the BCC model is the basis for this analysis. The results are shown in Table 6:
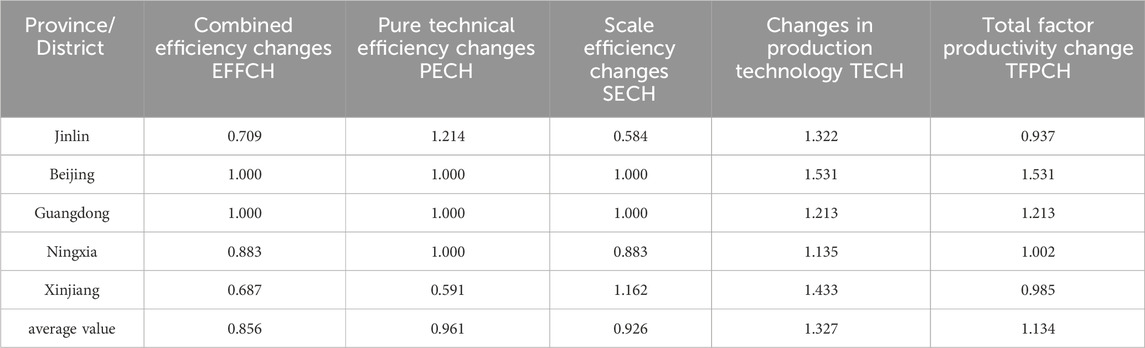
Table 6. Variations in each province and region’s impact on reducing carbon emissions according to the DEA-Malmquist model.
Table 6 shows that the average change values for comprehensive efficiency, pure technical efficiency, and scale efficiency in the five provinces and regions during the study period were 0.856, 0.961, and 0.926, respectively. These values are less than 1, which means that the level of efficiency is going down. The dual effect of pure technical efficiency and scale efficiency contributes to this downward trend, with the decline in scale efficiency significantly impacting overall efficiency, as its change value (0.926) is lower than that of pure technical efficiency (0.961). The change value of total factor efficiency (TFP) for the effect of carbon financial development on reducing carbon emissions in the five provinces and regions is 1.134, which is greater than 1. This means that carbon financial development has had a better effect on reducing carbon emissions in these provinces and regions during the study period. The decrease in overall efficiency, pure technical efficiency, and scale efficiency all have a negative impact on the carbon emission reduction effect of carbon financial development. However, the rise in total factor productivity is mostly due to the improvement of production technology. Specifically, the average value of the change in production technology for carbon financial development in the five provinces and regions is 1.327, an increase that indicates that the improvement in the level of technology is the main driver of the improvement in carbon emission reduction effects. Therefore, we can infer that technological progress significantly enhances the carbon emission reduction effect of carbon financial development. This paper views the carbon emission reduction effect of carbon financial development as a system that generates economic and environmental advantages through the carbon market trading mechanism and government public expenditure operations. It concludes that the lower levels of comprehensive efficiency, pure technical efficiency, and scale efficiency in the carbon emission reduction effect of carbon financial development across different regions primarily stem from the inadequate scientific and rational design of policy regulations, market mechanisms, and industrial structure.
5.3 Differentiation analysis based on slack variables
Based on the aforementioned study, the five areas’ poor performance in reducing carbon emissions may be attributed to their typically low scale efficiency. Additionally, when examining these markets from the perspective of dynamic change, it becomes evident that each market’s comprehensive and scale efficiency are declining. This study aims to analyze the causes behind the specific input and output aspects in detail. The improvement features of the carbon emission reduction impacts in various regions are then made clear by interpreting and analyzing the effects of each region’s reduction in carbon emissions in accordance with the unique efficiency values and slack variables determined by the BCC model. In five provinces and regions between 2022 and 2023, Table 7 displays the efficiency values and slack variables of the carbon emission reduction effects of carbon financial development.
(1) Jilin carbon emission reduction effect: the carbon emission reduction effect of carbon financial development in Jilin in 2022 has a comprehensive efficiency value of 0.740, of which the values of scale efficiency and pure technical efficiency are respectively 0.824 and 0.898. The main factor limiting the development of the carbon emission reduction effect is low technical efficiency. Table 7 shows that in Jilin, the change in carbon emission reduction effect due to pure technical efficiency and scale efficiency in 2023 will be 1.000 and 0.524, respectively, and that a drop in scale efficiency will result in a 41.4% decline in comprehensive efficiency value.
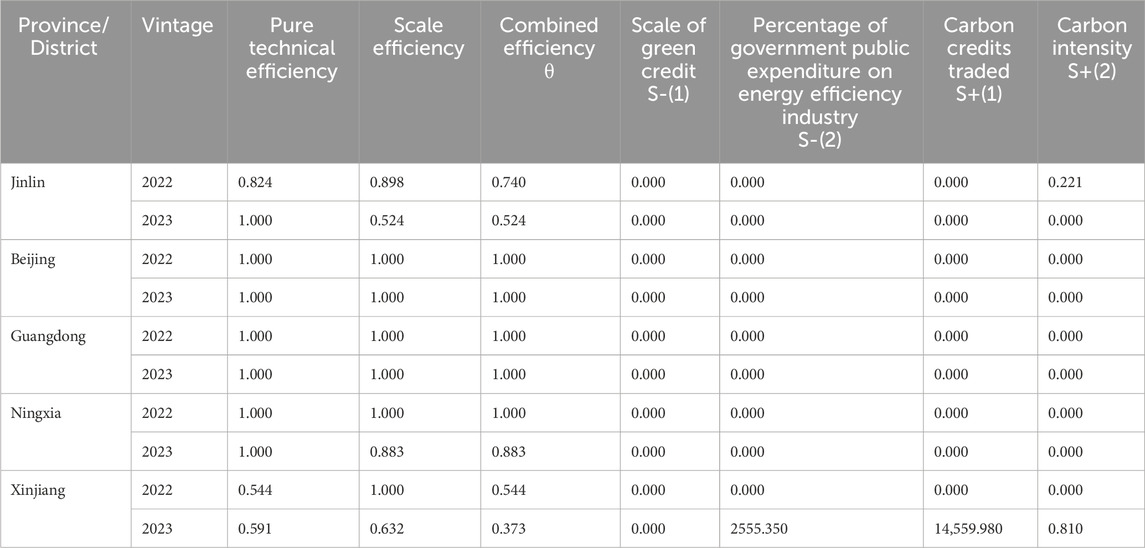
Table 7. For each province and region in 2022–2023, the efficiency values and slack factors of the carbon emission reduction effect are provided.
The carbon emission intensity in Jilin is higher in 2022 due to lower pure technical efficiency; however, in 2023, pure technical efficiency increases by 21.4% while carbon emission intensity decreases in comparison with 2022. These results suggest that pure technical efficiency is the primary factor influencing carbon emission intensity.
(2) Beijing’s carbon emission reduction effect: In 2022–2023, Beijing’s carbon financial development has the effect of reducing carbon emissions while keeping everything operating smoothly. Beijing achieves the effective DEA in 2022 and 2023 when its scale efficiency, comprehensive efficiency, and pure technological efficiency are all 1.
Beijing should maintain the current state of carbon finance development based on the establishment and enhancement of the carbon trading market mechanism, which can rely on the national carbon emissions trading market. Additionally, Beijing should further refine and improve the market rules to ensure the market’s fairness and transparency, and at the same time, introduce more financial institutions to participate and improve the market’s liquidity. Beijing should also expedite the creation and revision of laws and regulations related to the reduction of carbon emissions, strengthen policy guidance, and realize bets.
(3) Guangdong’s carbon emission reduction effect: in 2022 and 2023, Guangdong’s carbon financial development will have a DEA-effective carbon emission reduction effect. The province will have a pure technical efficiency, scale efficiency, and comprehensive efficiency of 1. Guangdong Province should develop innovative carbon financial products going forward, and it can also explore and develop financial instruments like carbon asset collateralized financing, carbon funds, and carbon buyback. Additionally, it can continue to introduce and improve financial instruments like carbon finance, as well as introduce and improve incentive policies to effectively improve the province’s carbon emission reduction effect. These recommendations are based on the current state of Guangdong’s green financial development.
(4) Ningxia’s impact on reducing carbon emissions: in 2022, the impact of Ningxia’s carbon financial development on reducing carbon emissions will be DEA effective; in 2023, the impact of Ningxia on reducing carbon emissions will be purely technical effective; however, the reduction in scale efficiency from one to 0.883 will prevent the impact from being fully effective. The primary factor influencing Ningxia’s 2023 carbon emission reduction effect is its pure technological efficiency, while the decline in scale efficiency has little bearing on this effect. In order to successfully boost the carbon emission reduction effect in the future carbon finance development process, Ningxia should therefore build the carbon market infrastructure, increase the scope of the carbon trading market, and establish a more flawless market regulatory system.
(5) The decrease of carbon emissions in Xinjiang: the market’s pure technical efficiency in 2022 and 2023 was only 0.544 and 0.591, respectively. This had a significant impact on the overall efficiency performance. In 2023, Xinjiang’s scale efficiency dropped from one in 2022 to 0.632. Additionally, government public expenditures on energy-saving industries are redundant, and the province’s production of carbon emission intensity and volume trading is insufficient.
To attain DEA efficiency, the Xinjiang market must modify public spending on energy-saving enterprises by the government. The Xinjiang government should, first and foremost, streamline the structure of public spending, closely examine and modify public spending on energy-saving sectors, lessen redundant input indicatory, and make sure that money is allocated more wisely to important sectors and initiatives. Second, by putting in place stricter project management and evaluation procedures, the government should increase the effectiveness and efficiency of public spending in carbon emission reduction initiatives, as well as the efficiency with which funds are utilized.
6 Conclusion and policy recommendations
This paper sets up an indicator system using a systematic cluster analysis model screening and looks at panel data from five administrative regions in China: Jilin, Beijing, Guangdong, Ningxia, and Xinjiang. It does this from 2022 to 2023 and uses a data envelope analysis model to figure out how the growth of carbon finance in those regions has affected lowering carbon emissions. It also goes into detail about the results of that analysis and suggests specific policy changes that should be made based on the current state of carbon finance development in each region. This paper evaluates the financial development status of each region and ultimately provides targeted policy recommendations. The study finds that carbon financial development has not quite reached the ideal level for reducing carbon emissions in all five administrative regions yet. However, Beijing, Guangdong, and Ningxia have reached the DEA effective carbon emission reduction level for 2022. Beijing has also maintained an efficient carbon emission reduction status during the study period, with values of one for pure technical efficiency, scale efficiency, and comprehensive efficiency. Guangdong Province has also demonstrated a similar level of carbon financial development, and the Ningxia Hui Autonomous Region has also demonstrated DEA effectiveness. The Ningxia Hui Autonomous Region achieved DEA effectiveness in 2022, but the scale efficiency decreased to 0.883 in 2023, failing to maintain a fully effective state. Nonetheless, pure technical efficiency remains the main determinant of carbon reduction effectiveness in Ningxia. In 2022 and 2023, Xinjiang Uygur Autonomous Region (XUAR) has a lower pure technical efficiency of 0.544 and 0.591, respectively, which seriously affects the comprehensive efficiency. The scale efficiency declines to 0.632 in 2023, pointing to the redundancy of public expenditures and the inadequacy of carbon emission rights trading. Technical efficiency significantly influences the reduction of carbon emissions in Jilin Province, resulting in a comprehensive efficiency value of 0.740 in 2022, where the pure technical efficiency value is 0.824 and the scale efficiency value is 0.898. The decline in scale efficiency in 2023 leads to a significant reduction of 41.4% in the comprehensive efficiency value, indicating that changes in scale efficiency have a large impact on comprehensive efficiency. As a result, improving technical efficiency is critical to reducing carbon emissions in Jilin Province. In this context, this paper proposes the following policy recommendations from three perspectives: market mechanisms, technological innovation, and social participation.
(1) The market mechanism should be improved and innovated upon, and diversified financial institutions should be introduced to encourage enterprises to participate. The government must build a well-structured carbon trading market system, formulate detailed trading rules according to local conditions, establish a strong regulatory body, and improve relevant laws and regulations to ensure the fairness and transparency of the market. At the same time, diversified financial institutions and investors should be introduced to increase market liquidity, such as by setting up special funds and encouraging financial institutions to develop carbon trading-related financial products and other innovative financing models. By establishing and improving the carbon trading market system, we can price carbon emissions economically, thereby motivating enterprises to reduce emissions. The carbon trading market allows enterprises to buy and sell carbon emission allowances among themselves so that more efficient enterprises can profit from the sale of excess allowances, while less efficient enterprises need to buy allowances to comply, thus pushing the entire market closer to a more efficient level of carbon emissions. In addition, incentives such as tax breaks and financial subsidies can reduce the initial investment costs of enterprises adopting low-carbon technologies and promote more active technological upgrading to reduce greenhouse gas emissions.
(2) Increase R&D investment in relevant technologies and promote low-carbon technological innovation through policy incentives. The government should increase R&D investment in clean energy, energy-saving, and emission reduction technologies to improve the core driving force of carbon emission reduction efficiency. Simultaneously, the government should promote the adoption of low-carbon technologies by enterprises through policy incentives like R&D subsidies and tax incentives, thereby enhancing energy efficiency. In addition, the government should introduce, digest, and absorb international advanced technologies, prioritize the cultivation of technological talents, and enhance the level of domestic carbon emission reduction technology through the establishment of professional training programs and the provision of continuing education opportunities. Increased government investment in R&D for clean energy, energy-saving, and emission reduction technologies can accelerate the commercialization of new technologies and improve their market competitiveness. Policy incentives such as R&D subsidies and tax incentives can help enterprises reduce their R&D risks and encourage them to engage in technological innovation.
(3) Accelerate the popularization of the carbon inclusion mechanism to enhance social participation. The government can utilize a variety of media to publicize and educate on carbon emission reduction and raise the level of public awareness of carbon emission reduction. By establishing a carbon credit trading platform and popularizing the carbon inclusion mechanism, the government encourages individuals and communities to participate in energy-saving and emission reduction activities, such as energy-saving and emission reduction, green travel, etc., thereby providing real economic incentives for the public’s emission reduction behaviors. Simultaneously, establish a public monitoring system, such as a carbon emission information disclosure system and a public reporting mechanism, to enhance social supervision of corporate carbon emission behavior and achieve a more effective reduction in carbon emissions. Raising public awareness of carbon emission reduction through publicity and education can change consumption behavior and prompt people to choose a more environmentally friendly lifestyle. The establishment of a carbon credit trading platform provides economic incentives for individuals and communities to reduce emissions, making emission reduction behavior directly related to personal interests and thus stimulating broader social participation.
Data availability statement
The original contributions presented in the study are included in the article/supplementary material, further inquiries can be directed to the corresponding author.
Author contributions
LC: Conceptualization, Writing–original draft, Writing–review and editing. DX: Data curation, Writing–original draft, Writing–review and editing. MT: Formal Analysis, Writing–original draft. XL: Resources, Writing–original draft. FH: Writing–original draft, Writing–review and editing. LG: Supervision, Writing–original draft, Writing–review and editing. PS: Writing–original draft, Writing–review and editing. LJ: Writing–original draft, Writing–review and editing. GZ: Writing–original draft, Writing–review and editing.
Funding
The author(s) declare that financial support was received for the research, authorship, and/or publication of this article. National Key R&D Program Funded Projects (2020YFB1707804). This work is supported by Science and Technology Project of State Grid Jilin Electric Power Company Limited (2022JBGS-08).
Conflict of interest
Authors LC, MT, XL, FH, LG, and PS were employed by State Grid Baicheng Power Supply Company.
Author DX was employed by Power Science Research Institute of State Grid Jilin Electric Power Co, Ltd.
The remaining authors declare that the research was conducted in the absence of any commercial or financial relationships that could be construed as a potential conflict of interest.
The authors declare that this study received funding from State Grid Jilin Electric Power Company Limited. The funder had the following involvement in the study: study design, collection, analysis, interpretation of data, the writing of this article, and the decision to submit it for publication.
Publisher’s note
All claims expressed in this article are solely those of the authors and do not necessarily represent those of their affiliated organizations, or those of the publisher, the editors and the reviewers. Any product that may be evaluated in this article, or claim that may be made by its manufacturer, is not guaranteed or endorsed by the publisher.
References
Cao, Z., He, X., and Zhang, K. (2023). Research on the evolution mechanism and decoupling effect of China's carbon emissions from the perspective of green credit: based on system dynamics model and Tapio model. Environ. Sci. Pollut. Res. 30 (56), 118897–118915. doi:10.1007/s11356-023-30252-x
Feng, L., and Sun, Z. (2023). The impact of green finance pilot policy on carbon intensity in Chinese cities—based on the synthetic control method sustainability. Sustainability 15 (15), 11571. doi:10.3390/su151511571
Feng, Y., Gao, Y., Hu, S., Sun, M., and Zhang, C. (2024a). How does digitalization affect the green transformation of enterprises registered in China's resource-based cities? Further analysis on the mechanism and heterogeneity. J. Environ. Manag. 365, 121560. doi:10.1016/j.jenvman.2024.121560
Feng, Y., Sun, M., Pan, Y., and Zhang, C. (2024b). Fostering inclusive green growth in China: identifying the impact of the regional integration strategy of Yangtze River Economic Belt. J. Environ. Manag. 358, 120952. doi:10.1016/j.jenvman.2024.120952
Feng, Y., Zhang, J., Geng, Y., Jin, S., Zhu, Z., and Liang, Z. (2023). Explaining and modeling the reduction effect of low-carbon energy transition on energy intensity: empirical evidence from global data. Energy 281, 128276. doi:10.1016/j.energy.2023.128276
Gibon, T., Popescu, I. Ş., Hitaj, C., Petucco, C., and Benetto, E. (2020). Shades of green: life cycle assessment of renewable energy projects financed through green bonds. Environ. Res. Lett. 15 (10), 104045. doi:10.1088/1748-9326/abaa0c
Guo, B., He, D., and Jin, G. J. L. D.Development (2023). Agricultural production efficiency estimation and spatiotemporal convergence characteristic analysis in the Yangtze River Economic Belt: a semi-parametric metafrontier approach. Land Degrad. Dev. 34 (15), 4635–4648. doi:10.1002/ldr.4798
Guo, B., Yu, H., and Jin, G. (2024). Urban green total factor productivity in China: a generalized Luenberger productivity indicator and its parametric decomposition. Sustain. Cities Soc. 106, 105365. doi:10.1016/j.scs.2024.105365
Lei, T., Luo, X., Jiang, J., and Zou, K. (2023). Emission reduction effect of digital finance: evidence from China. Environ. Sci. Pollut. Res. Int. 30 (22), 62032–62050. doi:10.1007/s11356-023-26424-4
Liao, Y., and Zhou, X. (2023). Can digital finance contribute to agricultural carbon reduction? Evidence from China sustainability. Sustainability 15 (22), 15824. doi:10.3390/su152215824
Lin, Z., Liao, X., and Yang, Y. (2023). China's experience in developing green finance to reduce carbon emissions: from spatial econometric model evidence. Environ. Sci. Pollut. Res. 30 (6), 15531–15547. doi:10.1007/s11356-022-23246-8
Ling, S., Jin, S., Wang, H., Zhang, Z., and Feng, Y. (2024). Transportation infrastructure upgrading and green development efficiency: empirical analysis with double machine learning method. J. Environ. Manag. 358, 120922. doi:10.1016/j.jenvman.2024.120922
Liu, X., Chong, Y., Di, D., and Li, G. (2023). Digital financial development, synergistic reduction of pollution, and carbon emissions: evidence from biased technical change. Environ. Sci. Pollut. Res. Int. 30 (50), 109671–109690. doi:10.1007/s11356-023-29961-0
Lu, S., Peng, S., Shi, J., Zhang, C., and Feng, Y. (2024). How does digital transformation affect the total factor productivity of China's A-share listed enterprises in the mineral resource-based sector? Resour. Policy 94, 105146. doi:10.1016/j.resourpol.2024.105146
Niu, S., Zhang, K., Zhang, J., and Feng, Y. (2024). How does industrial upgrading affect urban ecological efficiency? New evidence from China. Emerg. Mark. Finance Trade 60 (5), 899–920. doi:10.1080/1540496X.2023.2260544
Ran, C., and Zhang, Y. (2023). The driving force of carbon emissions reduction in China: does green finance work. J. Clean. Prod. 421, 138502. doi:10.1016/j.jclepro.2023.138502
Shen, Q., Pan, Y., and Feng, Y. (2023a). Identifying and assessing the multiple effects of informal environmental regulation on carbon emissions in China. Environ. Res. 237, 116931. doi:10.1016/j.envres.2023.116931
Shen, Q., Pan, Y., Wu, R., and Feng, Y. (2023b). Peer effects of environmental regulation on sulfur dioxide emission intensity: empirical evidence from China. Energy Environ., 0958305X231201232. doi:10.1177/0958305x231201232
Shen, Q., Wu, R., Pan, Y., and Feng, Y. (2024). Explaining and modeling the impacts of inclusive finance on CO2 emissions in China integrated the intermediary role of energy poverty. Humanit. Soc. Sci. Commun. 11 (1), 82. doi:10.1057/s41599-023-02595-w
Wang, F., Shan, J., Zhang, Y., Fan, W., Zhang, H., and Ning, J. (2024). The carbon emission reduction effect of digital finance: a spatio-temporal heterogeneity perspective. Environ. Dev. Sustain. doi:10.1007/s10668-023-04386-4
Wang, G., Bai, J., Xing, J., Shen, J., Dan, E., Zheng, X., et al. (2023). Operational efficiency and debt cost: the mediating effect of carbon information disclosure in Chinese listed companies. Sustainability 15 (2), 1512. doi:10.3390/su15021512
Xu, S., and Liu, Y. (2023). Research on the impact of carbon finance on the green transformation of China's marine industry. J. Clean. Prod. 418, 138143. doi:10.1016/j.jclepro.2023.138143
Yang, Y., and Peng, C. (2024). Does the green finance reform and innovation experimental zone policy reduce carbon emission intensity? Evidence from Chinese cities. Front. Energy Res. 11. doi:10.3389/fenrg.2023.1337594
Zhang, J., Ma, X., Liu, J., and Zhang, S. (2023). All roads lead to Rome? The impact of heterogeneous green finance on carbon reduction of Chinese manufacturing enterprises. Environ. Sci. Pollut. Res. 30 (54), 116147–116161. doi:10.1007/s11356-023-30524-6
Zheng, Q., Ha, T., Prishchepov, A. V., Zeng, Y., Yin, H., and Koh, L. P. (2023). The neglected role of abandoned cropland in supporting both food security and climate change mitigation. Nat. Commun. 14 (1), 6083. doi:10.1038/s41467-023-41837-y
Keywords: carbon finance, carbon reduction, systematic cluster analysis, DEA-BCC model, the DEA-Malmquist model
Citation: Chunzhe L, Xueyuan D, Tao M, Libo X, Haibo F, Gang L, Sihang P, Jiarong L and Zeqi G (2024) Analysis of China’s carbon financial Development’s impact on reducing emissions using the BCC and Malmquist models. Front. Energy Res. 12:1450270. doi: 10.3389/fenrg.2024.1450270
Received: 17 June 2024; Accepted: 19 September 2024;
Published: 01 October 2024.
Edited by:
Federica Raganati, National Research Council (CNR), ItalyReviewed by:
Yanchao Feng, Zhengzhou University, ChinaGui Jin, China University of Geosciences Wuhan, China
Copyright © 2024 Chunzhe, Xueyuan, Tao, Libo, Haibo, Gang, Sihang, Jiarong and Zeqi. This is an open-access article distributed under the terms of the Creative Commons Attribution License (CC BY). The use, distribution or reproduction in other forums is permitted, provided the original author(s) and the copyright owner(s) are credited and that the original publication in this journal is cited, in accordance with accepted academic practice. No use, distribution or reproduction is permitted which does not comply with these terms.
*Correspondence: Liu Jiarong, MjAzMjk4NzAyMkBxcS5jb20=