 Abdollah Baghaei Daemei1*
 Tomasz Bradecki2Alina Pancewicz2Amirali Razzaghipour3Amiraslan Darvish4Asma Jamali5Seyedeh Maryam Abbaszadegan6Reza Askarizad7,8Mostafa Kazemi9
 Ayyoob Sharifi10,11
- 1School of Built Environment, Massey University, Auckland, New Zealand
- 2Faculty of Architecture, Silesian University of Technology, Gliwice, Poland
- 3School of Design and the Built Environment, Curtin University, Perth, WA, Australia
- 4Department of Environmental Conservation, Sustainable Building Systems Engineering, University of Massachusetts Amherst, Amherst, MA, United States
- 5Department of Architectural Engineering, Rahbord Shomal University, Rasht, Iran
- 6Department of Engineering, La Trobe University, Melbourne, VIC, Australia
- 7Department of Urban and Regional Planning, Universidad Politécnica de Madrid, Madrid, Spain
- 8Department of Civil and Environmental Engineering and Architecture (DICAAR), University of Cagliari, Cagliari, Italy
- 9School of Environment and Sustainability, Royal Roads University, Victoria, Canada
- 10Center for Peaceful and Sustainable Futures (CEPEAS), The IDEC Institute, Hiroshima University, Hiroshima, Hiroshima, Japan
- 11School of Architecture and Design, Lebanese American University, Beirut, Beirut, Lebanon
Introduction: Amidst escalating global temperatures, increasing climate change, and rapid urbanization, addressing urban heat islands and improving outdoor thermal comfort is paramount for sustainable urban development. Green walls offer a promising strategy by effectively lowering ambient air temperatures in urban environments. While previous studies have explored their impact in various climates, their effectiveness in humid climates remains underexplored.
Methods: This research investigates the cooling effect of a green wall during summer in a humid climate, employing two approaches: Field Measurement-Based Analysis (SC 1: FMA) and Deep Learning Model (SC 2: DLM). In SC 1: FMA, experiments utilized data loggers at varying distances from the green wall to capture real-time conditions. SC 2: DLM utilized a deep learning model to predict the green wall’s performance over time.
Results: Results indicate a significant reduction in air temperature, with a 1.5°C (6%) decrease compared to real-time conditions. Long-term analysis identified specific distances (A, B, C, and D) contributing to temperature reductions ranging from 1.5°C to 2.5°C, highlighting optimal distances for green wall efficacy.
Discussion: This study contributes novel insights by determining effective distances for green wall systems to mitigate ambient temperatures, addressing a critical gap in current literature. The integration of a deep learning model enhances analytical precision and forecasts future outcomes. Despite limitations related to a single case study and limited timeframe, this research offers practical benefits in urban heat island mitigation, enhancing outdoor comfort, and fostering sustainable and climate-resilient urban environments.
1 Introduction
In recent decades, overpopulation and economic growth have significantly accelerated global warming, resulting in numerous serious issues for urban areas and their residents (Buhaug & Urdal, 2013; Chowdhury et al., 2021). The release of greenhouse gases and chemical pollutants into the atmosphere (Hashim et al., 2020) intensifies climate change (Filho et al., 2023; Perera et al., 2020), exacerbates the urban heat island (UHI) effect, and increases heat stress (Chew et al., 2021; Mahdavi Estalkhsari et al., 2023; Mohammad Harmay & Choi, 2022), leading to higher energy demands (Khotbehsara et al., 2018; Mutschler et al., 2021). The construction industry, which addresses essential human needs such as housing, is a significant energy consumer, with building and construction sectors accounting for nearly 40% of total energy usage. This energy is primarily consumed by heating and cooling systems throughout the year (Ghahramani et al., 2018; Rafsanjani et al., 2020)
Various scientific reports have concluded that multiple urban elements, including exterior walls (building envelopes), roofs, terrain, pavement and roads, and building materials, can play an essential role in urban design. This design aims to create thermally pleasant outdoor spaces where these elements can influence the environment by controlling heat transfer (Convertino et al., 2019), solar radiation (Vox et al., 2018), albedo (Salata et al., 2015), and airflow (Perini et al., 2011). Materials have notably different heat capacities, thermal conductivity (thermal bulk properties), and surface radiative attributes such as albedo and emissivity (Mohajerani et al., 2017; Mohammad et al., 2021).
Using dark surfaces and materials, such as asphalt, cement, concrete, composite, and metal, can lead to higher air temperatures and manifest UHI effects (Stempihar et al., 2012; Zhou et al., 2021). The UHI phenomenon emerges as cities replace natural landscapes with dense arrangements of heat-absorbing surfaces, such as pavement, buildings, and others, resulting in elevated air temperatures (Kardinal Jusuf et al., 2007). Moreover, as noted earlier, the escalating impact of global warming exacerbates the frequency of hot days and nights, heightening the risk of heat stress and associated health concerns. While everyone can be negatively affected by heat waves and extreme heat events, some people, like the elderly, those with chronic illnesses, children, and pregnant women, are at risk of suffering harm during such hot spells (McElroy et al., 2020; Folkerts et al., 2022).
There has been extensive research on various aspects of environmental design in different contexts. A broad overlap and cooperation for expected outcomes emerge by carefully studying these strategies. The use of green walls supports processes such as air purification (Abdo and Huynh, 2021), rainwater collection (Prenner et al., 2021), reduction of ambient noise levels (Cardinali et al., 2023), increase in biodiversity (Chen et al., 2020), and enhancement of a building’s fire resistance (Kotzen et al., 2023). Green walls are also highly recommended due to their significant impact on ambient air temperature (Susorova et al., 2013; Olivieri et al., 2014; Afshari, 2017; Shafiee et al., 2020).
For instance, Alexandri and Jones (2008) found that implementing green wall systems decreased outdoor air temperature by 8°C. Additionally, east-west oriented vegetated walls were shown to lower the average daytime temperature by approximately 2°C. Furthermore, Wong et al. (2010) noted that 0.15 m from the plant surface resulted in a temperature reduction of roughly 3°C. In a broader context, Kontoleon and Eumorfopoulou (2010) reported that the cooling potential of a green wall on a north-oriented facade is insignificant and negligible. Additionally, they concluded that the reduction is more significant for west-oriented facades at about 3.50°C, while for east- and south-oriented facades, the temperature drop reaches about 2°C and 1°C, respectively. Chen et al. (2013) concluded that the cooling merits of the VGS are more pronounced on the exterior surface than in the indoor environment, which is relatively weaker. This reduction was recorded at about 1.5°C.
This study has examined the impact of green walls during warm conditions in Rasht, the largest city along Iran’s Caspian Sea. Rasht is classified under Köppen’s subtropical humid climate (Cfa) and is a representative sample of similar Cfa climate zones globally. This unique climate makes Rasht particularly susceptible to the UHI effect compared to other large cities. While studies on green walls have been explored in various research articles over the decades, only a limited number have investigated the thermal performance of green walls (specifically, the reduction of outdoor temperature and mitigation of UHI) in humid conditions across the globe (e.g., Ref (Alexandri and Jones, 2008; Karimi Zarchi and Shahhoseini, 2019)).
In line with that, several research investigations have addressed UHI concerns in the humid climate of Rasht. These studies have elucidated temperature differentials ranging from 5°C to 6.4°C during the cold season and 3°C–5.6°C during the warm season, differentiating between the central part of the city and its surrounding areas (Karimi Zarchi and Shahhoseini, 2019). In research conducted by Bahman and Dokhat Mohammad (2010), UHI in Rasht underwent evaluation by deploying nine environmental sensors for field measurements. The findings indicated 5–6.4°C temperature variances at Sabzeh Meydan Square and Shahrdari stations. The fact that green walls can reduce ambient temperature in humid climates is now evident. However, the extent to which distance matters and how effectively these systems can reduce ambient temperature are still underexplored.
This research seeks to assess the influence of SCP on temperature reduction across distinct cardinal directions. By delving into the intricate dynamics of SCP placement, our study aims to provide in-depth insights into the optimal distances that yield the most effective temperature reduction in a humid climate. We used different analysis techniques, such as field measurements and advanced modeling approaches, to quantify the impact of varying SCP distances on temperature mitigation.
To achieve the research objectives, the research team has established two scenarios for the study’s orientation, including Scenario 1) Field measurement-based analysis (SC 1: FMA), and Scenario 2) Deep Learning Model (SC 2: DLM). As previously described in the literature, this study investigates the impact of SCP in a humid climate, evaluating the thermal performance of SCP and the surrounding conditions when green walls are in use. The present study also offers a novel approach by utilizing a deep learning model to enhance the accuracy of the analysis, utilizing data generated from the experimental scenario.
This study provides new knowledge on the impact of green walls in humid climates, a relatively unexplored area with only a few existing studies. This research is also among the first to assess the cooling performance of green walls at different points from the wall surface in a humid climate, offering a detailed analysis of how proximity to the wall affects temperature reduction. By highlighting the benefits of integrating green wall systems, the study supports the development of more effective and sustainable urban design practices.
2 Material and methods
2.1 Climate attributes of the study area
The city of Rasht is situated in the northern region of Iran and falls under the humid subtropical climate category (Cfa) according to the Köppen climate classification. With an average annual rainfall of 1,359 mm, Rasht holds the top position for rainfall among the provincial centers in Iran, earning it the nickname “the city of rain.” Rasht experiences an average annual temperature of 15.9°C, with the average annual maximum air temperature at 20.6°C and the average annual minimum at 11.3°C. The annual temperature range is reported to be 9.3°C. Figure 1 depicts the geographical location of the study area, while Figure 2 illustrates its climatic attributes.
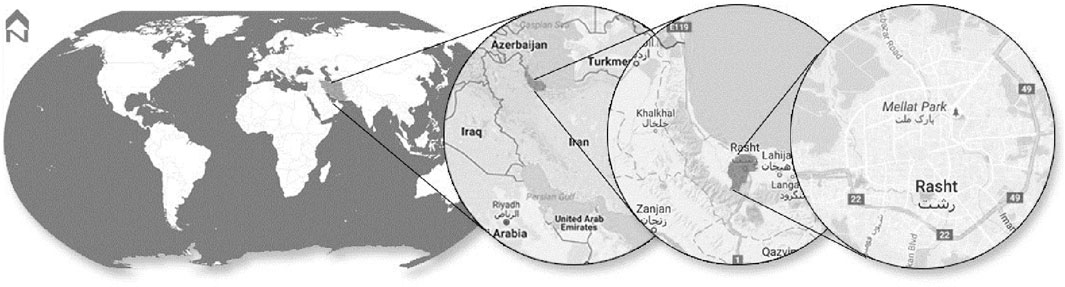
Figure 1. The location of the study area on the map.
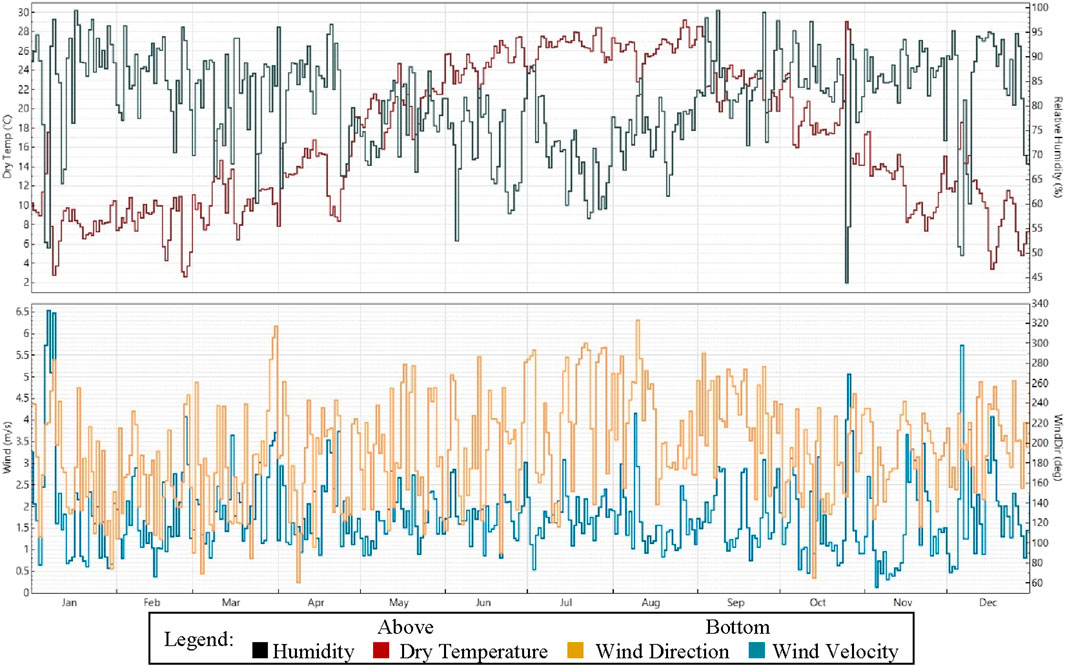
Figure 2. Climatic attributes of Rasht include dry-bulb temperature, wind speed and direction, and relative humidity (Plotted by Dview).
The latitude of Rasht is 37.280,834, and the longitude is 49.583,057 which is located in Iran country in the cities place category with the GPS coordinates of 37° 16′ 51.0024″ N and 49° 34′ 59.0052″ E. According to the Köppen climate classification, Rasht has a humid subtropical climate (Cfa). The city experiences an average annual rainfall of 1,359 mm. The city of Rasht receives an average annual rainfall of 1,359 mm, making it the leading city in rainfall among the provincial capitals of Iran, and earning it the nickname “the city of rain.” The average annual temperature in Rasht is 15.9°C, with the average annual maximum temperature being 20.6°C and the average annual minimum temperature at 11.3°C. This results in an annual temperature range of 9.3°C between the maximum and minimum temperatures. Figure 1 depicts the geographical location of the study area, and Figure 2 illustrates the climatic features.
2.2 Case study selection criteria
Based on the findings reported by Oji et al (2021), the green spaces in Rasht city underwent significant changes between 1964 and 2013. The total green areas decreased from 7,255 hectares to 5,990 hectares, marking a 17% reduction. Dense green spaces saw an even more dramatic decline, shrinking from 2,855 hectares to 788 hectares, which represents a 72% decrease. The majority of these reductions were observed in the central region of Rasht (see Figure 3). On this basis, SC 1: FMA includes the selection of 4 case studies, all of which are situated in the central region of Rasht with the same properties as SCP in a dense urban area. These cases have the same leaf area index (LAI) (see Table 1).
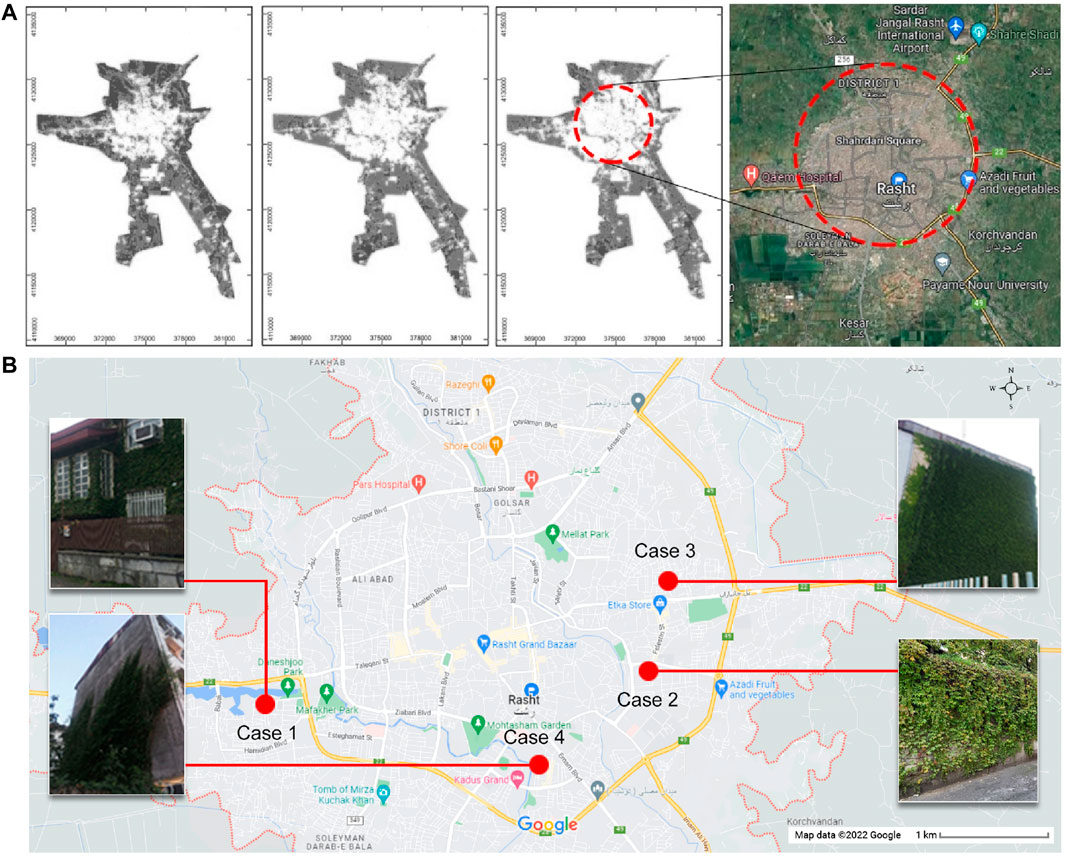
Figure 3. (A) Changing process of green spaces in Rasht (Oji et al., 2021), and (B) the location of the candidate cases on the map.
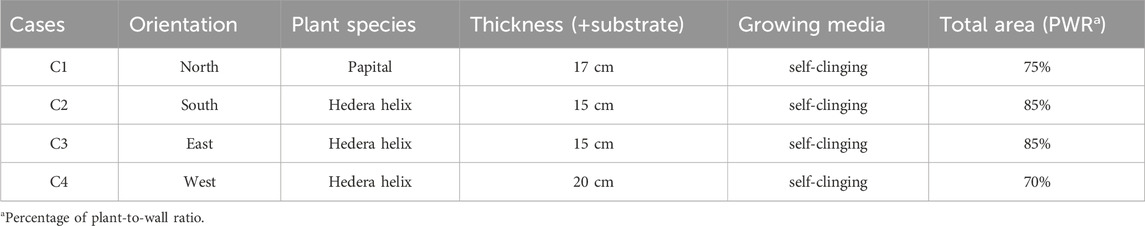
Table 1. This is a table. Tables should be placed in the main text near the first time they are cited.
Moreover, in selecting the samples, extensive care has been taken to ensure consistency in all cases regarding the parameters influencing the UHI effect. These parameters include the number, density, and height of buildings; the window-to-wall ratio; floor height; building function; and pavement characteristics such as material type, albedo, thermal conductivity, thickness, and volumetric heat capacity. Additionally, the level of traffic has been considered to maintain uniformity. SC 1: FMA aims to evaluate whether the SCP orientation effectively reduces UHI. The SCP used in the study features self-clinging plants that attach directly to the wall through adhesive suckers with adventitious roots. These climbers form a self-supporting layer of vegetation on solid surfaces, creating a traditional green wall.
In the process of selecting our case study, we placed significant emphasis on feasibility, ethical considerations, and contextual understanding. Ensuring the feasibility of the study was paramount, considering available resources, time constraints, and logistical factors. Ethical considerations played a crucial role in guiding our choices to guarantee the privacy and confidentiality of individuals involved. To uphold ethical standards, we sought consent from the building owner, engaging in a detailed conversation to obtain approval to experiment. Additionally, contextual understanding was a key criterion, ensuring that the chosen case study provided a rich and comprehensive understanding of the specific environment in which the experiment was conducted. Therefore, we selected C1 among the four candidates as the primary case study to measure the effects of SCP on dropping ambient temperature. We chose this case because of the building’s favorable location for implementing data loggers. The specific situation of the building facilitated this choice. Additionally, we could redo the analysis when the data was not recorded well. The orientation of the SCP is on the North façade.
2.3 Outline of the experimental measurement
To experimentally characterize the effect of SCP on outdoor cooling performance, among four cases across Rasht city, the research team chose a potential SCP Case 1 as a case study for field measurements. The essential reason is that the selected Case 1 is situated in an urban area close to the pedestrian level where everyone walks through the street. Secondly, the green wall is situated on a sufficiently broad street, which prevents shadows from opposite buildings from falling on its surface, thereby eliminating shadowing as a potential confounding variable. Additionally, this case study features an adequate density of plant cover. The green wall is composed of self-clinging plants that attach directly to the wall through their adhesive sucker’s adventitious roots, without requiring external support (Steinbrecher et al., 2010). These climbers could form a self-supporting vegetation (traditional) layer on a solid surface.
The Solar Chimney Power (SCP) system was positioned facing north, aligning the canyon’s axis parallel to the east-west direction. Outdoor temperature measurements were recorded at 15-minute intervals. The SCP was covered with Hedera helix, a commonly used ivy species. Data loggers, placed 1.5 meters above ground near the wall, were used to collect real-time outdoor temperature data (Griffith and McKee, 2000). This height and location were selected to capture temperature readings that accurately represent the immediate vicinity ambient conditions. People can distinctly feel temperature differences at a height of approximately 1.5 m above the ground, which coincides with pedestrian dynamics. This height is significant for environmental monitoring as it captures conditions that are directly perceived and experienced by individuals in outdoor settings. The dataloggers were placed in front of the SCP. Table 1 indicates the data loggers’ technical data. The data loggers are secured on customized stands and placed at 0.15 m, 0.30 m, 0.60 m, and 0.90 m away from the substrate surface (see Figure 3). Table 2 provides the details of experimental devices.
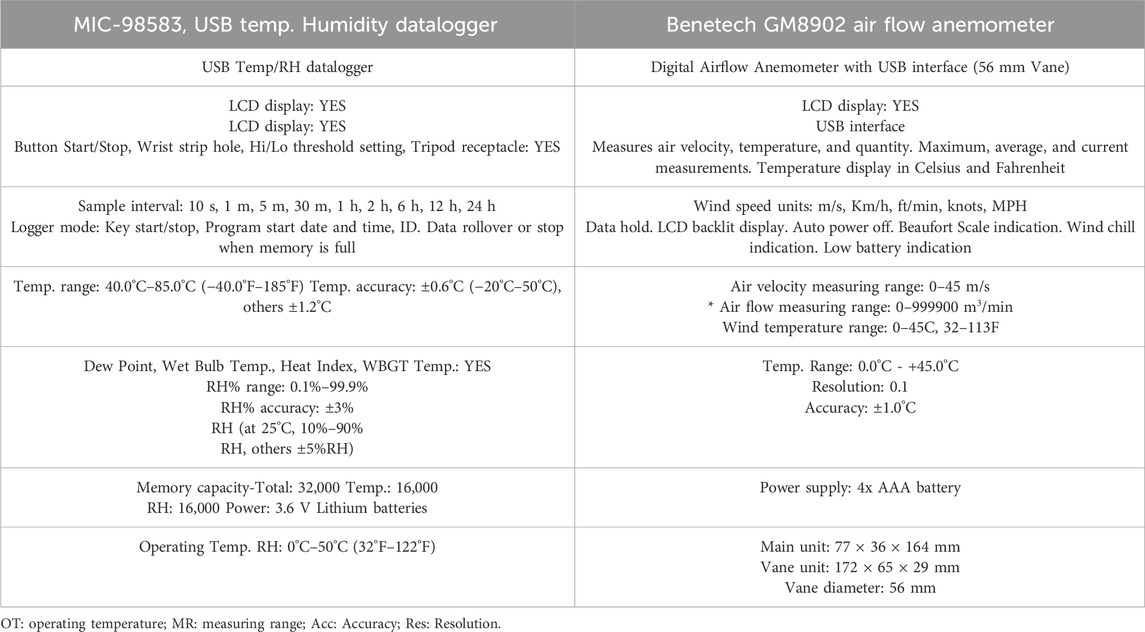
Table 2. The outline of the measurement devices (Daemei et al., 2021).
The data loggers collected temperature data at 15-min intervals throughout the study period. Environmental parameters consist of real-time outdoor air temperatures, measured for 5 days from 1 August 2020, to 6 August 2020, in front of the green wall surface. Before any record, the temperature near the wall was measured by two devices to ensure that the devices were calibrated. The experimental analysis was carried out during summertime to assess the cooling effects of the SCP in reducing the ambient temperature. Afterward, the developed dataset was generated to predict the SCP’s cooling effect for the near future. Besides, the generated dataset was validated against experimental results to ensure that the new dataset was accurate.
When studying the impact of plants on outdoor air temperature, several factors come into play. While the direct equations can be complex and depend on various environmental variables, we provided the concepts and equations for our study. Evapotranspiration is the combined process of water evaporation from soil and plant surfaces and transpiration from plant leaves. It can be a significant cooling factor in green walls. The Penman-Monteith equation is often used to calculate evapotranspiration:
Where:
E = Evapotranspiration (mm/day)
Δ = Slope vapor pressure curve (kPa/°C)
G = Soil heat flux density (MJ/m2/day)
T = Air temperature (°C)
u = Wind speed at 2 m above the surface (m/s)
The effectiveness of green walls in cooling outdoor air temperature can also be related to heat transfer equations. The heat transfer equation can be applied to calculate the cooling effect based on the rate of heat exchange and the surface area covered by green walls.
Where:
Q = Heat transfer rate (W)
ℎ = Heat transfer coefficient (W/(m2°C))
A = Surface area covered by green walls (m2)
2.4 Employing deep learning for data augmentation
The research team encountered limitations in obtaining field measurements in this work due to various practical constraints. These limitations include limited data availability, difficulties in data collection, and insufficient data coverage. By employing machine learning techniques, specifically ANNs, we could generate synthetic data that complement the available measurements. This allowed us to overcome the data scarcity and perform more comprehensive analyses. Machine learning techniques, such as ANNs, have demonstrated remarkable capabilities in modeling complex patterns and relationships within data (Graupe, 2013). By training ANNs on the available field measurements, we were able to develop a model that captured the intricate dynamics between the distance for temperature reduction by SCP and the humid climate. Data augmentation using ANNs is a strategy to enhance the performance of models, especially when faced with limited datasets (Gibson et al., 2022).
The trained ANN could then be used to make predictions and estimate the temperature reduction at various distances, providing valuable insights into the system’s behavior. By incorporating machine learning techniques into the study, we have introduced a novel approach to addressing data limitations in temperature reduction by SCP under a humid climate. In the following, six columns of data collected over 5 days, starting from 1 August 2020, at 00:00:00 and ending on 5 August 2020, at 23:45:00 with a 15-min resolution used to train the deep learning model, including a timestamp, the real air temperature, and air temperatures recorded at distances of 0.15 m, 0.30 m, 0.60 m, and 0.90 m away from the SCP. 80% of the data collected over 5 days (every 15 min): real air temp. - air temp at 0.15 m - air temp at 0.30 m - air temp at 0.60 m - air temp at 0.90 m.
The real-time air temperature (ambient) and air temperature (in front of the four points) datasets were recorded at distances of 0.15 m, 0.30 m, 0.60 m, and 0.90 m from the green wall. Eighty percent of this dataset constituted the training group for the ANN, aimed at discerning patterns and relationships to accurately forecast temperatures across different SCP distances. The remaining 20% of the dataset formed the prediction group, evaluating the model’s ability to generalize to new, unseen data points. The ANN model architecture included two input layers for timestamps and air temperature and four output layers for predicting temperatures at specified distances from the SCP. The Mean Squared Error (MSE) function was employed as the model’s loss function to optimize predictions. The structure of the dataset is shown in Table 3.
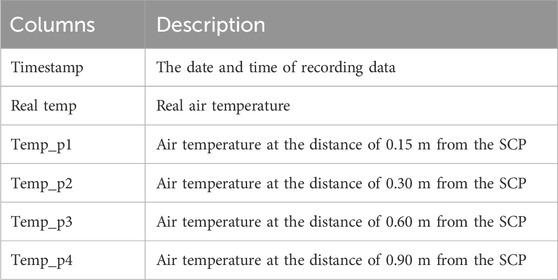
Table 3. Timestamp.
This paper presents the use of a Multilayer Perceptron (MLP) Artificial Neural Network (ANN) as the Deep Learning model. MLP ANN consists of a network of interconnected simple processors, called artificial neurons, that produce real-valued activations to perform a specific task. The learning process of the ANN involves adjusting the weights to achieve the desired behavior, which may be a sequence of computational stages depending on the problem being addressed. The activations are transformed non-linearly at each step, allowing the network to accurately assign credit across multiple stages, a critical property in deep learning. The MLP ANN used in this research has four hidden layers. The architecture of our MLP ANN model is illustrated in Figure 4. The input layer with two neurons is fed with the timestamp and real air temperature, the hidden layers try to find the relationship between input data and the desired outputs, and the output layer consists of four neurons that represent the air temperature at four different distances from the green wall, form the neural network.
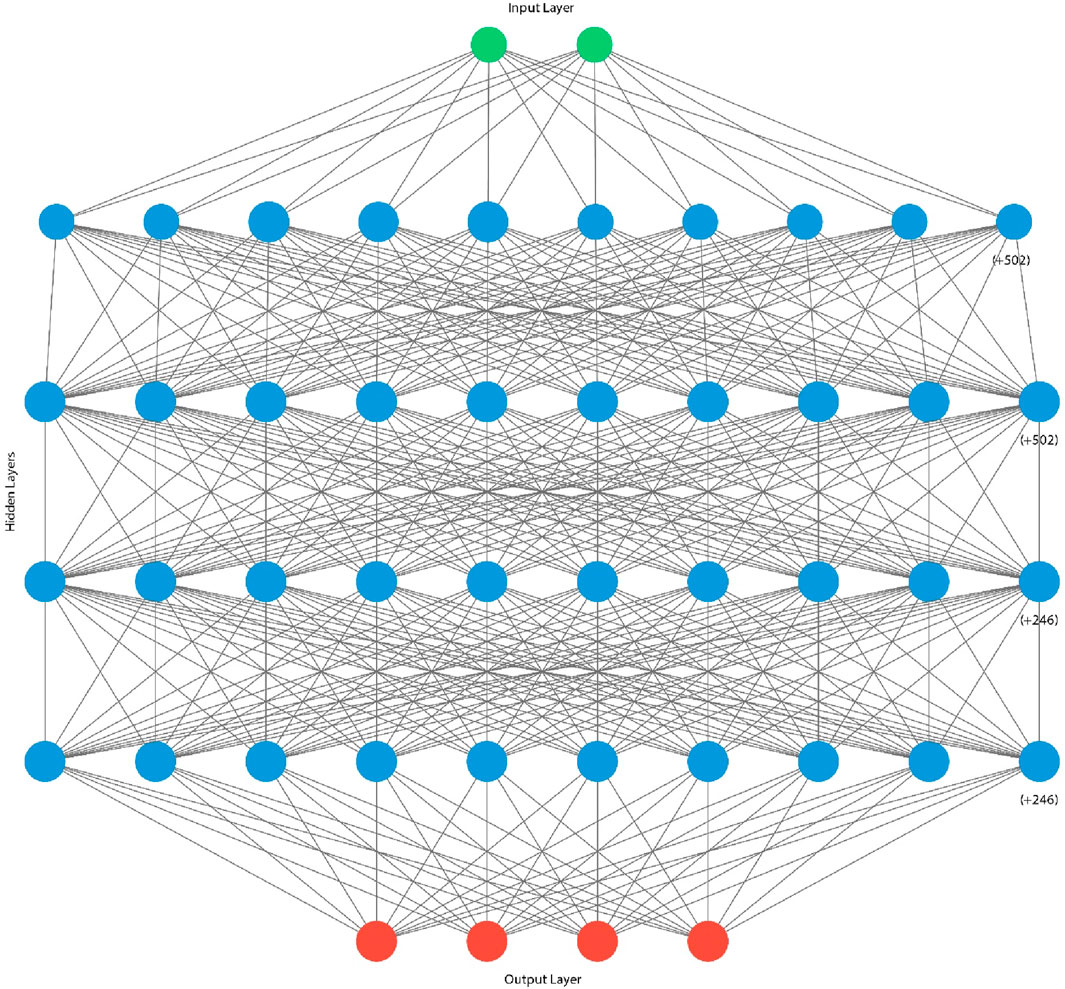
Figure 4. The Deep Learning MLP architecture graph.
The optimizer used in our Artificial Neural Network (ANN) is the Adam algorithm, a Stochastic Optimization technique (Kingma and Adam, 2014). The model’s performance was evaluated by calculating the Mean Squared Error (MSE) as the loss function, described by equation 9.
In this context, the number of samples is represented by “n,” the true value by “Y_i,” and the predicted value by “Ŷ_i .” We divided our dataset into two sets using random data point selection to train and evaluate the model. The authors considered 80% to train our model and used the remaining 20% to test its performance. For this purpose, we used two well-known metrics for regression models’ evaluation, MSE and Mean Absolute Error (MAE), as shown in Table 4.

Table 4. The deep learning model’s accuracy.
3 Results and discussion
3.1 SC 1: FMA
Based on the primary aim of this study, the research implemented four data loggers at four points near the SCP. The collected real-time indoor temperature and humidity data for the green wall were compared to those for a bare wall. The plotted data illustrate the indoor temperature and relative humidity variations, highlighting the differences between the green wall and the bare wall (Figure 5). In fact, building blocks surrounding the SCP, airspeed was reported to negligible by the anemometer (0 m/s). Figure 6 shows the outputs of the data. At this phase of the evaluation, the dependent variable and independent variable are the temperature variation and SCP, respectively. As aforementioned, the specific points (point A: 0.15 m, point B: 0.30 m, point C: 0.60 m, and point D: 0.90 m away from the substrate surface) were specified, and the temperatures were recorded through the data loggers.
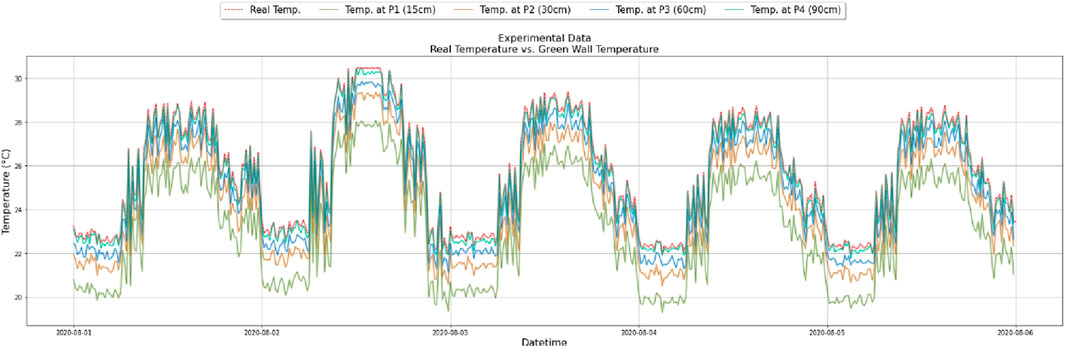
Figure 5. Experimental data: Real temperature versus SCP temperature.
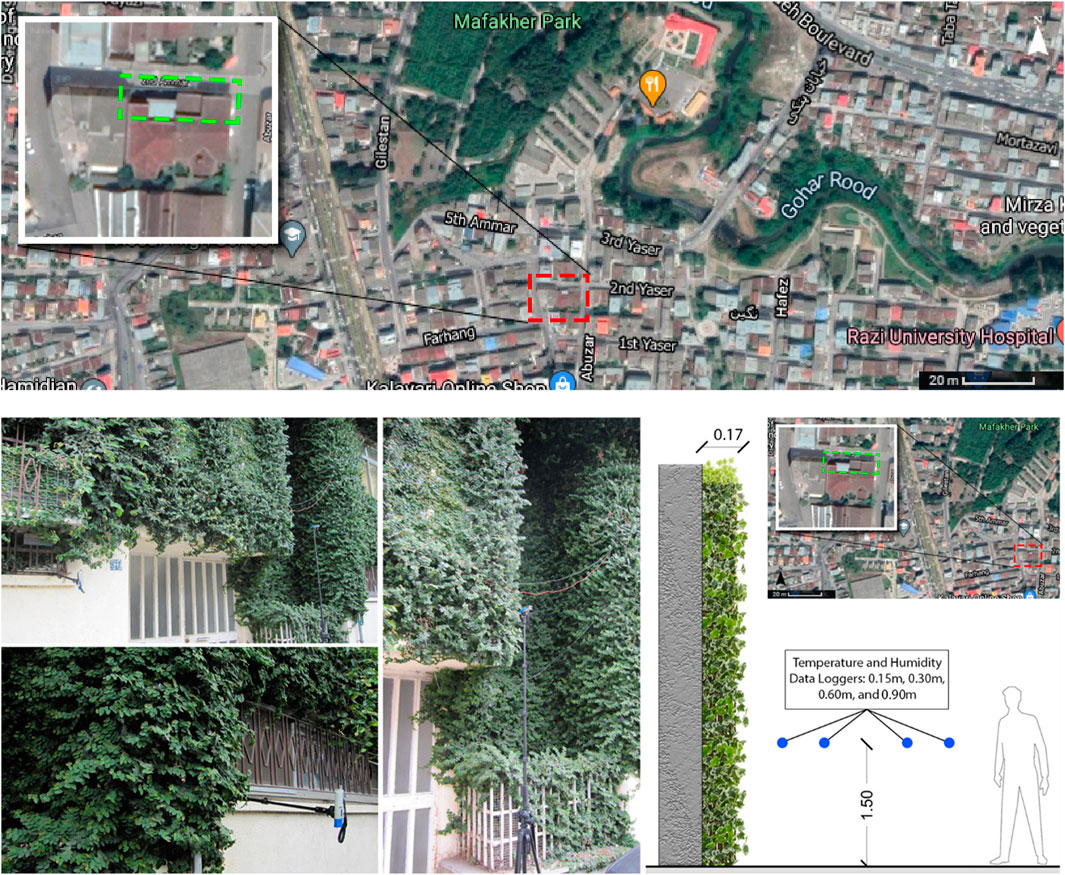
Figure 6. Layout of the study area and positions of data loggers for measuring ambient air temperature.
Figure 5 indicates the real-time and SCP temperatures gained during the field measurement in the summer season. Based on the data, the temperature record differs for all four points, so there is a significant temperature reduction and differences between 0.15 m and 0.90 m. To better understand the temperature reduction, Figure 7 provides the performance of each point. Temperature fluctuations are observed in the same range for each day. On the other hand, on the second day, the amplitude of thermal fluctuations increased for all four points, which could occur due to the increase in the real-time temperature.
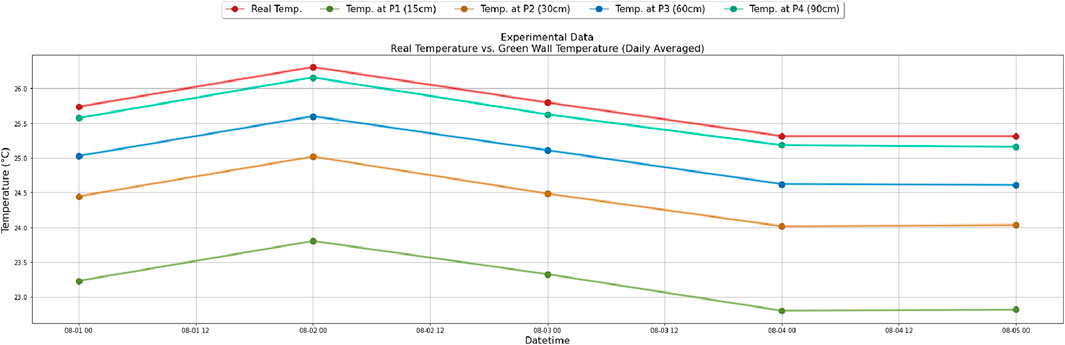
Figure 7. Experimental data: Real temperature versus SCP temperature (daily average).
According to Figure 7, the ambient temperature may be affected by air circulation. Though SCP is covered by well-distributed greenery, it has thicker greenery near the temperature data logger, which may block air circulation and trap heat. Hence, it can be inferred that at point A, 0.15 m away from the substrate (plant), the air temperature is most affected by the presence of the SCP. The higher and lower temperature data for the real-time are recorded at 26.5°C and 25.6°C. The lowest and highest temperature range of the recorded points are shown in Table 5.

Table 5. Summary of air temperature for each point.
3.2 SC 2: DLM
The trained model is used to estimate air temperature at the distances from the SCP (points A to D), which is what our model is trained for. The result is based on real air temperature from 2020 to 08-06 to 2020-08-10, depicted in Figure 8.
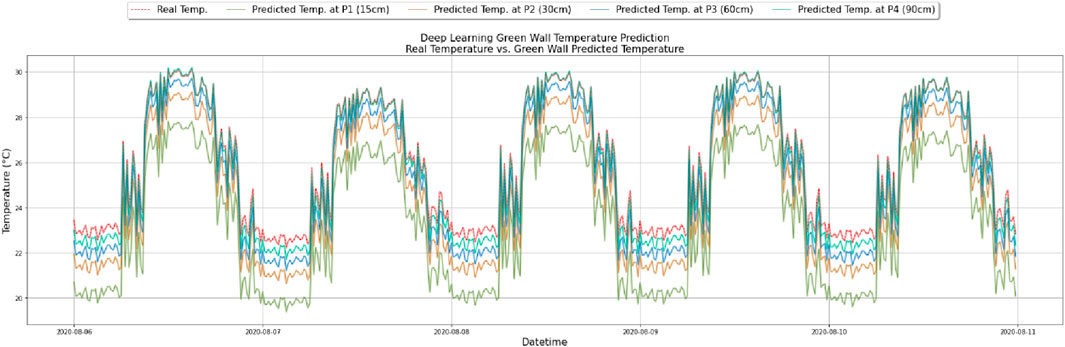
Figure 8. Deep Learning results based on real air temperature.
Figure 8 shows the data generated by deep learning, which demonstrates normal and uniform fluctuations every day for every point at the highest temperature and lowest temperature, including information about the real-time air temperature and the recorded temperature of each point over the first 5 days, which indicates the performance of the SCP cooling effect in the next few days. Also, the data obtained from the field measurement for real-time and the specific points and the data generated by the deep learning for predicting real-time conditions are compared with the base model data (Figure 9).
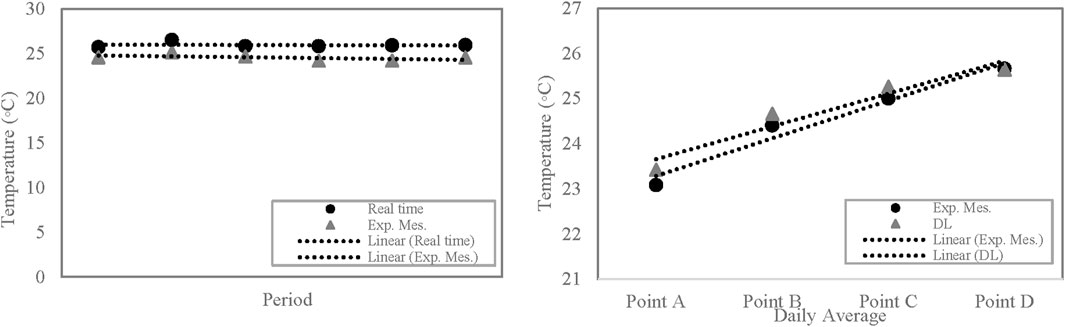
Figure 9. Validation: (Left) Real-time experiment measurements were compared with the recorded data for each point (daily average); (Right) experiment measurement records were compared with the deep learning generated data (daily average). Dl: deep learning; Exp. Mes.: Experiential measurement.
By considering the deep learning data and observing the overall cooling performance of the SCP, it can be said that the SCP was able to drop the air temperature in a suitable amount compared with real-time. The average reduction was recorded by about 24.6°C. The real-time average air temperature was about 26°C, which proves that the amount of temperature reduction in the data obtained from the experiments is equal to the amount of the overall data generated by the deep learning (about 1.5°C), indicates the validation of the research process (Figure 10).
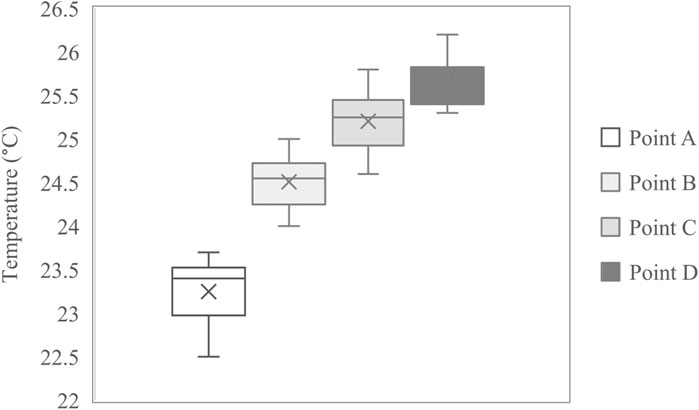
Figure 10. The SCP air temperature long-term reduction from 08/01/2020 to 08/11/2020 (Daily average).
4 Discussion
The current study, which was carried out on an urban scale, investigated the cooling impact of the SCP in a humid climate during the summer season. The performance of the SCP was measured at four points located at varying distances from the plant’s surface. The measurements were conducted in two stages. In the first stage, experimental measurements were performed using temperature data loggers for both specific distances and real-time conditions over 5 days. Subsequently, the research team employed a deep learning model to predict the SCP’s future performance and augment data through the ANN model. While the dataset may appear limited in this work, the deep learning model’s ability to generalize from this data to broader conditions was an essential aspect of our approach.
Deep learning is a subset of machine learning that involves the use of neural networks with many layers to analyze various kinds of data (Ahmed et al., 2023). Deep learning applications are quickly replacing traditional systems in numerous facets of our everyday lives (LeCun et al., 2015). Traditionally, research has relied on costly and time-consuming trial and error, guided by expert intuition. The vast number of material combinations makes experimental study impractical, necessitating empirical and computational methods. Although computational approaches are faster, cheaper, and somehow more accurate. They are constrained by length and time scales, limiting their applicability (Goodfellow et al., 2016; Choudhary et al., 2022). ANN is a computational model inspired by the human brain’s neural structure and functioning. ANN learns from labeled datasets to perform tasks such as classification, regression, pattern recognition, and more (Hardesty, 2017; Pantic et al., 2023).
During the data collection phase of our experimental model, we encountered several measurement errors primarily due to unpredictable weather conditions. These included cloudy periods and unexpected wind, which affected the accuracy and consistency of our temperature readings. Such variations in weather conditions introduced anomalies in the data, making it challenging to maintain uniformity across all measurements. These factors highlight the inherent difficulties in field experiments, where environmental conditions can vary unpredictably and impact the data collection process. Therefore, we excluded the last day of data collection due to these unpredictable weather conditions to maintain the integrity and accuracy of our measurements.
Relying on the 5-day field measurements, the average air temperature reductions for points A, B, C, and D were 23.08°C, 24.4°C, 25°C, and 25.66°C, respectively. The highest and lowest ambient air temperatures were 26.7°C and 25.4°C, respectively. At this stage, considering the performance of each point, the results indicated that each distance had a significant temperature reduction effect compared to real-time data. The findings of the first stage demonstrated that the SCP had a considerable impact on reducing nearby temperatures. The maximum average reduction across the four points was 25°C, compared to the real-time temperature of 26.5°C. This implies that the SCP’s best performance in lowering air temperature was approximately 6% against real-time conditions, resulting in a drop of ambient air temperature by 1.5°C.
The air temperature reductions from 1 August 2020, to 11 August 2020, for points A, B, C, and D were approximately 23.2°C, 24.5°C, 25.2°C, and 25.6°C, respectively. The long-term real-time daily average air temperature was 26°C. Therefore, the points could reduce the ambient air temperature by about 11% for point A, 6% for point B, 3% for point C, and 1.5% for point D. Point A exhibited better performance than point D by about 9%. For further validation of the present study, some research studies have been conducted under the same climate condition (Cfa), providing people with outdoor thermal comfort (OTC). Spagnolo and de Dear (2003) investigated that the preferred temperature for the Cfa climate zone of Sydney during summertime is 23.4°C, and for the entire year is 25°C. Similarly, Binarti et al. (2020) concluded that the suitable OTC is 23.9°C based on the PET neutral range. Consequently, the appropriate temperature ranges during summertime are between 23°C and 24°C, suggesting that the distances of 0.15 m and 0.30 m could reduce the air temperature to within the outdoor thermal comfort range.
While confirming the outcomes of previous literature regarding the mitigating effect of trees, shrubs, and green walls on the creation of UHI (Abdulateef & A. S. Al-Alwan, 2022; Chun and Guldmann, 2018; Edmondson et al., 2016; Koch et al., 2020), our study takes a step forward and argues for the most effective distance for these systems to reduce ambient temperatures. This finding represents a novel contribution to our research within the existing body of literature. Moreover, our paper presents an innovative methodology employing a deep learning model to improve the precision of our analysis. This strategy involves utilizing data derived from experimental scenarios, facilitating the anticipation of precise future results. Integrating machine learning methodologies into our investigation also provides an original avenue for mitigating data constraints within the realm of temperature reduction through SCP in a humid climate.
Numerous analyses and experiments remain pending for the future, primarily due to the absence of stringent policies for buildings, particularly their envelopes and facades. This gap hinders effective measures against urban heat islands and climate change mitigation at the regional level. According to the literature, the current materials are unsustainable, posing environmental and human wellbeing challenges. Future investigations could explore various ideas, including experiments on the thermal performance of SCPs in both winter and summer conditions. Moreover, considering different plant types is essential when evaluating the reduction in ambient air temperature.
In this study, we investigate the impact of green walls in the reduction of ambient air temperature. However, previous studies have shown the influence of green walls on indoor ambient temperature and human comfort. An instance is the study done by Widiastuti et al. (2020), which demonstrated that the green wall could significantly reduce wall temperatures and maintain indoor temperature. Daemei et al. (2021) investigated the thermal performance of green walls on indoor thermal comfort. Their study showed that green walls can decrease indoor temperature and humidity. Zhang et al. (2019) conducted a study focusing on the thermal performance of green walls compared to bare walls on the northern facade of a two-story residential building in the humid climate of Rasht during the summer. The results demonstrated that the green wall significantly reduced both indoor temperature and relative humidity. Specifically, the green wall reduced indoor temperature by 9% and relative humidity by 32%.
Lastly, the study faced certain limitations. Firstly, due to building and plant constraints and COVID-19 restrictions, real-time data collection for the entire summer was not possible. Secondly, the research focused on only one orientation (North) of the building where the green wall was attached. These limitations indicate areas for further research and consideration. In conclusion, while this research demonstrates the self-cooling plants’ significant potential in lowering ambient temperatures and enhancing urban comfort, these findings should be understood within the context of these limitations. Moving forward, addressing these constraints, and conducting more comprehensive studies will be essential in refining our understanding of innovative solutions like self-cooling plants and their applicability in creating sustainable, comfortable, and resilient urban environments. For future studies, we recommend expanding upon the findings of this research in several key areas. Firstly, additional field measurements across diverse urban environments are needed to validate the findings regarding the cooling performance of green walls. Secondly, it is important to investigate the impact of different orientations of green walls on their cooling effectiveness. Also, we recommend future studies focusing on the impact of such systems on indoor thermal comfort.
5 Conclusion
This study aims to measure green walls’ cooling effects in a humid summertime climate. To do this measurement, this research chose two scenarios, such as experimental measurement, to collect real-time data of temperature and humidity in four different points in front of the green wall, including 0.15, 0.30, 0.60, and 0.90 m. Secondly, an Artificial Neural Network (ANN) model was utilized for data augmentation to expand the dataset. The type of the plant was self-cooling plants. This research focused on the cooling performance of green walls in the north orientation of the building. The findings show a relatively significant reduction in ambient air temperatures at various distances from the plant surface. The results indicate that the green wall effectively lowers air temperature, achieving a 1.5°C (6%) reduction compared to real-time conditions. Over a long-term investigation, specific distances (A, B, C, and D) were found to contribute to temperature decreases of approximately 23.2°C (11%), 24.5°C (6%), 25.2°C (3%), and 25.6°C (1.5%), respectively.
Data availability statement
The original contributions presented in the study are included in the article/Supplementary Material, further inquiries can be directed to the corresponding author.
Author contributions
ABD: Investigation, Methodology, Supervision, Writing–original draft, Writing–review and editing, Conceptualization. TB: Supervision, Writing–review and editing. AP: Supervision, Writing–review and editing. AR: Resources, Visualization, Writing–original draft. AD: Data curation, Formal Analysis, Writing–original draft. AJ: Resources, Validation, Visualization, Writing–original draft. SA: Resources, Visualization, Writing–original draft. RA: Supervision, Writing–review and editing. MK: Data curation, Resources, Visualization, Writing–original draft. AS: Supervision, Writing–review and editing.
Funding
The author(s) declare that no financial support was received for the research, authorship, and/or publication of this article.
Conflict of interest
The authors declare that the research was conducted in the absence of any commercial or financial relationships that could be construed as a potential conflict of interest.
The author(s) declared that they were an editorial board member of Frontiers, at the time of submission. This had no impact on the peer review process and the final decision.
Publisher’s note
All claims expressed in this article are solely those of the authors and do not necessarily represent those of their affiliated organizations, or those of the publisher, the editors and the reviewers. Any product that may be evaluated in this article, or claim that may be made by its manufacturer, is not guaranteed or endorsed by the publisher.
References
Abdo, P., and Huynh, B. P. (2021). An experimental investigation of green wall bio-filter towards air temperature and humidity variation. J. Build. Eng. 39, 102244. doi:10.1016/j.jobe.2021.102244
Abdulateef, M. F., and A. S. Al-Alwan, H. (2022). The effectiveness of urban green infrastructure in reducing surface urban heat island. Ain Shams Eng. J. 13 (1), 101526. doi:10.1016/j.asej.2021.06.012
Afshari, A. (2017). A new model of urban cooling demand and heat island—application to vertical greenery systems (VGS). Energy Build. 157, 204–217. doi:10.1016/j.enbuild.2017.01.008
Ahmed, S. F., Alam, M. S. B., Hassan, M., Rozbu, M. R., Ishtiak, T., Rafa, N., et al. (2023). Deep learning modelling techniques: current progress, applications, advantages, and challenges. Artif. Intell. Rev. 56 (11), 13521–13617. doi:10.1007/s10462-023-10466-8
Alexandri, E., and Jones, P. (2008). Temperature decreases in an urban canyon due to green walls and green roofs in diverse climates. Build. Environ. 43 (4), 480–493. doi:10.1016/j.buildenv.2006.10.055
Bahman, R., and Dokhat Mohammad, M. (2010). The recognition of urban heat island in Rasht city. Geogr. J. Chashmandaz-e-Zagros 2 (4), 83–97.
Binarti, F., Koerniawan, M. D., Triyadi, S., Utami, S. S., and Matzarakis, A. (2020). A review of outdoor thermal comfort indices and neutral ranges for hot-humid regions. Urban Clim. 31, 100531. doi:10.1016/j.uclim.2019.100531
Buhaug, H., and Urdal, H. (2013). An urbanization bomb? Population growth and social disorder in cities. Glob. Environ. change 23 (1), 1–10. doi:10.1016/j.gloenvcha.2012.10.016
Cardinali, M., Balderrama, A., Arztmann, D., and Pottgiesser, U. (2023). Green walls and health: an umbrella review. Nature-Based Solutions 3, 100070. doi:10.1016/j.nbsj.2023.100070
Chen, C., Mao, L., Qiu, Y., Cui, J., and Wang, Y. (2020). Walls offer potential to improve urban biodiversity. Sci. Rep. 10 (1), 9905. doi:10.1038/s41598-020-66527-3
Chen, Q., Li, B., and Liu, X. (2013). An experimental evaluation of the living wall system in hot and humid climate. Energy Build. 61, 298–307. doi:10.1016/j.enbuild.2013.02.030
Chew, L. W., Liu, X., Li, X.-X., and Norford, L. K. (2021). Interaction between heat wave and urban heat island: a case study in a tropical coastal city, Singapore. Atmos. Res. 247, 105134. doi:10.1016/j.atmosres.2020.105134
Choudhary, K., DeCost, B., Chen, C., Jain, A., Tavazza, F., Cohn, R., et al. (2022). Recent advances and applications of deep learning methods in materials science. npj Comput. Mater. 8 (1), 59. doi:10.1038/s41524-022-00734-6
Chowdhury, M. A. W., Müller, J., and Varela, S. (2021). Climate change and the increase of human population will threaten conservation of Asian cobras. Sci. Rep. 11 (1), 18113. doi:10.1038/s41598-021-97553-4
Chun, B., and Guldmann, J.-M. (2018). Impact of greening on the urban heat island: seasonal variations and mitigation strategies. Comput. Environ. Urban Syst. 71, 165–176. doi:10.1016/j.compenvurbsys.2018.05.006
Convertino, F., Vox, G., and Schettini, E. (2019). Convective heat transfer in green façade system. Biosyst. Eng. 188, 67–81. doi:10.1016/j.biosystemseng.2019.10.006
Daemei, A. B., Shafiee, E., Chitgar, A. A., and Asadi, S. (2021). Investigating the thermal performance of green wall: experimental analysis, deep learning model, and simulation studies in a humid climate. Build. Environ. 205, 108201. doi:10.1016/j.buildenv.2021.108201
Edmondson, J. L., Stott, I., Davies, Z. G., Gaston, K. J., and Leake, J. R. (2016). Soil surface temperatures reveal moderation of the urban heat island effect by trees and shrubs. Sci. Rep. 6 (1), 33708. doi:10.1038/srep33708
Filho, W. L., Wall, T., Salvia, A. L., Dinis, M. A. P., and Mifsud, M. (2023). The central role of climate action in achieving the United Nations’ Sustainable Development Goals. Sci. Rep. 13 (1), 20582. doi:10.1038/s41598-023-47746-w
Folkerts, M. A., Bröde, P., Botzen, W. J. W., Martinius, M. L., Gerrett, N., Harmsen, C. N., et al. (2022). Sex differences in temperature-related all-cause mortality in The Netherlands. Int. Arch. Occup. Environ. Health 95 (1), 249–258. doi:10.1007/s00420-021-01721-y
Ghahramani, A., Castro, G., Karvigh, S. A., and Becerik-Gerber, B. (2018). Towards unsupervised learning of thermal comfort using infrared thermography. Appl. Energy 211, 41–49. doi:10.1016/j.apenergy.2017.11.021
Gibson, J., Hire, A., and Hennig, R. G. (2022). Data-augmentation for graph neural network learning of the relaxed energies of unrelaxed structures. npj Comput. Mater. 8 (1), 211. doi:10.1038/s41524-022-00891-8
Griffith, B. D., and McKee, T. B. (2000). Rooftop and ground standard temperatures: a comparison of physical differences Colorado. Fort Collins, CO: Colorado State University.
Hardesty, L. (2017). Explained: neural networks. MIT. Available at: https://news.mit.edu/2017/explained-neural-networks-deep-learning-0414 (Accessed 29 June).
Hashim, B. M., Sultan, M. A., Al Maliki, A., and Al-Ansari, N. (2020). Estimation of greenhouse gases emitted from energy industry (oil refining and electricity generation) in Iraq using IPCC methodology. Atmosphere 11 (6), 662. doi:10.3390/atmos11060662
Kardinal Jusuf, S., Wong, N. H., Hagen, E., Anggoro, R., and Hong, Y. (2007). The influence of land use on the urban heat island in Singapore. Habitat Int. 31 (2), 232–242. doi:10.1016/j.habitatint.2007.02.006
Karimi Zarchi, A., and Shahhoseini, R. (2019). Measuring the intensity of the surface urban heat islands using vegetation and urban indices(case study: the cities of Rasht and langroud). Scientific- Res. Q. Geogr. Data (SEPEHR) 28 (110), 91–106. doi:10.22131/sepehr.2019.36614
Khotbehsara, E. M., Purshaban, F., Nasab, S. N., Daemei, A. B., Yakhdani, P. E., and Vali, R. (2018). Traditional climate responsible solutions in Iranian ancient architecture in humid region. Civ. Eng. J. 4, 2502. doi:10.28991/cej-03091176
Koch, K., Ysebaert, T., Denys, S., and Samson, R. (2020). Urban heat stress mitigation potential of green walls: a review. Urban For. Urban Green. 55, 126843. doi:10.1016/j.ufug.2020.126843
Kontoleon, K. J., and Eumorfopoulou, E. A. (2010). The effect of the orientation and proportion of a plant-covered wall layer on the thermal performance of a building zone. Build. Environ. 45 (5), 1287–1303. doi:10.1016/j.buildenv.2009.11.013
Kotzen, B., Galea, E. R., Mosco, S., Wang, Z., Ewer, J., and Jia, F. (2023). Fire safety risks of external living walls and implications for regulatory guidance in England. Fire Saf. J. 139, 103816. doi:10.1016/j.firesaf.2023.103816
LeCun, Y., Bengio, Y., and Hinton, G. (2015). Deep learning. Nature 521 (7553), 436–444. doi:10.1038/nature14539
Mahdavi Estalkhsari, B., Mohammad, P., and Razavi, N. (2023). Change detection in a rural landscape: a case study of processes and main driving factors along with its response to thermal environment in Farim, Iran. Environ. Sci. Pollut. Res. 30 (49), 107041–107057. doi:10.1007/s11356-022-24504-5
McElroy, S., Schwarz, L., Green, H., Corcos, I., Guirguis, K., Gershunov, A., et al. (2020). Defining heat waves and extreme heat events using sub-regional meteorological data to maximize benefits of early warning systems to population health. Sci. Total Environ. 721, 137678. doi:10.1016/j.scitotenv.2020.137678
Mohajerani, A., Bakaric, J., and Jeffrey-Bailey, T. (2017). The urban heat island effect, its causes, and mitigation, with reference to the thermal properties of asphalt concrete. J. Environ. Manag. 197, 522–538. doi:10.1016/j.jenvman.2017.03.095
Mohammad, P., Aghlmand, S., Fadaei, A., Gachkar, S., Gachkar, D., and Karimi, A. (2021). Evaluating the role of the albedo of material and vegetation scenarios along the urban street canyon for improving pedestrian thermal comfort outdoors. Urban Clim. 40, 100993. doi:10.1016/j.uclim.2021.100993
Mohammad Harmay, N. S., and Choi, M. (2022). Effects of heat waves on urban warming across different urban morphologies and climate zones. Build. Environ. 209, 108677. doi:10.1016/j.buildenv.2021.108677
Mutschler, R., Rüdisüli, M., Heer, P., and Eggimann, S. (2021). Benchmarking cooling and heating energy demands considering climate change, population growth and cooling device uptake. Appl. Energy 288, 116636. doi:10.1016/j.apenergy.2021.116636
Oji, R., Aghaeizadeh, E., and Mirabimoghadam, M. (2021). Analysis of the effect of urban green spaces reduction on surface temperature and relative humidity changes (case study of Rasht city). J. Stud. Hum. Settlements Plan. 15 (4), 1103–1118. Available at: https://jshsp.rasht.iau.ir/article_673522_a2d37a394d71af73a0b97d4b1386273b.pdf.
Olivieri, F., Olivieri, L., and Neila, J. (2014). Experimental study of the thermal-energy performance of an insulated vegetal façade under summer conditions in a continental mediterranean climate. Build. Environ. 77, 61–76. doi:10.1016/j.buildenv.2014.03.019
Pantic, I., Paunovic, J., Cumic, J., Valjarevic, S., Petroianu, G. A., and Corridon, P. R. (2023). Artificial neural networks in contemporary toxicology research. Chemico-Biological Interact. 369, 110269. doi:10.1016/j.cbi.2022.110269
Perera, A. T. D., Nik, V. M., Chen, D., Scartezzini, J.-L., and Hong, T. (2020). Quantifying the impacts of climate change and extreme climate events on energy systems. Nat. Energy 5 (2), 150–159. doi:10.1038/s41560-020-0558-0
Perini, K., Ottelé, M., Fraaij, A. L. A., Haas, E. M., and Raiteri, R. (2011). Vertical greening systems and the effect on air flow and temperature on the building envelope. Build. Environ. 46 (11), 2287–2294. doi:10.1016/j.buildenv.2011.05.009
Prenner, F., Pucher, B., Zluwa, I., Pitha, U., and Langergraber, G. (2021). Rainwater use for vertical greenery systems: development of a conceptual model for a better understanding of processes and influencing factors. Water 13 (13), 1860. doi:10.3390/w13131860
Rafsanjani, H. N., Moayedi, S., Ahn, C. R., and Alahmad, M. (2020). A load-disaggregation framework to sense personalized energy-use information in commercial buildings. Energy Build. 207, 109633. doi:10.1016/j.enbuild.2019.109633
Salata, F., Golasi, I., Vollaro, A. d. L., and Vollaro, R. d. L. (2015). How high albedo and traditional buildings’ materials and vegetation affect the quality of urban microclimate. A case study. Energy Build. 99, 32–49. doi:10.1016/j.enbuild.2015.04.010
Shafiee, E., Faizi, M., Yazdanfar, S.-A., and Khanmohammadi, M.-A. (2020). Assessment of the effect of living wall systems on the improvement of the urban heat island phenomenon. Build. Environ. 181, 106923. doi:10.1016/j.buildenv.2020.106923
Spagnolo, J., and de Dear, R. (2003). A field study of thermal comfort in outdoor and semi-outdoor environments in subtropical Sydney Australia. Build. Environ. 38 (5), 721–738. doi:10.1016/S0360-1323(02)00209-3
Steinbrecher, T., Danninger, E., Harder, D., Speck, T., Kraft, O., and Schwaiger, R. (2010). Quantifying the attachment strength of climbing plants: a new approach. Acta Biomater. 6 (4), 1497–1504. doi:10.1016/j.actbio.2009.10.003
Stempihar, J. J., Pourshams-Manzouri, T., Kaloush, K. E., and Rodezno, M. C. (2012). Porous asphalt pavement temperature effects for urban heat island analysis. Transp. Res. Rec. 2293 (1), 123–130. doi:10.3141/2293-15
Susorova, I., Angulo, M., Bahrami, P., and Brent, S. (2013). A model of vegetated exterior facades for evaluation of wall thermal performance. Build. Environ. 67, 1–13. doi:10.1016/j.buildenv.2013.04.027
Vox, G., Blanco, I., and Schettini, E. (2018). Green façades to control wall surface temperature in buildings. Build. Environ. 129, 154–166. doi:10.1016/j.buildenv.2017.12.002
Widiastuti, R., Zaini, J., and Caesarendra, W. (2020). Field measurement on the model of green facade systems and its effect to building indoor thermal comfort. Measurement 166, 108212. doi:10.1016/j.measurement.2020.108212
Wong, N. H., Kwang Tan, A. Y., Chen, Y., Sekar, K., Tan, P. Y., Chan, D., et al. (2010). Thermal evaluation of vertical greenery systems for building walls. Build. Environ. 45 (3), 663–672. doi:10.1016/j.buildenv.2009.08.005
Zhang, L., Deng, Z., Liang, L., Zhang, Y., Meng, Q., Wang, J., et al. (2019). Thermal behavior of a vertical green facade and its impact on the indoor and outdoor thermal environment. Energy Build. 204, 109502. doi:10.1016/j.enbuild.2019.109502
Keywords: green walls, experimental measurement, humid climate, cooling performance, ambient air temperature, urban heat island, deep learning model, artificial neural network
Citation: Daemei AB, Bradecki T, Pancewicz A, Razzaghipour A, Darvish A, Jamali A, Abbaszadegan SM, Askarizad R, Kazemi M and Sharifi A (2024) An experimental analysis and deep learning model to assess the cooling performance of green walls in humid climates. Front. Energy Res. 12:1447655. doi: 10.3389/fenrg.2024.1447655
Received: 11 June 2024; Accepted: 19 July 2024;
Published: 05 August 2024.
Edited by:
Qibin Li, Chongqing University, ChinaReviewed by:
Jiacheng He, Guangdong University of Technology, ChinaShijie Zhang, Guizhou University, China
Copyright © 2024 Daemei, Bradecki, Pancewicz, Razzaghipour, Darvish, Jamali, Abbaszadegan, Askarizad, Kazemi and Sharifi. This is an open-access article distributed under the terms of the Creative Commons Attribution License (CC BY). The use, distribution or reproduction in other forums is permitted, provided the original author(s) and the copyright owner(s) are credited and that the original publication in this journal is cited, in accordance with accepted academic practice. No use, distribution or reproduction is permitted which does not comply with these terms.
*Correspondence: Abdollah Baghaei Daemei, YWJhZ2hhZWlAbWFzc2V5LmFjLm56