- School of Naval Architecture and Ocean Engineering, Jiangsu University of Science and Technology, Zhenjiang, China
The energy conversion capacity of wave energy conversion devices highly depends on the hydrodynamic characteristics of the energy-harvesting structure. To investigate the effect of hydrodynamic performance on the power conversion characteristics, a twin-buoy wave energy converter (WEC) was investigated by using a three-dimensional numerical wave pool based on the Computational Fluid Dynamics (CFD) method. Several factors are examined, including the elasticity coefficient of the anchor chain, the bottom configuration of the floating body, and the power take-off (PTO) damping coefficient. The heave displacement, heave velocity, and heave force of the converter are calculated under specific wave parameters, and the flow field cloud diagram during the heave motion is analyzed. The results indicate that a wave energy converter with a hemispherical floating body exhibits the best kinematic performance. The influence of the mechanical damping coefficient on the energy conversion performance of the device is studied. By appropriately reducing the mechanical damping coefficient, the energy capturing capability of the device can be increased to a certain extent. These findings can serve as a theoretical basis for the application of deep-water wave energy conversion in engineering and the optimization of future WEC designs.
1 Introduction
When considering the impact of viscosity, it adds complexity to the overall solution of fluid motion problems. In cases where viscosity has little effect, the fluid is often treated as an ideal, non-viscous fluid. However, for problems where viscosity plays a significant role, idealizing the fluid is no longer possible, and viscosity must be considered in calculations. The study of fluid viscosity, known as viscous fluid mechanics, is closely related to practical engineering applications (Yeung and Jiang, 2014; Zhang et al., 2009; Bubbar et al., 2018; Caskey, 2014). Advancements in scientific research have led to significant progress in the field of viscous fluid mechanics, with the use of CFD software becoming a prevalent approach (Devolder et al., 2018; Zhou et al., 2021).
In light of the current concerns about energy depletion, the development and utilization of wave energy as a clean and renewable energy source have garnered considerable attention (Murai et al., 2020; Cheng et al., 2021). The global potential for wave energy is estimated to be 2.5 billion kW, twice the current global installed power generation capacity. A wave energy converter is a device that transforms the kinetic and potential energy of waves into electrical energy. It consists of two main components: the wave energy acquisition part and the energy transfer and conversion part. The latter serves as the energy generation device, converting the mechanical energy from secondary conversion into electrical energy using a generator. Wave energy, present in seawater, represents a hidden source of renewable energy. Compared to other forms of marine energy, wave energy offers the advantages of convenient development and cost-effective, compact devices (Tay and Wei, 2020; Sheng and Lewis, 2016; Rezanejad and Guedes Soares, 2018; Eriksson et al., 2005). Various wave energy acquisition devices exist, including oscillating water column type, point suction type, and pendulum type (Cheng et al., 2019a; Cheng et al., 2019b). The conversion of wave energy occurs in three stages: the first stage involves acquiring and converting wave energy into other forms of energy. The secondary conversion helps direct, increase speed, and stabilize the energy. Finally, the third stage converts mechanical energy into electrical energy.
For scholars both domestically and internationally, the hydrodynamic performance of wave energy converters has emerged as a prominent research area. In a study by Eriksson et al. (Eriksson et al., 2005), the hydrodynamic characteristics of a wave energy converter were examined using potential flow theory, which disregards the impact of fluid viscosity. Yu et al. (Yu and Li, 2013) employed the Reynolds-average Navier Stokes equations to numerically model a point absorber wave energy converter with a carrier, necessitating significant computational resources. Guanche et al. (Guanche et al., 2013) utilized Simulink to conduct a partly nonlinear time-domain numerical simulation of a specific type of WEC. They investigated its sensitivity to various factors such as motor damping, WEC diameter, water depth, bearing friction coefficient, vertical drag force coefficient, wave height, and wave period. Mohammed et al. (Zullah and Lee, 2013) employed CFD techniques to simulate a Savonius rotor wave energy converter in a numerical wave pool, using CFX software. Similarly, Liu et al. (Liu et al., 2012) used CFD software to study the overtopping wave energy converter in a two-dimensional numerical wave pool. However, these studies primarily focused on two-dimensional simulations, which involve less computation but may not fully represent real-world conditions as compared to three-dimensional simulations.
Research on wave energy devices, both nationally and internationally, often relies on potential flow theory and frequency domain linear wave theory while neglecting the impact of fluid viscosity (Chen, 2018; Guo et al., 2018; Guo et al., 2014; Zhang et al., 2015). In this study, we apply a CFD approach that considers fluid viscosity and enables the simulation of floating devices with complex shapes and multiple degrees of freedom in the time domain. This approach provides a more intuitive representation of the temporal changes in physical quantities as the float moves and allows for the calculation of flow field information at each time step within the computational domain (Drew et al., 2009; Falcão, 2010; Muliawan et al., 2013). In our investigation, we use the CFD method along with STAR-CCM + software to simulate a specific point absorber wave energy converter. The simulation involves generating linear waves in a three-dimensional numerical wave pool, reducing the computational time without sacrificing accuracy (Falcão and Henriques, 2015; Sheng et al., 2015; Zhong and Yeung, 2019). To better reflect real-world conditions, we incorporate external mechanical damping into the device. Furthermore, we explore the theoretical movement response of the floating body under the influence of external mechanical damping, specifically examining displacement, velocity, and force under various wave conditions (Zhang et al., 2020; Michele and Renzi, 2019).
2 Theoretical analysis
2.1 Numerical model
The two-buoy wave energy converter comprises a float and a column, with this article introducing a novel damping plate onto the column. The floating bodies typically exhibit a cylindrical shape that is relatively flat, resulting in a larger waterline surface area. Conversely, the column exhibits a slender cylindrical shape with a comparatively smaller waterline surface area. The two-buoy wave energy converter is illustrated in Figure 1.
The Equations 1–3 for the heave force acting on the floating body can be expressed as follows.
The Equations 4–6 for the heave force acting on the cylindrical floating body are as follows.
Where,
The floating body heave RAO is
Where,
Where,
2.2 Basic theory
To address the wave load resulting from regular waves interacting with the surface of a dual floating wave energy device, the wave field must be solved initially. This article employs the CFD method to solve for regular wave fields. The approach follows three fundamental equations: the continuity equation, momentum equation, and Navier-Stokes (N-S) equation. Within the continuity equation, also referred to as the mass conservation equation, the differential form is expressed in Equation 9 as follows for a viscous incompressible fluid.
Where,
Where,
The aforementioned equation can also be applied to turbulence. Turbulent motion can be seen as comprising two components: time-averaged flow and instantaneous pulsating flow. Therefore, the instantaneous value of the dependent variable in the flow field can be expressed in Equation 11
Where
The above Equation 12 is the Reynolds-averaged Navier-Stokes equation, where
3 Numerical calculations
This paper employs the CFD method to investigate and analyze the hydrodynamic performance of the wave energy converter in the time domain. The computational model comprises the floating body, column, and damping plate. The model simulates a single-degree-of-freedom heave motion. The structural schematic diagram of the twin floating body model can be seen in Figures 1, 2.
The half-sectional views of the buoys are shown in Figure 2. To ensure consistency in the inner and outer radii and displacement of the buoys, the conical and hemispherical floats have cylindrical surfaces with a height of d. The relevant data parameters in the model are shown in Table 1.
In this example, a regular wave with a 0.1 m wave height, 1.9s period, and 5.65 m wavelength is selected. The three-dimensional numerical wave flume model established in this study is depicted in Figure 3, with the X-axis representing the transverse direction of the wavelength, the Y-axis representing the longitudinal direction, and the Z-axis representing the vertical direction. Based on the wavelength size, the calculation domain dimensions are determined. The length of the pool is 40m, approximately seven times the wavelength, the width is 10m, the height is 14m, and the water depth is 12 m to ensure deep-water wave conditions. The velocity entrance boundary is located at the left end of the calculation domain, and the pressure exit boundary is set at the right end. To mitigate reflected waves during propagation, the VOF wave damping method is employed, with a damping length of twice the wavelength set at the end of the calculation domain. The standard K-Epsilon turbulence model is used in this study, employing Eulerian multi-phase flow to simulate gas-liquid phase change, and the VOF method to track the free liquid surface variations.
3.1 Convergence verification
The quality and quantity of grid division play a crucial role in the accuracy and efficiency of the calculations. Using too many grids can significantly increase computation time, while using too few grids may lead to inaccurate results. Based on practical experience, it has been determined that selecting a reference value of approximately 1/20 of the wavelength strikes a balance between result accuracy and computational time. Since the waves are concentrated at the free surface, it is necessary to employ a refined grid resolution to accurately simulate the wave’s height and wavelength direction. In this study, to ensure the accuracy of wave transmission in terms of height and wavelength direction, five layers of encrypted regions have been created at the free liquid surface. The grid size at the free liquid surface is determined using an empirical formula
The Figure 4 presented below showcases the wave time history curves collected four different grid sizes. Through a comparison of the curves within the figure, it becomes evident that the wave time history curves for the four grid sizes generally exhibit consistency in both wave height and phase. Overall, the results obtained from simulating waves in numerical flumes using four different grid numbers do not display significant discrepancies. Upon zooming in on the data plot, it is observed that there is not a significant difference in wave amplitude among the four grid sizes. Case 2 exhibits the largest amplitude, while Case 3 has the smallest amplitude. The phase values for Case 2 and case 3 are relatively similar. However, there is a considerable difference in phase between Case 1 and case 4. With the aim of ensuring accurate calculations while considering computational efficiency, Case 3 has been chosen as the final parameter for the calculations.
3.2 Accuracy verification
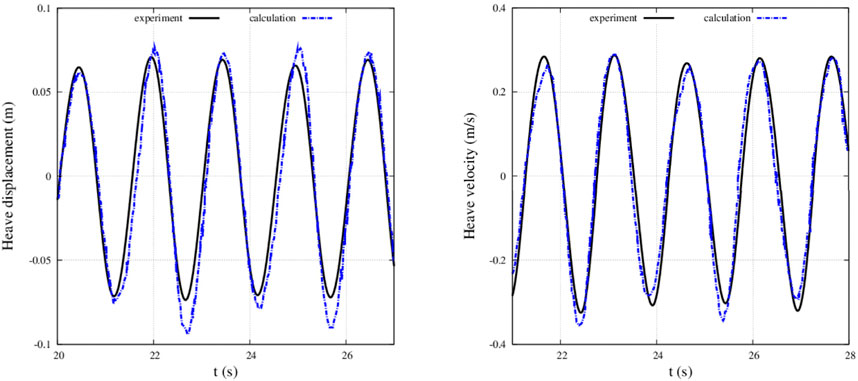
This article primarily chose on the experimental research conducted on the heave buoy wave energy converter developed by Tianjin University (Zang et al., 2018). Specifically, the experiment uses a cylindrical model, exploring its heave motion response and wave energy conversion efficiency under varying PTO damping conditions. The main objective of this article is to assess the accuracy of the wave-structure interaction through the analysis of data extracted from the conducted experiment. The experimental model possesses a displacement of 17.45 kg and a draft depth of 0.11 m. The experiment is conducted with a wave period of 1.5s and a wave height of 0.1738 m. This article aims to validate the convergence of the overlapping region grids under these conditions, while also comparing the numerical simulation results with the experimental findings.
Based on the depicted Figure 5, it is evident that there is small disparity between the heave data obtained from numerical simulations and the experimental results. Therefore, we are confident that this wave-object coupling adequately fulfills the research requirements outlined in this article.
4 Motion and power absorption characteristics
4.1 Mooring line stiffness
This section aims to investigate the impact of anchor chain elasticity coefficient on the motion and force of floating bodies, specifically focusing on a cylindrical floating body. Three distinct anchor chain elastic coefficients, namely, 0N/m, 3000N/m, and infinite anchor chain elastic coefficients, have been selected for this study. The effect of changes in the elasticity coefficient of anchor chains under three different periods on the motion response of the device, as shown in Figure 6. The heave displacement and velocity of the floating body are lower when the damping plate is in motion compared to when it is fixed. When the anchor chain’s elasticity coefficient is 3000N/m, the heave displacement and heave velocity of the damping plate are notably smaller than when the elasticity coefficient is 0N/m. There is no significant difference between the relative heave velocity and the curve value of the floating body’s heave velocity. However, the heave displacement and velocity of the damping plate with an anchor chain elasticity coefficient of 3000N/m are notably higher compared to the damping plate in free heave motion.
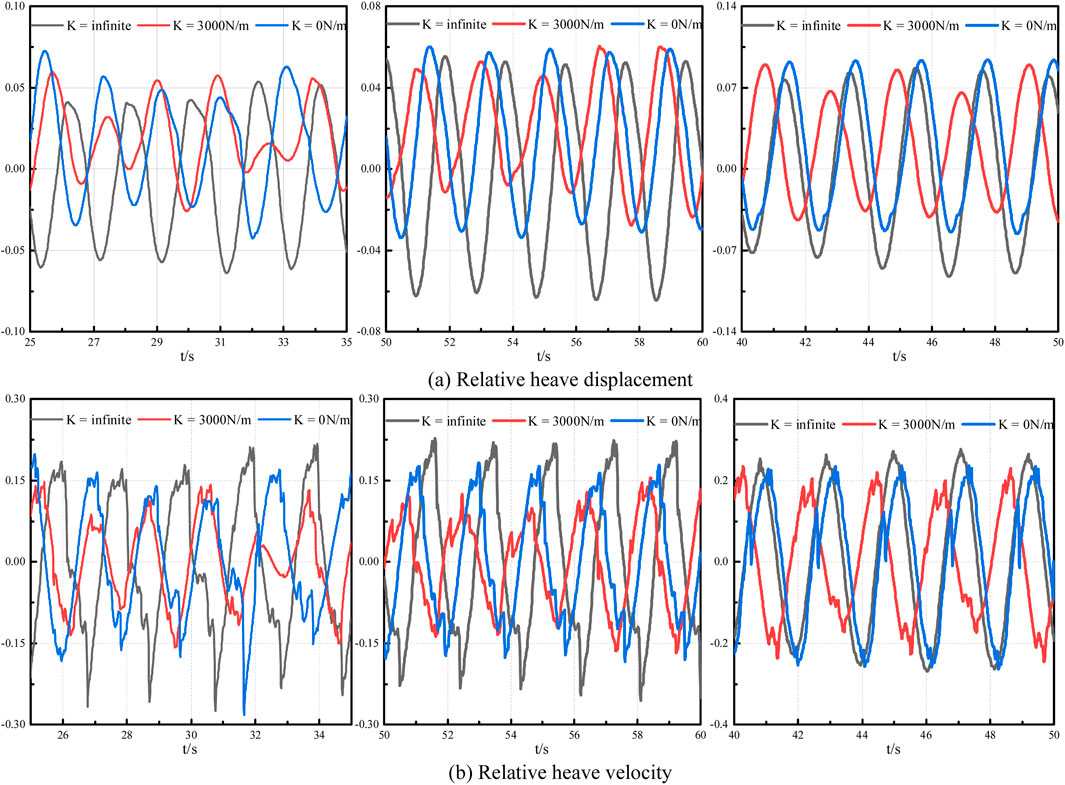
Figure 6. The relative heave displacement (A) and (B) velocity with different wave period is 1.7s (Left), 1.9s (Middle) and 2.1s (Right).
Observing the effect of changes in the elasticity coefficient of anchor chain on the heave forces experienced by the float and damping plate when the wave period is 1.9 s. When the damping plate is fixed, the heave force on the floating body is slightly greater than the other two motion states. However, when the anchor chain elastic coefficient is 0N/m and 3000N/m, the amplitude of the heave force on the floating body is not significantly different. When the heave force on the damping plate is locally amplified, it is found that the damping plate experiences the maximum heave force when the anchor chain elastic coefficient is 3000N/m. When the damping plate performs free heave motion, the heave force on the damping plate tends to zero. It can be inferred that the larger the anchor chain elastic coefficient, the smaller the heave force on the damping plate.
Observing the effect of changes in the anchor chain elasticity coefficient on the velocity field and vorticity field of the device when the wave period is 1.9 s. The floating body of the device undergoes heave motion, while the damping plate is fixed through the use of an anchor chain to facilitate heave motion. Figure 7 illustrate the velocity fields of the floating body at four distinct locations and how the heave motion of the floating body affects the heave motion of the damping plate. When the floating body is in its equilibrium position, it attains maximum velocity, influencing the motion of surrounding fluid. When the floating body is above its equilibrium position in terms of velocity, the fluid velocity below the floating body is directed vertically upwards. Conversely, when the floating body is below its equilibrium position in terms of velocity, the fluid velocity below the floating body is directed vertically downwards. At the highest and lowest points of the floating body’s motion, its velocity approaches zero, and the fluid velocity beneath the floating body’s bottom surface is parallel to it. The figure clearly demonstrates that when the damping plate is fixed, the floating body reaches its maximum velocity. Conversely, when the elastic coefficient of the anchor chain is 3000N/m, the floating body exhibits the smallest velocity. In the case of the fixed damping plate, the fluid velocity at the side wall of the column is the greatest due to the significant influence of the floating body’s heave motion on the flow field near the column.
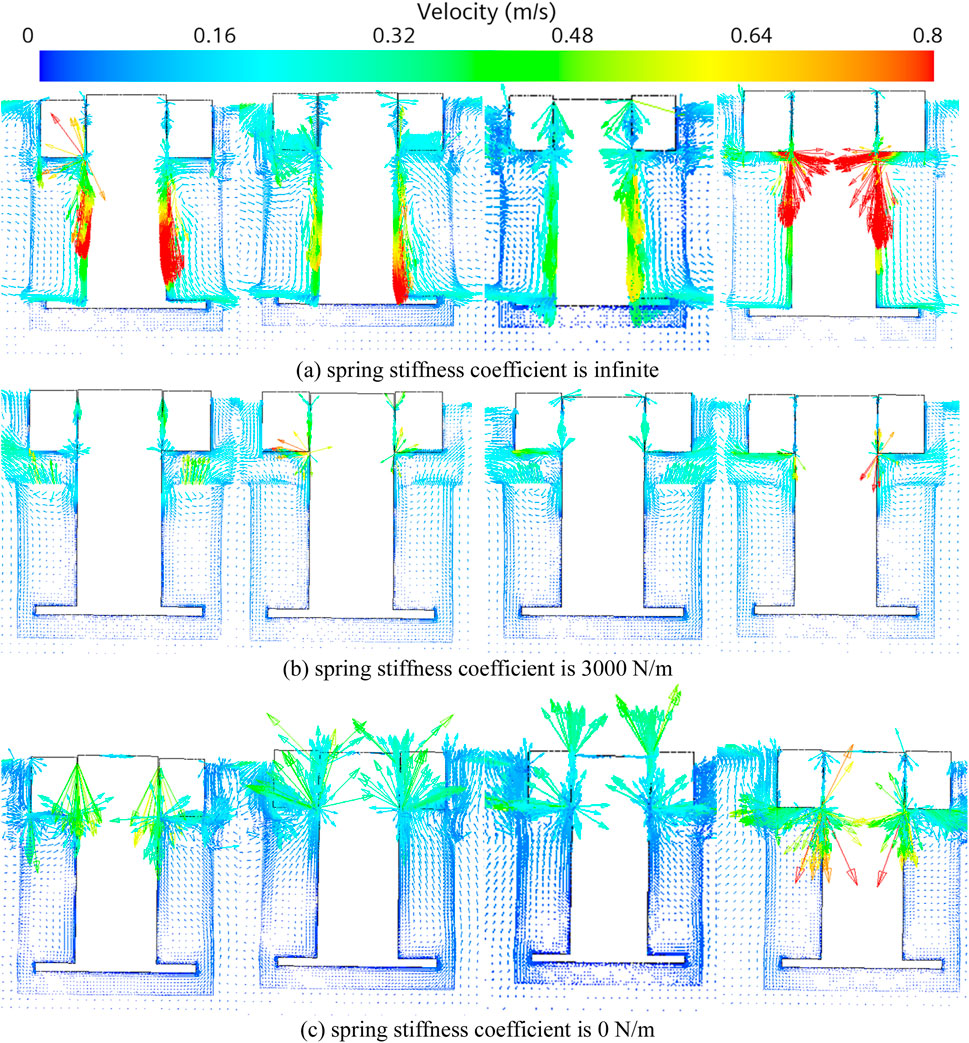
Figure 7. The velocity field of the WEC with different spring stiffness coefficients (A) infinite (B) 3000 N/m and (C) 0 N/m for different motion states. From left to right are rock bottom, speed up, culmination and speed down.
When the damping plate is fixed, vortices are present on the side wall of the column. As the floating body perform upward heave motion from its lowest point, the vortices on the side wall gradually diminish until they disappear. Meanwhile, the dissipation of vortices at the gap between the floating body and the column gradually increases. Figure 8 shows that when the damping plate also performing heave motion, vortex clusters primarily from around the bottom surface of the floating body. These vortex clusters are mainly concentrated at the gap between the floating body’s bottom surface and the side wall of the column. This is because the floating body and the damping plate undergo relative heave motion. Additionally, due to the small gap between the inner wall of the floating body’s opening and the column, vortex clusters form at the connection between the side wall of the column and the floating body’s bottom surface. The size and distribution of the vortex clusters vary depending on the location of the floating body. Vortex clusters are present on the outer wall of the floating body when it is in the equilibrium position (velocity downward) and at its lowest point. This can be attributed to the dissipation of vortices at the outer wall of the floating body as a result of fluid viscosity during downward heave motion. By analyzing the temporal and spatial evolution of these vortices and their dissipation rates, we inferred that the observed behavior of the floating body during downward motion can be attributed, at least partially, to the dissipation of vortices at its outer walls. This conclusion is supported by numerical simulations, which show a consistent correlation between vortex dissipation and changes in the hydrodynamic response of the floating body. Conversely, when the elastic coefficient of the anchor chain is 0N/m and the floating body is in the equilibrium position (velocity upward) and at its highest point, the vortex transfers from the outer wall to the bottom of the outer edge of the float. This is because energy dissipation occurs at the bottom of the floating body’s outer edge due to the influence of fluid viscosity during upward heave motion.
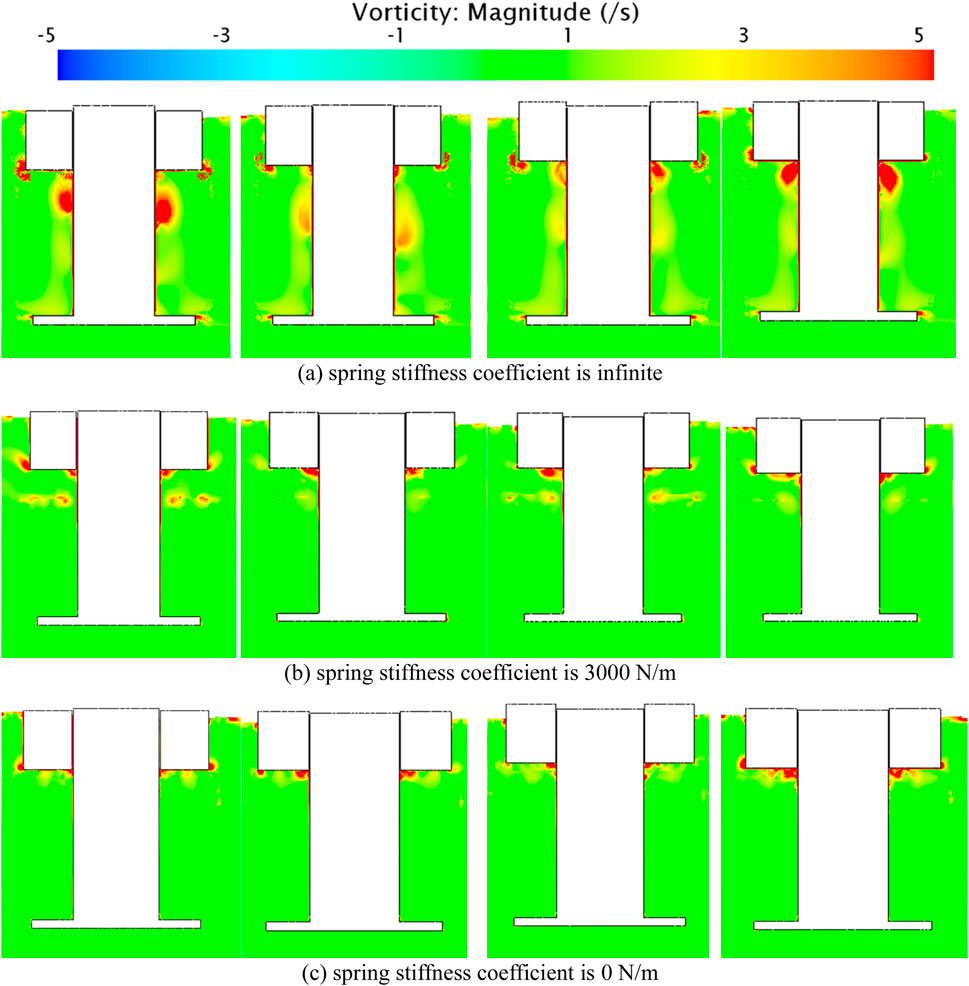
Figure 8. The vorticity field of the WEC with different spring stiffness coefficients (A) infinite (B) 3000 N/m and (C) 0 N/m for different motion states. From left to right are rock bottom, speed up, culmination and speed down.
The vortex distribution at the damping plate remains relatively consistent regardless of the floating body’s position, indicating that the heave motion of the floating body does not affect the energy loss of the damping plate. When the damping plate is fixed, there is a minor dissipation of vortices at the damping plate. However, when the damping plate undergoes heave motion, there is no energy dissipation at the damping plate. This suggests that the damping plate does not generate vortex dissipation during heave motion.
4.2 Bottom configuration
Select three wave periods of 1.7s, 1.9s, and 2.1s to separately study the effect of changes in the bottom configuration of the float on the motion response of the dual-float wave energy device. At this time, both the float and supporting columns are set to undergo free heave motion. From the Figure 9, it can be observed that when the wave period is short, specifically at 1.7s, with a cylindrical bottom configuration float, its float heave displacement is comparatively unstable compared to the other two bottom configurations. However, the heave displacement motion of the corresponding supporting column is the most stable among the three bottom configuration floats, with the supporting column’s heave motion almost stationary.
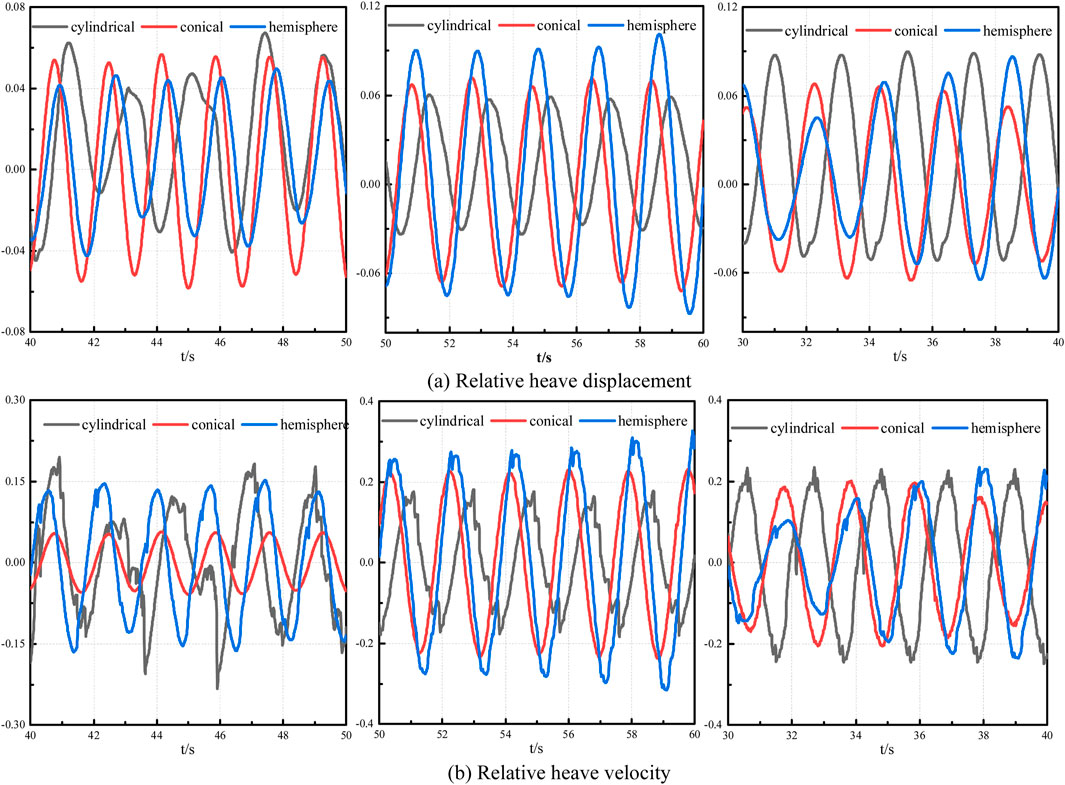
Figure 9. The relative heave displacement (A) and (B) velocity with different wave period is 1.7s (Left), 1.9s (Middle) and 2.1s (Right).
With different wave periods and bottom configurations of the float, the heave displacement also varies. For a wave period of 1.7s, the bottom configuration with a conical float exhibits the largest heave displacement, while for a wave period of 1.9s, the bottom configuration with a hemispherical float shows the largest heave displacement. On the other hand, for a wave period of 2.1s, the bottom configuration with a cylindrical float has the largest heave displacement. This indicates that both the bottom configuration of the float and the change in wave period influence the heave motion response of the device. The variation in wave period has little effect on the heave motion of the supporting columns with a cylindrical bottom configuration float, as their heave motion remains relatively stable.
Observing the effect of changes in the elasticity coefficient of anchor chain on the velocity field and vorticity field of the device when the wave period is 1.9 s. The floating body and damping plate in the device undergo free heave motion. The velocity field of the floating body at four different positions is depicted in Figure 10. The heave motion of the floating body influences the flow of the surrounding fluid. When the floating body is in its equilibrium position, it exhibits maximum velocity. When the floating body moves upward from its equilibrium position, the fluid velocity below the floating body is directed vertically from the bottom of the floating body upwards. Conversely, when the floating body moves downward from its equilibrium position, the fluid velocity below the floating body is directed vertically from the bottom of the floating body downwards. At the highest and lowest points of the floating body, its velocity becomes virtually zero, and the fluid velocity beneath the floating body is parallel to its bottom surface.
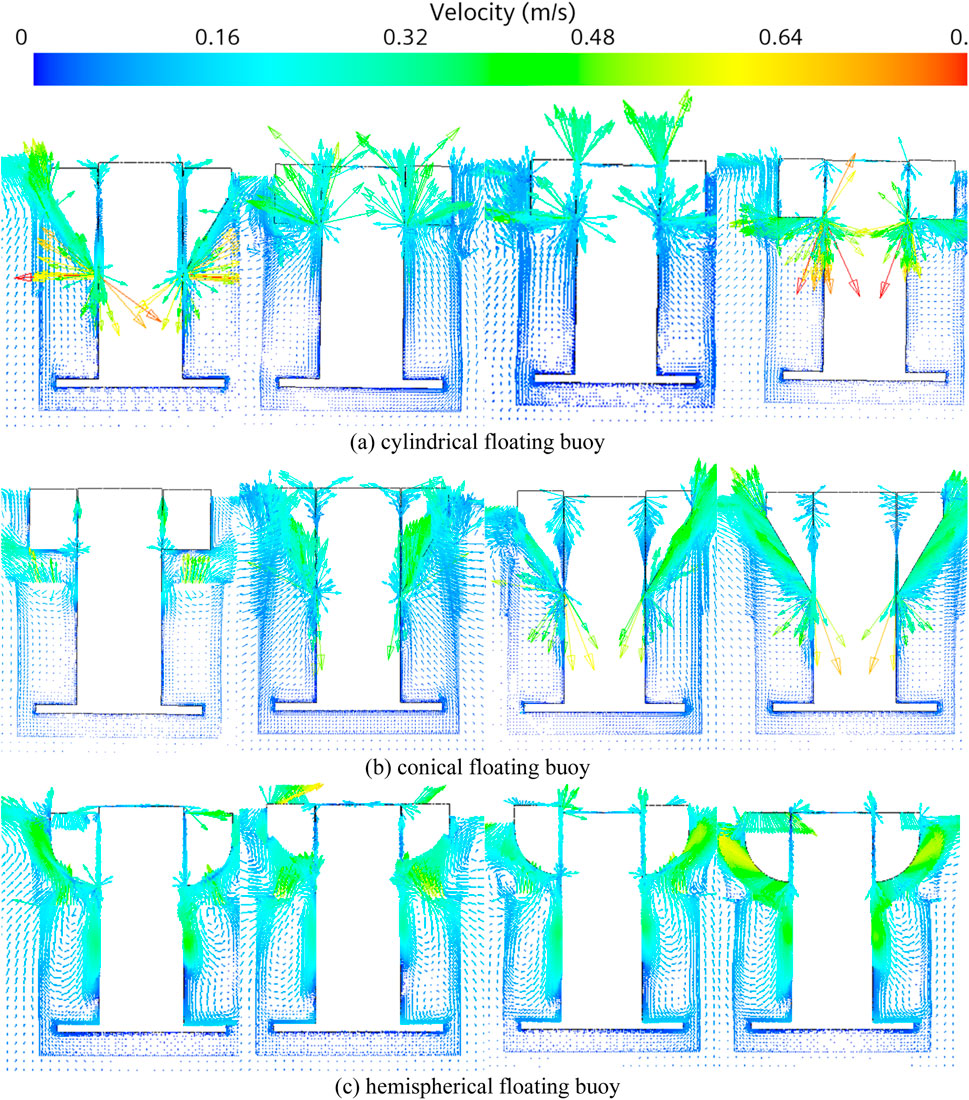
Figure 10. The velocity field of the WEC with different different floating buoys (A) cylindrical (B) conical and (C) hemispherical for different motion states. From left to right are rock bottom, speed up, culmination and speed down.
The hemispherical and conical floating bodies achieve significantly higher speeds compared to the cylindrical floating bodies. The velocity of the damping plate is virtually zero at various locations, indicating that the heave motion of the floating body has little impact on the velocity field in the damping plate region. Additionally, the shape of the floating body has little effect on the velocity field in the damping plate region, as the velocity of the damping plate remains virtually zero regardless of the shape of the floating body.
Figure 11 illustrates that the vortex blob is primarily concentrated in the gaps between the bottom of the floating body and the side wall of the column during heave motion. This occurs due to the presence of a small gap between the inner wall of the floating body opening and the column, which hinders fluid motion. The floating body’s heave motion, driven by its heave motion, also contributes to the formation of the vortex blob in this gap. The dissipation of vortices is more pronounced in the wave-facing area compared to the wave-backing area. When the floating body perform heaves downward, the vortex blob transfers to the outer wall of the floating body. It is worth noting that with a hemispherical floating body, vortex dissipation occurs in the surrounding fluid due to the influence of the heave motion. The dissipation of vortices around the floating body gradually increases as it heaves upward from the lowest point to the equilibrium point. However, as the floating body continues to heave from the equilibrium point to the highest point and back to the equilibrium point, the dissipation of fluid around the floating body gradually decreases. This indicates that the heave motion of a hemispherical floating body significantly affects the surrounding fluid. In summary, the heave motion of a hemispherical floating body has the most disturbance to the surrounding fluid and the greatest energy dissipation. The heave motion of the floating body does not affect the energy dissipation of the damping plate, regardless of the shape of the floating body.
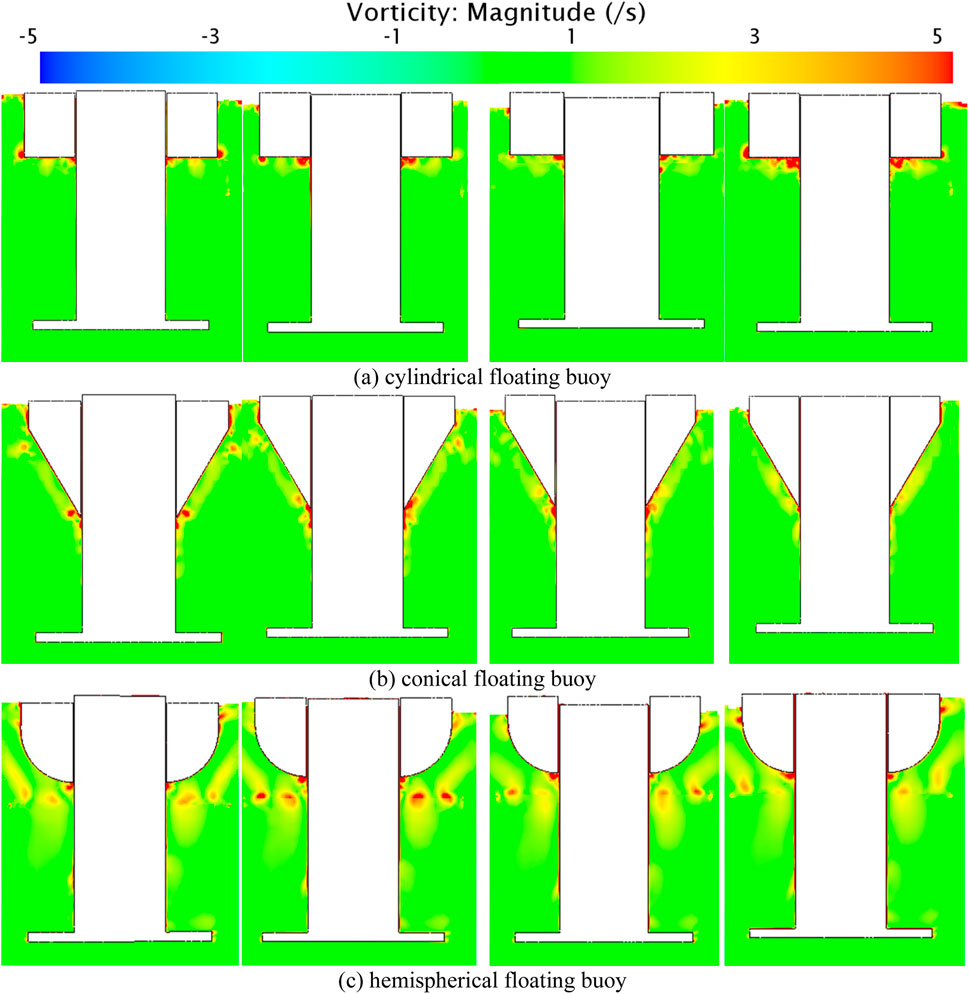
Figure 11. The vorticity field of the WEC with different different floating buoys (A) cylindrical (B) conical and (C) hemispherical for different motion states. From left to right are rock bottom, speed up, culmination and speed down.
4.3 PTO damping
Observing the effects of changes in the damping coefficient on the device’s motion response under three different periods. In this section, the objective is to investigate the influence of PTO damping coefficient changes on the performance of a dual pontoon device. Three different PTO damping coefficients are utilized for this purpose, with the anchor chain’s elastic coefficient set to zero. This section specifically focuses on utilizing a hemispherical floating body configuration. The primary focus of the study is to analyze the impact of varying PTO damping coefficients on the motion and force characteristics of the dual pontoon device.
Figure 12 clearly demonstrate that higher damping coefficients result in a deceleration of the heave motion of the floating body. As the damping coefficient gradually increases, both the heave displacement and velocity of the floating body progressively decrease. When the wave period is short, the oscillatory motion of the damping plate is hardly affected by the damping coefficient. However, when the wave period is 2.1 s, the larger the damping coefficient, the smaller the amplitude of oscillatory displacement and velocity of the damping plate.
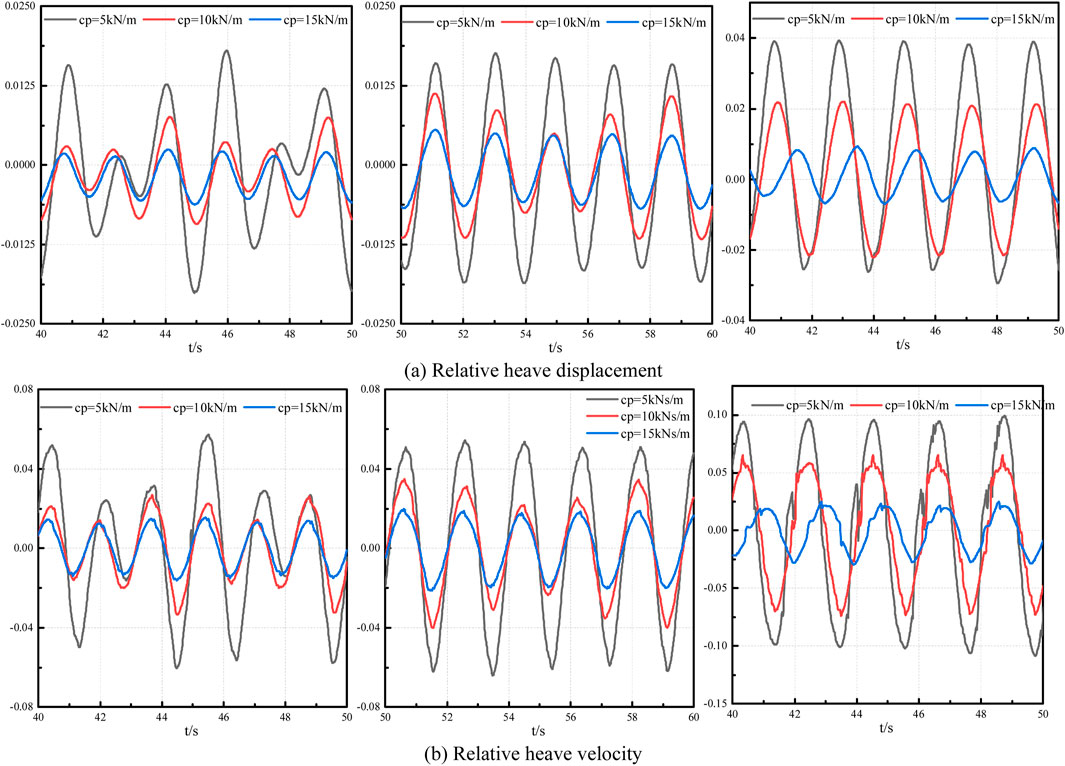
Figure 12. The relative heave displacement (A) and (B) velocity with different wave period is 1.7s (Left), 1.9s (Middle) and 2.1s (Right).
When the wave period is short, the change in damping coefficient has a minimal impact on the damping force experienced by the float. When the wave period is 2.1 s, with an increase in damping coefficient, the damping force on the float initially increases and then decreases. It can be observed from Figure 13 that the PTO force does not vary linearly with the damping coefficient. In this paper, for the given wave periods 1.7, 1.9 and 2.1s, the middle PTO coefficient 10 kNs/m has the maximum PTO damping force. It means that there will be an optimum PTO damping coefficient for different wave periods and bottom configuration of the oscillating buoy.

Figure 13. The PTO damping force with different wave periods. 1.7s (Left), 1.9s (Middle) and 2.1s (Right).
From the result of capture width ratio in Figure 14, it is found that among the given three PTO damping coefficients, the smallest damping corresponds to the largest capture width ratio. A smaller damping coefficient results in a larger capture width ratio for the device, so reducing the damping coefficient can enhance the device’s wave energy capture capability. As the calculation progresses, the capture width ratio increases rapidly at first, but gradually flattens out later. When the damping coefficient is 5 kN/m, it even reaches a stable value.

Figure 14. Capture width ratio with different wave periods. 1.7s (Left), 1.9s (Middle) and 2.1s (Right).
5 Conclusion
(1) Changes in the elastic coefficient of the anchor chain have a direct impact on the motion state of the damping plate, which in turn affects the motion of the floating body. Specifically, when the damping plate undergoes heave motion, the heave displacement of the floating body becomes smaller compared to when the damping plate is fixed. This indicates that the motion of the damping plate does indeed influence the motion of the floating body to a certain degree.
(2) Changes in the bottom configuration of the float and wave period have little impact on the wave loads experienced by the supporting columns. The wave loads on the supporting columns are almost negligible. However, with different wave periods and bottom configurations of the float, the heave displacement of the device varies. This indicates that not only the bottom configuration of the float affects the heave displacement of the device, but also the change in wave period influences the heave motion response of the device. The variation in wave period has little effect on the heave motion of the supporting columns with cylindrical bottom configuration floats, as their heave motion remains relatively stable.
(3) When the wave period is relatively large, increasing the PTO damping coefficient will reduce the heave displacement and amplitude of the heave velocity curve for the float and damping plate. In order to enhance the wave energy capture capability of the device, it is advisable to reduce the damping coefficient appropriately.
Data availability statement
The original contributions presented in the study are included in the article/supplementary material, further inquiries can be directed to the corresponding author.
Author contributions
XZ: Formal Analysis, Methodology, Writing–review and editing. ZC: Software, Writing–original draft. HX: Validation, Writing–original draft. ZZ: Investigation, Writing–original draft. SL: Data curation, Investigation, Writing–original draft.
Funding
The author(s) declare that no financial support was received for the research, authorship, and/or publication of this article.
Conflict of interest
The authors declare that the research was conducted in the absence of any commercial or financial relationships that could be construed as a potential conflict of interest. This paper is financially supported by the National Natural Science Foundation of China (No. 51909111) and Natural Science Foundation of Jiangsu Province (No. BK20180980).
Publisher’s note
All claims expressed in this article are solely those of the authors and do not necessarily represent those of their affiliated organizations, or those of the publisher, the editors and the reviewers. Any product that may be evaluated in this article, or claim that may be made by its manufacturer, is not guaranteed or endorsed by the publisher.
References
Bubbar, K., Buckham, B., and Wild, P. (2018). A method for comparing wave energy converter conceptual designs based on potential power capture. Renew. Energy 115, 797–807. doi:10.1016/j.renene.2017.09.005
Caskey, C. J. (2014). Analysis of a cycloidal wave energy converter using unsteady Reynolds averaged Navier-Stokes simulation. Fredericton: University of New Brunswick, 159.
Chen, Z. F. (2018). Study on hydrodynamic and energy conversion characteristics of double resonance point-suction wave energy system. Harbin: Harbin Engineering University.
Cheng, Y., Ji, C. Y., and Zhai, G. J. (2019a). Fully nonlinear analysis incorporating viscous effects for hydrodynamics of an oscillating wave surge converter with nonlinear power take-off system. Energy 179 (15), 1067–1081. doi:10.1016/j.energy.2019.04.189
Cheng, Y., Li, G., Ji, C. Y., and Zhai, G. J. (2019b). Numerical investigation of solitary wave slamming on an oscillating wave surge converter. Phys. Fluids 31, 037102. doi:10.1063/1.5085074
Cheng, Y., Xi, C., Dai, S. S., Ji, C. Y., and Cocard, M. (2021). Wave energy extraction for an array of dual-oscillating wave surge converter with different layouts. Appl. Energy 292, 116899. doi:10.1016/j.apenergy.2021.116899
Devolder, B., Stratigaki, V., Troch, P., and Rauwoens, P. (2018). CFD Simulations of floating point absorber wave energy converter arrays subjected to regular waves. Energies 11 (3), 641. doi:10.3390/en11030641
Drew, B., Plummer, A. R., and Sahinkaya, M. N. (2009). A review of wave energy converter technology. Proc. Institution Mech. Eng. Part A J. Power & Energy 223 (8), 887–902. doi:10.1243/09576509jpe782
Eriksson, M., Isberg, J., and Leijon, M. (2005). Hydrodynamic modelling of a direct drive wave energy converter. Eng. Sci. 43, 1377–1387. doi:10.1016/j.ijengsci.2005.05.014
Falcão, A. (2010). Wave energy utilization: a review of the technologies. Renew. Sustain. Energy Rev. 14, 899–918. doi:10.1016/j.rser.2009.11.003
Falcão, A., and Henriques, J. C. C. (2015). Effect of non-ideal power take-off efficiency on performance of single- and two-body reactively controlled wave energy converters. J. Ocean Eng. Mar. Energy 1 (3), 273–286. doi:10.1007/s40722-015-0023-5
Guanche, R., Gómez, V., Vidal, C., and Eguinoa, I. (2013). Numerical analysis and performance optimization of a submerged wave energy point absorber. Ocean. Eng. 59, 214–230. doi:10.1016/j.oceaneng.2012.10.016
Guo, W., Zhang, L., Zheng, X. B., and Wang, S. Q. (2014). Hydrodynamic performance analysis of wave energy conversion device based on CFD. Huazhong Univ. Sci. Technol. Nat. Sci. Ed. 42 (7), 22–26. (In Chinese).
Guo, W., Zhou, N. F., Wang, S. Q., and Zhao, Q. S. (2018). Hydrodynamics and energy harvesting analysis of wave energy devices with nonlinear PTO. Huazhong Univ. Sci. Technol. Nat. Sci. Ed. 46 (4), 57–62. (In Chinese).
Liu, Y. J., Liu, Z., Yan, F. Z., Hong, Q. Y., and Ji, J. N. (2012). Two-dimensional numerical simulation of wave-energy power generation device. Hydroelectr. Eng. 31 (2), 108–113+127. (In Chinese).
Michele, S., and Renzi, E. (2019). A second-order theory for an array of curved wave energy converters in open sea. J. Fluids Struct. 88, 315–330. doi:10.1016/j.jfluidstructs.2019.05.007
Muliawan, M. J., Karimirad, M., and Moan, T. (2013). Dynamic response and power performance of a combined Spar-type floating wind turbine and coaxial floating wave energy converter. Renew. Energy 50, 47–57. doi:10.1016/j.renene.2012.05.025
Murai, M., Li, Q., and Funada, J. (2020). Study on power generation of single point absorber wave energy converters (PA-WECs) and arrays of PA-WECs. Renew. Energy 164, 1121–1132. doi:10.1016/j.renene.2020.08.124
Rezanejad, K., and Guedes Soares, C. (2018). Enhancing the primary efficiency of an oscillating water column wave energy converter based on a dual-mass system analogy. Renew. Energy 123, 730–747. doi:10.1016/j.renene.2018.02.084
Sheng, W., Alcorn, R., and Lewis, A. (2015). On improving wave energy conversion, Part I: optimal and control technologies. Renew. Energy 75, 922–934. doi:10.1016/j.renene.2014.09.048
Sheng, W., and Lewis, A. (2016). Power takeoff optimization for maximizing energy conversion of wave-activated bodies. Ocean. Eng. 41 (3), 529–540. doi:10.1109/joe.2015.2489798
Tay, Z. Y., and Wei, Y. (2020). Power enhancement of pontoon-type wave energy convertor via hydroelastic response and variable power take-off system. Ocean Eng. Sci. 5, 1–18. doi:10.1016/j.joes.2019.07.002
Yeung, R. W., and Jiang, Y. (2014). Shape effects on viscous damping and motion of heaving cylinders. Offshore Mech. Arct. Eng. 136 (4), 041801. doi:10.1115/1.4027650
Yu, Y. H., and Li, Y. (2013). Reynolds-Averaged Navier–Stokes simulation of the heave performance of a two-body floating-point absorber wave energy system. Comput. & Fluids 73, 104–114. doi:10.1016/j.compfluid.2012.10.007
Zang, Z., Zhang, Q., Qi, Y., and Fu, X. (2018). Hydrodynamic responses and efficiency analyses of a heaving-buoy wave energy converter with PTO damping in regular and irregular waves. Renew. energy 116, 527–542. doi:10.1016/j.renene.2017.09.057
Zhang, D., Li, W., and Lin, Y. (2009). Wave energy in China: current status and perspectives. Renew. Energy 34 (10), 2089–2092.doi:10.1016/j.renene.2009.03.014
Zhang, H., Zhou, B., Vogel, C., Willden, R., Zang, J., and Geng, J. (2020). Hydrodynamic performance of a dual-floater hybrid system combining a floating breakwater and an oscillating-buoy type wave energy converter. Appl. Energy 259, 114212. doi:10.1016/j.apenergy.2019.114212
Zhang, L., Guo, W., and Zheng, X. B. (2015). CFD simulation and flow field analysis of the heave motion performance of a cylindrical float. Huazhong Univ. Sci. Technol. 43 (12), 65–70. (In Chinese).
Zhong, Q., and Yeung, R. W. (2019). Wave-body interactions among energy absorbers in a wave farm. Appl. Energy 233-234, 1051–1064. doi:10.1016/j.apenergy.2018.09.131
Zhou, Y. H., Yang, X. L., Zhou, X. G., and Zhang, W. C. (2021). Hydrodynamic and wave energy conversion characteristics of perforated double floating body device. Vib. shock 40 (5), 211–217. (In Chinese).
Keywords: wave energy, coaxial twin-buoy, computational fluid mechanics, bottom configuration, power take-off
Citation: Zhou X, Cheng Z, Xia H, Zhao Z and Liu S (2024) Power absorption and flow-field characteristics analysis for oscillating coaxial twin-buoy wave energy converter by using CFD. Front. Energy Res. 12:1439062. doi: 10.3389/fenrg.2024.1439062
Received: 27 May 2024; Accepted: 02 September 2024;
Published: 16 September 2024.
Edited by:
Yuquan Zhang, Hohai University, ChinaReviewed by:
Haitao Wu, University of Strathclyde, United KingdomXiongbo Zheng, Harbin Engineering University, China
Copyright © 2024 Zhou, Cheng, Xia, Zhao and Liu. This is an open-access article distributed under the terms of the Creative Commons Attribution License (CC BY). The use, distribution or reproduction in other forums is permitted, provided the original author(s) and the copyright owner(s) are credited and that the original publication in this journal is cited, in accordance with accepted academic practice. No use, distribution or reproduction is permitted which does not comply with these terms.
*Correspondence: Xiaoguo Zhou, emhvdXhnQGp1c3QuZWR1LmNu
 Xiaoguo Zhou
 Zekai Cheng
 Haibo Xia


