 Mingdian Wang1
 Jukui Chen
- 1Zhangye Branch of Gansu Electric Power Corporation State Grid Corporation of China Zhangye, Zhangye, China
- 2School of New Energy and Power Engineering, Lanzhou Jiaotong University Lanzhou, Lanzhou, China
Aiming at the current lithium-ion battery storage power station model, which cannot effectively reflect the battery characteristics, a proposed electro-thermal coupling modeling method for storage power stations considers the characteristics of the battery body by combining the equivalent circuit model and accounting for the effect of temperature on the battery. Based on the modeling of a single lithium-ion battery, the equivalent circuit model and thermal model are integrated to create the battery’s electro-thermal coupling model. The parameters of this coupling model are determined using the particle swarm algorithm. On this basis, the battery compartment model of the energy storage station is analyzed and verified by utilizing the circuit series–parallel connection characteristics. Subsequently, the electro-thermal coupling model of the energy storage station is established. The dual Kalman filter algorithm is utilized to simulate and validate the electric–thermal coupling model of the energy storage power station, considering ontological factors such as battery voltage, current, and temperature. The results demonstrate that the established coupling model can accurately determine the SOC and temperature of the power station. This ability allows for a more precise reflection of the battery characteristics of the energy storage station. It also validates the accuracy and effectiveness of the electric–thermal coupling model of the energy storage station. This finding is crucial for assessing the state and ensuring the safe operation of the battery system in the energy storage station.
1 Introduction
With the continuous increase in the penetration of new energy sources, it brings significant challenges to the safe and stable operation of the new power systems dominated by renewable energy (Shi et al., 2021; Zhang and Kang, 2022). New energy storage plays a crucial role in enhancing the energy and power system’s regulation capability, safety, and security, supporting the development of the new power system. Lithium-ion battery energy storage, as one of the emerging storage technologies, exhibits significant potential due to its flexibility in resource allocation and rapid response, contributing to the integration of renewable energy sources and enhancing system operational agility (LAI et al., 2022). It is particularly valuable in systems with a high penetration of non-dispatchable intermittent power. Energy storage facilities effectively suppress frequency and voltage fluctuations, providing peak shaving and valley filling services (Chen et al., 2023; Qin et al., 2023; Wu et al., 2023). As a result, lithium-ion batteries, which are the core of energy storage systems, receive substantial attention in both domestic and international research. The batteries undergo complex processes, including electrochemical, electrical, and thermal dynamics, which are highly nonlinearly coupled and characterized by intricate internal states. This makes it challenging to accurately describe their outward behavior. Consequently, developing a low-complexity, high-precision battery model to represent both the internal and external characteristics has become a prominent research focus in the energy storage field.
Scholars at home and abroad have conducted extensive research on the modeling of energy storage batteries. The Rint model proposed by He et al. (2013) consists of an ideal voltage source and ohmic internal resistance. It has a simple structure, and the parameters are easy to calculate. However, it cannot describe the dynamic process. When the battery experiences a high current flow, its simulation error increases, leading to a significant reduction in accuracy (Yang et al., 2019). Since the electrochemical polarization effect of the battery alters the potential of the battery electrodes, the Thevenin model proposed by Wei and Chen (2012) incorporates an RC structure to mimic this effect. This model can simulate most of the battery behavior; however, its accuracy is compromised by factors such as aging and temperature (Huang et al., 2020). The PNGV model proposed by Zhang et al. (2009) includes an additional capacitance, CQ, to account for the impact of current on OCV compared to the Thevenin model. This addition enables the estimation of battery states, such as SOC and SOH. However, the cumulative error caused by the series capacitance diminishes the accuracy of the model. He D. W. et al. (2020) and Chen and Zhao (2020) also introduced a second-order RC model comprising two sets of RCs in series with a resistor. This model accounts for the effect of concentrated differential polarization, resulting in higher simulation accuracy and characteristics that closely resemble those of a real battery. However, with the increase in the number of components, the structure becomes more complex, and the effect of temperature is not taken into account (Wu and Zhang, 2020).
Many scholars have developed an electrochemical–thermal coupling model to predict battery temperature accurately. This model can simulate the temperature variations in the battery and the chemical reactions occurring inside it. However, the model comprises multiple differential equations, making it computationally intensive and challenging to interpret, rendering it unsuitable for online battery temperature estimation (Basu et al., 2016; Chao et al., 2017). Mahamud and Park (2011) and Li et al. (2013) proposed considering the battery as a whole to reduce computational effort. However, the battery model is oversimplified as it assumes that the battery temperature remains constant. Forgez et al. (2010) concluded that the battery core temperature is more than 10°C higher than the surface temperature under sustained high-current discharge conditions. Therefore, it is necessary to estimate the battery core temperature to ensure the safety of the battery operation process.
In terms of modeling energy storage power stations, Wang et al. (2011) presented an equivalent circuit model for battery packs in electromechanical transient simulation calculations. However, this model does not consider the battery’s inherent charging and discharging nonlinearities and the time-varying nature of performance parameters. Ding et al. (2011) compared and analyzed three different types of energy storage battery models and referenced actual commercial products to acquire battery performance parameters. However, the impact of temperature variation on them was not taken into account. Maosung et al. (2006) proposed a series/parallel battery module modeling method based on an iterative approach. However, the algorithm is complex and challenging to implement as the number of individual batteries increases. Although some studies (He J. F. et al., 2020; Liu et al., 2021) proposed an integrated modeling and simulation approach for energy storage power stations, factors such as battery physical characteristics were not taken into account. It can be observed that there are few studies by various scholars on the modeling of energy storage power stations, especially regarding lithium-ion batteries.
The rest of this paper is organized as follows: Section 2 proposes an electro-thermal coupling model based on analyzing the equivalent circuit model and the thermal model of a lithium-ion battery. Section 3 identifies the parameters of the electro-thermal coupling model based on the particle swarm algorithm. Section 4 analyzes the structural composition of the lithium-ion battery storage power station and establishes the equivalent circuit model of the battery compartment of the storage power station by utilizing the circuit’s series–parallel connection characteristics. Section 5 utilizes the dual Kalman filter algorithm to simulate and validate the established electro-thermal coupling model of the energy storage power station. Section 6 summarizes the article.
2 Modeling of electro-thermal coupling of lithium-ion batteries
2.1 Equivalent circuit model
Considering that the second-order RC model can more accurately express the dynamic and static characteristics of lithium-ion batteries by using two RC networks to describe the electrochemical polarization and concentration polarization phenomena of the batteries, the second-order RC equivalent circuit model is adopted as the basis of the study, as illustrated in Figure 1.
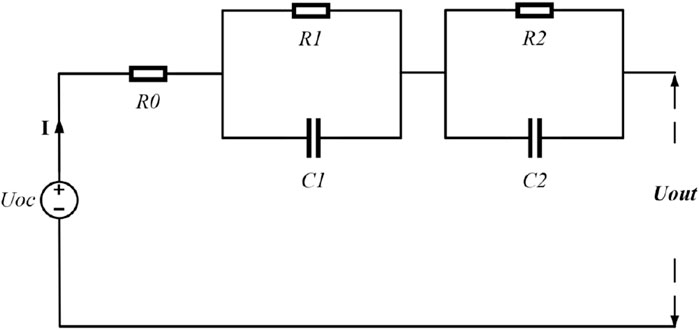
Figure 1. Equivalent circuit model of a lithium-ion battery.
Here, Uoc represents the open-circuit voltage of the battery; Uout is the terminal voltage of the battery; R0 denotes the ohmic internal resistance of the battery; and R1, C1, R2, and C2 circuits are utilized to describe electrochemical polarization and concentration polarization, respectively, with their terminal voltages being U1 and U2. R1 and C1 represent the internal resistance and capacitance of the electrochemical polarization, respectively, while R2 and C2 represent the internal resistance and capacitance of the concentration polarization, respectively. Assuming that the battery is charged in the positive direction and discharged in the negative direction, the mathematical model is shown in Eq. 1, and the SOC of the lithium-ion battery is described by Equation 2:
Here, the discretization time is T = 1 s, the battery Coulomb efficiency is 100%, and Cn represents the actual capacity of the battery (in Ah). The state space equations for the battery equivalent circuit model obtained by discretization are Eqs 3, 4.
2.2 Thermal modeling
The heat production of lithium-ion batteries is categorized into reversible heat, irreversible heat, side-reaction heat, and mixed heat based on the mode of battery heat generation. Battery heat production can be expressed by Eq. 5.
where Qr denotes reversible heat, Qir denotes irreversible heat, Qsr denotes side-reaction heat, and Qmr denotes mixed heat. In this paper, after ignoring the less influential factors such as the heat of side-reaction and the heat of mixing, combined with the related thermodynamics and electrochemistry knowledge, the heat production equation of a lithium-ion battery is obtained as shown in Eq. 6.
In the formula, Qre represents the total heat production. The first term on the right side represents the irreversible heat, where I denotes the charging and discharging current of the battery, and Uout and Uocv denote the terminal voltage and open circuit voltage of the battery, respectively. The second term represents the reversible heat, where Tm denotes the average temperature of the battery. The battery thermal model is shown in Figure 2.
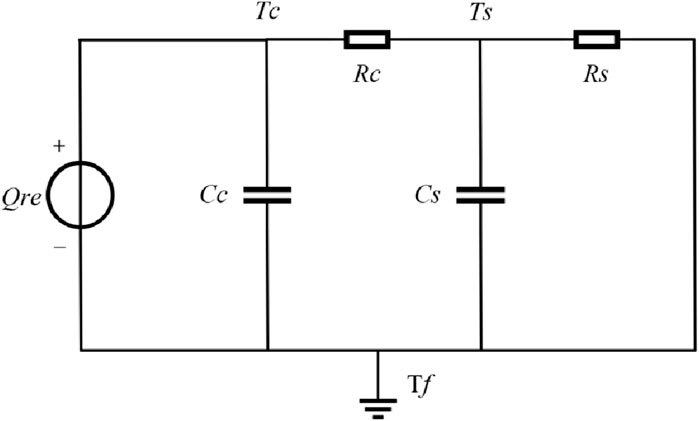
Figure 2. Thermal model of a lithium-ion battery.
Here, Qre denotes the total heat production of the battery, which can be calculated by Equation 6. Rc represents the thermal resistance between the battery core and the battery surface, while Rs represents the thermal resistance between the battery surface and air. Cc represents the heat capacity between the battery core and the battery surface, while Cs represents the heat capacity between the battery surface and the air. Tc, Ts, and Tf represent the internal core temperature, surface temperature, and ambient temperature of the battery, respectively. Combined with the circuit theory, the heat transfer process of the battery thermal model can be expressed as shown in Eq. 7.
The state space equations for the thermal model obtained by discretization are shown in Eqs 8, 9.
2.3 Electro-thermal coupling model
Combined with the equivalent circuit model and thermal model of the battery, the electro-thermal coupling equations of the battery can be expressed as state equations and output equations. These equations help analyze the internal dynamics of the system and its input/output response characteristics. The state equations are presented in Equation 10, while the output equations are depicted in Equation 11.
The parameters a∼f in Equation 10 can be represented by Equation 12. iRi denotes the current flowing through the polarization resistor Ri, and i denotes the current flowing through the shunt dry circuit in amperes.
3 Electric–thermal coupling model parameter identification
3.1 Parameter identification method
The particle swarm algorithm-based parameter identification of the electro-thermal coupling model aims to minimize the fitness function value. A smaller f(x) value indicates higher accuracy in the identification results. The fitness function is expressed as shown in Eq. 13.
where
Step 1: Determine the total battery capacity Cn by the ampere–time integration method during small-current charging and discharging. Then, establish the relationship between the open-circuit voltage Uoc and SOC based on the Uoc and SOC fitting curves.
Step 2: Given a current I, identify the circuit model parameters through pulse discharge experiments under constant temperature and constant conditions.
(1) Utilize Ohm’s law to calculate the abrupt change in terminal voltage when charging and discharging of the battery stops, and determine the ohmic internal resistance R0 for various SOC, temperatures, and current directions.
(2) In each charging and discharging cycle, select an exponential fitting of the charging and discharging voltage rebound curves to solve R1, R2, C1, and C2 under the charging and discharging conditions.
Step 3: Calculate the voltage drops U1 and U2 of the two RC circuits. Then, utilize Uoc and the SOC relation to determine Uoc and obtain the battery terminal voltage Uout.
Step 4: Calculate the battery heat production Q using Uoc and Uout, and input it into the thermal model.
Step 5: Combine the battery heat production Q and the ambient temperature Tf. Fit the battery surface temperature Ts under constant temperature and constant flow. Identify the thermal model parameters Cc, Cs, Rc, and Rs. Meanwhile, estimate the battery core temperature Tc and calculate the average temperature Tm to be transferred to the circuit model.
Step 6: Correct the model parameters in the circuit model that are affected by the temperature based on the average battery temperature, Tm.
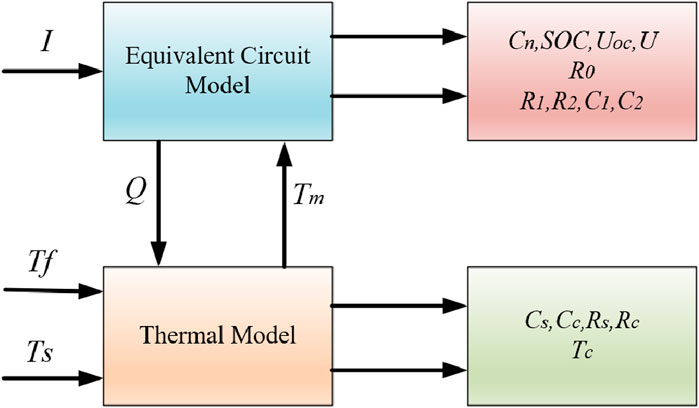
Figure 3. Parameter identification relationship of the electro-thermal coupling model.
3.2 Electrical model parameter identification results
3.2.1 Open-circuit voltage
The characteristic curve of the open-circuit voltage Uoc and SOC is depicted in Figure 4, and the total capacity Cn of the battery can be determined through ampere–time integration for the charging and discharging currents from 100% to 0%. The actual measured capacity of the battery is 2000 mAh. The voltage fitting curve is shown in Figure 5.
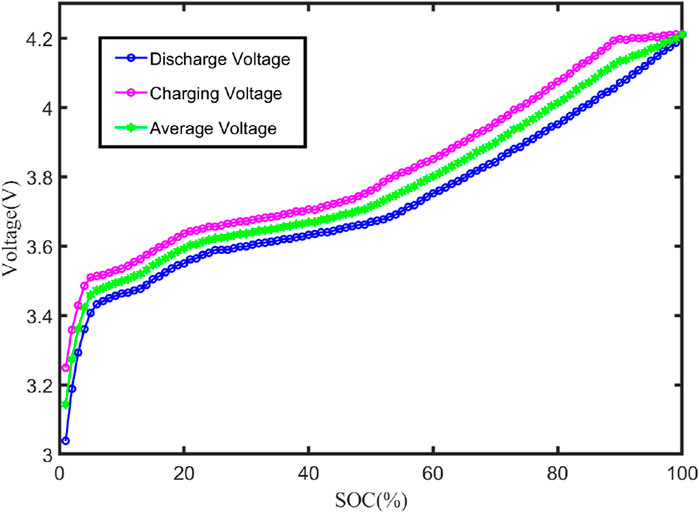
Figure 4. Relationship between the UOC and SOC curve.
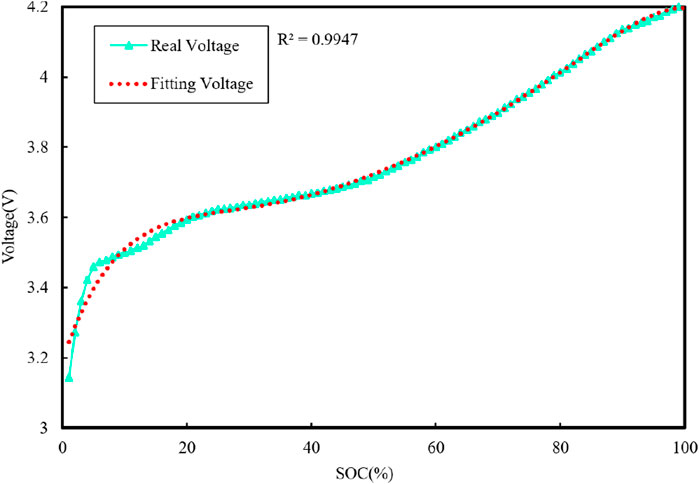
Figure 5. UOC and SOC fitting curve.
From Figure 5, it can be seen that the fitted curve can better reflect the trend of open-circuit voltage change. Therefore, the fitted obtained Uoc relationship with the SOC function can be used later in the process of model parameter identification.
3.2.2
Figure 6 illustrates the variation curves of the terminal voltage of the battery at different temperatures, while Figure 7 displays the variation curves of the current and voltage in a single cycle.
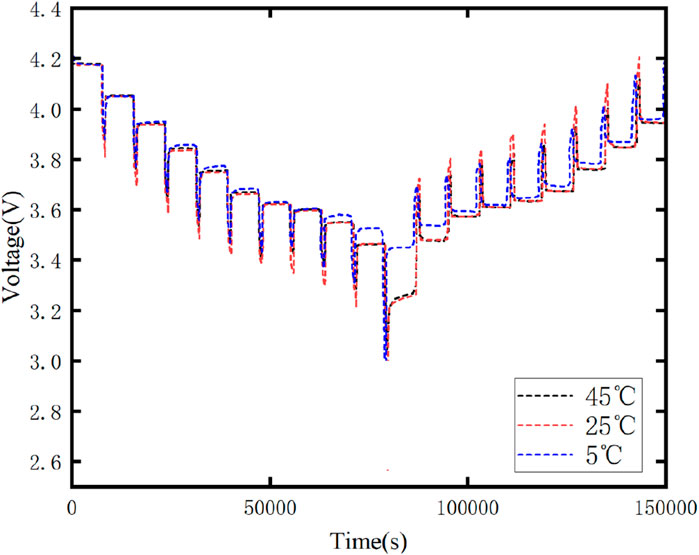
Figure 6. Battery terminal voltage variation curve.
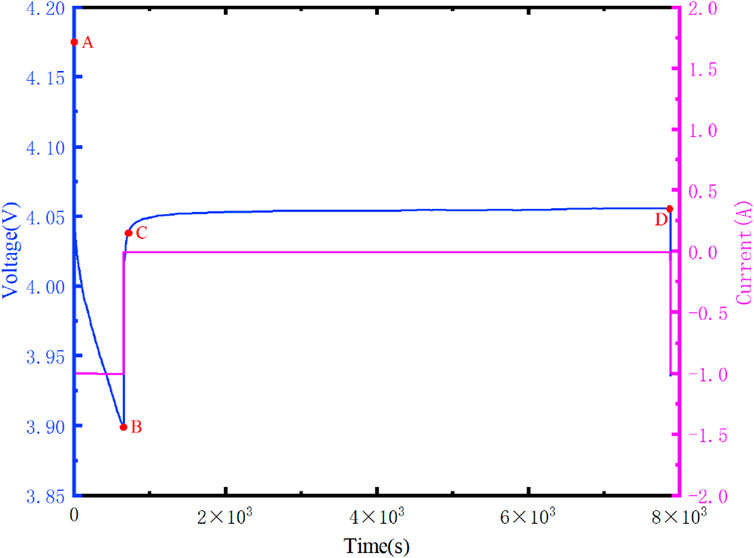
Figure 7. Voltage and current variation curve within a single cycle.
As shown in Figure 7, after the discharge current of the lithium-ion battery reaches zero, its terminal voltage begins to rebound. It remains in a discharge state within segment AB, followed by a prolonged resting period at point B. In the CD segment, the charge on capacitors C1 and C2 gradually decreases over time until it reaches zero. At this point, it can be assumed that the battery is in a balanced state, with the terminal voltage being Uoc. By fitting the voltage curve of the CD segment, we obtain the values of R0, R1, R2, C1, and C2. To determine the actual values of R0, R1, R2, C1, and C2, the experimental measurements need to be coupled with the thermal model parameters identified in Section 3.3. The specific results will be presented in Section 3.4.
3.3 Thermal model parameter identification results
Since Cc, Cs, and Rc are not significantly influenced by changes in the physical properties of the battery, they can be considered constants. Rs is primarily affected by the cooling air speed, which can be maintained at a constant value in the thermal model parameter identification experiment, making Rs also a constant. The battery surface temperature fitting results are depicted in Figure 8, and the thermal model parameter identification can be expressed as follows: Cs = 6.1882J⋅K−1, Cc = 31.9818J⋅K−1, Rc = 4.572K⋅W−1, and Rs = 8.7K⋅W−1.
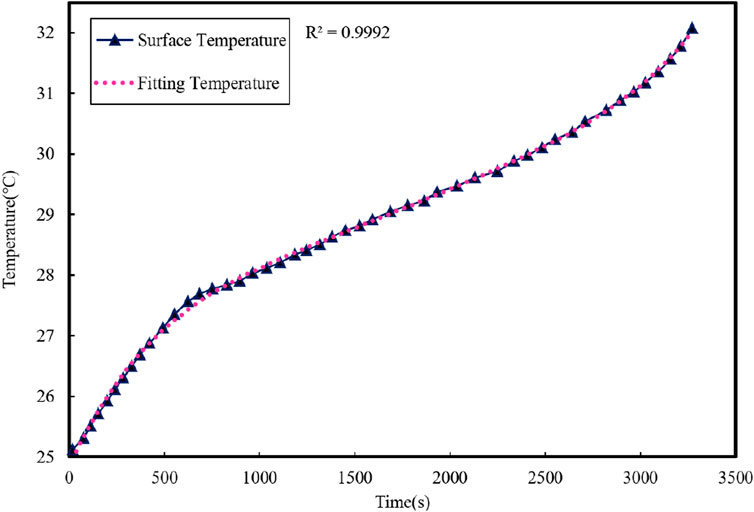
Figure 8. Fitting curve of the battery surface temperature.
From the graph, it can be seen that the temperature fitting curve better reflects the changing trend of the battery surface temperature. Therefore, the estimated thermal model parameters can be used in the subsequent identification process of the coupled model parameters.
3.4 Electro-thermal coupling model parameter identification results
3.4.1 Ohm internal resistance
Figure 9 displays the curves versus SOC and temperature.
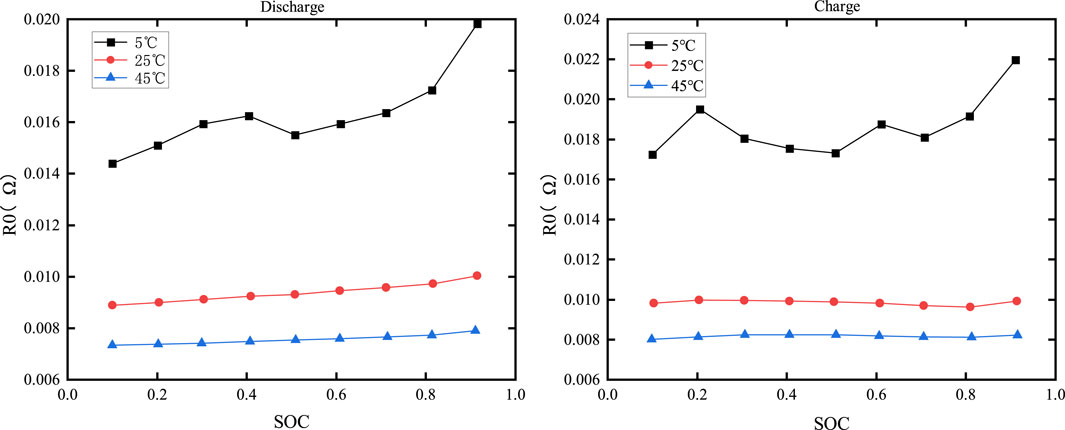
Figure 9. Relationship curve between R0 and temperature and SOC.
From the figure, it can be seen that the dependence of R0 on SOC during charging and discharging is minimal, while temperature has a more significant impact on R0. At the same SOC, lower temperatures result in higher internal resistance of the battery. This is attributed to the reduced electrochemical activity of the electrode and electrolyte materials at lower temperatures, which impedes the chemical reaction within the battery.
3.4.2 Polarized internal resistance
The relationship curves between R1 and temperature and SOC are shown in Figure 10, while the relationship curves between R2 and temperature and SOC are shown in Figure 11.

Figure 10. Relationship curve between R1 and temperature and SOC.
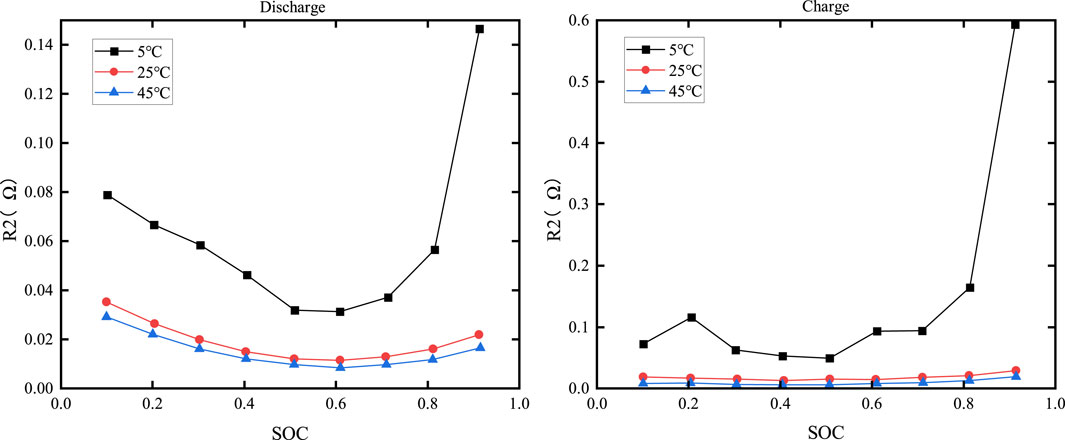
Figure 11. Relationship curve between R2 and temperature and SOC.
From Figures 10, 11, it can be observed that when the SOC is fixed, values of R1 and R2 decrease as the temperature rises. At the same temperature, the relationship between the charging resistance and the discharging resistance with respect to SOC is completely opposite. The charging resistance is higher when the SOC is higher, while the discharging resistance is higher when the SOC is close to zero.
3.4.3 Polarization capacitance
The electrochemical polarization capacitance C1 versus SOC and temperature is shown in Figure 12, while the concentration polarization capacitance C2 versus SOC and temperature is depicted in Figure 13.
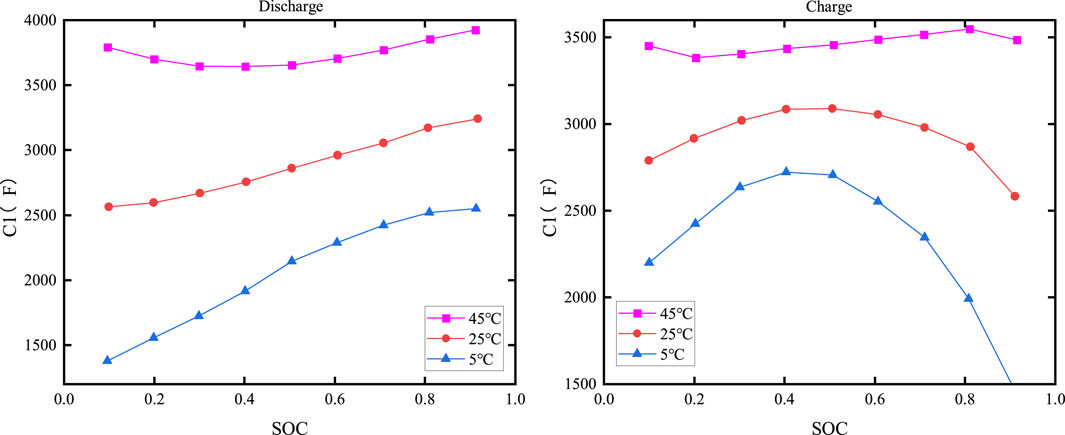
Figure 12. Relationship curve between C1 and temperature and SOC.
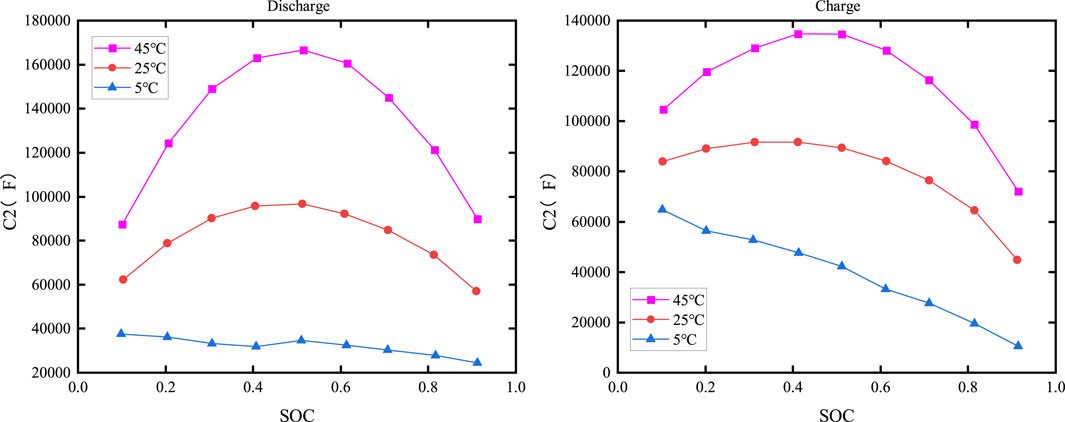
Figure 13. Relationship curve between C2 and temperature and SOC.
As shown in Figures 12, 13, the capacitance is clearly dependent on both the temperature and SOC. When the temperature is constant, C1 increases with increasing SOC during discharge, but its value changes slowly when SOC is low or moderate; it then drops sharply as the temperature decreases when SOC is high. The relationship between C2 and SOC is more complex, with similar charging and discharging characteristics.
4 The lithium-ion battery energy storage power station model
4.1 Structure of the energy storage power station
Lithium-ion battery energy storage power stations generally adopt a containerized arrangement scheme. Each container serves as an energy storage subsystem, which mainly consists of a battery compartment, a power conversion system (PCS), and a converter transformer (Sun, 2018). The battery compartment is a crucial component for energy storage in power stations, and its capacity expansion is primarily achieved through the series/parallel connection of individual batteries. The battery compartment comprises multiple battery clusters connected in parallel, with each cluster consisting of multiple batteries or modules connected in series. The battery compartment is linked to the DC side of the power electronic converter through a DC switch and then elevated to the designated voltage by a comprehensive PCS and a converter transformer. The structure is shown in Figure 14.
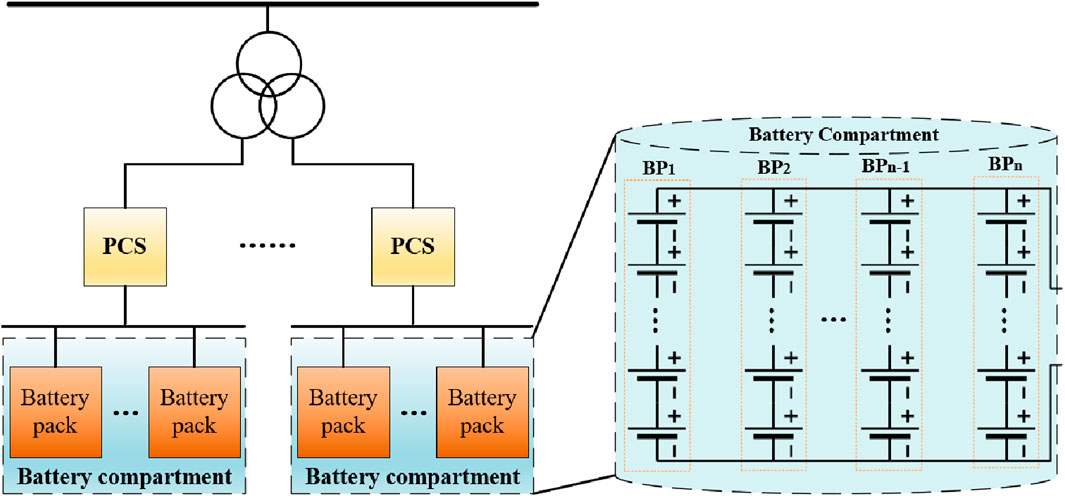
Figure 14. Structure of the energy storage power station.
Generally, connecting single cells or modules in series can increase the terminal voltage of the battery compartment. When connected in parallel, the capacity of the battery compartment can be increased, and the maximum discharge current can also be increased. Therefore, by connecting single cells or modules in series/parallel, the energy exchange capacity between the battery compartment and the outside can be increased (Zhao et al., 2022; Zhou et al., 2022). Theoretically, any form of battery compartment can be reduced to a series or parallel structure. Each cluster can be formed by series/parallel connection of multiple individual cells or modules and vice versa. Therefore, the battery compartment can be equated with the circuit characteristics, using S for series and P for parallel. The equivalent result is shown in Figure 15.
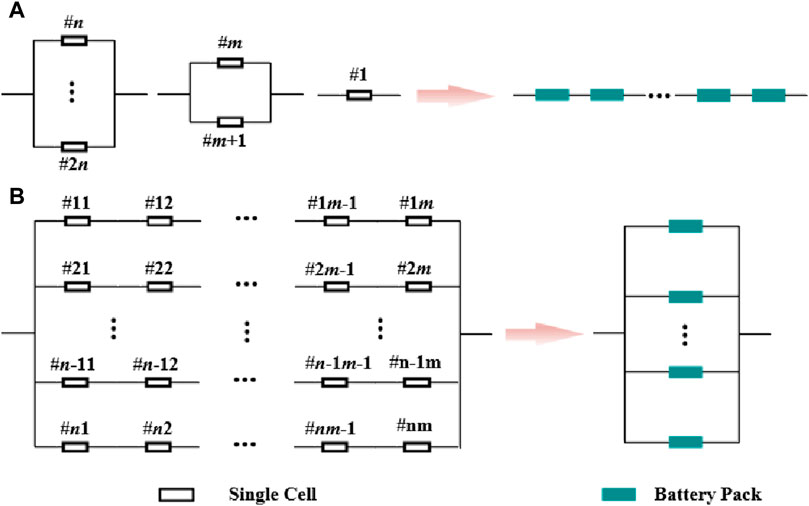
Figure 15. Equivalent battery compartment structure. (A): Aeries equivalent; (B): Parallel equivalent.
4.2 Series-connected battery compartment model
As shown in Figure 16, it is assumed that the series-type battery compartment consists of n single cells connected in series.
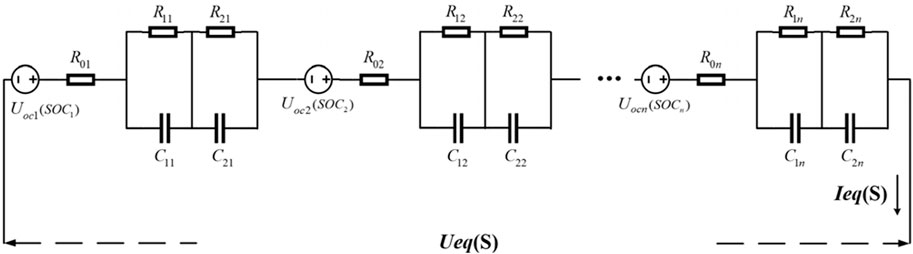
Figure 16. Series-type battery compartment.
In a series-connected battery compartment, the discharge current of each series-connected single cell or module is equal and determined by the load. However, the terminal voltage is not constant and varies non-linearly with the discharge current. In a parallel connection-type battery compartment, the terminal voltage of each parallel single cell or module is equal, but the discharge current is not equal.
4.2.1 Terminal voltage and current calculation
According to the principles of series circuit connections, the terminal voltage and current of the series-connected battery compartment can be determined as shown in Eq. 14.
Here, IeqS and UeqS represent the current and terminal voltage of series-connected battery compartments, respectively; I1(t) ∼ In(t) and U1(t) ∼ Un(t) indicate the current and voltage of the individual cells, respectively.
Considering the inconsistency of individual cells, the operational status of the battery compartment during discharge is typically determined by the cell with the lowest performance. For instance, the cell with the smallest capacity may be the first to reach its cutoff voltage and cease discharging. Consequently, the entire battery compartment stops discharging. This implies that the actual total voltage of the compartment equals to the sum of the end voltages of the individual cells before the weakest cell reaches the cutoff voltage under normal operating conditions. This total voltage is usually not equal to the rated cutoff voltage sum. Therefore, Equation 14 can be rewritten as Eq. 15.
Here,
4.2.2 Impedance calculation
According to the principles of series connection in circuits, it can be deduced that the impedance of the battery compartment equals the sum of the impedance of each individual cell.
In the actual production application, each single battery in series and parallel connection undergoes testing and screening. The impedance of each single battery is not exactly equal, but the differences are very small. Assuming that the impedance of each single battery is equal, Equation 16 can be rewritten as Eq. 17.
4.2.3 SOC calculation
For series-connected battery compartments, when the battery compartment is discharged, the discharge current and discharge time of each cell are equal to each other, i.e., the charge consumed by each cell is equal in a certain discharge process. However, due to the inconsistency of the battery monomers, there is also the problem that the battery with the weakest performance reaches the cutoff voltage first. Therefore, the SOC of the battery compartment is also equal to the SOC of the weakest performing battery cell, as shown in Eq. 18.
4.3 Parallel-type battery compartment model
As shown in Figure 17, it is assumed that the parallel-type battery compartment consists of n single batteries connected in parallel.
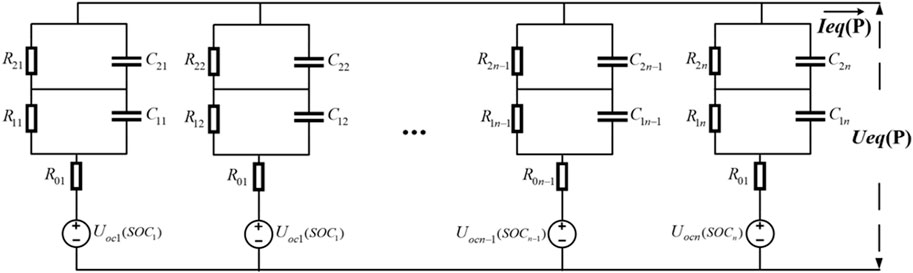
Figure 17. Parallel-type battery compartment.
4.3.1 Terminal voltage and current calculation
According to the principles of parallel circuits, the terminal voltage and current of the parallel battery compartment can be determined as shown in Eq. 19.
Here, IeqP and UeqP represent the equivalent current and equivalent terminal voltage of the parallel battery compartment, respectively.
Connecting the battery compartment to the load power supply, the current flowing through each battery monomer in each branch circuit may vary due to inconsistencies in the battery monomers. However, because of the equal voltage on both ends of each branch circuit, typically, the output current of the branch with a higher battery SOC (corresponding to a lower internal resistance) is greater. This continues until the currents of all branches tend to equalize when the SOC of each branch circuit battery is the same.
4.3.2 Impedance calculation
The impedance of each individual cell is shown in Eq. 20.
According to characteristics of a parallel circuit, the impedance of the battery in parallel can be calculated as shown in Eq. 21.
In the actual production application, each single battery in series and parallel connection undergoes testing and screening. The impedance of each single battery is not exactly equal, but the differences are very small. Assuming that the impedance of each single battery is equal, Equation 21 can be rewritten as Eq. 22.
4.3.3 SOC calculation
In a parallel system, when a single cell in a branch circuit reaches the cut-off voltage and stops discharging, it does not affect the power supply of the single cells in other branches. Therefore, under normal circumstances, the discharging charge of the battery compartment should be equal to the sum of the discharging charges of the single cells in each branch circuit, which is obtained as Eq. 23.
Here, SOCp0 is the initial value of the parallel battery compartment and Q0i is the rated capacity of the individual battery i.
Based on the above analysis, the equivalent circuit model of a series/parallel type battery compartment can be obtained, as shown in Figure 18.
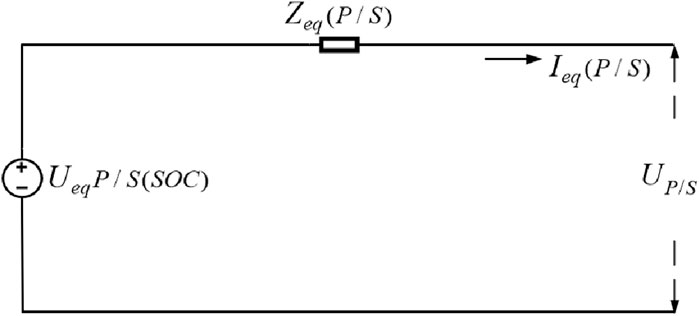
Figure 18. Series/parallel-type battery compartment.
According to the circuit theory, any battery compartment can be represented as either a series or parallel structure. Similarly, a series/parallel battery compartment can be converted into either a series or parallel battery compartment. Conversely, series/parallel battery compartments can be merged into series/parallel battery compartments in various configurations. Thus, core concept of modeling series/parallel battery compartments is to simulate series or parallel battery configurations.
5 Model validation
5.1 Validation of the energy storage power station model
According to the experience gained from the actual construction of the project, considering both representativeness and cost issues, the series–parallel type (first series and then parallel) model was chosen (Zhang et al., 2012). The battery compartment model of the series/parallel type was then simulated using the MATLAB/Simulink environment, and the simulation results were compared with the experimental data.
The model connection is shown in Figure 19. The branch where batteries 1, 2, and 3 are located is defined as branch I; the branch where batteries 4, 5, and 6 are located is defined as branch II; and the branch where batteries 7, 8, and 9 are located is defined as branch III.
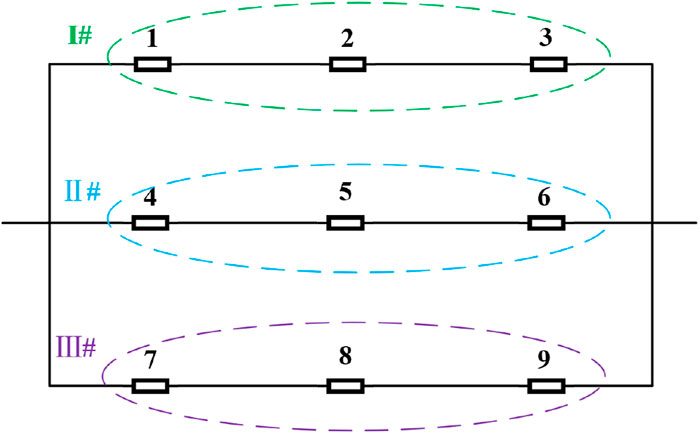
Figure 19. Series/parallel battery compartment structure.
Figure 20 illustrates the variations in voltage and current of parallel-connected battery cells in the battery compartment during constant current discharge. The initial SOC of cells in branch I are 0.98, 1, and 1, respectively. The initial SOC of cells in branch II are 0.94, 1, and 1, respectively. The initial SOC of cells in branch III are 0.90, 1, and 1, respectively.
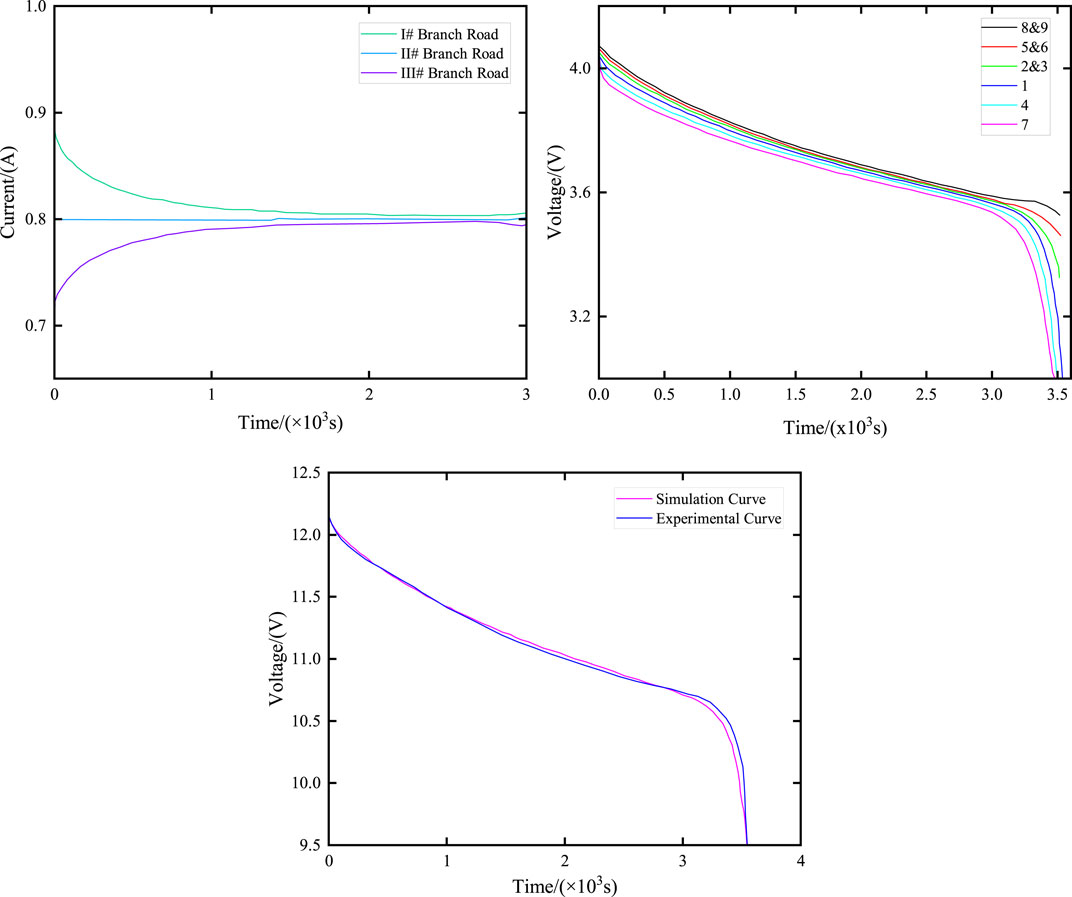
Figure 20. Changes in the current and terminal voltage of series/parallel battery compartments. (A) Current curves of different branches with different initial SOC; (B) Voltage curves of each battery at different initial SOC; (C) Voltage curve of battery compartment terminal at different initial SOC.
Figure 20 illustrates the voltage and current variations in parallel battery cells in the battery compartment during constant current discharge when the initial SOC of each branch cell is different. Specifically, the initial SOC of branch I cells are 0.98, 1, and 1, respectively; the initial SOC of branch II cells are 0.94, 1, and 1, respectively; and the initial SOC of branch III cells are 0.90, 1, and 1, respectively.
As illustrated in Figure 20A, due to the different initial SOC, in order to maintain the same voltage at the end of each branch, the current flowing through each branch varies. In Figure 20B, the battery with the lowest SOC (No. 7) reaches the cutoff voltage first, marking the end of its discharge. However, the battery compartment continues discharging until the battery with the lowest SOC in branch I also reaches the cutoff, concluding the discharge process for all branches and the battery compartment. Figure 20C presents a comparison between the simulation results and experimental data regarding the end voltage of the battery compartment. The battery compartment ceases discharging as individual cells in each branch complete their discharge, leading to an increase in the actual cutoff voltage of the battery compartment (approximately 9.5 V). The close alignment of the simulation prediction data with the experimental data confirms the accuracy of the energy storage power station model.
5.2 Validation of the electro-thermal coupling model
Based on the dual Kalman filter algorithm, the current and voltage data on the value storage power station obtained in Section 5.1, along with the collected surrounding temperature data and surface temperature data on the storage power station, are used as inputs to the electro-thermal coupling model. The following results were obtained by simulating and verifying in MATLAB.
Figure 21 illustrates the comparison curve between the estimated SOC and the true SOC using the dual Kalman filter. Figure 22 displays the SOC error curve, indicating that the SOC error of the energy storage station is close to 0. Figure 23 presents the comparison curve between the estimated surface temperature and the true surface temperature of the energy storage station. Figure 24 shows the surface temperature error curve, with the error ranging between −0.5°C and 0.5°C. Figure 25 depicts the comparison curve between the estimated core temperature and the estimated surface temperature of the energy storage station. It is evident that the core temperature of the energy storage station is significantly higher than the surface temperature during operation, reaching a maximum temperature close to 46°C. The trends in core temperature and surface temperature changes are consistent, aligning with the actual operating temperature range of lithium-ion batteries.
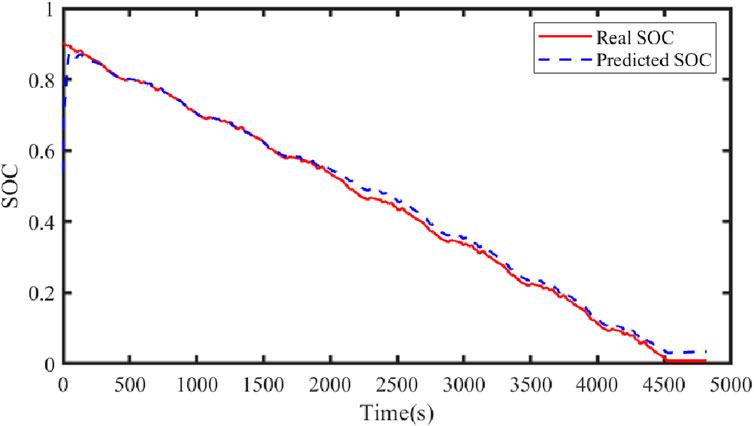
Figure 21. Predicted SOC and true SOC curves.
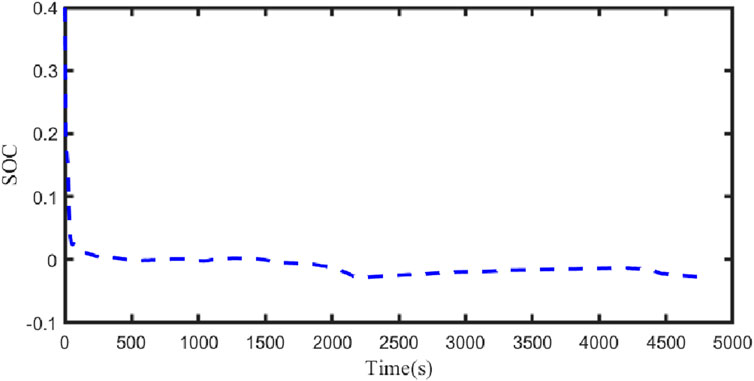
Figure 22. SOC error curve.
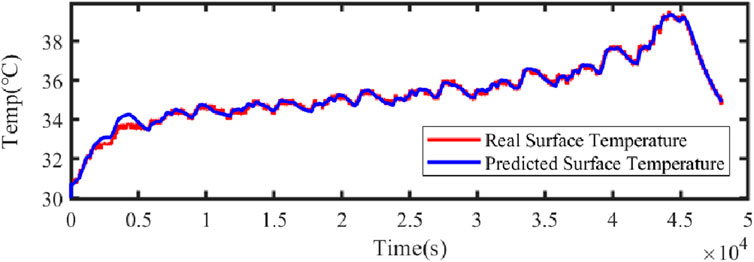
Figure 23. Predicted surface temperature versus actual temperature.
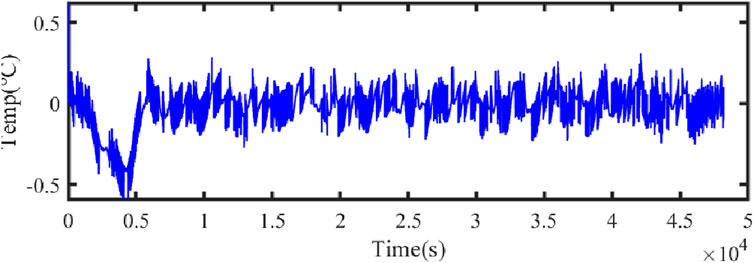
Figure 24. Surface temperature error.
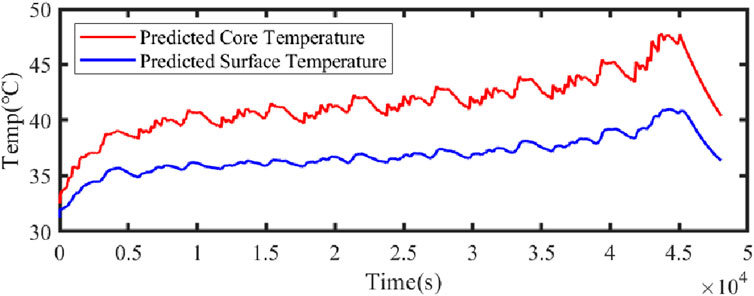
Figure 25. Predicted surface temperature and core temperature.
6 Conclusion
In this paper, a modeling method for electro-thermal coupling of an energy storage power station considering the characteristics of the battery body is proposed.
(1) On the basis of the second-order lithium-ion battery equivalent circuit model, considering the influence of temperature on the battery’s performance, the equivalent circuit model and the lithium-ion battery thermal model are coupled through heat and average temperature to establish an electro-thermal coupling model.
(2) Based on the particle swarm algorithm, the parameters of the electro-thermal coupling model are identified through a series of steps. First, the relationship between Uoc and SOC is determined, and the fitted curve can better reflect the trend of the open-circuit voltage Uoc. Second, the parameters of the equivalent circuit model are identified through pulse charge/discharge cycling experiments at a constant temperature. Subsequently, the parameters of the thermal model are fitted by calculating the heat production of the batteries during constant-current discharge experiments with different values to identify the parameters of the electro-thermal coupling model. Finally, the electric–thermal coupling model parameters are obtained.
(3) The system composition of the energy storage power station is analyzed. The series–parallel model of the battery compartment of the energy storage power station is established using the circuit series–parallel characteristic equivalence and verified in the MATLAB/Simulink environment. Finally, the dual Kalman filter algorithm is employed to simulate and verify the electric–thermal coupling model of the energy storage station, considering the characteristics of the battery voltage, current, and temperature of the station. The results indicate that the model can accurately predict the performance parameters of the storage station. This prediction can support the participation of the storage system in power system peak shifting and frequency regulation, ensuring the safe and stable operation of the energy storage system.
Data availability statement
The original contributions presented in the study are included in the article/Supplementary Material; further inquiries can be directed to the corresponding author.
Author contributions
MW: methodology, writing–original draft, and writing–review and editing. PJ: methodology and writing–original draft. WW: formal analysis and writing–original draft. ZX: supervision and writing–original draft. JC: writing–review and editing, methodology, and software. HD: visualization and writing–original draft.
Funding
The author(s) declare that financial support was received for the research, authorship, and/or publication of this article. This research was funded by the State Grid Gansu Electric Power Company’s Scientific and Technological Project (SGGSZY00HLJS2310701).
Acknowledgments
The authors would like to express their heartfelt thanks to all the leaders and colleagues of the State Grid Gansu Provincial Power Company Science and Technology Project “Research on Electric Power Quality Control.” The authors would like to express their heartfelt thanks to all the leaders and colleagues of the State Grid Gansu Electric Power Company Science and Technology Project “Research on Active Support Technology and Profit Mode of Participating in Market Service of Grid-Connected Electrochemical Energy Storage Power Station with High Percentage of New Energy Large Delivery Terminal” (Contract No. SGGSZY00HLJS2310701).
Conflict of interest
Authors MW, PJ, WW, and PJ were employed by Zhangye Branch of the Gansu Electric Power Corporation State Grid Corporation of China, Zhangye.
The remaining authors declare that the research was conducted in the absence of any commercial or financial relationships that could be construed as a potential conflict of interest.
The authors declare that this study received funding from the State Grid Gansu Power Company. The funder was involved in the study: data collection, methodological guidance, and writing the original draft.
Publisher’s note
All claims expressed in this article are solely those of the authors and do not necessarily represent those of their affiliated organizations, or those of the publisher, the editors, and the reviewers. Any product that may be evaluated in this article, or claim that may be made by its manufacturer, is not guaranteed or endorsed by the publisher.
Supplementary material
The Supplementary Material for this article can be found online at: https://www.frontiersin.org/articles/10.3389/fenrg.2024.1433797/full#supplementary-material
References
Basu, S., Hariharan, K. S., Kolake, S. M., Song, T., Sohn, D. K., and Yeo, T. (2016). Coupled electrochemical thermal modelling of a novel Li-ion battery pack thermal management system. Appl. Energy 181, 1–13. doi:10.1016/j.apenergy.2016.08.049
Chao, L., Lai, Q., Wang, L., Li, Q. F., and Cong, W. (2017) “A healthy charging method based on estimation of average internal temperature using an electrochemical-thermal coupling model for LiFePO4 battery[C],” in Prognostics and system health management conference.
Chen, S. J., and Zhao, Z. D. (2020). “Modeling and simulation of a new ternary lithium battery based on the 2nd-order equivalent circuit model,” in 2019 International Conference on Intelligent Computing, Automation and Systems (ICICAS). Chongqing, China, December 6-8, 2019 (IEEE), 402–405.
Chen, W., Sun, N., Ma, Z. C., Liu, W. F., and Dong, H. Y. (2023). A two-layer optimization strategy for battery energy storage systems to achieve primary frequency regulation of power grid. Energies 16 (6), 2811. doi:10.3390/en16062811
Ding, M., Xu, N. Z., Bi, R., Chen, Z. N., Luo, Y. J., and Song, Z. (2011). Comparative performance analysis of three types of battery energy storage power station based on comprehensive modeling. Power Syst. Autom. 35 (15), 34–39.
Forgez, C., Do, D. V., Friedrich, G., Morcrette, M., and Delacourt, C. (2010). Thermal modeling of a cylindrical LiFePO 4/graphite lithium-ion battery. J. Power Sources 195 (9), 2961–2968. doi:10.1016/j.jpowsour.2009.10.105
He, D. W., Zhang, W., and Luo, X. Y. (2020a). Overview of power lithium battery modeling and soc estimation. IOP Conf. Ser. Earth Environ. Sci. 461 (1), 012032. doi:10.1088/1755-1315/461/1/012032
He, J. F., Ge, Y. F., Ge, W. C., Shi, S. J., Fu, Y., Huang, J. W., et al. (2020b). Equivalent simulation model and grid-connected operation characteristics of large-capacity energy storage power station. Power capacitor React. power Compens. 41 (4), 221–227. doi:10.14044/j.1674-1757
He, Y., Liu, X. T., Zhang, C. B., and Chen, Z. H. (2013). Insulation detection algorithm based on power battery pack internal resistance model. J. Jilin Univ. Ed. 43 (5), 1165–1170.
Huang, K. F., Wang, Y., and Feng, J. Q. (2020). “Research on equivalent circuit Model of Lithium-ion battery for electric vehicles,” in 2020 3rd World Conference on Mechanical Engineering and Intelligent Manufacturing (WCMEIM), Shanghai, China, December 4-6, 2020 (IEEE), 492–496.
Lai, X., Huang, Y. F., Gu, H. H., Han, X., Feng, X., Dai, H., et al. (2022). Remaining discharge energy estimation for lithium-ion batteries based on future load prediction considering temperature and ageing effects. energy 238, 121754. doi:10.1016/j.energy.2021.121754
Li, X., Fan, H., and Lin, M. (2013). Thermal management of cylindrical batteries investigated using wind tunnel testing and computational fluid dynamics simulation. J. Power Sources 238 (238), 395–402. doi:10.1016/j.jpowsour.2013.04.073
Liu, X. Y., Xu, S. H., Li, S. J., and Han, X. J. (2021). Modeling and simulation of large-scale energy storage power station based on test standards. Power Supply Technol. 45 (2), 208–213. doi:10.3969/j.issn.1002-087X.2021.02.016
Mahamud, R., and Park, C. (2011). Reciprocating air flow for Li-ion battery thermal management to improve temperature uniformity. J. Power Sources 196 (13), 5685–5696. doi:10.1016/j.jpowsour.2011.02.076
Maosung, W., Changyun, L., Yungyun, W., Wan, C. C., and Yang, C. (2006). Numerical simulation for the discharge behaviors of batteries in series and or parallel-connected battery pack. Electrochimica Acta 52 (52), 1349–1357. doi:10.1016/j.electacta.2006.07.036
Qin, L., Sun, N., and Dong, H. (2023). Adaptive double kalman filter method for smoothing wind power in multi-type energy storage system. energies 16, 1856. doi:10.3390/en16041856
Shi, X. H., Zhao, Y. W., Zhang, H. X., Wang, X. L., and Zhou, B. X. (2021). Smoothing wind power fluctuation control method for battery energy storage system based on quasi-zero phase filter. Power Syst. Autom. 45 (4), 45–53. doi:10.7500/AEPS20191227007
Sun, N. (2018). Research on equivalent modeling method of battery energy storage power station [D]. Northeast Electric Power University.
Wang, H. H., Tang, Y., Hou, J. X., Zou, J. F., Liang, S., and Su, F. (2011). Combined modeling and equivalence of wind-solar-storage co-generation systems. Chin. J. Electr. Eng. 31 (34), 1–9. doi:10.13334/j.0258-8013.pcsee.2011.34.023
Wei, K. X., and Chen, C. Y. (2012). Electric vehicle battery charge state estimation based on multi-model adaptive Kalman filter. Chin. J. Electr. Eng. 32 (31), 19–26. doi:10.13648/j.cnki.issn1674-0629.2022.04.004
Wu, X. H., and Zhang, X. D. (2020). Parameter identification of second-order RC equivalent circuit model for lithium battery. J. Nanjing Univ. Sci. 56 (5), 754–761. doi:10.13232/j.cnki.jnju.2020.05.015
Wu, X. Y., Chen, M. Y., Li, H. H., Cui, Y. L., and Liang, J. M. (2023). Research on thermal management technology of lithium-ion battery based on graphene phase change material. China Test. 49 (5), 1–8. doi:10.11857/j.issn.1674-5124.2021080040
Yang, J., Wang, T., Du, C. Y., Min, F. Q., Lv, T. L., Zhang, Y. X., et al. (2019). A review of lithium-ion battery modeling research. Energy Storage Sci. Technol. 8 (1), 58–64. doi:10.12028/j.issn.2095-4239.2018.0143
Zhang, B., Guo, L. T., Li, H. Y., Chen, Q. S., and Cui, Z. B. (2009). PNGV model analysis of lithium iron phosphate batteries for electric vehicles. Power Supply Technol. 33 (5), 417–421.
Zhang, W. G., Shi, W., Jiang, J. C., Jiang, J., Zhang, C. P., and Sun, B. X. (2012). Study on series-parallel connection simulation technology of power lithium-ion battery. Grid Technol. 36 (10), 70–75. doi:10.13335/j.1000-3673.pst.2012.10.021
Zhang, Z. G., and Kang, C. Q. (2022). Challenges and prospects of building a new power system under the carbon neutral goal. Chin. J. Electr. Eng. 42 (8), 2806–2819. doi:10.13334/j.0258-8013.pcsee.220467
Zhao, B. C., Li, M., Zhang, W. Y., Liu, H. Y., Zhu, Z. Y., and Dai, J. G. (2022). Design of energy storage evaluation platform for large-capacity electrochemical energy storage power station. Glob. Energy Internet 5 (04), 356–364. doi:10.19705/j.cnki.issn2096-5125.2022.04.006
Keywords: lithium-ion battery, energy storage station, electro-thermal coupling model, parameter identification, SOC
Citation: Wang M, Jia P, Wei W, Xie Z, Chen J and Dong H (2024) Electro-thermal coupling modeling of energy storage station considering battery physical characteristics. Front. Energy Res. 12:1433797. doi: 10.3389/fenrg.2024.1433797
Received: 16 May 2024; Accepted: 27 June 2024;
Published: 08 August 2024.
Edited by:
Zhou Wu, Chongqing University, ChinaReviewed by:
Kuan Cheng, University of Houston, United StatesXiao Sun, Northeastern University, United States
Copyright © 2024 Wang, Jia, Wei, Xie, Chen and Dong. This is an open-access article distributed under the terms of the Creative Commons Attribution License (CC BY). The use, distribution or reproduction in other forums is permitted, provided the original author(s) and the copyright owner(s) are credited and that the original publication in this journal is cited, in accordance with accepted academic practice. No use, distribution or reproduction is permitted which does not comply with these terms.
*Correspondence: Haiying Dong, aHlkb25nQG1haWwubHpqdHUuY24=