 Zhang Shuoting
 Dong Jianhua
94% of researchers rate our articles as excellent or good
Learn more about the work of our research integrity team to safeguard the quality of each article we publish.
Find out more
ORIGINAL RESEARCH article
Front. Energy Res. , 21 August 2024
Sec. Nuclear Energy
Volume 12 - 2024 | https://doi.org/10.3389/fenrg.2024.1432836
This article is part of the Research Topic Numerical and Experimental Studies on Small/Micro Nuclear Reactors, Volume II View all 3 articles
The prismatic gas-cooled micro reactor core is composed of graphite prismatic blocks with gaps between them. The coolant passes through the gap to form flows that affect the flow and temperature distribution of the core. Conventionally, computational fluid dynamics methods have been used for prismatic gas-cooled reactor core analysis. However, they require considerable computational time and cost. For rapid and accurate calculation, in this study, a flow and heat transfer network analysis method is developed for evaluation of the core flow and temperature distribution. Finally, the calculated results of the flow heat transfer network analysis method are compared with the calculated results of computational fluid dynamics. The results show that the results of the flow heat transfer network analysis method are in good agreement with the results of computational fluid dynamics.
The very high-temperature reactor (VHTR) is one of the Generation-IV reactors, which is a graphite-moderated, helium-cooled reactor with a thermal neutron spectrum. A major potential benefit of the VHTR is achieved for electricity production and industrial processes. The prismatic block reactor is one of the main types of VHTRs, featuring hexagonal graphite fuel blocks in the core (GIF, 2014; Rousseau et al., 2019). Due to the assembly process, neutron radiation, and thermal expansion deformation, the deformation of the graphite blocks causes variations in the gaps, which leads in fluctuations in the coolant outlet temperature (Olson et al., 1982; Kim and Lim, 2011).
Johnson and Sato (2012) modeled 1/12th of a GT-MHR fuel assembly, and Yoon et al. (2013) modeled 1/12th of a core. Both groups used the CFD code and accounted in explicit 3D detail for the fuel compacts, coolant channels, and the bypass gaps. However, they require substantial computational cost and time. Due to the requirement for multiple designs and calculations during core design, the CFD code cannot fulfill the needs.
GAMMA+, as a system thermal-fluid analysis code, has relatively low computational cost and time. However, the gaps are grouped and simplified (Kim and Lim, 2011). FLOWNET is a finite volume-based system simulation software code used to calculate the gas flow rates and temperatures. However, the fuel assembly is overly simplified (Maruyama et al., 1994). The FastNet code simplifies the effects of gap thermal convection and thermal radiation (Lee et al., 2018; Lee et al., 2019). Thus, their accuracy is relatively low.
This paper presents a model for three-dimensional flow and heat transfer within the core of a prismatic gas-cooled core reactor, and it also compares its results with those from the computational fluid dynamics code. The aim of this model is to calculate the flow and temperature distributions accurately and efficiently. The research has conducted three-dimensional flow and heat transfer calculations for the core by integrating equations for fluid mass conservation, momentum conservation, and energy conservation, along with the core’s geometry, to obtain solutions for the flow field and temperature field. By transforming the complex core flow channels into a three-dimensional fluid network, the model eliminates the need for complex modeling and discretization, thereby enhancing the design efficiency. Furthermore, this model is versatile and can be used for the thermal-hydraulic design and safety assessment of all prismatic gas-cooled reactor cores.
The flow module of the flow and heat transfer network analysis method to the core of a prismatic gas-cooled reactor (CNet) follows the principle of mass conservation. This principle dictates that the increase in fluid mass at a node over a unit of time is equal to the net mass flowing into the node during that same time period. Given that the model considers the steady-state flow, the increase in fluid mass at a node over a unit of time should be zero. Consequently, for any node, the total mass of fluid flowing into and out of the node over a unit of time must sum to zero. The mass conservation equation for node j can be expressed as Equation 1.
where
The flow module of the CNet follows the principle of momentum conservation. This principle dictates that the rate of increase in fluid momentum within a node is equal to the sum of the various forces acting on the node. For a closed flow loop, momentum conservation indicates that the total pressure drop around the flow loop is zero. For loop k can be expressed as Equation 2.
where N is the total number of pipes,
The flow inside an individual coolant channel can be roughly assumed to flow in a circular pipe, and the flow resistance coefficient for flow loss can be represented by Equation 3.
where L is the height of the fuel block,
Considering the actual conditions of the coolant channels, where the Reynolds number exceeds 5000, indicating the turbulent flow, and the coolant channel walls are rough, the friction factor for the coolant channel can be expressed using an empirical formula (Colebrook, 1939), as depicted in Equation 4.
where Re is the Reynolds number, K is the roughness, and
A bypass gap exists between fuel blocks, and this flow can be roughly regarded as the flow between parallel plates. The flow resistance coefficient for flow loss for the bypass gap is represented by Equation 5.
where
Inside the fuel block, heat is transferred through thermal conduction. As shown in Figure 1, in the radial direction, the heat transferred from node i to node j per unit time is expressed by Equation 6.
where
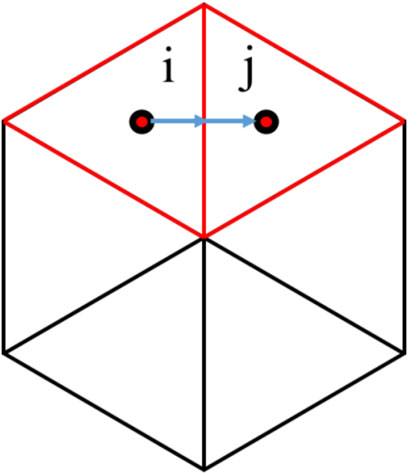
Figure 1. Thermal conduction within a fuel block.
When the gap between the layers of the fuel block is neglected, in the axial direction, the energy transferred from node z to node z + 1 between two layers of fuel blocks is expressed by Equation 7.
where
Within the coolant channel or gap, there is convective heat transfer between the coolant and the graphite wall. The convective heat transfer over a unit of time is expressed by Equation 8.
where
As shown in Figure 2, the radiation heat transferred between fuel blocks over a unit of time is expressed as Equation 9.
where
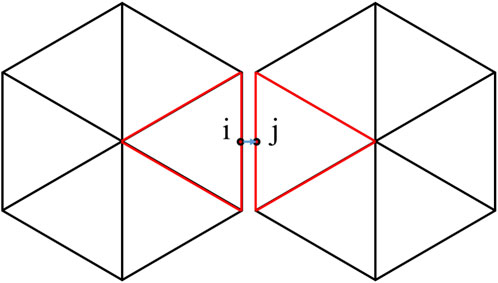
Figure 2. Thermal radiation between fuel blocks.
The maximum fuel temperature is a crucial parameter in the thermal-hydraulic analysis of the core. The decay heat of the fuel is split into two parts: one part is carried away by the coolant within the coolant channels, and the other part is carried away by the bypass flow, as depicted in Equation 10.
where
To analyze the temperature change caused by the heat carried away by the coolant within the coolant channels, a fuel temperature unit cell is defined, which includes fuel pellets, fuel gaps, graphite, and coolant channels, and its heat transfer process is thoroughly analyzed. Each fuel rod is surrounded by six coolant channels, and several such cyclic structures make up the fuel block. Therefore, a fuel temperature unit cell is extracted from this cyclic structure for detailed heat transfer analysis, as shown in Figure 3.
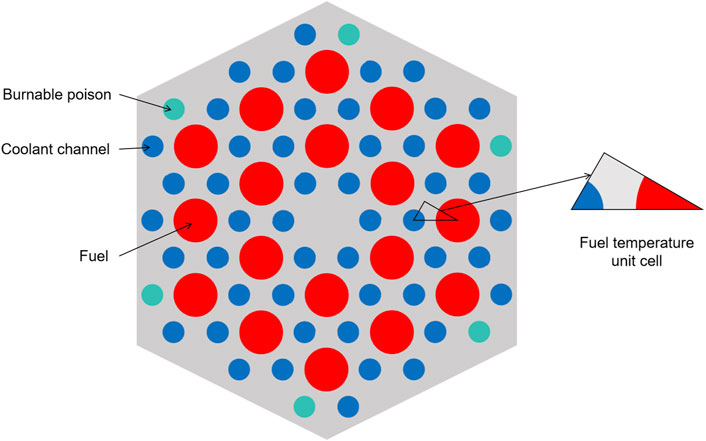
Figure 3. Fuel temperature unit cell.
Each fuel block contains 18 fuel channels and 48 coolant channels. In the fuel temperature unit cell, 1/12 of a fuel rod corresponds to 2/9 of a coolant channel, as depicted in Equation 11.
where
The heat conduction process from the coolant channel wall to the fuel channel wall within the graphite can be roughly approximated as a heat conduction process in a rectangle. The long side of this rectangle represents the shortest distance from the coolant channel wall to the fuel channel wall, while the short side is 1/12 of the perimeter of the fuel channel wall, corresponding to the surface area of the fuel channel wall. The temperature at the fuel channel wall is expressed by Equation 12.
where
The heat transfer process from the fuel channel wall to the fuel compact within the fuel channel gap can be considered an equivalent to the heat conduction between two parallel surfaces. This temperature at the fuel compact surface is represented by Equation 13.
where
The heat transfer process within the fuel compact can be approximated as cylindrical heat conduction, and the temperature at the center of the fuel is expressed by Equation 14.
where
The maximum temperature difference within the fuel temperature unit cell is the temperature difference between the center of the fuel and the coolant within the coolant channels, as expressed by Equation 15.
In the fuel temperature unit cell, only the temperature change caused by the heat carried away by the coolant within the coolant channels is considered. The temperature change caused by the heat carried away by the bypass flow should also be considered.
For the impact of the bypass flow, a fuel block is regarded as a whole, and the bypass flow results in a temperature gradient in the radial direction of the fuel block. The heat transfer process of the fuel block is simplified to a cylindrical heat conduction process, with the temperature at the center of the fuel block expressed by Equation 16.
where
The fuel block is divided into six fuel block temperature unit cells for a detailed heat transfer analysis, as shown in Figure 4.
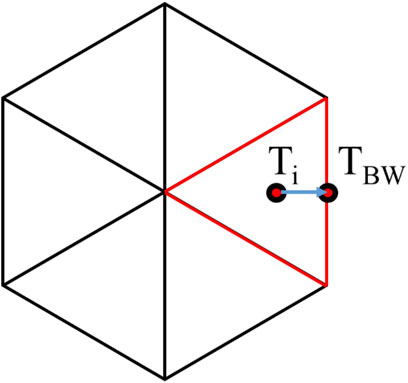
Figure 4. Fuel block temperature unit cells.
The heat transfer from node i to the outer surface boundary of the block is expressed by Equation 17.
where a is the side length of the fuel block.
By solving Equations 16, 17 together and eliminating the temperature of the outer surface of fuel block
The maximum fuel temperature should take into account the effects of both parts above, as expressed by Equation 19.
Using a four-layer fuel block column as an example, a fuel block is divided into six triangular prisms, with each prism corresponding to a heat transfer calculation node. The heat transfer network is shown in Figure 5.
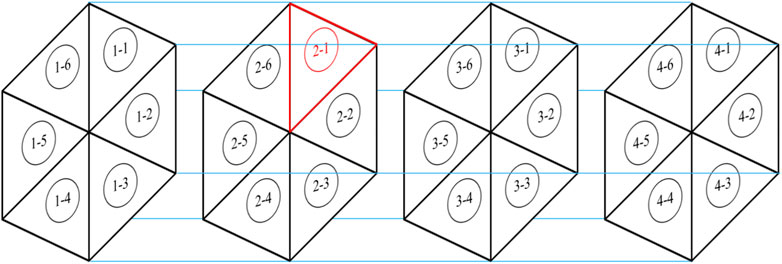
Figure 5. Heat transfer model for a four-layer fuel block column.
The solution steps are as follows.
(1) The inlet temperature of the coolant and the initial temperature of all regions are assigned.
(2) Using the first node of the second layer as an example, the energy conservation equation is represented by Equation 20.
where
(3) The temperature of the graphite is updated, as expressed by Equation 21.
(4) The temperature of the coolant is updated in the coolant channel. The coolant temperature in the coolant channel is calculated layer by layer from the inlet coolant temperature, until the temperature of the coolant in all coolant channels is updated, as expressed by Equation 22.
(5) The temperature of the coolant is updated in the bypass gap. The coolant temperature in the gaps is calculated layer by layer from the inlet coolant temperature in the gaps, until the temperature of the coolant in all gaps is updated.
For each unit of time, the energy of heat conduction from node i to boundary b is expressed by Equation 23.
where
In a unit of time, the energy of convective heat transfer between the bypass flow and boundary b is expressed by Equation 24.
The coolant temperature of the bypass gap is expressed by Equation 25.
(6) The fuel temperature is updated. The maximum fuel temperature is calculated using the fuel maximum temperature model.
(7) The temperature iteration residual in each region is compared with the set value
A single fuel block column analysis is simulated and compared with CFD analysis and CNet results. The calculation model comprised four layers of fuel blocks, with a bypass gap set to 1 mm. The input parameters are as shown in Table 1.
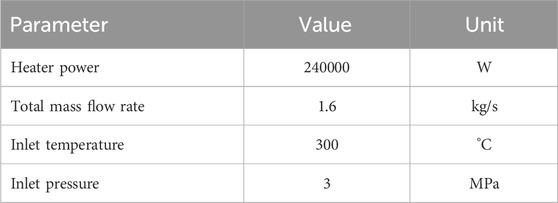
Table 1. Input parameters.
For the CFD turbulence model, the standard k-ε turbulence model with the enhanced wall treatment option is employed to account for turbulence. A hybrid mesh consisting of tetrahedral and prismatic cells is used. The CFD model and mesh are depicted in Figure 6, with a total of 3.17 million cells. The flow boundary conditions for the coolant channels were set as the velocity inlet and pressure outlet, and the boundary surfaces of the calculation domain are set as adiabatic conditions. The coolant is automatically distributed within the coolant channel and the gaps. The results are shown in Table 2.
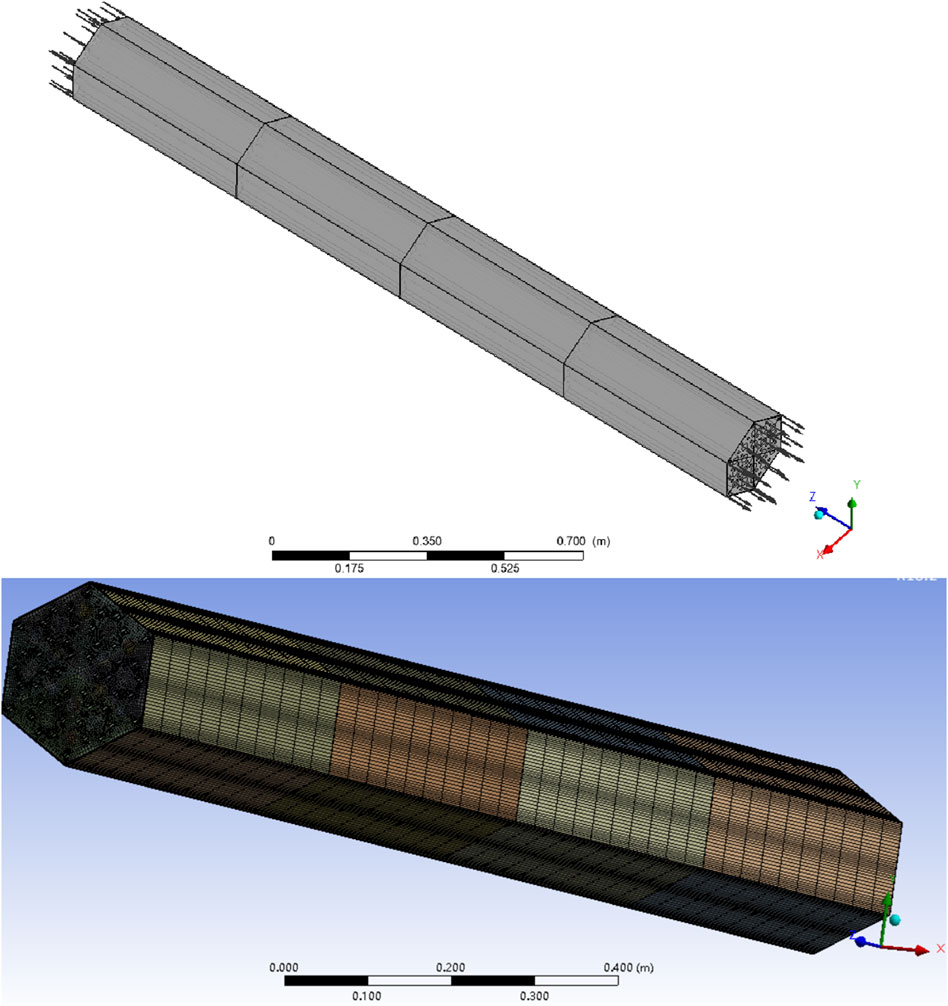
Figure 6. CFD model for a fuel block column.
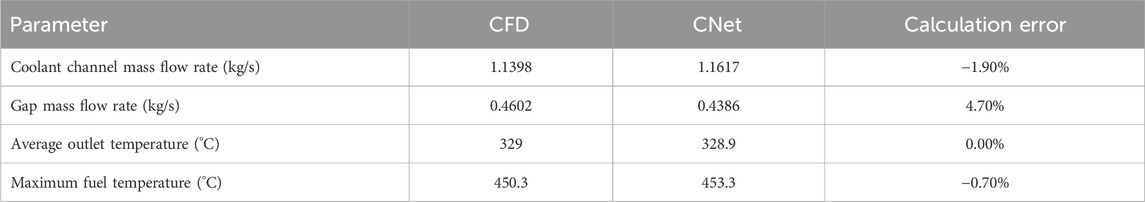
Table 2. Comparison between the CNet and the CFD results.
The flowchart for the CNet calculation is shown in Figure 7, and the steps are as follows.
(1) Read the geometric structure information, initialize the data, and set the boundary conditions.
(2) Perform the flow model calculation. After the internal iteration converges, obtain new flow rates and pressures, which are then passed to the heat transfer model.
(3) Perform the heat transfer model calculation. After the internal iteration converges, obtain new temperatures.
(4) Compare the results of the (n-1)th and the nth iterations. If the residual is greater than
(5) Output the flow rates, pressures, and temperature data.
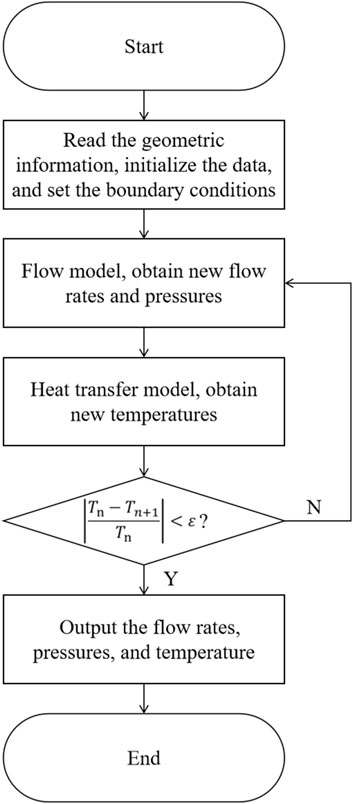
Figure 7. Flowchart for the CNet calculation.
A comparison between the CNet model and the CFD numerical simulation results is shown in Table 2.
The results show that the results of the CNet are in good agreement with the results of CFD.
CNet has a significant advantage in calculation speed. For this case, the calculation time of CNet is approximately 5 s, while the calculation time of CFD is more than 4 h.
This study developed a CNet code for analyzing the thermal-fluid analysis of the prismatic gas-cooled reactor. Using a three-dimensional flow and heat transfer network analysis method, this study achieved rapid and accurate calculations for the flow and the temperature of the prismatic gas-cooled reactor.
To validate the effectiveness of the CNet code, the calculated results are compared with the calculated results of the CFD code. The results indicate that the calculations from CNet are consistent with the results from the CFD code in terms of flow rate and maximum fuel temperature. The maximum fuel temperature calculated by CNet is only 0.7% higher than that of the CFD code. Furthermore, the calculation time for CNet is significantly reduced. Further research will involve adding a transient analysis model, and the developed methods will be applied to the whole core analysis for prismatic gas-cooled reactors.
The original contributions presented in the study are included in the article/Supplementary Material; further inquiries can be directed to the corresponding author.
ZS: Conceptualization, Formal analysis, Methodology, Validation, writing–original draft and writing–review and editing. DJ: Validation, writing–original draft and writing–review and editing. ZZ: writing–original draft and writing–review and editing. HZ: writing–original draft and writing–review and editing. LG: writing–review and editing. CQ: writing–review and editing.
The author(s) declare that no financial support was received for the research, authorship, and/or publication of this article.
Authors ZS, DJ, ZZ, HZ, LG, and CQ were employed by China Nuclear Power Engineering Co Ltd.
All claims expressed in this article are solely those of the authors and do not necessarily represent those of their affiliated organizations, or those of the publisher, the editors, and the reviewers. Any product that may be evaluated in this article, or claim that may be made by its manufacturer, is not guaranteed or endorsed by the publisher.
Colebrook, C. F. (1939). Turbulent flow in pipes, with particular reference to the transition region between the smooth and rough pipe laws. J. Institution Civ. Eng. 11, 133–156. doi:10.1680/ijoti.1939.13150
GIF (2014) “Technology roadmap update for generation IV nuclear energy systems,” in OECD nuclear energy agency for the generation IV international forum. Paris.
Johnson, R. W., and Sato, H. (2012). Bypass flow computations using a one-twelfth symmetric sector for normal operation in a 350 MWth prismatic VHTR. Nucl. Eng. Des. 251, 84–91. doi:10.1016/j.nucengdes.2011.10.070
Kim, M. H., and Lim, H. S. (2011). Evaluation of the influence of bypass flow gap distribution on the core hot spot in a prismatic VHTR core. Nucl. Eng. Des. 241 (8), 3076–3085. doi:10.1016/j.nucengdes.2011.05.009
Lee, J. H., Cho, H. K., and Park, G. C. (2018). Application of three-dimensional looped network analysis method to the core of prismatic very high temperature gas-cooled reactor. Ann. Nucl. Energy 117, 12–24. doi:10.1016/j.anucene.2018.02.039
Lee, J. H., Cho, H. K., and Park, G. C. (2019). Three-dimensional looped network analysis code including core thermal analysis model for prismatic very high temperature gas-cooled reactor. Int. J. Therm. Sci. 143, 76–91. doi:10.1016/j.ijthermalsci.2019.05.013
Maruyama, S., Fujimoto, N., Sudo, Y., Murakami, T., and Fujii, S. (1994). Evaluation of core thermal and hydraulic characteristics of HTTR. Nucl. Eng. Des. 152, 183–196. doi:10.1016/0029-5493(94)90084-1
Olson, H. G., Brey, H. L., and Warembourg, D. W. (1982). The Fort St. Vrain high temperature gas-cooled reactor: X. Core temperature fluctuations. Nucl. Eng. Des. 72 (2), 125–137. doi:10.1016/0029-5493(82)90209-6
Rousseau, P. G., Toit, C. G. D., and Van Antwerpen, H. J. (2019). “CFD and systems thermal-hydraulic analysis in the design and safety assessment of high-temperature reactors,” in Advances of computational fluid dynamics in nuclear reactor design and safety assessment, 755–800.
Keywords: flow network, bypass flow, maximum fuel temperature, prismatic gas-cooled reactor, code V and V
Citation: Shuoting Z, Jianhua D, Zhe Z, Zheng H, Guoming L and Qiaoyan C (2024) Application of flow and heat transfer network analysis method to the core of a prismatic gas-cooled micro reactor. Front. Energy Res. 12:1432836. doi: 10.3389/fenrg.2024.1432836
Received: 14 May 2024; Accepted: 31 July 2024;
Published: 21 August 2024.
Edited by:
Shichang Liu, North China Electric Power University, ChinaReviewed by:
Shenghui Liu, Southeast University, ChinaCopyright © 2024 Shuoting, Jianhua, Zhe, Zheng, Guoming and Qiaoyan. This is an open-access article distributed under the terms of the Creative Commons Attribution License (CC BY). The use, distribution or reproduction in other forums is permitted, provided the original author(s) and the copyright owner(s) are credited and that the original publication in this journal is cited, in accordance with accepted academic practice. No use, distribution or reproduction is permitted which does not comply with these terms.
*Correspondence: Zhang Shuoting, emhhbmdzdGJAY25wZS5jYw==
Disclaimer: All claims expressed in this article are solely those of the authors and do not necessarily represent those of their affiliated organizations, or those of the publisher, the editors and the reviewers. Any product that may be evaluated in this article or claim that may be made by its manufacturer is not guaranteed or endorsed by the publisher.
Research integrity at Frontiers
Learn more about the work of our research integrity team to safeguard the quality of each article we publish.