 Huaizhong Hu1*
 Yanzhao Ma
95% of researchers rate our articles as excellent or good
Learn more about the work of our research integrity team to safeguard the quality of each article we publish.
Find out more
ORIGINAL RESEARCH article
Front. Energy Res. , 05 July 2024
Sec. Sustainable Energy Systems
Volume 12 - 2024 | https://doi.org/10.3389/fenrg.2024.1424389
This article is part of the Research Topic Emerging Technologies for the Construction of Renewable Energy-Dominated Power System View all 32 articles
Due to the fast response characteristics of battery storage, many renewable energy power stations equip battery storage to participate in auxiliary frequency regulation services of the grid, especially primary frequency regulation (PFR). In order to make full use of the battery capacity and improve the overall revenue of the renewable energy station, a two-level optimal scheduling strategy for battery storage is proposed to provide primary frequency regulation and simultaneously arbitrage, according to the peak-valley electricity price. The energy storage output is composed of the droop-based primary frequency regulation output and the economic output, according to the electricity price. First, day-ahead optimization defines the economic output profile and an appropriate droop coefficient, considering regulation needs, with the goal of maximizing the overall return. The scheduling result is then adjusted for hour-ahead optimization based on the updated regulation information to ensure more durable and reliable performance. Simulation results show that the proposed scheduling strategy can fully utilize the battery capacity, realize peak-valley arbitrage while assuming the obligation of primary frequency regulation of the renewable energy power station, and then improve the overall income of the power station.
Nowadays, many countries in the world are vigorously developing renewable energy power generation, such as wind power and photovoltaic (PV) power. Compared with traditional thermal power generation, renewable energy power generation is more environmentally friendly due to the use of clean and renewable energy. However, most renewable energy power units are connected to the grid through inverters, which decrease the inertia and damping of the grid (Xiong et al., 2022). Moreover, renewable energy units often operate in the maximum power tracking mode, which makes it difficult for them to cope with active power instantaneous fluctuations in the grid; in other words, they lack primary frequency regulation (PFR) capability. Related research equips renewable energy units with the primary frequency regulation ability by improving their control algorithms, but they still have certain shortcomings (Mahish and Pradhan, 2020; Li et al., 2021). For instance, wind turbines need to operate at the right speed to participate in PFR (Ma et al., 2024). PV units are mostly involved in PFR through load shedding, which greatly reduces their operating economy (Cristaldi et al., 2022).
Under the above context, the use of the battery energy storage system (BESS) to undertake the primary frequency regulation task of renewable energy power stations has emerged. It is shown that BESS participating in PFR can effectively improve the system frequency (Turk et al., 2019). With the coordination of energy storage and renewable energy power stations, renewable energy units do not need to participate in PFR, and all generated electricity is connected to the grid. BESS utilizes its speed and flexibility to actively respond to primary frequency regulation signals. As more countries start to implement time-of-use electricity pricing policies, BESS can also perform peak shaving and valley filling based on the output of renewable energy generation when its capacity is sufficient. The combination of the renewable energy power station and BESS mentioned above can not only improve the grid-connected characteristics but also further increase the revenue of the integrated station (IS).
A lot of studies have been conducted on BESSs providing PFR services. Zhu and Zhang (2019) divided the PFR control into frequency regulation and state-of-charge (SOC) recovery phases. For frequency regulation, it optimizes the charge and discharge power of the BESS online based on the determined frequency regulation requirements of the grid. Most of the PFR power of BESSs is obtained by a droop-based control mechanism, according to the system frequency difference (Arrigo et al., 2020; Fang et al., 2020; Xiong et al., 2021; Zhao et al., 2022). Most BESSs under droop control set a fixed droop coefficient in their factory settings, but a fixed droop coefficient cannot satisfy various frequency regulation conditions (Xiong et al., 2021). Schiapparelli et al. (2018); Feng et al. (2024) dynamically adjusted the droop coefficient based on the prediction of future system frequency differences or the SOC of BESSs to maintain a long-term reliable operation. The above research mainly focuses on BESSs participating solely in PFR, while the relevant literature has studied BESSs providing multiple auxiliary services, including PFR. Ma et al. (2022) considered a shared BESS performing PFR and automatic generation control (AGC) for multiple renewable energy power stations. This paper only describes the formulation of the hour-ahead optimization strategy and does not involve the content of the day-ahead optimization strategy. According to Schiapparelli et al. (2018), the BESS capacity in Conte et al. (2020) is divided into PFR sub-battery and PV sub-battery: the former compensates for PV prediction errors, and the latter is for frequency regulation. The proposed method realizes the economic optimal of the IS under the premise of keeping SOC safe in both day-ahead and intra-day markets. However, the sub-battery compresses the available capacity of BESSs, which does not take into account that the effect of sub-batteries on SOC may counteract each other. Wang et al. (2022) proposed a bi-level joint optimization model of BESSs to arbitrage in the energy market and provide PFR services to make profits. The optimization of BESSs in energy and PFR markets helps improve the frequency security and stabilize the clearing price. In this model, the dynamic frequency nonlinear constraints are constructed to ensure the safety of the rate of change of frequency (RoCoF) and the frequency nadir. These constraints are related to the given power imbalance of the system and do not take into account the randomness of actual frequency regulation occurrences.
In this work, an IS containing several renewable energy units and a small-capacity BESS with PFR are considered. Usually, small-capacity BESSs in renewable energy stations are mostly just involved in PFR services (Meng et al., 2021; Li et al., 2022). Here, BESSs participate in PFR without affecting renewable energy generation and utilize the remaining capacity to arbitrage through time-of-use electricity prices. In summary, existing research on BESS optimization scheduling has not paid enough attention to the energy consumption of primary frequency regulation, and most of it has not considered the uncertainty of primary frequency regulation signals. We proposed a two-level optimization strategy for BESSs providing PFR services based on the acquired forecast PFR information. First, day-ahead scheduling (DAS) tunes a suitable droop coefficient and optimizes a preliminary BESS charge and discharge plan for the day to achieve the economic goal of the IS. Because there may be great differences in PFR action between the before-day forecast and actual operation, hour-ahead scheduling (HAS) corrects the results of DAS using updated SOC and PFR forecast to keep the BESS operation safer and more reliable. Due to the strong randomness of the PFR action by units in the real grid, both DAS and HAS use the prediction of system frequency difference integral to construct probability constraints for BESS energy offset in order to describe PFR behavior more accurately.
The remainder of this article is organized as follows: Section 2 presents the modeling of ISs and BESSs. Section 3 and Section 4 introduce the DAS and HAS optimization algorithms, respectively. Section 5 shows the simulation result analysis, and Section 6 provides a summary of our whole work.
Figure 1 shows the system architecture of the IS. The IS mainly consists of three parts: renewable energy units, BESSs, and an integrated station dispatch center (ISDC). The power grid dispatch center (PGDC) is responsible for communication with the IS, and the total power output
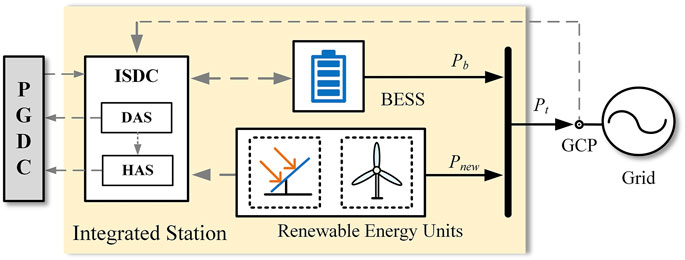
Figure 1. System architecture of the IS.
The output
In the IS above, the PFR service is only provided by BESSs, and the power from the PFR service of BESSs is
The ISDC gathers a variety of information from the power station and the grid and then performs scheduling algorithms (DAS and HAS) to plan the operation for the BESS. For running DAS, the ISDC collects the time-of-use electricity price of the day, the forecast PFR needs from PGDC, the initial capacity of BESSs, and the output forecast from renewable energy units. Through DAS, we can obtain the droop coefficient for PFR and the charge and discharge plan for BESSs before the day operation, with the goal of maximum profit. For running HAS during the day, the ISDC adds the newest PFR needs and the real-time SOC of BESSs to correct the DAS results in order to maintain a lasting and reliable operation.
The DAS and HAS optimization results will be sent back to PGDC in order to schedule the operation of other units at the grid level. During the real-time operation of BESSs, the ISDC also needs to obtain information, such as system frequency, from the GCP to provide PFR services.
According to droop-based control (Ma et al., 2022), the PFR output
where
Suppose we have a BESS with output
where
where
where
The DAS optimization has the objective of maximizing the overall revenue of the IS by obtaining an appropriate droop coefficient
where
(a) the initial SOC of the BESS
(b) the PFR profit coefficient
(c) the time-of-use electricity price
(d) the forecast frequency integral
(e) the forecast renewable energy power
The solution to the DAS problem should also satisfy a certain number of constraints, which are elaborated in detail in the following.
• SOC constraints
Combining Eqs 2, 4 and Eq. 5, we can obtain SOC variation as Eq. 8.
Define
Figure 2 shows two situations that satisfy our SOC constraint: variations from
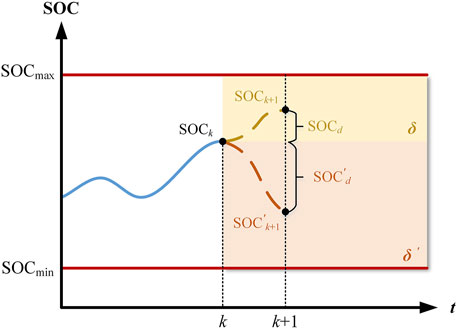
Figure 2. SOC offset constraint.
From Eq. 6 we can derive that
where
Eq. 11 can be rewritten as follows:
Obviously, if
In addition, the random events included in the above probability inequality are
Clearly,
where
Since we have known the mean and standard variance of
where
We can see that Eq. 18 expresses the inequality relationship among the BESS capacity margin, energy exchanged by
The above equation indicates that after a day of PFR and charging or discharging behavior, the deviation between the final SOC of the BESS and the initial
• Power constraints
The operation of the BESS and IS also needs to meet certain power constraints. First, for the BESS, its droop coefficient
The output of the BESS must be within the allowable range of its rated power output
where
where
Finally, it is necessary to impose constraint on the total output of the IS:
where
HAS is an optimization process that corrects the results of DAS based on the latest SOC variation and PFR requirements to maintain the long-term operation capacity of the BESS. The goal of HAS is to improve the safety of SOC without changing the optimization results from DAS as much as possible. For running HAS before-hour, the following data should be available in advance.
(a) the DAS result
(b) the penalty coefficient
(c) the updated SOC of the BESS
(d) the updated frequency integral
(e) the updated renewable energy power
Figure 3 shows the schematic diagram of HAS. Suppose that
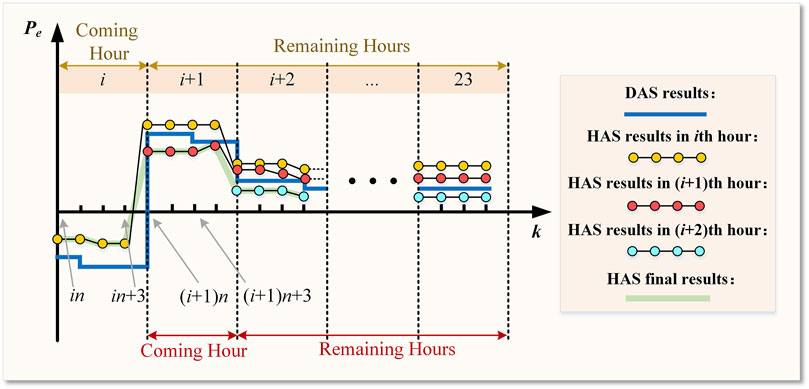
Figure 3. HAS example.
The objective function of HAS in the
In Eq. 26,
The SOC constraint set for HAS is as follows (CH and RH, respectively):
Eqs 27–30 are actually reformulations of Eq. 18, where
where
Clearly,
There is a contradiction between the two optimization objectives in Eq. 25. The results of DAS have already achieved economic optimality while maximizing the utilization of energy storage capacity. If we want to make the operation of energy storage more conservative, it will inevitably lead to an increase in the deviation of the optimization results between DAS and HAS. Therefore, the size of the three weight coefficients in Eq. 25 will significantly affect the difference in the final optimization results.
The power constraints for HAS are almost the same as those for DAS (i.e., Eqs 21–25) and will not be further elaborated here.
For the simulation part, first, we focus on a renewable energy power station that consists of 10 wind turbines with a rated capacity of 1.5 MW and a total rated output of 15 MW. Consider equipping these wind turbines with a BESS of 2MW/2 MW·h to provide PFR and peak-valley arbitrage services. We collected historical frequency fluctuation data measured from several stations in the power grid of Henan province, China. We selected several days of system frequency difference data as our simulation scenario and obtained the corresponding frequency regulation demand prediction using the AR model. The time-of-use electricity price released by Henan province is used as the value of

Table 1. Simulation parameters.
We first select the operation optimization of the BESS on a certain day as the first part of our simulation. The results of DAS and DAS and HAS will be shown separately. Figure 4 shows the simulation results using DAS optimization only. Figure 4A shows the scheduling result for DAS
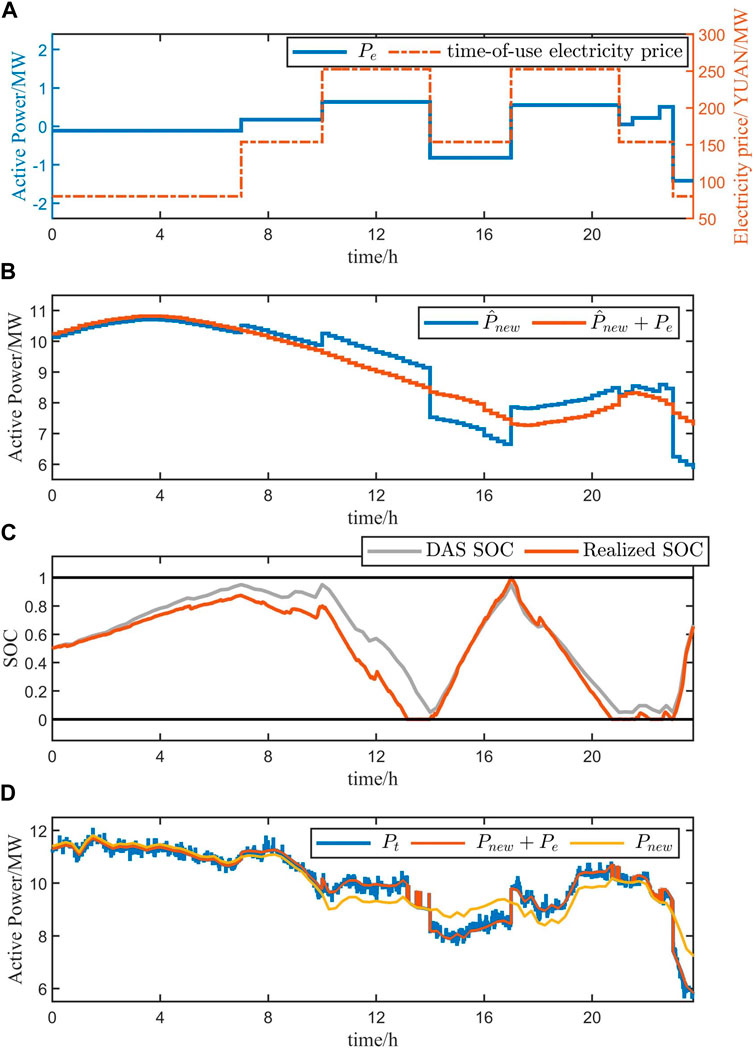
Figure 4. DAS results.
Figure 5 shows the simulation results using DAS and HAS optimization. Figure 5A shows the scheduling results for DAS and HAS. Figure 5B contains the sum of two scheduling results and the prediction of renewable energy output separately. The realized SOC by DAS and HAS is displayed in Figure 5C. Figure 5D shows the real renewable energy output
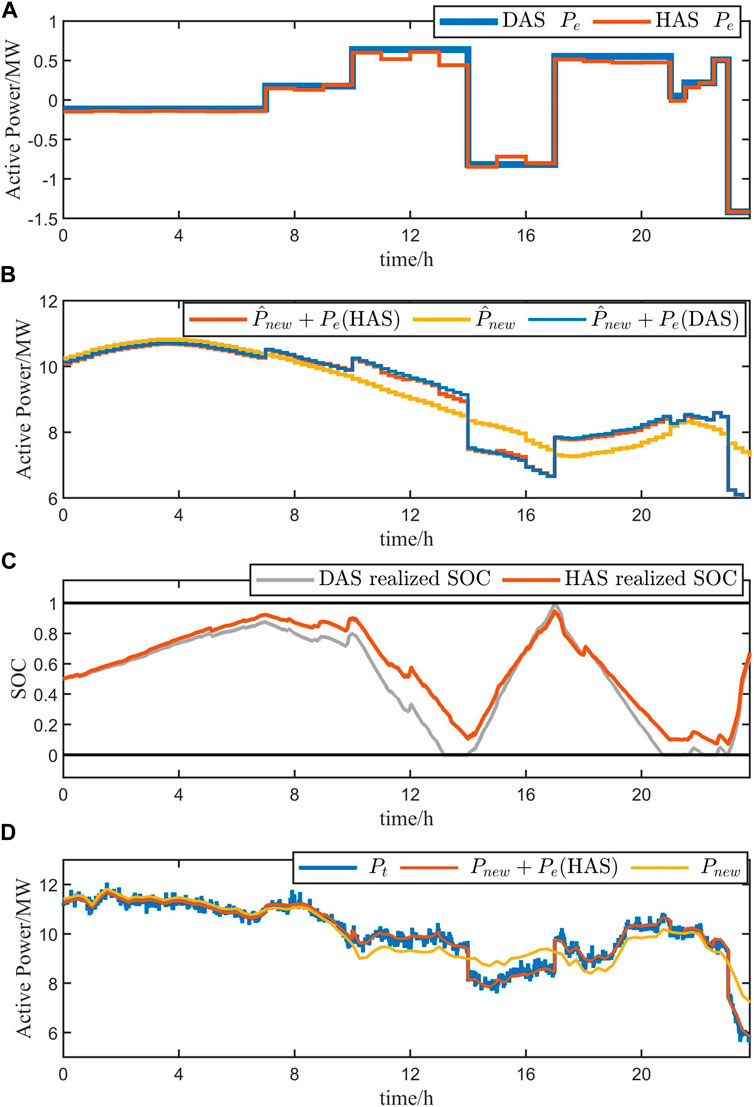
Figure 5. HAS results.
Table 2 summarizes the data results from the above simulations as PFR scenario 1, and we add additional simulation results for another day’s operation as PFR scenario 2. It mainly displays the optimization results of the BESS droop coefficient, PFR revenue, and electricity revenue under different simulation settings. We introduce
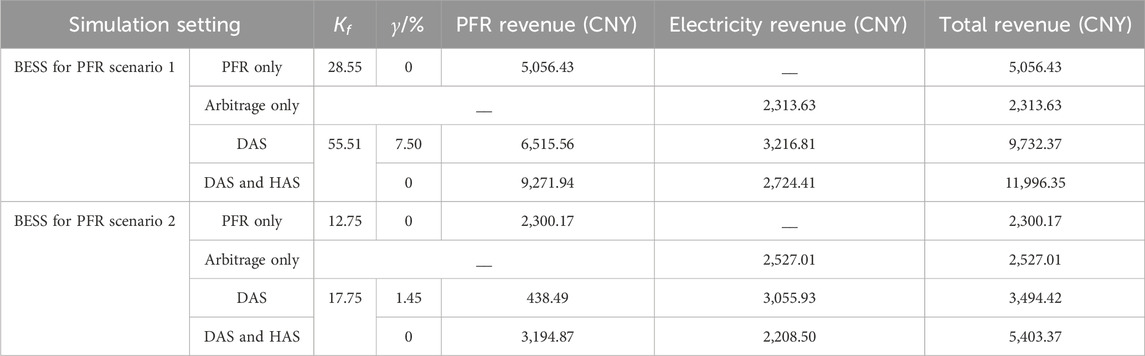
Table 2. Simulation result data.
The optimization results for PFR scenario 2 show that the PFR task on the day is much heavier, so the optimized droop coefficient is small. We can see that there is still 1.45% of the time that the BESS cannot provide PFR, resulting in a decrease in PFR revenue in DAS. Due to the fact that the PFR penalty stipulated in the implementation rules for auxiliary service management in Central China is related to its rated capacity and the optimized droop coefficient is small, the PFR revenue of DAS is relatively low. We can see that in the current scenario, the total revenue after DAS and HAS is still optimal. The simulation results above show that the proposed optimization scheduling method can ensure that the BESS can provide PFR services stably, as well as increase the overall revenue of the power station.
To verify the adaptability of the proposed algorithm in various scenarios, we consider conducting the second simulation for a PV station with a rated capacity of 10 MW. Other simulation configurations remain unchanged. Figure 6 shows the simulation results after using DAS and HAS. Figure 6A shows the scheduling results for DAS and HAS. Figure 6B contains the sum of two scheduling results and the prediction of PV output separately. The realized SOC by DAS and HAS is displayed in Figure 6C. Figure 6D shows the real PV output
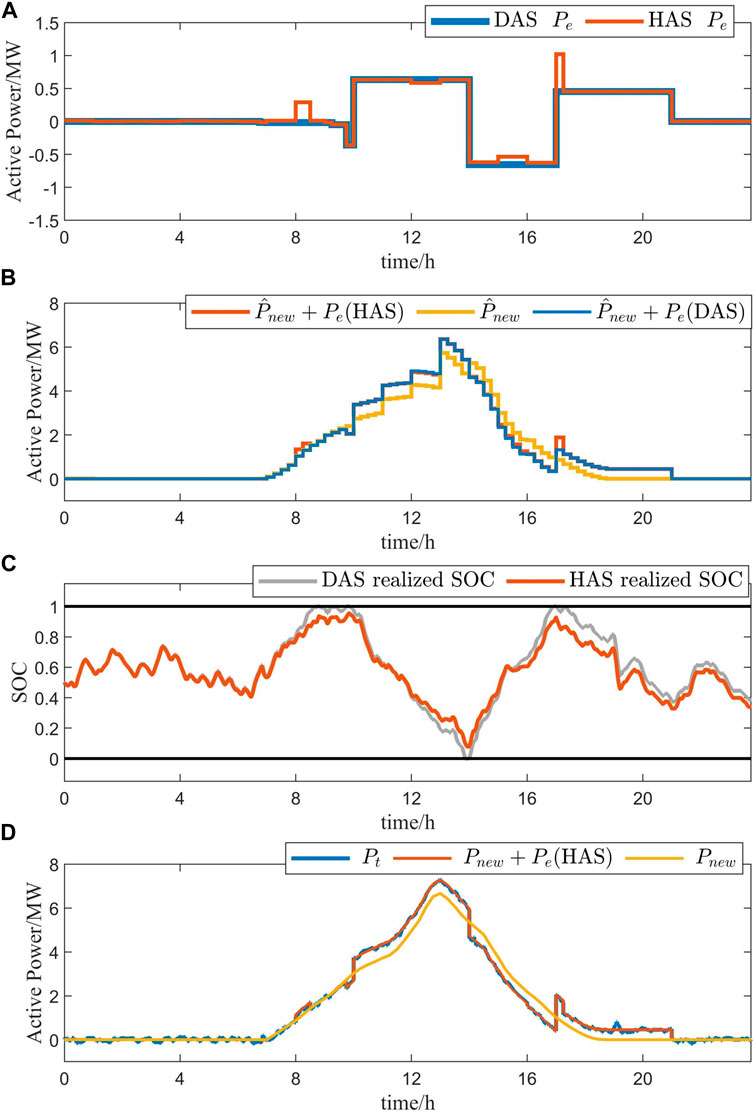
Figure 6. HAS results of the PV.
In order to fully harness the potential of battery energy storage, it is essential to enhance its capability of supporting primary frequency regulation while simultaneously carrying out peak-valley arbitrage through the time-of-use electricity price. Thus, a day-ahead and hour-ahead optimal scheduling algorithm is proposed in this paper. The main conclusion of the context is as follows.
(1) The proposed algorithm can ensure the long-term operation ability of the energy storage and provide the primary frequency regulation service stably, indicating that the proposed probability constraints can ensure the safety of the energy storage state of charge.
(2) The proposed algorithm can adjust the charge and discharge plan of the energy storage in a day according to the time-of-use electricity price, thereby maximizing the utilization of the energy storage capacity and achieving the maximum energy storage profit.
The data analyzed in this study are subject to the following licenses/restrictions: The operation data of the power network dispatching organization must not be disclosed. Requests to access these datasets should be directed to Yanzhao Ma, aGVidXRteXpAMTYzLmNvbQ==.
HH: writing–review and editing. YM: writing–original draft. XZ: writing–review and editing and data curation. CH: writing–original draft and investigation. YH: writing–original draft and software.
The author(s) declare that no financial support was received for the research, authorship, and/or publication of this article.
Author XZ was employed by State Grid Henan Electric Power Company, State Grid Corporation of China (SGCC).
The remaining authors declare that the research was conducted in the absence of any commercial or financial relationships that could be construed as a potential conflict of interest.
All claims expressed in this article are solely those of the authors and do not necessarily represent those of their affiliated organizations, or those of the publisher, the editors, and the reviewers. Any product that may be evaluated in this article, or claim that may be made by its manufacturer, is not guaranteed or endorsed by the publisher.
Arrigo, F., Bompard, E., Merlo, M., and Milano, F. (2020). Assessment of primary frequency control through battery energy storage systems. Int. J. Electr. Power Energy Syst. 115, 105428. doi:10.1016/j.ijepes.2019.105428
Conte, F., Massucco, S., Schiapparelli, G. –P., and Silvestro, F. (2020). Day-ahead and intra-day planning of integrated BESS-PV systems providing frequency regulation. IEEE Trans. Sustain. Energy 11 (3), 1797–1806. doi:10.1109/TSTE.2019.2941369
Cristaldi, L., Faifer, M., Laurano, C., Ottoboni, R., Petkovski, E., and Toscani, S. (2022). “Reduced power model-based tracker for photovoltaic panels,” in 2022 IEEE 16th international conference on compatibility, power electronics, and power engineering (CPE-POWERENG), birmingham, United Kingdom, 2022 (IEEE), 1–6. doi:10.1109/CPE-POWERENG54966.2022.9880905
Fang, C., Tang, Y., Ye, R., Lin, Z., Zhu, Z., Wen, B., et al. (2020). Adaptive control strategy of energy storage system participating in primary frequency regulation. Processes 8 (6), 687. doi:10.3390/pr8060687
Feng, C., Mai, Z., Wu, C., Zheng, Y., and Zhang, N. (2024). Advantage of battery energy storage systems for assisting hydropower units to suppress the frequency fluctuations caused by wind power variations. J. Energy Storage 78, 109989. doi:10.1016/j.est.2023.109989
Li, Z., Cheng, Z., Si, J., Zhang, S., Dong, L., Li, S., et al. (2021). Adaptive power Point tracking control of PV system for primary frequency regulation of AC microgrid with high PV integration. IEEE Trans. Power Syst. 36 (4), 3129–3141. doi:10.1109/TPWRS.2021.3049616
Li, Z., Duan, J., Qin, B., Xia, Y., and Chen, B. (2022) “Self-adaptive control strategy of battery energy storage for power grid primary frequency regulation,” in 2022 IEEE/IAS industrial and commercial power system Asia I&CPS Asia. IEEE: Shanghai, China.
Ma, R., Yuan, S., Li, X., Guan, S., Yan, X., and Jia, J. (2024). Primary frequency regulation strategy based on rotor kinetic energy of double-fed induction generator and supercapacitor. Energies 17 (2), 331. doi:10.3390/en17020331
Ma, Y., Hu, Z., and Song, Y. (2022). Hour-ahead optimization strategy for shared energy storage of renewable energy power stations to provide frequency regulation service. IEEE Trans. Sustain. Energy 13 (4), 2331–2342. doi:10.1109/TSTE.2022.3194718
Mahish, P., and Pradhan, A. K. (2020). Distributed synchronized control in grid integrated wind farms to improve primary frequency regulation. IEEE Trans. Power Syst. 35 (1), 362–373. doi:10.1109/TPWRS.2019.2928394
Meng, G., Lu, Y., Liu, H., Ye, Y., Sun, Y., and Tan, W. (2021). Adaptive droop coefficient and SOC equalization-based primary frequency modulation control strategy of energy storage. Electronics 10 (21), 2645. doi:10.3390/electronics10212645
Schiapparelli, G. P., Massucco, S., Namor, E., Sossan, F., Cherkaoui, R., and Paolone, M. (2018). “Quantification of primary frequency control provision from battery energy storage systems connected to active distribution networks,” in 2018 power systems computation conference (PSCC), IEEE: Dubin, Ireland.
Turk, A., Sandelic, M., Noto, G., Pillai, J. R., and Chaudhary, S. K. (2019). Primary frequency regulation supported by battery storage systems in power system dominated by renewable energy sources. J. Eng. 2019, 4986–4990. doi:10.1049/joe.2018.9349
Wang, X., Ying, L., Wen, K., and Lu, S. (2022). Bi-level non-convex joint optimization model of energy storage in energy and primary frequency regulation markets. Int. J. Electr. Power Energy Syst. 134, 107408. doi:10.1016/j.ijepes.2021.107408
Xiong, L., Liu, L., Liu, X., and Liu, Y. (2021). Frequency trajectory planning based strategy for improving frequency stability of droop-controlled inverter based standalone power systems. IEEE J. Emerg. Sel. Top. Circuits Syst. 11 (1), 176–187. doi:10.1109/JETCAS.2021.3052006
Xiong, L., Liu, X., Liu, H., and Liu, Y. (2022). Performance comparison of typical frequency response strategies for power systems with high penetration of renewable energy sources. IEEE J. Emerg. Sel. Top. Circuits Syst. 12 (1), 41–47. doi:10.1109/JETCAS.2022.3141691
Xiong, L., Liu, X., Zhang, D., and Liu, Y. (2021). Rapid power compensation-based frequency response strategy for low-inertia power systems. IEEE J. Emerg. Sel. Top. Power Electron. 9 (4)), 4500–4513. doi:10.1109/JESTPE.2020.3032063
Zhang, Y. J. A., Zhao, C., Tang, W., and Low, S. H. (2018). Profit-maximizing planning and control of battery energy storage systems for primary frequency control. IEEE Trans. Smart Grid 9 (2), 712–723. doi:10.1109/TSG.2016.2562672
Zhao, P., Gu, C., Li, F., and Yang, X. (2022). Battery storage configuration for multi-energy microgrid considering primary frequency regulation and demand response. Energy Rep. 8 (10), 1175–1183. doi:10.1016/j.egyr.2022.06.086
Keywords: battery storage, renewable energy station, primary frequency regulation, droop control, time-of-use electricity price, optimal scheduling
Citation: Hu H, Ma Y, Zhang X, Han C and Hao Y (2024) Day-ahead and hour-ahead optimal scheduling for battery storage of renewable energy power stations participating in primary frequency regulation. Front. Energy Res. 12:1424389. doi: 10.3389/fenrg.2024.1424389
Received: 28 April 2024; Accepted: 07 June 2024;
Published: 05 July 2024.
Edited by:
Yonghui Liu, Hong Kong Polytechnic University, Hong Kong SAR, ChinaReviewed by:
Chen Yang, Chongqing University, ChinaCopyright © 2024 Hu, Ma, Zhang, Han and Hao. This is an open-access article distributed under the terms of the Creative Commons Attribution License (CC BY). The use, distribution or reproduction in other forums is permitted, provided the original author(s) and the copyright owner(s) are credited and that the original publication in this journal is cited, in accordance with accepted academic practice. No use, distribution or reproduction is permitted which does not comply with these terms.
*Correspondence: Huaizhong Hu, aHVodWFpemhvbmdAeGp0dS5lZHUuY24=
Disclaimer: All claims expressed in this article are solely those of the authors and do not necessarily represent those of their affiliated organizations, or those of the publisher, the editors and the reviewers. Any product that may be evaluated in this article or claim that may be made by its manufacturer is not guaranteed or endorsed by the publisher.
Research integrity at Frontiers
Learn more about the work of our research integrity team to safeguard the quality of each article we publish.