 R. Lalhmachhuana
 Subhasish Deb
 Subir Datta
 Ksh. Robert Singh
 Umit Cali
 Taha Selim Ustun
95% of researchers rate our articles as excellent or good
Learn more about the work of our research integrity team to safeguard the quality of each article we publish.
Find out more
ORIGINAL RESEARCH article
Front. Energy Res. , 17 September 2024
Sec. Wind Energy
Volume 12 - 2024 | https://doi.org/10.3389/fenrg.2024.1421212
In this work, a study of economic and emission dispatch issues based on the multi-objective optimization is solved, and generation costs and emissions are reduced by utilizing multi-objective optimization techniques. This optimization is carried out in an IEEE-30 bus system, with and without the integration of wind energy sources, with equality and inequality constraints. The equality constraints are the power balance constraints, stipulating that to have an optimal solution, the generated power must be adequate to satisfy the load demand plus losses. The inequality constraints are a collection of limitations for active power generation, reactive power generation, generator bus voltage, and load bus voltage. To track the hourly load demand, a daily load profile is established using the IEEE-30 bus system. The generation costs and emissions in the system are optimized using multi-objective particle swarm optimization and multi-objective Ant–Lion Optimization approaches. In order to determine the goals’ minimum values, a fuzzy min–max technique is applied. The values that have been minimized are then compared to determine how well wind energy integration has reduced the generation costs and emissions. Two case studies are performed in this work. For Case 1, the total generation costs and emissions using MOPSO are less, with a difference of $42.763, while MOALO has lower emissions, with a difference of 157.337 tons. For Case 2, with the implementation of wind energy, MOPSO has lower total generation costs, with a difference of $51.678, and lower emissions, with a difference of 459.446 tons.
The urgent need to transform our energy generation portfolio arises from the combined pressures of environmental degradation, resource depletion, and climate change (Abdolrasol et al., 2021). Fossil fuels, while historically dominant, contribute significantly to greenhouse gas emissions, air pollution, and global warming, which have detrimental effects on ecosystems and human health. Transitioning to a greater share of renewable energy sources, such as wind, solar, and hydropower, is crucial to mitigate these impacts (Ulutas et al., 2020; Srinivasan et al., 2023). Renewable energy offers a cleaner, more sustainable alternative, significantly reducing carbon footprints and helping stabilize global temperatures. Moreover, the decreasing costs and technological advancements in renewable energy make it an increasingly viable option for meeting the growing energy demands (Basu et al., 2022).
Introducing more renewable energy sources into the power grid presents several challenges that need to be addressed to ensure a reliable and efficient energy system (Ustun et al., 2011). One major challenge is the intermittent nature of renewable energy such as wind and solar power, which can lead to fluctuations in energy supply and require the development of advanced energy storage solutions or backup systems to maintain a steady power flow (Yarar et al., 2023). Additionally, the integration of distributed generation from renewables often necessitates upgrades to the existing grid infrastructure to handle variable inputs and ensure seamless connectivity. The variability in renewable energy sources can also complicate grid management and forecasting, requiring sophisticated algorithms and real-time monitoring to effectively balance supply and demand. Furthermore, the geographic dispersion of renewable energy installations can lead to transmission bottlenecks and increased costs for infrastructure development. Lastly, the incorporation of more renewables can impact power quality, as fluctuating inputs from sources like wind turbines and solar panels may introduce voltage and frequency instability, requiring additional measures to maintain consistent power quality and reliability across the grid (Latif et al., 2021). Addressing these challenges is crucial to fully realizing the benefits of renewable energy and ensuring a stable and efficient power system.
To enhance power quality, optimal power flow (OPF) is employed to achieve the best possible power flow. The economic and reliable operation of electrical systems is critically important. The OPF challenge typically aims to minimize objectives by adjusting the variables within the power system (Chen et al., 2019; Hoang Bao Huy et al., 2022). OPF often involves large-scale, nonconvex, nonlinear, mixed-integer, and highly constrained optimization problems (Ghasemi et al., 2014; Niu et al., 2014). Traditionally, the primary goal of OPF systems has been to reduce fuel costs. To maintain high electricity quality, utilities must also minimize transmission losses for economic reasons. Given the growing environmental concerns, emission levels should now be considered part of the objective function rather than merely a constraint (Zhang et al., 2016). With the increasing public awareness of environmental issues, the economic dispatch problem has evolved. The absolute minimum cost is no longer the sole objective. When power is generated from fossil fuels, it releases pollutants such as sulfur oxides and nitrogen oxides into the atmosphere. These pollutants not only harm the environment but also have adverse effects on human health, as well as on plants and animals (Surender Reddy, 2018).
A crucial tool for managing the distribution system is the power flow method, which is commonly referred to as the load flow method. Depending on the regulating capacities of transformers, condensers, alternators, and other equipment, load flow solutions offer insights into reactive power and real power losses, as well as voltage magnitudes and voltage angles at various nodes within the distribution system. Most load flow analyses in engineering focus on reducing production costs and operating the system efficiently (Chatuanramtharnghaka and Deb, 2020). This study simplifies the Newton–Raphson power flow solution approach, which is based on the principle of current balancing and involves a set of nonlinear equations. Despite the availability of several effective Newton–Raphson (NR)-based power flow solvers, challenges arise because the derivatives of the Jacobian matrix must be calculated. This study illustrates how the updating formulas for Jacobian matrices differ from those used in the traditional Newton–Raphson approach (Kulworawanichpong, 2010). Over the past few decades, renewable energy resources have addressed the growing demand in the energy market (Khan, 2009). Wind energy, in particular, has recently gained popularity due to its ability to generate electrical power (Manwell et al., 2010; Johnson, 1985). This growing interest is driven by efforts to reduce pollution and mitigate its harmful effects on the environment, given that fossil fuel-powered power plants are significant sources of greenhouse gas emissions.
Wind energy is an environmentally friendly renewable resource. The global interest in wind energy conversion systems, which generate electric power, has been rapidly increasing, with the average annual growth rate exceeding 25% over the past decade. To ensure that the wind energy conversion technology operates as efficiently as possible, it is crucial that wind turbines are precisely designed for their installation sites (Salih et al., 2012; Khalfallah and Koliub, 2007; Bencherif et al., 2014). Wind characteristics, such as direction and velocity, are influenced by various factors, including location and climate (Bianchi et al., 2007; Kala and Sandhu, 2016; Hamoudi et al., 2023). The ability of a wind turbine to generate electricity depends on several site-specific factors and the aerodynamic performance of its blades. Key factors include the average annual wind speed, blade pre-twist, pitch, attachment angle, and rotor swept area. Additionally, air density affects wind turbine performance and can vary with altitude and temperature (Wiratama et al., 2016; Kanchikere, 2012; Badran and Abdulhadi, 2009). When constructing a wind turbine, it is essential to consider several climatic factors, such as wind speed, turbine swept area, air density, site temperature, and tower height. The choice of the wind turbine should reflect the specific climatic characteristics of the site (Marimuthu and Kirubakaran, 2014; Nemes and Munteanu, 2012).
Nature-inspired optimization algorithms are particularly useful for renewable energy deployments in future power systems due to their ability to efficiently handle complex, nonlinear, and multidimensional problems in optimizing energy systems. Their ability to balance exploration and exploitation makes them well-suited for optimizing various aspects of renewable energy systems, such as resource allocation, grid integration, and system design, ultimately leading to more robust and efficient power system configurations. Some examples of effective applications for power system issues are the salp swarm algorithm (Latif et al., 2020), butterfly optimization (Dey et al., 2020), biogeography-based algorithm (Chauhan et al., 2021), sine cosine algorithm (Nayak et al., 2023), chaotic selfish-herd optimization (Barik et al., 2021), flower pollination algorithm (Hussain et al., 2020), satin bowerbird algorithm (Farooq et al., 2022), moth flame optimization algorithm (Singh et al., 2021), COVID-19-based optimization (Safiullah et al., 2022), and slime mold algorithm (Das et al., 2022). Similarly, multi-objective ant lion optimizer (MOALO) is inspired by the hunting behavior of ant lions, particularly their interactions with prey such as ants in nature. MOALO represents an extension of the ant lion optimizer (ALO) and operates similarly to other population-based optimization techniques, such as multi-objective particle swarm optimization (MOPSO) and multi-objective genetic algorithm optimization (MOGOA) (Mirjalili et al., 2016). The particle swarm optimization (PSO) algorithm, in contrast, is modeled after the fluttering motion of flocks of birds. Observations of bird flocks reveal that they follow specific patterns while searching for food, allowing them to stay close to available resources. In PSO, the individual’s local best and the global best influence the position and velocity of the search process. This algorithm involves creating a population of particles and evaluating each particle’s performance individually within the search space (Coello Coello et al., 2004).
The novel aspects and contribution of the work are summarized below:
• The multi-objective optimization algorithm-based fuzzy min–max approach with competing objectives is utilized to address the multi-objective optimal power flow problem. The meta-heuristic algorithm is utilized to capture the numerous optimal solutions in its final population when the issue is formulated for the simultaneous optimization of several competing objectives.
• The MOPSO algorithm was found to be extremely effective and competitive in locating a precise estimate of the Pareto optimal front with high distribution across all objectives. Additionally, strong convergence and extensive exploration characteristics of MOPSO produce, respectively, accurate estimated solutions and a good distribution. The procedure for choosing targets and maintaining archives also promotes research and the sharing of solutions.
We take into account two objectives in this multi-objective problem that are detailed below:
The formulation of the power generation fuel cost is shown in Equation 1
where the number of generators is denoted by NG (which is 6).
When thermal units employing fossil fuels produce electricity, atmospheric pollutants are emitted. Equation 2 gives the total harmful gas emissions (ton/hr):
where
The proposed objective function aims to reduce generation costs and emissions. It is multi-objective-based. Consequently, the objective function is expressed as shown in Equation 3
Constraints can be defined as a condition that a solution must satisfy in solving an optimization problem.
It is described as the power balance constraint, which stipulates that to have an optimal solution, the generated power needs to be adequate to satisfy the load demand plus losses. The formula for the power balance equation is shown in Equation 4 (Chatuanramtharnghaka and Deb, 2020)
where
Considering the integration of wind energy, in each dispatch time period, the power balance equation is represented as shown in Equation 5
where
The following constraints set a restriction on how much voltage, active power, and reactive power can be generated for the system as shown in Equations 6, 7:
The voltage magnitude and real power production are denoted by VGp and PGp, respectively. NG stands for the “generating unit number.”
The limitations on the line power flow and the load bus voltage are known as security constraints as in Equations 8, 9:
where Slr is the power at branch NBR and VLr is the load bus r voltage magnitude.
The air’s power output may be calculated using Equation 10 (El-Ahmar et al., 2017):
The relationship between wind energy and speed is described as in Equation 11: (Burton et al., 2011):
where
The multi-objective ant lion optimizer (MOALO) was proposed by Seyedali Mirjalili, Pradeep Jangir, and Shahrzad Saremi in 2016. The optimization algorithm mimics the hunting methods of ant lion and how they interact with their prey, such as ants, in the nature. The MOALO is an extended edition of the ant lion optimizer (ALO). This optimization shares some similarity with the other population-based optimization techniques like the MOPSO and MOGOA (Mirjalili et al., 2016).
The algorithm was modeled based on the fluttering motion of a flock of birds. A group of birds were observed to follow a pattern in their quest for food, and then they could remain next to the nearest resources. The individual’s local and global best have an impact on the position and speed of the search process. This program uses the idea of creating a population and evaluating each particle’s performance in the search space (Coello Coello et al., 2004).
The multi-objective particle swarm optimization algorithm is as follows:
1. Initialize a population of size Np (size of the population depends on the complexity of the problem).
2. Initialize particle velocity. Consideration of zero velocity at the beginning.
3. Evaluation of the number of particles in the population.
4. Save the evaluated result and particle position in the repository.
5. The location of particles in the search space is identified through a hypercube. Each particle is defined as per the values of the objective function accordingly.
6. Initialization of each particle memory.
For j = 0 to maximum.
Best Position(j) = Population(j).
7. Update velocity of the particles using the following equation:
Vel(j) = w × Vel(j) + R1 × [BestPosition(j) + Population(j)] + R2 × [REP(k)-Population(j)]
Here, w is inertia weight [0.3–1]. R1 and R2 are random numbers [0–1], and REP(k) is the repository value.
8. Performance of roulette wheel selection is done to select the hypercube. Following that within the hypercube, the random selection of the particle is done.
9. Updated velocity is considered to evaluate the new position.
Population(j) = Population(j) + Vel(j)
10. Particles in the population are evaluated for the objective function.
11. The repository is updated. The elimination of the non-dominated vectors is done considering the new vectors.
12. The particles positions are updated if the current position is better than the previous position.
Best Position(j) = Population(j)
13. Increase in the generation.
14. END the loop considering maximum generation.
The work flowchart is shown in Figure 1. The line and bus data are taken from the IEEE-30 bus system. A 32-MW wind power facility generates wind energy based on randomly generated wind speed. Ten turbines, each having a nominal capacity of 3.2 MW, with model SWT-3.2–113, are considered for the wind energy system. Then, Newton–Raphson load flow analysis is performed with and without considering the implementation of wind energy for 24 h, MOPSO and MOALO optimization techniques are used to minimize the multi-objective functions, and the results of the ideal solution are suitably saved. Load profile is shown in Table 1 and Figure 2, while optimal curves for IEEE 30-bus system are shown in Figures 3, 4.
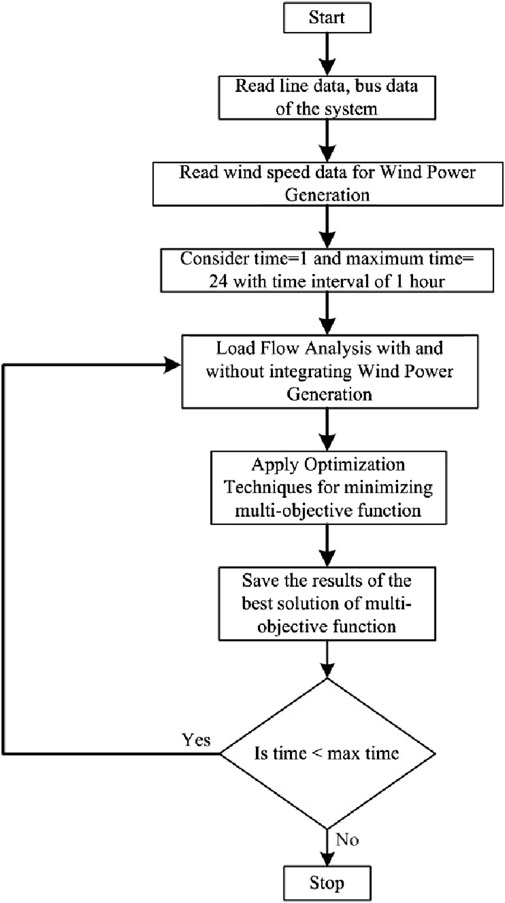
Figure 1. Flowchart of the proposed work.

Table 1. Load profile for 24 h.
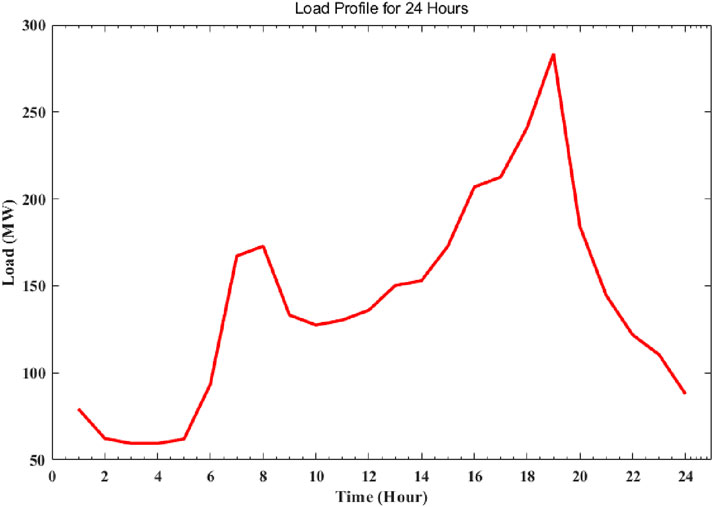
Figure 2. Daily load profile.
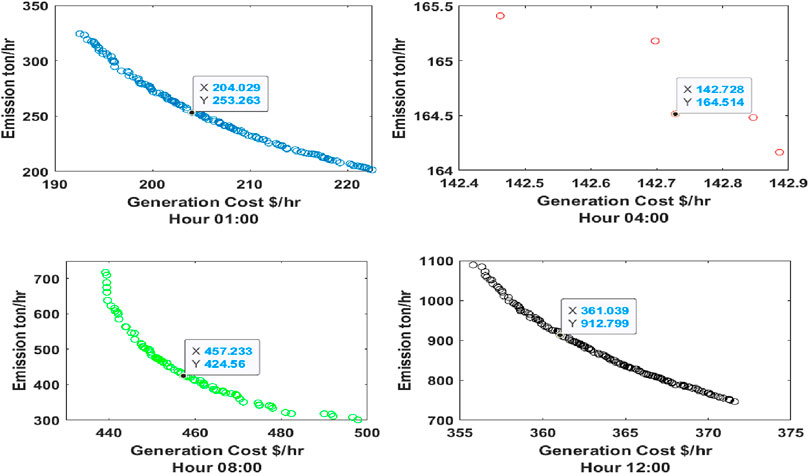
Figure 3. Pareto optimal curves for hours 01:00, 04:00, 08:00, and 12:00 in the IEEE-30 bus system (MOPSO).
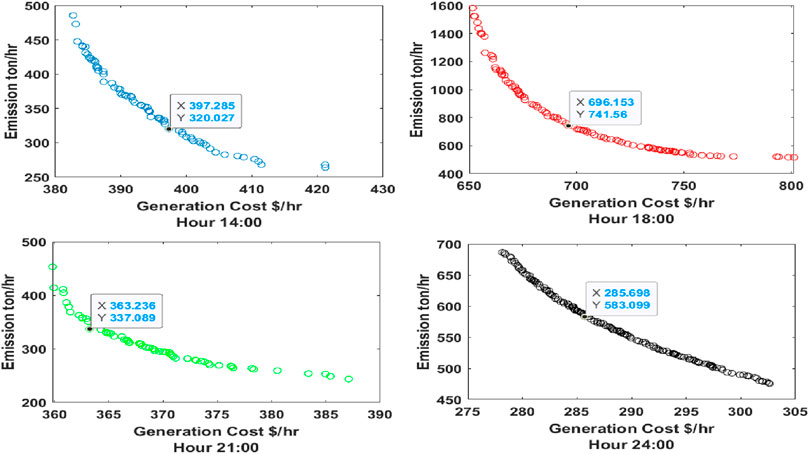
Figure 4. Pareto optimal curves for hours 14:00, 18:00, 21:00, and 24:00 in the IEEE-30 bus system (MOPSO).
In this work, the standard IEEE-30 bus system is optimized using different multi-objective optimization techniques, daily load profile has been introduced by scaling of the load, wind power is generated using randomly generated wind speeds and wind turbine models, and different approaches are proposed and compared to observe the best results. Fuel cost and pollution are two objective functions that are minimized using the fuzzy min–max approach.
Parameters of multi-objective optimization techniques:
• Population size (Np) is set to 200.
• Random populations are generated by bus generator limits and bus voltage limits.
• Repository size (Nr) is set to 200.
• Maximum number of iterations is set to 200.
Daily load profiles have been implemented to the IEEE-30 bus system, multi-objective factors like generation costs and emissions are optimized using the multi-objective particle swarm optimization (MOPSO) and multi-objective ant lion optimization (MOALO) algorithms, and the fuzzy min–max approach has been used to get the best minimal results.
As demonstrated in the figure and table below, a daily load profile has been developed by scaling the IEEE-30 bus system load according to a real-time load profile for 24 h.
Due to the scaling of load, a condition is created to turn OFF some of the generators as the minimum limits of all the generators is 117 MW, and as the load/power demand (
where Gt (ON), G, and
From Table.2, 3 below, it has been observed that some of the generators are turned “OFF” to satisfy the constraints. The generation costs and emissions are optimized using MOPSO and MOALO, and the minimum point of the objectives is observed using the fuzzy min–max approach; the Pareto curves for 24 h for both the optimization techniques are given in Figures 5–12.
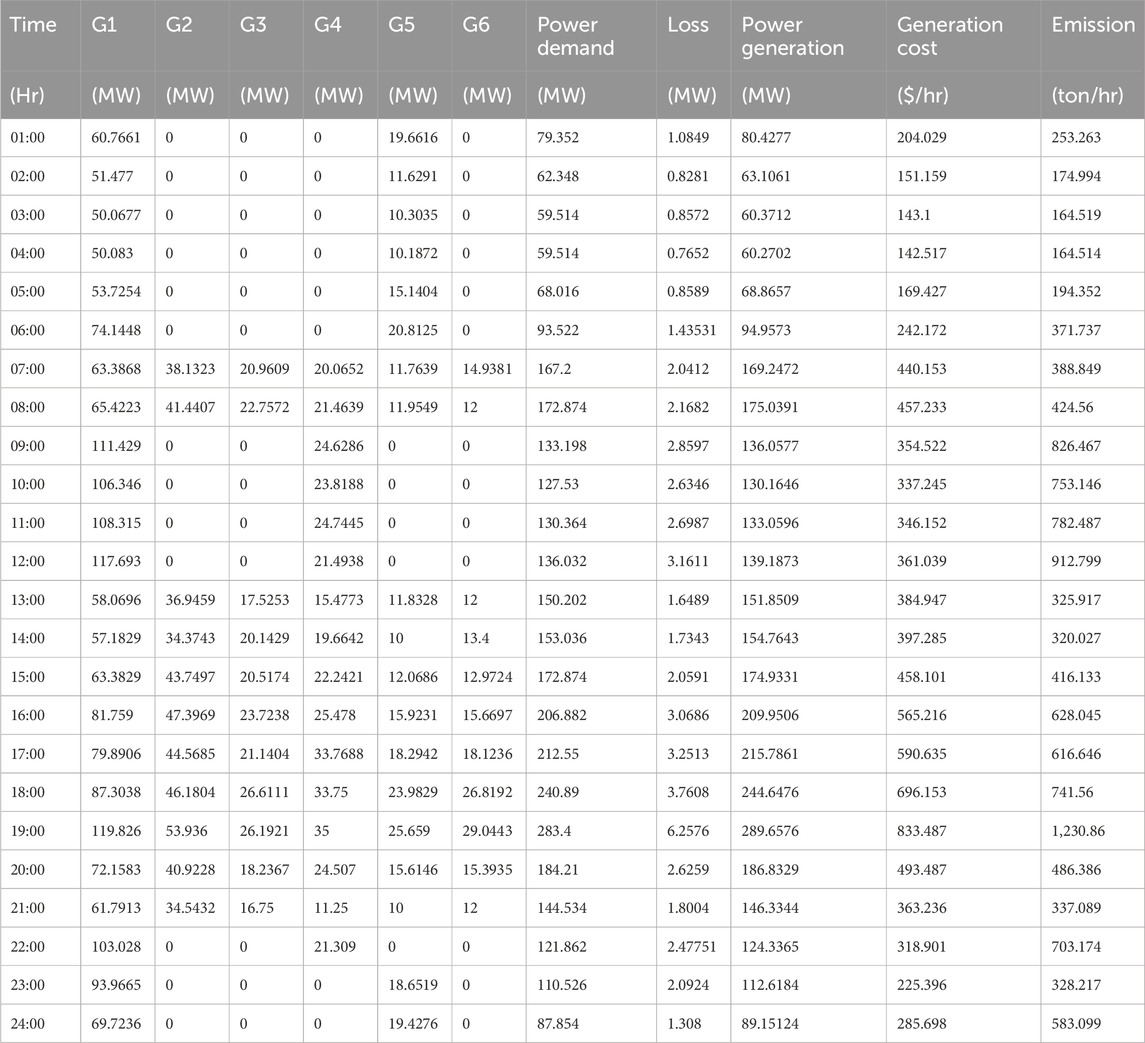
Table 2. Optimization of the IEEE-30 bus system using MOPSO.
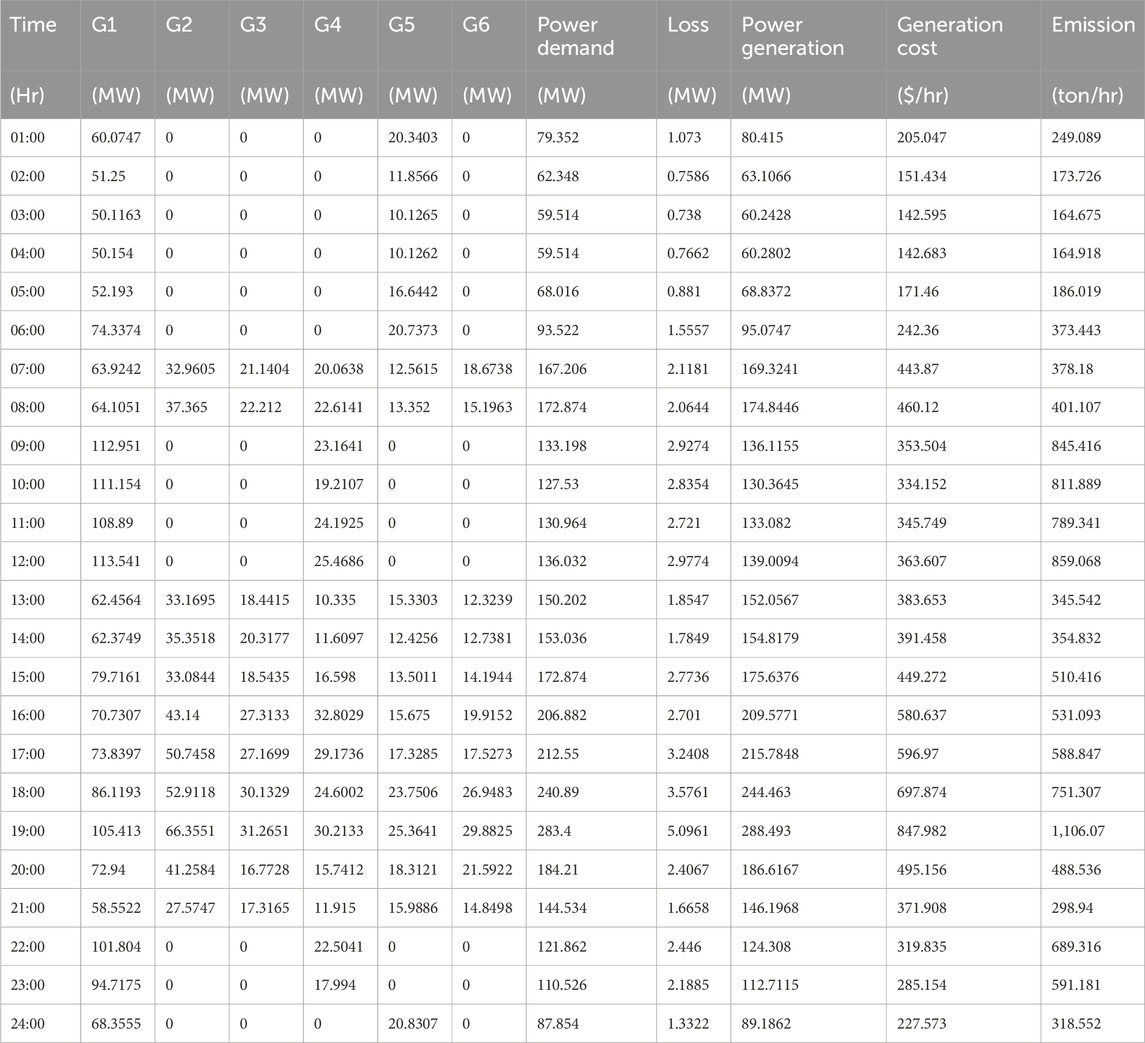
Table 3. Optimization of the IEEE-30 bus system using MOALO.
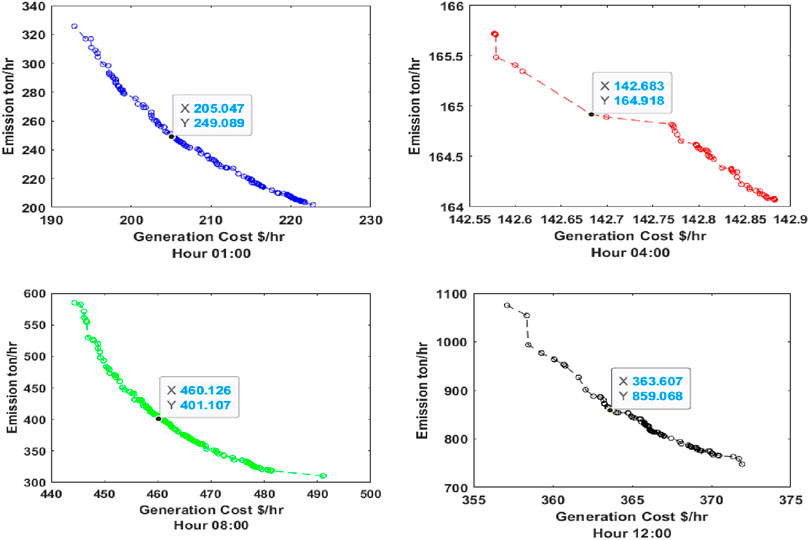
Figure 5. Pareto optimal curves for hours 01:00, 04:00, 08:00, and 12:00 in the IEEE-30 bus system (MOALO).
Figure 6. Pareto optimal curves for hours 14:00, 18:00, 21:00, and 24:00 in the IEEE-30 bus system (MOALO).
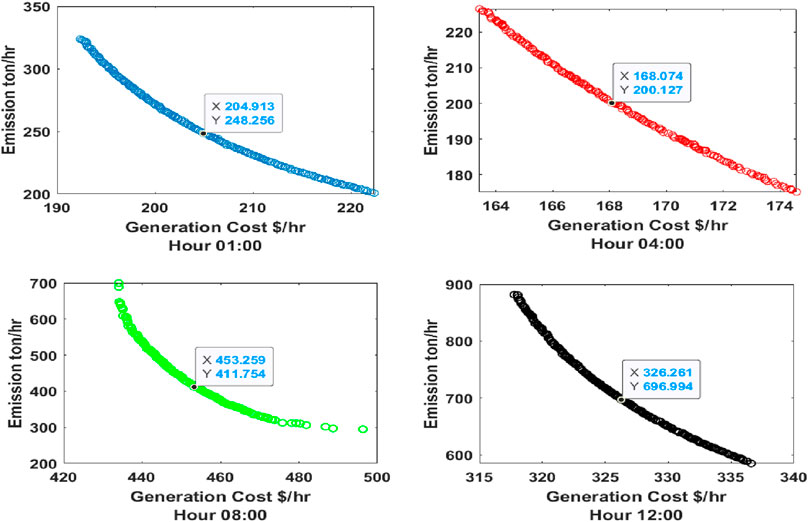
Figure 7. Pareto optimal curves with wind power implementation for hours 01:00, 04:00, 08:00, and 12:00 (MOPSO).
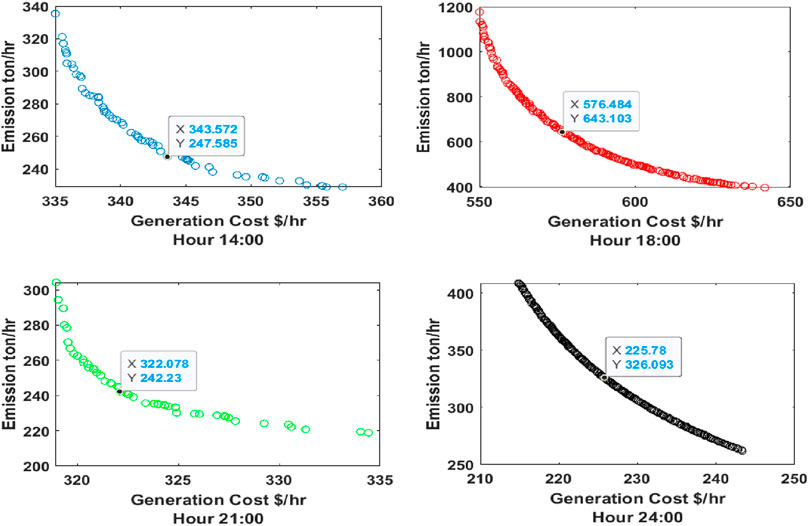
Figure 8. Pareto optimal curves with wind power implementation for hours 14:00, 18:00, 21:00, and 24:00 (MOPSO).
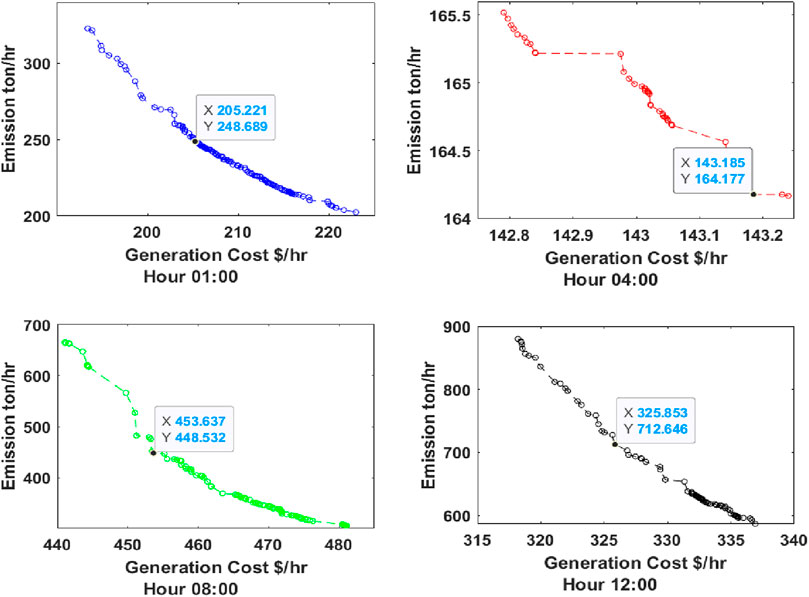
Figure 9. Pareto optimal curve with wind power implementation for hours 01:00, 04:00, 08:00, and 12:00 (MOALO).
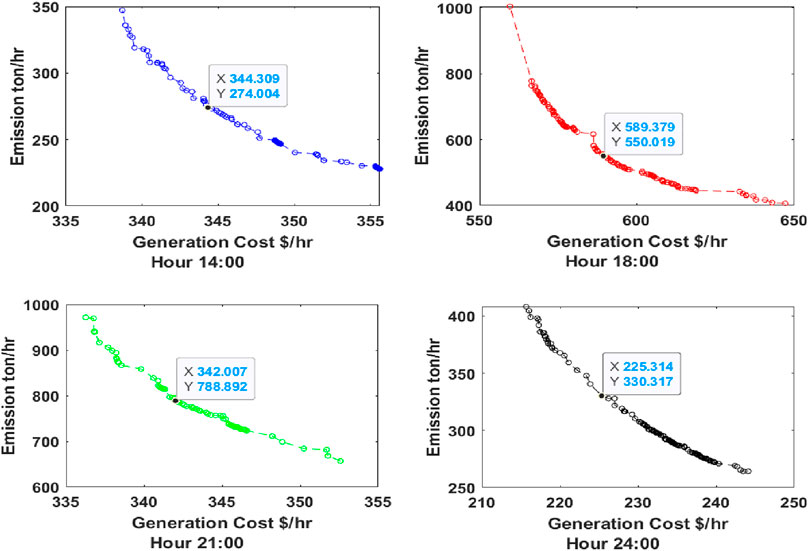
Figure 10. Pareto optimal curve with wind power implementation for hours 14:00, 18:00, 21:00, and 24:00 (MOALO).
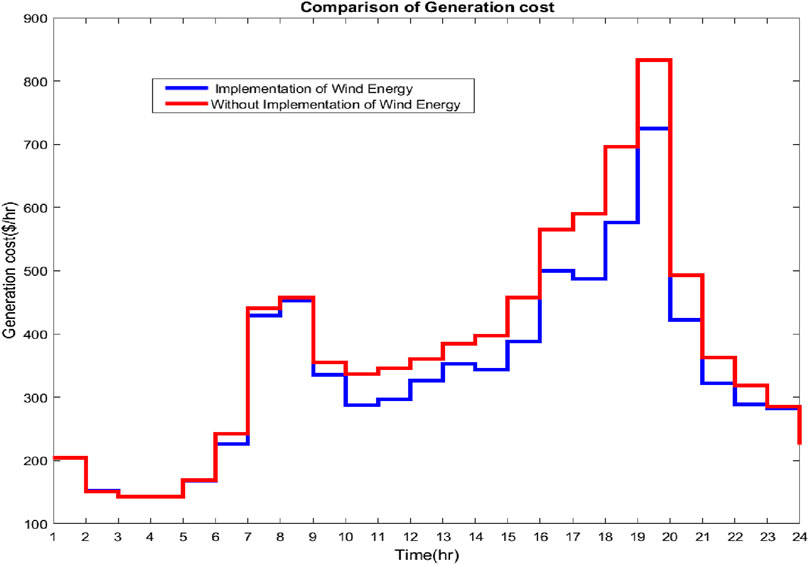
Figure 11. Comparison of generation costs with and without implementing wind energy using MOPSO.
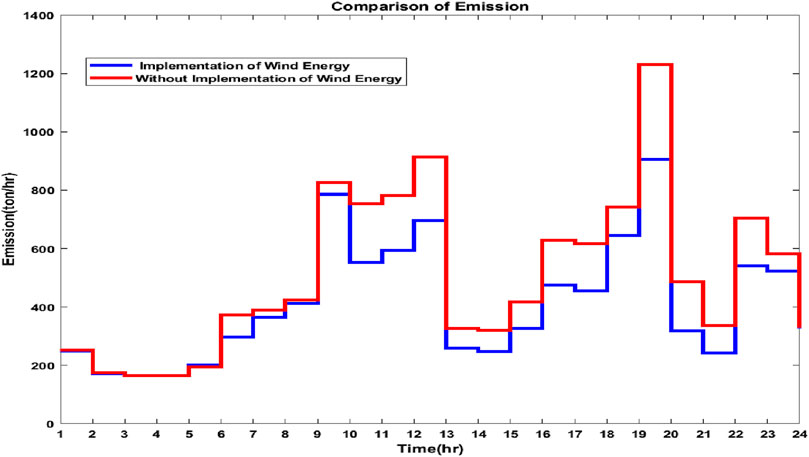
Figure 12. Comparison of emissions with and without implementing wind energy using MOPSO.
Wind energy has been implemented along with daily load profiles in the IEEE-30 bus system, multi-objective factors like generation cost and emission are optimized using the multi-objective particle swarm optimization (MOPSO) and multi-objective ant lion optimization (MOALO) algorithms, and the fuzzy min–max approach has been used to get the best minimal results.
Wind speed is randomly generated, and a 32-MW wind power source is generated using Equation 11 for this work. The wind energy is considered to be equipped using 10 turbine model SWT-3.2–113, with a nominal capacity of 3.2 MW. The specifications of wind turbines are given in Table 4. Wind speeds are tabulated in Table 5 while the wind power generated is shown in Table 6.
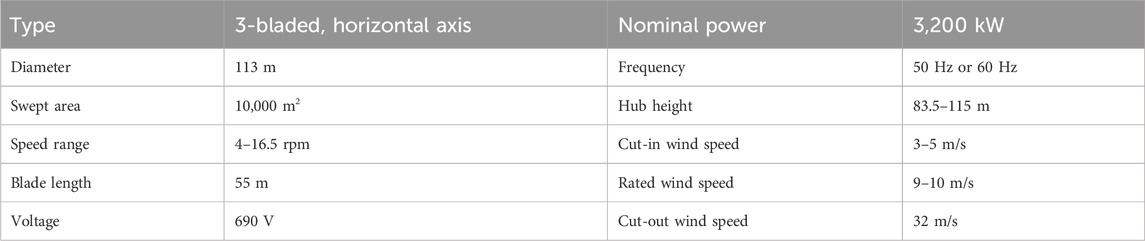
Table 4. Wind turbine Swt-3.2-113 data sheet (El-Ahmar et al., 2017).
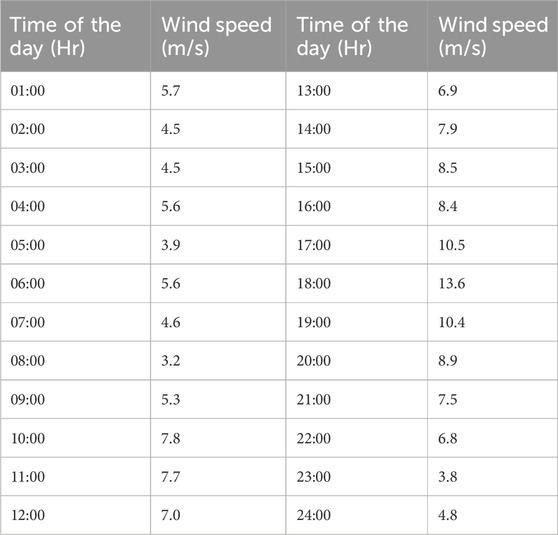
Table 5. Wind speed for the 24-h period.
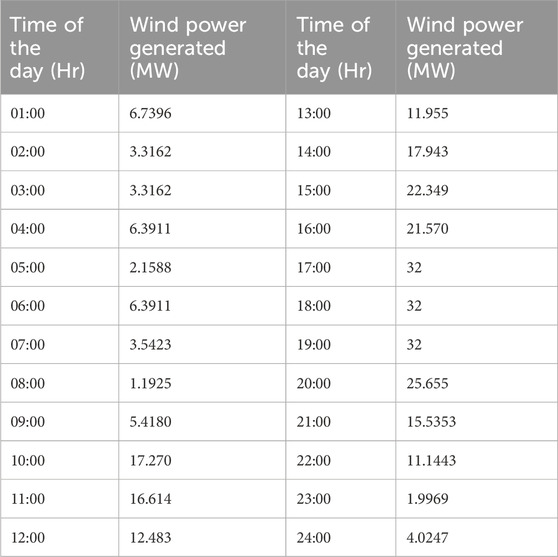
Table 6. Wind power generation for 24 h.
Given that wind speed is not constant, the rated power of 32 MW can be reached at any time of the day. However, if wind power generation is high, the minimum limits of the generators would not be met, and a penalty factor will take effect, which will have an impact on the objectives. Therefore, a condition as in Equation 13 has been imposed where
where Gt (ON), G,
When Equation 13 is satisfied, the wind energy sources are integrated, and the generation costs and emissions are significantly reduced, as shown in Tables 7, 8. The generation costs and emissions are optimized using MOPSO and MOALO, and the minimum point of the objectives is observed using the fuzzy min–max approach. The Pareto curves for 24 h for both the optimization techniques are given in Figures 7–10. Wind energy sources are not implemented for hours 1, 2, 3, 5, and 24 because Equation 13 is satisfied.
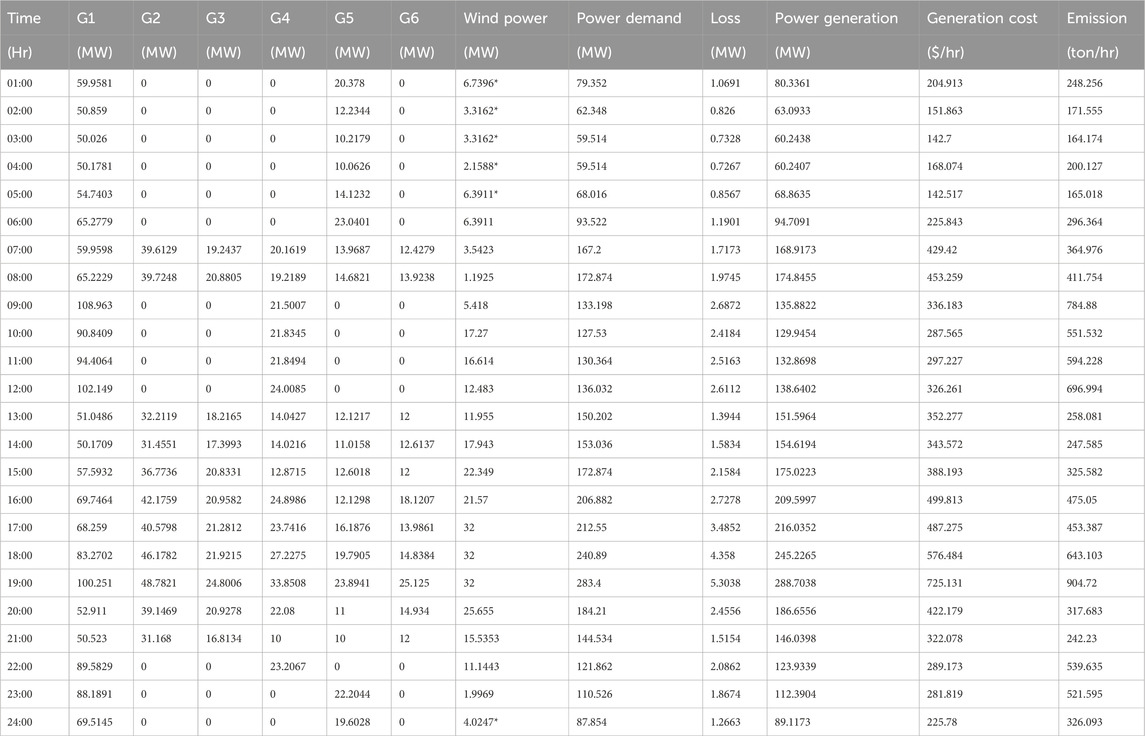
Table 7. Optimization of the IEEE-30 bus system with the implementation of wind energy using MOPSO.
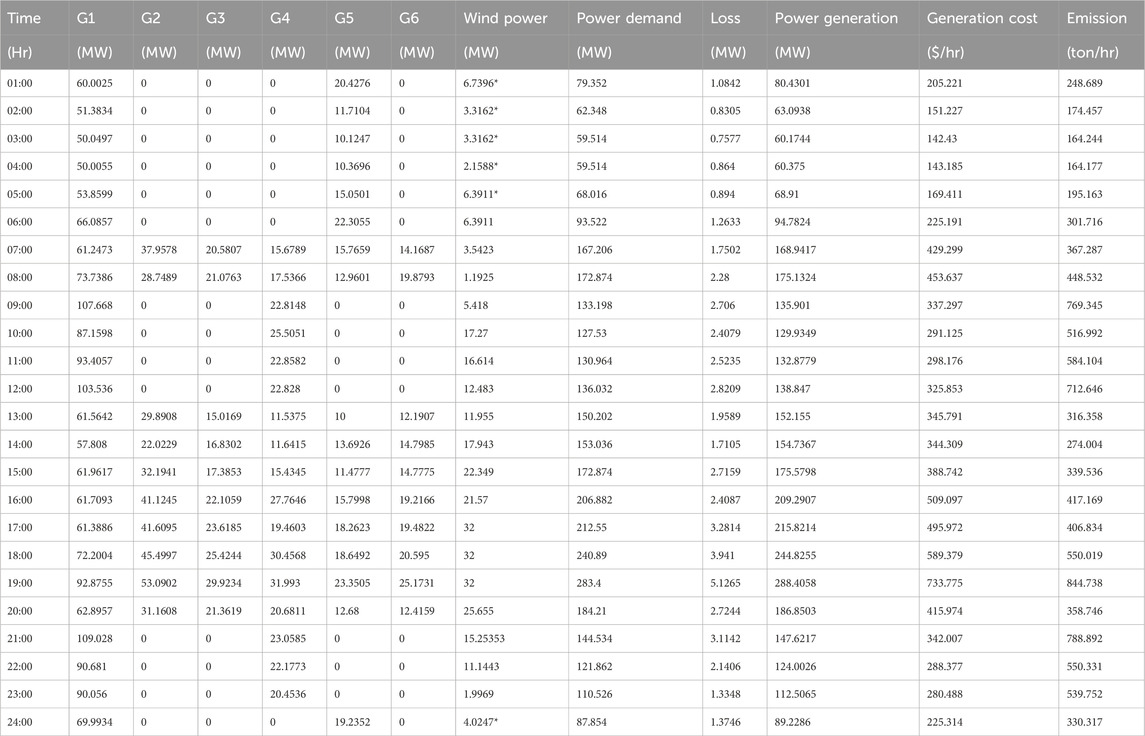
Table 8. Optimization of the IEEE-30 bus system with the implementation of wind energy using MOALO.
From the results obtained from cases 1 and 2, it has been observed that for the optimization of both MOALO and MOPSO, the generation costs and emissions have been drastically reduced when wind energy is implemented into the system, that is, when Equation 13 is satisfied and is observed in Figures 11–16.

Figure 13. Comparison of generation costs with and without implementing wind energy using MOALO.
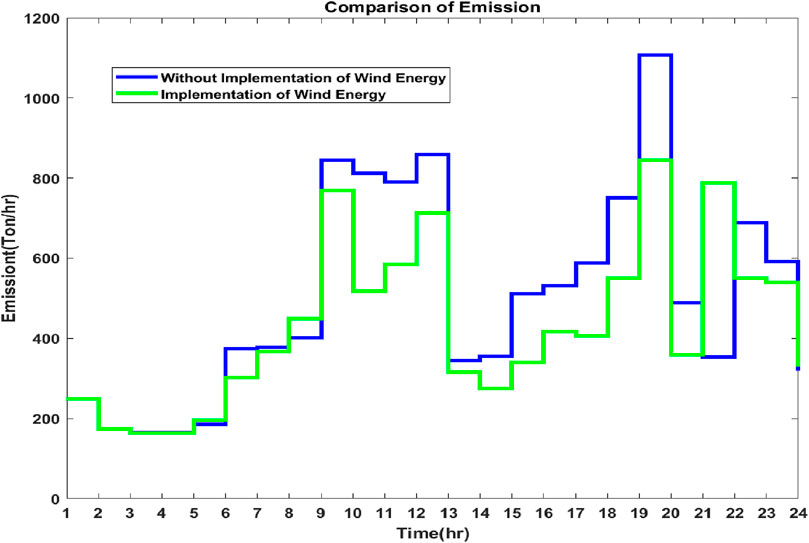
Figure 14. Comparison of emissions with and without implementing wind energy using MOALO.
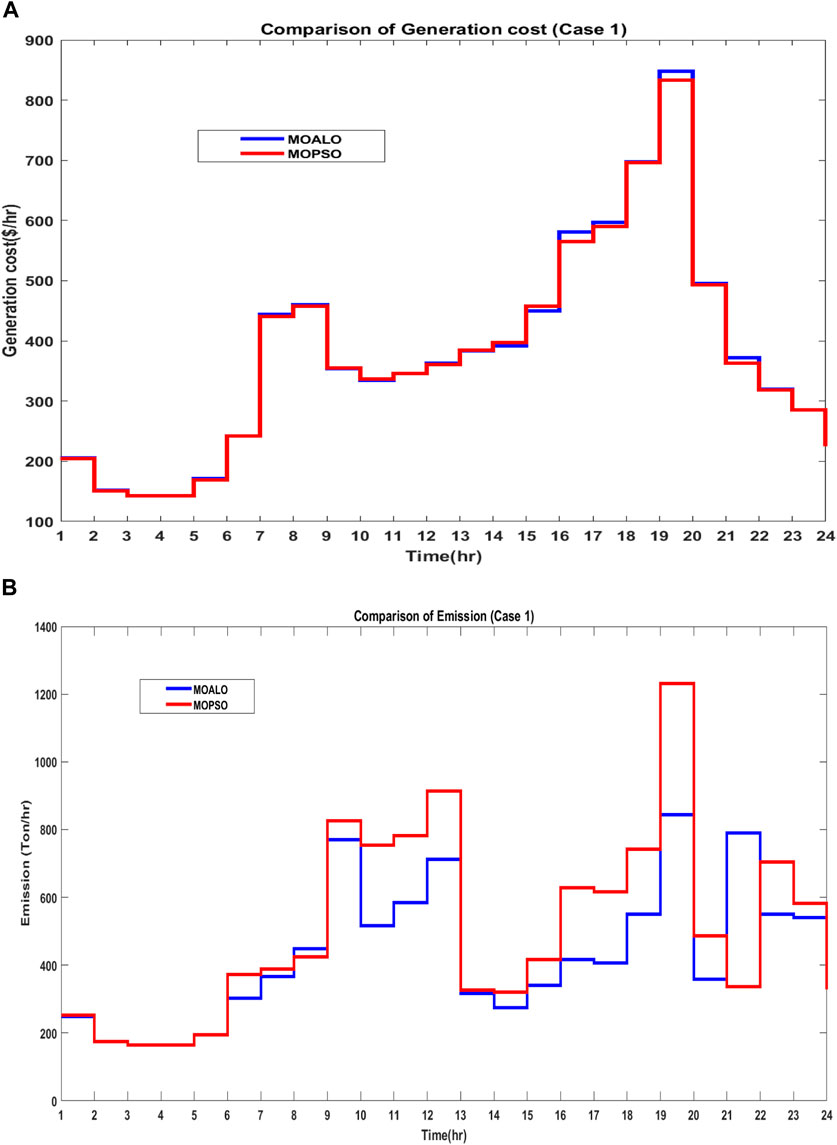
Figure 15. (A) Comparison of generation costs using MOPSO and MOALO for case 1 and (B) comparison of emissions using MOPSO and MOALO for case 1.
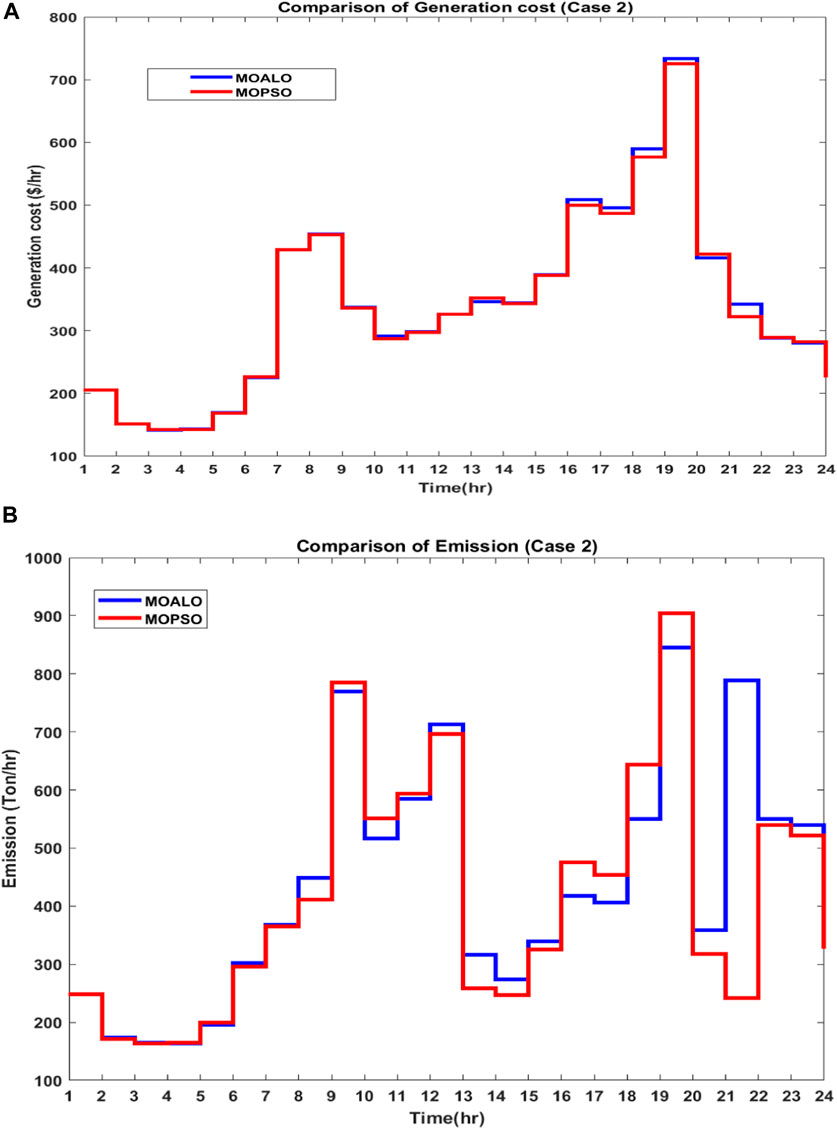
Figure 16. (A) Comparison of generation costs using MOPSO and MOALO for case 2 and (B) comparison of emissions using MOPSO and MOALO for case 2.
For comparison of the optimization algorithms, the total generation costs, and emissions for 24 h, it has been observed that for Case 1, MOPSO has lower total generation costs with a difference of $42.763. However, MOALO has the lower emission with a difference of 157.337 tons and is shown in Figures 15A, B. For Case 2, with the implementation of wind energy, MOPSO has lower total generation costs with a difference of $51.678 and lower emissions with a difference of 459.446 tons and is observed in Figures 16A, B.
In this work, a daily load profile was applied to the IEEE-30 bus system to analyze economic dispatch (ED) problems, both with and without wind energy sources. Multi-objective optimization methods were utilized to balance generation costs and emissions. Wind energy was generated for 24 h using random wind speeds, and it was observed that the incorporation of wind energy led to significant reductions in both generation costs and emissions over the entire period.
To optimize economic generation cost and emission dispatch, multi-objective ant lion optimization (MOALO) and multi-objective particle swarm optimization (MOPSO) were employed. The fuzzy min–max technique was used to identify the optimal minimum outcomes. It was found that MOPSO outperformed MOALO in effectively minimizing both objectives.
For future research, the integration of additional renewable energy sources, such as solar and hydroelectric power, is recommended to further enhance the results of the proposed optimization. The inclusion of electric vehicles in the vehicle-to-grid (V2G) mode as a renewable power source should also be considered. Furthermore, the investigation of other advanced optimization algorithms and novel control strategies could provide additional improvements in managing generation costs and emissions. Additionally, exploring deregulated energy markets may offer valuable insights into optimizing economic dispatch and emissions within different market structures.
The original contributions presented in the study are included in the article/Supplementary Material, further inquiries can be directed to the corresponding authors.
RL: writing–original draft, writing–review and editing, conceptualization, investigation. SHD: writing–original draft, writing–review and editing, conceptualization, investigation. SID: writing–original draft, writing–review and editing, conceptualization, investigation. KS: writing–original draft, writing–review and editing, conceptualization, investigation. UC: writing–original draft, writing–review and editing, conceptualization, investigation. TU: writing–original draft, writing–review and editing, conceptualization, investigation.
The author(s) declare that no financial support was received for the research, authorship, and/or publication of this article.
The authors declare that the research was conducted in the absence of any commercial or financial relationships that could be construed as a potential conflict of interest.
All claims expressed in this article are solely those of the authors and do not necessarily represent those of their affiliated organizations, or those of the publisher, the editors, and the reviewers. Any product that may be evaluated in this article, or claim that may be made by its manufacturer, is not guaranteed or endorsed by the publisher.
The Supplementary Material for this article can be found online at: https://www.frontiersin.org/articles/10.3389/fenrg.2024.1421212/full#supplementary-material
Abdolrasol, M., G. M., Hannan, M. A., Hussain, S. M. S., Sarker, M. R., and Ker, P. J. (2021). Energy management scheduling for microgrids in the virtual power plant system using artificial neural networks. Energies 14, 6507. wind solar. doi:10.3390/en14206507
Badran, O., and Abdulhadi, E. (2009). Evaluation of factors affecting wind power generation in Jordan. Seventh Asia-Pacific Conf. Wind Eng.
Barik, A. K., Das, D. C., Latif, A., Hussain, S. M. S., and Ustun, T. S. (2021). Optimal voltage–frequency regulation in distributed sustainable energy-based hybrid microgrids with integrated resource planning. Energies 14, 2735. doi:10.3390/en14102735
Basu, J. B., Dawn, S., Saha, P. K., Chakraborty, M. R., and Ustun, T. S. (2022). Economic enhancement of wind–thermal–hydro system considering imbalance cost in deregulated power market. Sustainability 14, 15604. challenges. doi:10.3390/su142315604
Bencherif, M., Brahmi, B. N., and Chikhhaoui, A. (2014). Optimum selection of wind turbines. Sci. J. Energy Eng. 2 (4), 36–46.
Bianchi, F. D., Battista, H. D., and Mantz, R. J. (2007). Wind turbine control systems. Germany: Springer, 7.
Burton, T., Jenkins, N., Sharpe, D., and Bossanyi, E. (2011). “Wind energy handbook”, book. John Wiley & Sons, Ltd.
Chatuanramtharnghaka, B., and Deb, S. (2020). “Multi-objective particle Swarm optimization based congestion management considering generation rescheduling and cost minimization,” in International conference on advances in computing, communication & materials (ICACCM)-2020. Dehradun, India: Tula’s Institute, 21–22 August 2020.
Chauhan, A., Upadhyay, S., Khan, M. T., Hussain, S. M. S., and Ustun, T. S. (2021). Performance investigation of a solar photovoltaic/diesel generator based hybrid system with cycle charging strategy using BBO algorithm. Sustainability 13, 8048. doi:10.3390/su13148048
Chen, G., Qian, J., Zhang, Z., and Sun, A. Z. (2019). Multi-objective optimal power flow based on hybrid firefly-bat algorithm and constraints prior object-fuzzy sorting strategy. IEEE Trans. Evol. Comput. 7, 139726–139745. doi:10.1109/access.2019.2943480
Coello Coello, A., Toscano Pulido, G., and Salazar Lechuga, M. (2004). Handling multiple objectives with particle Swarm optimization. IEEE Trans. Evol. Comput. 8 (3), 256–279. doi:10.1109/tevc.2004.826067
Das, A., Dawn, S., Gope, S., and Ustun, T. S. (2022). A risk curtailment strategy for solar PV-battery integrated competitive power system. Electronics 11, 1251. doi:10.3390/electronics11081251
Dey, P. P., Das, D. C., Latif, A., Hussain, S. M. S., and Ustun, T. S. (2020). Active power management of virtual power plant under penetration of central receiver solar thermal-wind using butterfly optimization technique. Sustainability 12, 6979. doi:10.3390/su12176979
El-Ahmar, M. H., Abou-Hashema, M., El-Sayed, , and Hemeida, A. M. (2017). Evaluation of factors affecting wind turbine output power. Egypt: Menoufia University.
Farooq, Z., Rahman, A., Hussain, S. M. S., and Ustun, T. S. (2022). Power generation control of renewable energy based hybrid deregulated power system. Energies 15, 517. doi:10.3390/en15020517
Ghasemi, M., Ghavidel, S., Akbari, E., and Vahed, A. A. (2014). Solving nonlinear, non-smooth and non-convex optimal power flow problems using chaotic invasive weed optimization algorithms based on chaos. ’’ Energy 73, 340–353. doi:10.1016/j.energy.2014.06.026
Hamoudi, Y., Amimeur, H., Aouzellag, D., Abdolrasol, M. G. M., and Ustun, T. S. (2023). Hyperparameter bayesian optimization of Gaussian process regression applied in speed-sensorless predictive torque control of an autonomous wind energy conversion system. Energies 16, 4738. doi:10.3390/en16124738
Hoang Bao Huy, T., Kim, D., and Ngoc, D. (2022). Multi-objective optimal power flow using multiobjective search group algorithm. IEEE Trans. Evol. Comput. 10, 77837–77856. doi:10.1109/access.2022.3193371
Hussain, I., Das, D. C., Sinha, N., Latif, A., Hussain, S. M. S., and Ustun, T. S. (2020). Performance assessment of an islanded hybrid power system with different storage combinations using an FPA-tuned two-degree-of-freedom (2DOF) controller. Energies 13, 5610. doi:10.3390/en13215610
Kala, H., and Sandhu, K. S. (2016). “Performance analysis of wind turbines with different ratings for site matching,” in 1st IEEE intern. Conf. On power electronics, intell. Cont. And energy systems (ICPEICES).
Kanchikere, J. (2012). Aerodynamic factors affecting wind turbine power generation. Intern. J. Eng. Res. & Techn. (IJERT) 1 (issue-9).
Khalfallah, M. G., and Koliub, A. M. (2007). Suggestions for improving wind turbines power curves. Desalination 209, 221–229. doi:10.1016/j.desal.2007.04.031
Kulworawanichpong, T. (2010). ““Simplified Newton–Raphson power-flow solution method” power system research unit,” in School of electrical engineering. Thailand: Institute of Engineering, 111 University Avenue, Suranaree University of Technology. Nakhon Ratchasima 30000.
Latif, A., Hussain, S. M. S., Das, D. C., and Ustun, T. S. (2021). Optimization of two-stage IPD-(1+I) controllers for frequency regulation of sustainable energy based hybrid microgrid network. Electronics 10, 919. doi:10.3390/electronics10080919
Latif, A., Paul, M., Das, D. C., Hussain, S. M. S., and Ustun, T. S. (2020). Price based demand response for optimal frequency stabilization in ORC solar thermal based isolated hybrid microgrid under Salp Swarm technique. Electronics 9, 2209. doi:10.3390/electronics9122209
Manwell, J. F., McGowan, J. G., and Rogers, A. L. (2010). Wind energy explained: theory, design and application. Hoboken, NJ, USA: Wiley.
Marimuthu, C., and Kirubakaran, V. (2014). A critical review of factors affecting wind turbine and solar cell system power production. Intern. Jour. Adv. Eng. Res. Stu., 143–147.
Mirjalili, S., Jangir, P., and Saremi, S. (2016). Multi-objective ant lion optimizer: a multi-objective optimization algorithm for solving engineering problems. Appl. Intell. 46, 79–95. doi:10.1007/s10489-016-0825-8
Nayak, S. R., Khadanga, R. K., Panda, S., Sahu, P. R., Padhy, S., and Ustun, T. S. (2023). Participation of renewable energy sources in the frequency regulation issues of a five-area hybrid power system utilizing a sine cosine-adopted african vulture optimization algorithm. Energies 16 (16), 926. doi:10.3390/en16020926
Nemes, C., and Munteanu, F. (2012). Operational parameters evaluation for optimal wind energy systems development. U.P.B. Sci. Bull. Ser. C 74 (Issue-1), 223–230.
Niu, M., Wan, C., and Xu, Z. (2014). A review on applications of heuristic optimization algorithms for optimal power flow in modern power systems. ’’ J. Mod. Power Syst. Clean. Energy 2 (4), 289–297. doi:10.1007/s40565-014-0089-4
Safiullah, S., Rahman, A., Lone, S. A., Hussain, S. M. S., and Ustun, T. S. (2022). Novel COVID-19 based optimization algorithm (C-19BOA) for performance improvement of power systems. Sustainability 14, 14287. doi:10.3390/su142114287
Salih, S. M., Taha, M. Q., and Alawsaj, M. K. (2012). Performance analysis of wind turbine systems under different parameters effect. Int. J. Energy Environ. (IJEE) 3 (Issue-6), 895–904.
Singh, N. K., Koley, C., Gope, S., Dawn, S., and Ustun, T. S. (2021). An economic risk analysis in wind and pumped hydro energy storage integrated power system using meta-heuristic algorithm. Sustainability 13, 13542. doi:10.3390/su132413542
Srinivasan, R., Sridhar, M., Suresh, A., Mominul, H., Julfikar, I., and Minarul, Md. (2023). Hybrid social grouping algorithm-perturb and observe power tracking scheme for partially shaded photovoltaic array. Int. J. Energy Res., 18.
Surender Reddy, S. (2018). Multi-objective optimization considering cost, emission and loss objectives using PSO and fuzzy approach. Int. J. Eng. & Technol. 7, 1552. doi:10.14419/ijet.v7i3.11203
Ulutas, A., Altas, I. H., Onen, A., and Ustun, T. S. (2020). Neuro-fuzzy-based model predictive energy management for grid connected microgrids. Electronics 9, 900. doi:10.3390/electronics9060900
Ustun, T. S., Ozansoy, C., and Zayegh, A. (2011). “Distributed energy resources (DER) object modeling with IEC 61850–7–420,” in Aupec 2011. Brisbane, QLD, Australia, 1–6.
Wiratama, I. K., Mara, I. M., and Nuarsa, I. M. (2016). Investigation of factors affecting power curve wind turbine blade. ARPN J. Eng. Appl. Sci. 11 (4), 2759–2762.
Yarar, N., Yagci, M., Bahceci, S., Onen, A., and Ustun, T. S. (2023). Artificial neural networks based harmonics estimation for real university microgrids using hourly solar irradiation and temperature data. Energy Nexus 9, 100172. doi:10.1016/j.nexus.2023.100172
Keywords: multi-objective optimization, generation costs and emissions, wind power, economic dispatch, emission dispatch
Citation: Lalhmachhuana R, Deb S, Datta S, Singh KR, Cali U and Ustun TS (2024) Multi-objective-based economic and emission dispatch with integration of wind energy sources using different optimization algorithms. Front. Energy Res. 12:1421212. doi: 10.3389/fenrg.2024.1421212
Received: 22 April 2024; Accepted: 28 August 2024;
Published: 17 September 2024.
Edited by:
Joshuva Arockia Dhanraj, Dayananda Sagar University, IndiaReviewed by:
Ioan Viorel Banu, University of Bacău, RomaniaCopyright © 2024 Lalhmachhuana, Deb, Datta, Singh, Cali and Ustun. This is an open-access article distributed under the terms of the Creative Commons Attribution License (CC BY). The use, distribution or reproduction in other forums is permitted, provided the original author(s) and the copyright owner(s) are credited and that the original publication in this journal is cited, in accordance with accepted academic practice. No use, distribution or reproduction is permitted which does not comply with these terms.
*Correspondence: Umit Cali, dW1pdC5jYWxpQG50bnUubm8=; Taha Selim Ustun, c2VsaW0udXN0dW5AYWlzdC5nby5qcA==
Disclaimer: All claims expressed in this article are solely those of the authors and do not necessarily represent those of their affiliated organizations, or those of the publisher, the editors and the reviewers. Any product that may be evaluated in this article or claim that may be made by its manufacturer is not guaranteed or endorsed by the publisher.
Research integrity at Frontiers
Learn more about the work of our research integrity team to safeguard the quality of each article we publish.