 Jian Fang
 Helen H. Lou1*
- 1Dan F. Smith Department of Chemical and Biomolecular Engineering, Lamar University, Beaumont, TX, United States
- 2Center for Advances in Water and Air Quality, Lamar University, Beaumont, TX, United States
Landfills are major emitters of greenhouse gases, especially methane (CH4). To address this, the U.S. EPA promotes utilizing landfill gas (LFG) for renewable energy. Our study in Southeast Texas compared four LFG conversion strategies: flaring, electricity generation, renewable natural gas and methanol production. Scenario analysis was conducted to reveal the influence of market conditions and incentives on profitability. While electricity generation consistently yielded the highest returns, methanol production emerged as a close contender due to the strategic advantage of its proximity to the landfill site in this industrial zone. This study highlights the promising synergy between landfills and the hydrocarbon industry for sustainable development.
Highlights
• Strategies ensure a smoother transition to renewable energy and renewable feedstock while maximizing the utilization of existing resources and infrastructures.
• Assess capital costs, operating expenses, carbon footprint reductions, and potential profits for each strategy.
• Carbon credits and other incentives play a pivotal role in the profitability of landfill gas utilization project.
1 Introduction
Landfill gas (LFG) from Municipal solid waste (MSW) landfills primarily consists of methane (CH4) and carbon dioxide (CO2), along with traces of other gases such as volatile organic compounds (VOCs) and small amounts of nitrogen, oxygen, and hydrogen (US EPA, 2023b). Notably, CH4 is a potent greenhouse gas (GHG), exhibiting at least 25 times greater heat-trapping effectiveness than CO2 over a 100-year period (Pettus, 2009). Its release significantly contributes to global warming and climate change. In the United States, MSW landfills constituted 14.3% of anthropogenic CH4 emissions in 2021, ranking third among sources (US EPA, 2023e).
The Landfill Methane Outreach Program (LMOP) is a voluntary program in the United States administered by the EPA (US EPA, 2023c). LMOP’s primary goal is to reduce CH4 emissions from landfills, promote the beneficial use of methane as a valuable energy resource, and mitigate the environmental impact of CH4. Moreover, LMOP offers technical options for converting LFG into energy, such as electricity and renewable natural gas (RNG) (US EPA, 2023b).
Figure 1A reveals that low-potential landfills (951) constitute around 27% of the total U.S. landfills (US EPA, 2023f). This highlights that slightly over one-quarter of the landfills lack the feasibility for methane renewable energy development. In contrast, operational landfills (719) make up about 21% of the total U.S. landfills, indicating that they are already harnessing methane for renewable energy generation. Furthermore, candidate landfills (470), future potential landfills (170), planned landfills (67), and construction landfills (31) collectively represent 22% of all the landfills in the U.S., equivalent to the proportion occupied by operational landfills. This suggests that these potential landfill sites hold promise for future methane capture and reduction initiatives. There is still untapped potential within this group of landfills to reduce methane emissions and exploit the available space for further development and sustainability efforts in waste management.
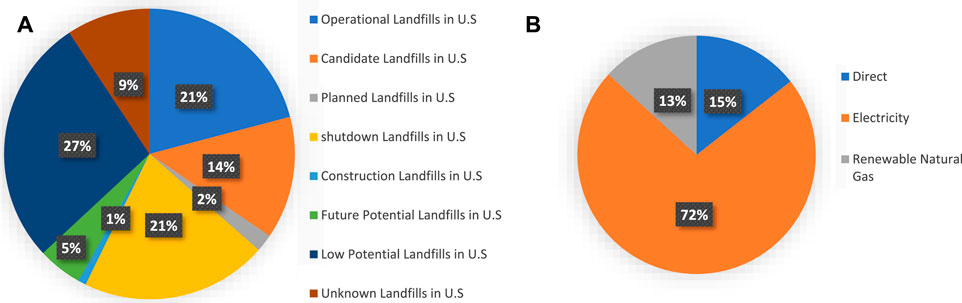
Figure 1. 2022 U.S. Landfill information.
Furthermore, it is apparent that nearly three-quarters of landfill projects prioritize the electricity generation strategy, highlighting its predominant role in methane utilization, as illustrated in Figure 1B. Electricity generation strategy from LFG presents a significant revenue opportunity through grid sales, serving as a strong incentive for landfill operators and municipalities to invest in the technology. Advances in technology have made conversion of LFG into electricity more reliable, efficient, and scalable. This allows landfill operators to enhance their public image and foster better community relations. Both the direct use of Medium-Btu Gas (biogas) and RNG production exhibit similar levels of implementation. However, the demand for biogas can be limited or highly regional. Without a nearby market or easy access to distribution pipelines, the economic feasibility of producing biogas may not be favorable. Furthermore, the equipment required to clean and upgrade landfill gas to RNG standards is costly.
In the state of Texas, low potential landfills (30) constitute approximately 19% of the state’s landfills (US EPA, 2023f), signaling that less than 20% of the landfills present challenges for methane energy harnessing, as shown in Figure 2A. However, operational landfills (33) account for approximately 21% of the total landfills in Texas, demonstrating their proactive engagement in harnessing methane for renewable energy generation. Additionally, the combined category of candidate landfills (46), future potential landfills (5), planned landfills (5), and construction landfills (2) collectively constitute 36% of all the landfills in Texas. This proportion is 1.5 times greater than that occupied by operational landfills, signifying immense untapped potential within this cluster of landfills. These figures underscore a promising opportunity to reduce methane emissions significantly and maximize available space for further development, fostering sustainability in waste management practices throughout the state of Texas.
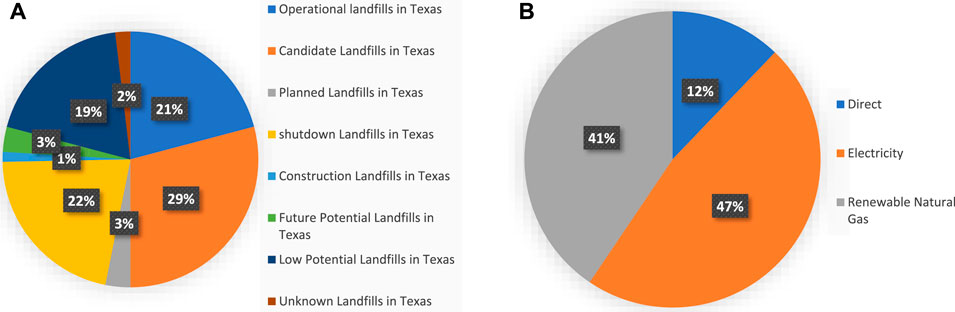
Figure 2. 2022 Texas state landfill information.
Furthermore, it is noteworthy that 47% of these projects prioritize electricity generation, while 41% opt for the RNG approach, as depicted in Figure 2B. This showcases the prominence of RNG as the primary strategy for methane utilization in the state of Texas, emphasizing its significant contribution to the overall energy landscape in Texas. The allocation of resources towards RNG underscores its environmental benefits and economic viability as a clean fuel alternative, thereby contributing to both climate change mitigation and resource conservation efforts within Texas. Additionally, it is noteworthy that 12% of projects in Texas employ Medium-Btu Gas for direct use, mirroring the proportion seen at the national level. This reflects a diversified approach to methane utilization, catering to a range of industries and applications, promoting sustainable practices and energy innovation in the state.
Ox Mountain Sanitary Landfill was 34.1 million tons waste-in-place (2018) in Half Moon Bay, California (US EPA, 2018a). Project developer Ameresco secured the permits, leading to one of the largest LFG electricity projects in the country. Each year, the 11.4-MW project is expected to power up to 10,000 homes in the cities of Palo Alto and Alameda and helped two municipal utilities meet renewable energy goals. In addition, Woolworth Road Landfill (Shreveport Landfill) was 11.1 million tons waste-in-place (2018) in Keithville, Louisiana (US EPA, 2018b). The RNG facility, designed and constructed by SCS Energy pipeline-quality RNG produced from the 2050 scfm LFG is injected into the nearby Enable Midstream Partners interstate natural gas pipeline and offset about 5 percent of the natural gas consumed at University of California (UC)’s campuses. UC is working toward carbon neutrality, RNG from Woolworth Road Landfill is a main renewable source to help meet a net zero footprint.
Sudokwon landfill site is the largest in the world in the west sea of Korea and about 550 Nm3 min−1 of landfill gas can be collected from Sudokwon sites in 2001 (Shin et al., 2005). Shin et al. analyze the impacts of LFG electricity generation on the energy market, the cost of generating electricity and greenhouse gases emissions in Korea using a computer-based software tool called “Long-range Energy Alternative Planning system” (LEAP) and the associated “Technology and Environmental Database.” In the maximum utilization potential scenario, LFG electricity generation technology is substituted for coal steam, nuclear, and combined cycle process. Annual cost per electricity product of LFG electricity facilities of steam turbine process is cost-saving, as 24.4 won/kWh.
Methane is also an important feedstock to the chemical industry. The conversion of both CO2 and CH4 to high-value liquid products has recently attracted attention as a strategy to utilize the wasted (and emitted) CH4 and CO2 streams from landfill sites. Merkouri et al., (Merkouri et al., 2022) introduced a syngas-to-dimethyl ether (DME) process utilizing landfill gas as a feedstock, demonstrating the conversion potential of CH4 and CO2 into valuable products. The process generated an annual income of €3.49 million, predominantly from DME sales and high-pressure steam revenue, with operating expenses amounting to €1.012 million and an operating profit of €2.317 million per year. This techno-economic analysis confirms the feasibility and profitability of the syngas process, emphasizing its potential for LFG utilization and economic returns. Similarly, Lee et al., (Lee et al., 2020) developed an innovative methanol production process from LFG through direct CO2 hydrogenation and methane reforming. With carbon and energy efficiencies reaching up to 92% and 69%, respectively, the LFG-to-methanol process exhibited competitive methanol production costs ranging from 392 to 440 USD/ton. This approach demonstrates promising efficiency and cost-effectiveness compared to conventional methanol production methods, further highlighting its potential as a viable alternative. Furthermore, Zhao et al., (Zhao et al., 2019) proposed a novel technology combining tri-reforming and Fischer-Tropsch Synthesis (FTS) to convert LFG into high-value liquid hydrocarbon fuels such as gasoline, diesel, and jet fuel. Utilizing NiMg/Ce0.6Zr0.4O2 pellets in a tri-reforming reactor, the study achieved impressive CH4 and CO2 conversions of 99% and 60%, respectively, with a favorable H2/CO molar ratio of 1.7. The breakeven cost of diesel fuel production was estimated at $3.24 per gallon, potentially reducing to $2.71 per gallon under the assumption of free LFG supply. These findings underscore the promising prospects of converting landfill gas into liquid fuels, signaling a compelling avenue for commercialization and industrial implementation.
Prior research on LFG utilization has predominantly focused on electricity generation. However, the transition to renewable energy, such as treated LFG, presents a notable challenge for traditional energy services, necessitating new pipeline infrastructure and substantial investments. For instance, the Golden Triangle Landfill, located in the southeast Texas coast, an area rich in chemical industries and refineries (Greater Houston Partnership, 2021). Leveraging the existing industrial infrastructure, LFG project developers can convert LFG into readily transportable renewable energy or renewable feedstock, thereby not only generating profits from treated LFG but also benefiting from subsidies offered by U.S. economic policies.
Regarding economic policies, U.S. federal incentive programs, such as the 45Q carbon tax credit (Jones and Marples, 2023), play a pivotal role in the nation’s portfolio of laws aimed at curbing GHG emissions. These credits incentivize companies and industries to invest in technologies for capturing CO2 emissions from various sources, including industrial facilities and power plants. Furthermore, the commitment to battling climate change goes beyond federal regulations, with individual states supplementing these efforts with their own tailored programs. States have the flexibility to set carbon reduction goals, establish renewable energy portfolio standards, and support initiatives that enhance energy efficiency. Federal programs, coupled with state-level initiatives, encourage the adoption of renewable energy sources. Mechanisms like the Production Tax Credit and the Investment Tax Credit (Jones and Marples, 2023) provide crucial financial incentives for renewable energy projects, enhancing their economic viability and contributing to the expansion of the clean energy sector.
In this project, we embark on a study of developing novel carbon footprint reduction strategies for a landfill located in an industrial zone with a high concentration of petrochemical industry and natural gas pipelines. The hypothesis is that the optimal utilization of LFG should complement the need of energy and raw materials in the region. A multifaceted investigation—including electricity generation, RNG production, and methanol production strategies are conducted. All these are compared with the base case: flaring strategy. The utilization of LFG not only facilitates a more efficient transition to renewable energies but also enhances the economic viability of the region. This study is poised to serve as a crucial reference for policymakers and industry stakeholders aiming to optimize waste management practices and contribute to sustainability. The capital costs, operating expenses, and net profits associated with each strategy were calculated and compared. Additionally, this study evaluates the carbon benefits conferred by these strategies in the context of policy instruments, such as the 45Q carbon tax credits. By providing a comprehensive analysis, this research addresses a significant knowledge gap in the synergy of existing landfill resources and the regional industrial infrastructure.
2 Basic information and calculation methods
2.1 Location of the landfill
Beaumont is a coastal city in Southeast Texas, within the Beaumont–Port Arthur metropolitan statistical area and a population of 115,282 at the 2020 census (US Census Bureau, 2022). There are four MSW landfills in the Beaumont–Port Arthur metropolitan, including three candidates in open status and one low potential with a closed status). Among these, only one candidate, the Golden Triangle Landfill, has the LFG collection system, and it is currently capable of capturing 20% of its LFG emission.
According to the LMOP database (US EPA, 2023g), Golden Triangle Landfill generated 5.39 million standard cubic feet (mmscf) of LFG in 2020. Of this gas, 1.143 mmscf were captured by the collection systems already in place in the landfill. It has a design capacity of 17,358,975 tons, of which there are currently 10,952,530 tons in place. The landfill opened in 1993 and is projected to reach its capacity around the year 2040. It is owned and operated by Republic Services, Inc. (MapQuest, 2023).
In addition, Golden Triangle Landfill is uniquely positioned to take advantage of its untapped landfill gas resources. Not only does it have a gas collection system in place, but it also enjoys proximity to three ideal potential end users, one gas plant and two chemical plants, all within a 7-mile radius, as shown in Figure 3. These facilities have substantial natural gas needs for their primary energy sources and feedstock, offering potential avenues for more lucrative alternatives in RNG production beyond simple pipeline injection. Although this project assumes pipeline injection for most applications to ensure gas quality standards are met, the presence of these nearby consumers underscores the landfill’s potential for diversified and potentially more profitable use of its gas resources.
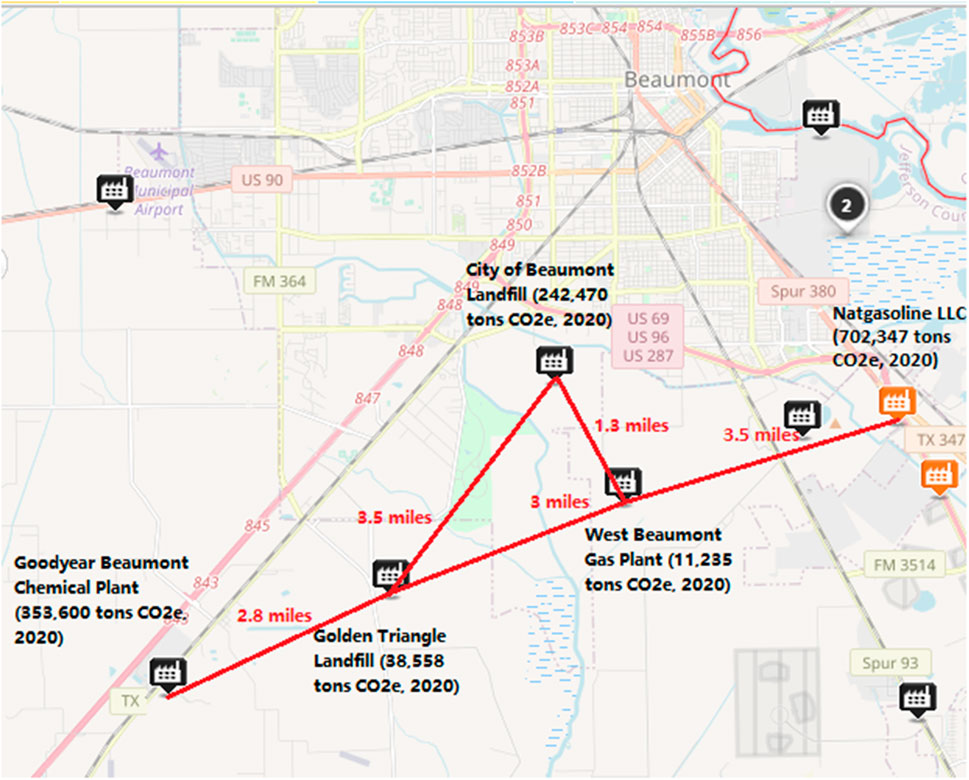
Figure 3. The potential end users in golden triangle landfill case (US EPA, 2023a).
2.2 LFG emission simulation
LandGEM Version 3.03 is an automated estimation tool with a Microsoft Excel interface that can be used to estimate emissions rates for total landfill gas, methane, carbon dioxide, nonmethane organic compounds, and individual air pollutants from municipal solid waste landfills (US EPA, 2023d). LandGEM V3.03 uses the following first-order decomposition rate equation to estimate annual emissions over a time period (Alexander et al., 2005).
where:
The Methane Generation Rate, k, determines the rate of methane generation for the mass of waste in the landfill. The precipitation for Beaumont is more than 1,500 mm (Climate Data, 2024; National Weather Service, 2024) annually so the default k value of “CAA Conventional—0.05” is selected for the model.
The Potential Methane Generation Capacity, L0, depends only on the type and composition of waste placed in the landfill. The higher the cellulose content of the waste, the higher the value of L0. Golden Triangle Landfill accepts various types of municipal solid waste includes garbage, rubbish, ashes, street cleanings, dead animals, medical waste, and all other nonindustrial solid waste (TCEQ, 2023). The default L0 value of “Inventory Wet—96” is selected for the model.
According to data from LMOP, the methane percentage within the landfill gas at the Golden Triangle Landfill was reported as 51.4% in 2020. The methane content (% by volume) of “CAA- 50% by volume” is selected for the model.
2.3 LFG emission amount
We conducted a comprehensive simulation using LandGEM V3.03 to estimate the dynamics of CH4, CO2, and total LFG emissions over the landfill’s operational timeline from 1993 to 2133. The results, illustrated in Figure 4, reveal a consistent upward trend in LFG emissions throughout this period, reaching their maximum with CH4 emissions projected to peak at 2,513 tons (equivalent to 3,740,000 cubic meters) in 2040. Notably, the simulation extends our understanding of the timeline, showcasing that CH4 generation persistently exceeds 1,000 tons and equates to 25,000 tons of CO2 emissions until 2087. This enduring CH4 generation will have long-term environmental impacts.
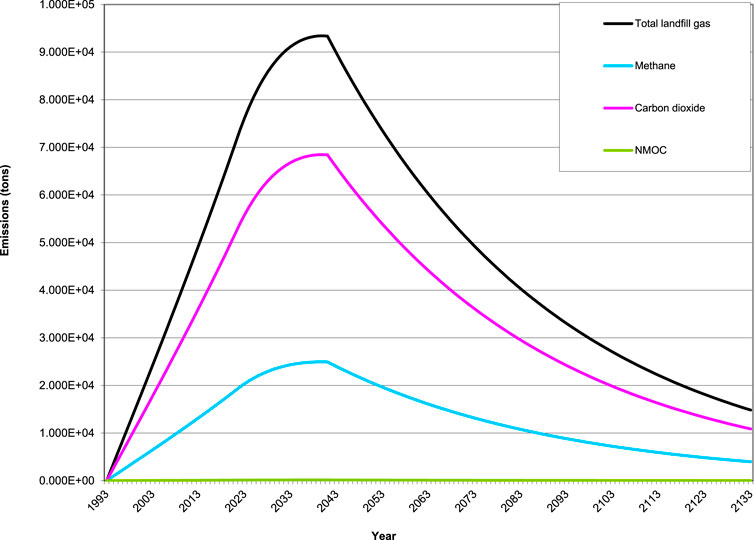
Figure 4. Simulation of landfill gas emission amount in golden triangle landfill from 1993 to 2133.
Furthermore, the simulated total LFG volume in 2021, standing at 5.49 mmscfd, matched the actual LFG volume at the Golden Triangle Landfill, amounting to 5.39 mmscfd. With this robust foundation in place, we are poised to use CH4 generation data from 2024 to 2035 to design equipment specifications, calculate capital costs, operating expenses, and potential profits, and estimate the carbon footprint reductions through the implementation of flaring, electricity generation, and RNG production strategies.
2.4 Four strategies for LFG utilization
2.4.1 Flaring strategy
LFG Flaring is the most basic form of treatment. The gas is first collected, then run through a knockout drum to remove liquid water and a filter to remove large particulate solids. After the removal of solids and liquids, landfill gas can be flared, converting its high methane content into carbon dioxide (US EPA, 2023b).
2.4.2 Electricity generation strategy
The second method, electricity generation, requires the removal of sulfurous compounds and extra water in addition to the primary treatment required for flaring. This treatment creates biogas, a mixture of CH4, CO2, and small quantities of other gases produced by anaerobic digestion of organic matter (US EPA, 2023b), to be burned in an internal combustion engine for generating electricity. Electricity is always a valuable product with high demand.
2.4.3 RNG strategy
The third method requires the removal of carbon dioxide in addition to the treatment needed for the generation of electricity. This produces methane of sufficient purity to be used as pipeline-grade natural gas (US EPA, 2023i), referred to as renewable natural gas, which can be sold as natural gas directly or simply injected into pipelines. The CH4 concentration in pipeline-grade natural gas is 95%–98% while the CO2 concentration is less than 2% (Kelliher et al., 2006; ICF Resources L.L.C, 2022; US EPA, 2023i).
2.4.4 Methanol production strategy
In the fourth and final method, the purification process for LFG is similar to that of electricity generation. In this strategy, it is assumed that the treated CH4 and CO2 are sent to a methanol plant, Natgasline LLC which operates as a large-scale methanol production facility located in Beaumont (Natgasoline, 2024), Texas, for steam reforming reactions (2)–(9) involving CO2 utilization (Lee and Lim, 2020), resulting in the production of syngas—a mixture of CO and H2. Subsequently, this syngas can be utilized in the production of methanol. Notably, this approach can generate a valuable commodity chemical, methanol, while simultaneously contributing to a reduction in carbon emissions.
2.5 Equipment designs
Primary treatment of the gas serves to get rid of the easy-to-remove contaminants, such as condensed water and large particulate matter. The product of this step is only fit for flaring, which serves to convert CH4 in the gas to CO2. A step further involves the washing of the gas to remove siloxanes and other sulfurous compounds then compresses the gas. This product, called biogas, is burned to harness the heat directly or to generate electricity. Alternatively, it can be sent to a steam reforming reaction to produce syngas, which is then used in methanol production. The final step is the removal of CO2 to yield pipeline-quality natural gas (US EPA, 2023b). A membrane was used in this case, mainly to separate CH4 from CO2. The following equations are used to calculate the bare module cost of each piece of equipment (Turton et al., 2018).
where:
The construction costs for land-based natural gas (NG) pipelines reached a record high of $10.7 million per mile for an average diameter of 30 inches in 2023 (Smith, 2023). This translates to an average cost of $356,667 per inch of diameter per mile. The Golden Triangle Landfill is located merely 0.53 miles away from the main natural gas pipeline, known as the Goodrich NG Pipeline, operated by Kinder Morgan Texas Pipeline Co. (Pipeline and Hazardous Materials Safety Administration, 2024). Consequently, 0.53 miles of 5-inch diameter NG pipeline will be constructed to connect with the Goodrich NG Pipeline in the RNG Production strategy and the total pipeline cost is $945,167.
For biogas transportation, the project involving Dooley’s swift in Chippewa, Kandiyohi, and Swift counties, Minnesota, serves as a benchmark. This project entailed laying 25 miles of 4-inch and 3 miles of 2-inch high-density polyethylene (HDPE) pipelines at a total cost of approximately $13.9 million in 2023 (Dooley’s Natural Gas II, 2023). The resulting average construction cost for biogas pipelines is estimated at $131,132 per inch of diameter per mile. Accordingly, a 7.5-mile of 6-inch HDPE pipeline will be constructed to link the Golden Triangle Landfill with Natgasline LLC in the Methanol Production strategy and the total pipeline cost is $5,900,943, as shown in Table 1.
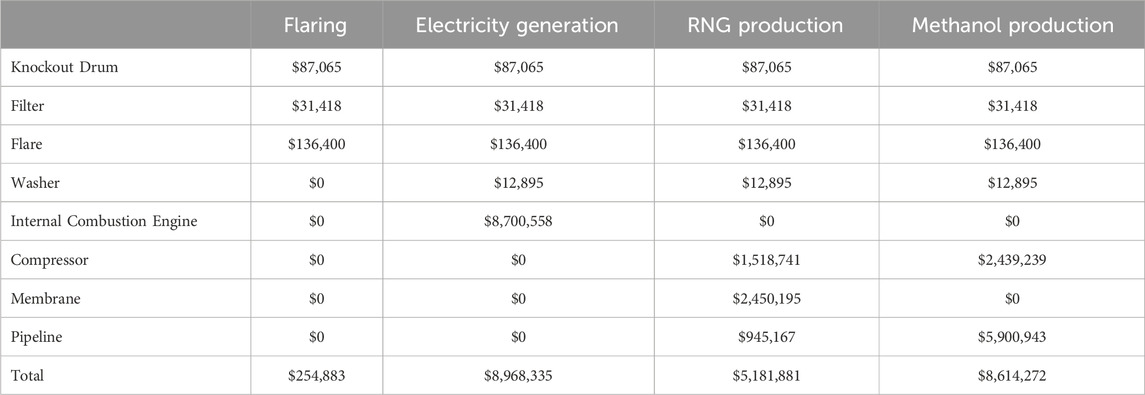
Table 1. Total equipment costs of four strategies.
Furthermore, the Chemical Engineering Plant Cost Index (CEPCI) provides equipment cost in 2024, and an increase of 3% per year was applied to account for inflation. As a rule of thumb, the cost of installing module equipment in an existing facility usually costs about 18% of the bare equipment cost, including contingency costs and fees (Turton et al., 2018). Therefore, the total equipment cost can be calculated by multiplying the bare equipment cost by 1.18. These have been summarized in Table 1.
2.6 Carbon footprint reduction calculation
To calculate the emission reduction of each strategy, our consideration is primarily focused on direct emissions and the carbon dioxide emission equivalents resulting from electricity consumption. The inevitable leakage of pipes was not considered. Direct emissions encompass the emissions from the flare in the flaring method, assuming that CH4 is perfectly combusted into CO2, as well as the emissions from the engine in the electricity generation method, under the same combustion assumption. It is important to acknowledge that LFG collection efficiency is less than 100%, so the LFG that remains uncollected must also be factored in. All emission values are reported in carbon dioxide equivalent (CO2e). Methane’s GWP of 25 is used in the calculation.
The following equations are used to calculate the carbon footprint (CF) values for all four strategies.
where:
The carbon footprint reduction (CFR) is solely calculated based on the quantity of captured CH4. In the flaring strategy, CH4 is intentionally combusted to generate CO2, preventing the direct release of CH4 into the atmosphere. In the electricity generation strategy, methane combustion generates heat to produce electricity. The electricity generation method is considered to be self-sufficient in terms of electricity use. It is assumed that the combustion of LFG perfectly converts CH4 into CO2, thereby making the emissions consist solely of CO2.
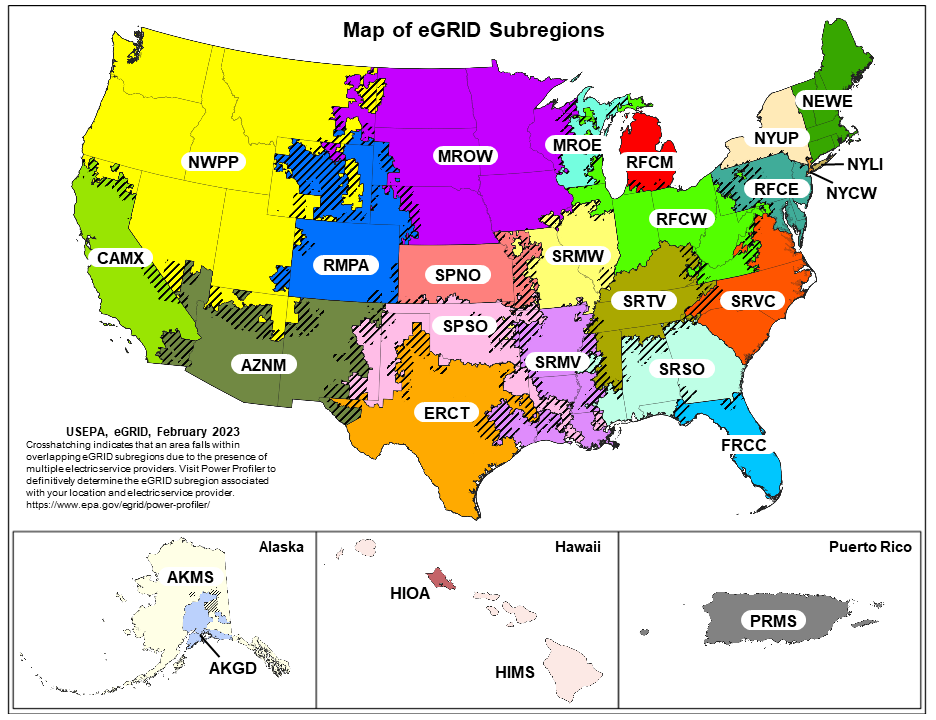
In the production of RNG, a membrane is used to separate CH4 and CO2 in the LFG into two distinct streams where the purified CH4 is sold as RNG, while CO2 can be reserved for storage or utilization. For methanol production, CH4 and CO2 are sent to the steam reformer to produce syngas. Thus, the only emission in these cases beyond that of the uncaptured LFG come from CO2 emissions of electricity usage. The Golden Triangle Landfill, located in Southeast Texas, operates within the SRMV electric grid (US EPA, 2023h), and the carbon footprint of electricity generation in SRMV is 0.86 pounds of CO2 emission/kWh (US EIA, 2022).
2.7 Economic benefits calculation
These economics are based on three key components: capital costs, operating expenses, and the profits associated with each strategy. We assumed a 10-year expected useful life for the equipment, applying the straight-line depreciation method with an annual depreciation expense equivalent to 10% of the equipment cost. Additionally, we accounted for a total of 6 operators, each with a base salary set at $66,910 per year, and an annual increase rate of 3% (Turton et al., 2018). Moreover, maintenance costs were estimated as a constant 5% of the equipment cost per year (Asset Managment, 2024). Furthermore, the profit breakdown will encompass a discussion of the carbon credit market trading and government tax credits.
2.8 Clarification of assumptions
In our analysis, we assumed that the LFG collection system is an integral component of landfill construction, built directly within the buried waste. Consequently, the capital costs associated with the construction and maintenance of the LFG collection system are not included in the overall capital costs of the LFG utilization project. Currently, the Golden Triangle Landfill has achieved only 20% efficiency in its LFG collection. We project that, upon project initiation, the efficiency of LFG capture will gradually increase—from the current 20%–40%, 60%, 80%, and eventually reaching up to 90% over the first 5 years. This incremental improvement is expected to enhance the viability and output of the project significantly. Additionally, for the purposes of financial modeling and simplification, we assume that the electricity, biogas, and RNG prices derived from this project will remain constant over the first 12 years. This assumption could limit revenue projections considering potential market fluctuations. Furthermore, we anticipate a consistent market demand for the products generated, which underpins the economic feasibility of the project.
3 Results and discussion
3.1 Capital cost
The capital costs encompass both necessary equipment and pipeline. The capital costs of each strategy are presented in Figure 5.
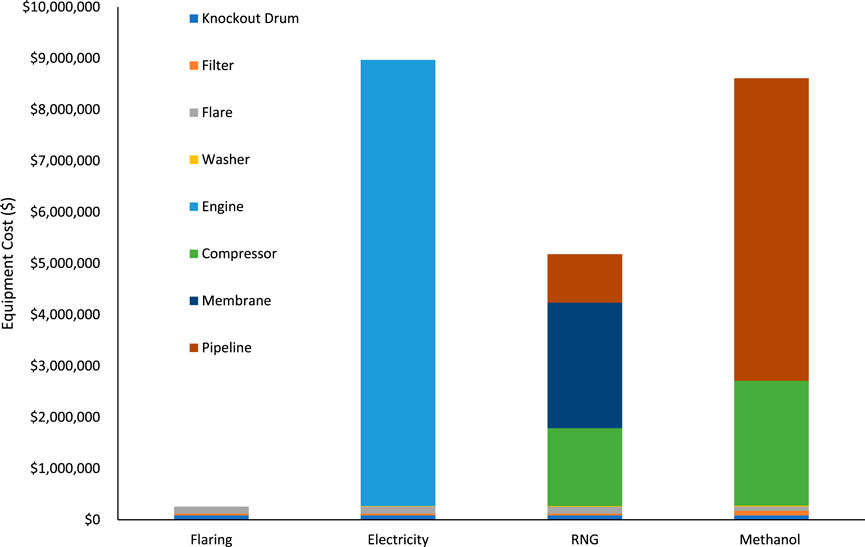
Figure 5. Comparison of equipment costs for four strategies.
Table 1 provides that the Flaring approach has the lowest total capital cost of $254,883. This is primarily due to its simplicity and minimal equipment requirements. Conversely, the Electricity Generation strategy involves substantial investments, predominantly in an Internal Combustion Engine, which represents the majority of the costs at $8,700,558, accounting for 97% of the capital cost shown in Table 1. Additional components, such as a Knockout Drum, Filter, Flare, and Washer, contribute $267,777. The RNG Production strategy requires a capital cost of $5,181,881, primarily for the acquisition of a compressor, a CO2/CH4 separation membrane, and pipelines crucial for converting LFG into RNG. Lastly, the capital cost for the Methanol Production strategy totals $8,614,272, closely matching that of the Electricity Generation strategy. The main expenditure here is the construction of a biogas pipeline, which accounts for about 70% of the cost. This is necessary for syngas production in the methanol process, where the CO2 present in LFG does not need to be removed, necessitating a new biogas pipeline to the methanol plant.
3.2 Operating expenses
The operating expenses for each strategy are divided into five parts: depreciation, maintenance, flaring fuel, electricity, and labor, as shown in Figure 6.
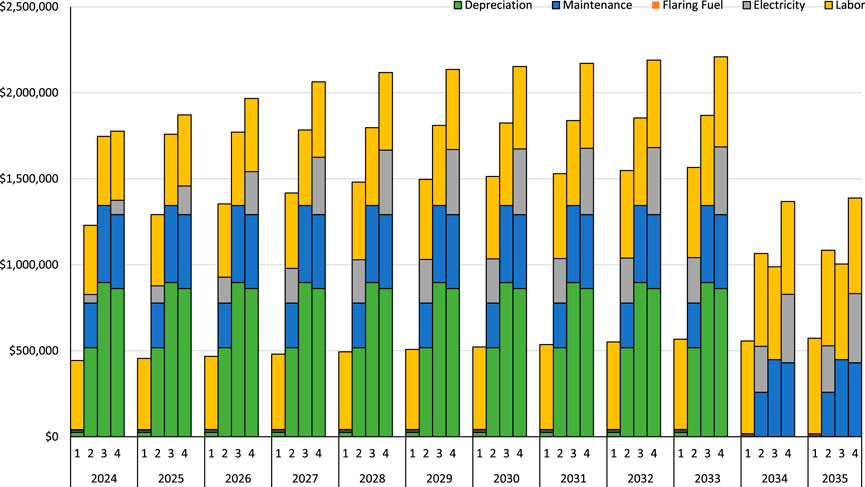
Figure 6. Annual costs for each strategy in 12 years lifetime.
In the case of the flaring strategy, the predominant annual expense is labor fees and maintains relatively lower annual operating expenses. However, for the Methanol Production strategy, the primary annual operating costs are tied to electricity usage and high capital costs, which lead to significant depreciation expenses. Conversely, the Electricity Generation strategy has lower operating costs by generating its own electricity, making it more economical compared to the Methanol Production strategy. The RNG production strategy, benefiting from lower capital costs, sees depreciation expenses significantly offsetting electricity costs, as depicted in Figure 6.
3.3 Net profits
The Golden Triangle Landfill is expected to enhance its LFG capture rate from the current 20%–90% over the first 5 years of the project, with revenue being the primary basis for estimating the economics beyond the 90% capture rate, while the installation costs for improved collection systems are excluded from consideration due to time and scope limitations.
The net profits are linked to each strategy, emphasizing the income derived from selling their products. Our attention is directed towards the production of RNG, electricity generation, and methanol production since the flaring strategy doesn't produce a sellable product.
3.3.1 Net profit of RNG production strategy
The net profit from the sale of RNG is directly influenced by both the amount of RNG produced and its market price, typically linked to natural gas prices. Our choice of $2.51/MMBtu stems from the observation that, in most cases, natural gas prices typically fall within the range of $2-$6/MMBtu, with $2.51 representing a stable midpoint (US EIA, 2023). Table 2 provides insight into the production of RNG and its price when sold at $2.51/MMBtu, given that it is assumed that each cubic foot of methane is approximately 1,050 Btus (Hofstrand, 2014). The sales value undergoes substantial growth during the initial 5 years due to enhanced collection efficiency. Over time, it gradually rises in tandem with increasing LFG emissions from the landfill. Upon full operation of the RNG production strategy, the net profit is estimated to reach approximately $2,225,000 annually.
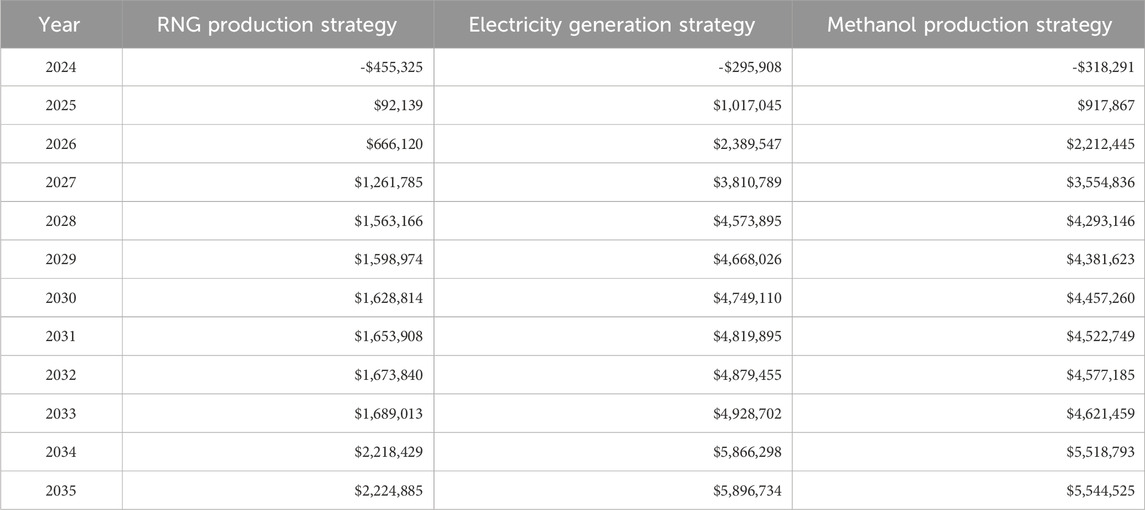
Table 2. Net profit of each strategy.
3.3.2 Net profit of electricity generation strategy
The conversion factor used for turning LFG into electricity is outlined, where 13,000 Btus yield 1 kWh (Clean Air Markets Division, 2024). The amount of electricity consumed in the process is deducted from the electricity produced, and the surplus electricity is sold at a rate of $0.073/kWh based on the average wholesale electricity rate in 2022 and 2023 in the MISO region (Ciampoli, 2024; US EIA, 2024). The outcomes of these calculations are presented in Table 2. As seen in the data, electricity generation experiences a similar pattern to RNG production, with significant growth in the initial years due to enhanced collection efficiency, followed by gradual increases over the project’s extended lifespan. With the electricity generation strategy in full operation, the anticipated annual net profit amounts to around $5,900,000. This reflects the economic dynamics associated with electricity generation from LFG.
3.3.3 Net profit of methanol production strategy
Methanol is a versatile chemical used as a feedstock in the production of formaldehyde, acetic acid, and other chemicals. There is an increasing demand for greener chemical processes and fuels, driven by industries and governments aiming to reduce carbon footprints. Renewable methanol fits well into this trend, especially in the energy sector where it is used for fuel blending in gasoline and as a direct fuel in internal combustion engines and fuel cells. The production cost of renewable methanol is generally higher than that of conventional methanol, primarily due to the complex processes required to convert biomass or capture and utilize CO2. However, technological advancements and economies of scale are expected to reduce these costs. Furthermore, financial incentives such as tax credits, subsidies, and grants for renewable energy projects can enhance the competitiveness of renewable methanol against its fossil-derived counterpart.
Methanol’s liquid state at ambient temperature facilitates its transport and storage. However, producing methanol from renewable sources involves complex supply chain management. A local landfill can provide a stable and economical supply of biogas, which can be transported via a pipeline to the methanol production plant, if the distance between the methanol plant and the landfill is close enough. The revenue generated from biogas sales is estimated at a rate of $0.2/m3, based on industry observations ranging from $0.11/m3 to $0.50/m3 (European Biogas Association, 2024). Results outlined in Table 2 demonstrate that implementing the methanol production strategy could achieve an estimated annual net profit of approximately $5,440,000. Although this is a slight less than the net profit of the electricity generation strategy, it is higher than that of the RNG production strategy. Note that typically, a higher natural gas price will lead to higher biogas price and feedstock price of the methanol plant, as well as lower electricity price. Thus, the profitability and attractiveness of the methanol production strategy will increase if the natural gas price rises.
3.4 Carbon footprint reduction for different strategies
Figure 7 displays the relationship between the carbon footprint and the four strategies. Over the first 5 years, LFG capture efficiency improves incrementally from 20% to 40%, 60%, 80%, and ultimately 90%, resulting in a significant decline in carbon footprint emissions. Correspondingly, the CFR percentages for the flaring and electricity generation strategies exhibit a steady increase, achieving 16%, 32%, 48%, 64%, and stabilizing at 72% when capture efficiency reaches 90%. This trend is attributed to these strategies’ effective control of CH4 emissions, although they lack measures for capturing CO2, indicating potential for further GHG emission reductions. For the RNG and methanol production strategies, the CFR percentages improve to 20%, 40%, 59%, 79%, and upon reaching peak collection efficiency in year five, they consistently demonstrate a higher CFR of 89% compared to flaring and electricity generation. This sustained higher CFR reflects the more comprehensive approach of RNG and methanol strategies in mitigating carbon emissions, as they manage both CH4 and CO2 emissions more effectively. Consequently, the RNG and methanol production strategies consistently maintain a lower carbon footprint than the flaring and electricity generation strategies.
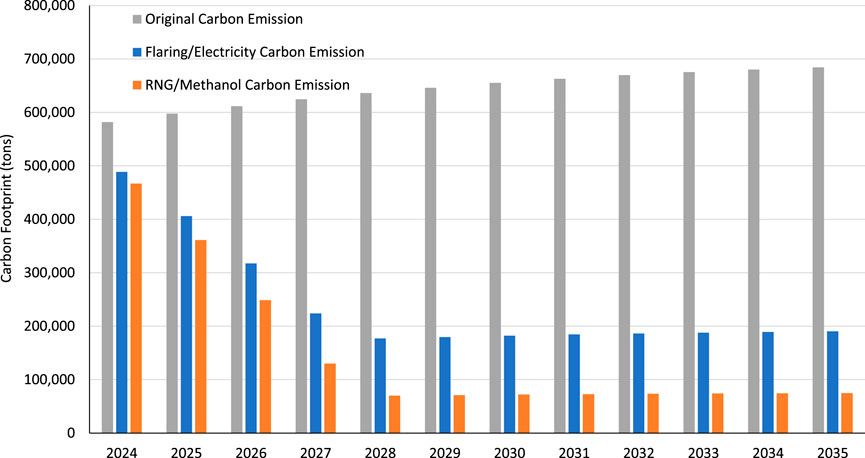
Figure 7. The changes of carbon footprint reduction for each strategy in 12 years.
3.5 Potential profits
Two primary avenues for realizing the value of carbon footprint reduction are governmental incentives (such as 45Q Carbon Tax Credit) and the open carbon trading markets. Each pathway will be explored here, but it is important to note that the profitability in this context is contingent on the decisions made by the owner of an LFG project.
3.5.1 45Q carbon tax credit
The 45Q Carbon Tax Credit is a tax credit for projects that capture carbon emissions, offering a range of credit values depending on project-specific conditions (Jacques, 2023). These values span from a minimum of $12/metric ton CO2e to a maximum of $180/metric ton CO2e. This is by far the highest potential source of income for this project, and in fact the reason for the analyzed lifespan being 12 years is because that is the length of time after installation that this credit is valid.
3.5.2 Carbon credit market trading
The concept of Carbon Credits involves companies being allocated specific emissions quotas, with the option to sell any unused allowances to other companies. While this system is primarily applied to high-GWP gases, including organic compounds, CO2, and CH4. This study explored three distinct carbon credit price points, each rooted in different sectors and industries. The lowest price, set at $6/ton, originates from financial services companies, while the mid-range of $25/ton is dictated by energy companies. Economists and climate experts set the high price at $40/ton (Patnaik and Kennedy, 2021).
Figures 8–10 illustrate the prospective profits of each strategy over time at various carbon credit prices. Interestingly, these carbon credit prices have a minimal impact on the ultimate profits of the electricity generation strategy, as shown in Figure 8. The net profits increase by 32%, 23%, and 6.6% at carbon credit prices of $40/ton, $25/ton, and $6/ton, respectively, compared to the net profits without carbon credit values. This indicates that revenue from electricity sales significantly outweighs that from carbon credit trading. Conversely, for the RNG production strategy, a higher carbon price of $40/ton significantly boosts overall profitability, with carbon credits contributing to 80% of the total net profit. For carbon credit prices of $25/ton and $6/ton, the profits from carbon credits constitute 72% and 38% of the total net profits, respectively. This suggests that for RNG production strategy, revenue from carbon credit profit is more significant than that from RNG sales, as shown in Figure 9.
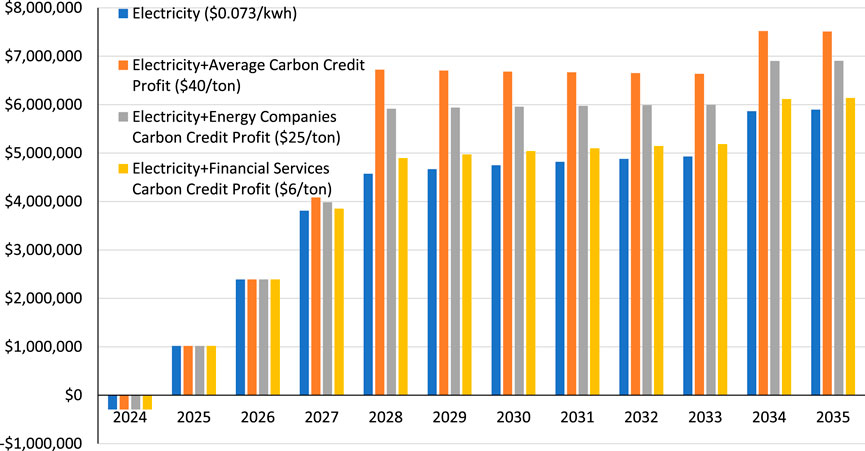
Figure 8. Annual profit of electricity generation strategy with carbon credits.
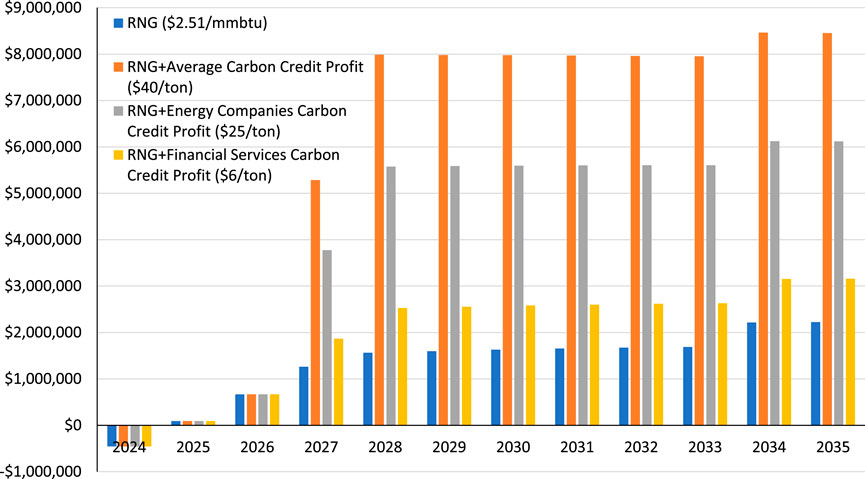
Figure 9. Annual profit of RNG production strategy with carbon credits.

Figure 10. Annual profit of methanol production strategy with carbon credits.
Additionally, Figure 10 reveals that the net profit of the methanol production strategy increases in profitability at the higher carbon price of $40/ton, with approximately three-fifth of the total profit derived from carbon credit market trading. For carbon credit prices of $25/ton and $6/ton, the carbon credit profits account for 48% and 18% of the total net profits, respectively. This indicates a significant decline in the proportion of revenue derived from carbon credit market trading as the carbon credit price decreases.
Comparing the final profits of all four strategies with carbon credit market trading valued at $40/ton, it is evident that the methanol production strategy is significantly more profitable than the RNG production strategy, as shown in Figure 11. The profit of the electricity generation strategy is approximately three-fourths that of the methanol production strategy, indicating that the RNG and methanol production strategies benefit significantly from greater carbon footprint reduction and substantial government policies from carbon credit market trading. The flaring strategy, which does not produce a marketable product, yields the lowest profit among the strategies.

Figure 11. Annual profit with $40/ton carbon credits of each strategy.
3.6 Scenario analysis
Scenario analysis was conducted to understand the impact of various market conditions on revenue streams. Fluctuations in energy prices and changes in carbon credit values were considered under different scenarios. This scenario analysis enabled the identification of conditions that lead to a more economically favorable position for the strategies.
In terms of the energy prices as shown in Table 3, if the electricity price is $0.073/kWh, the electricity generation strategy will yield a net profit of $4,573,895 by 2028, even without carbon credit values. For the methanol production strategy, the projected annual net profit is $4,293,146 by 2028 at a biogas price of $0.2/m³. Note that biogas price ranges from $0.11/m³ to $0.50/m³ (European Biogas Association, 2024). If the biogas price slightly increases to $0.21/m³, the annual net profit for methanol production strategy at $4,573,895 would match the net profit of the electricity generation strategy. At $0.25/m³, methanol’s annual net profit would rise to $7,385,996, surpassing the electricity generation strategy, indicating substantial profit potential. For the RNG production strategy, the projected annual net profit is $1,563,166 by 2028 with a RNG price of $2.51/MMBtu. If the RNG price rises to $5.19/MMBtu, the RNG production’s annual net profit will equal the electricity generation strategy profit of $4,573,895. Natural gas is a primary fuel for electricity generation in Texas. Thus, increases in natural gas prices directly drive-up electricity production costs, leading to higher wholesale electricity prices. This strong correlation extends to biogas and RNG, whose prices also tend to rise and fall in tandem with natural gas. In essence, natural gas prices influence not only the price of electricity, but also the price of alternative fuels derived from it.
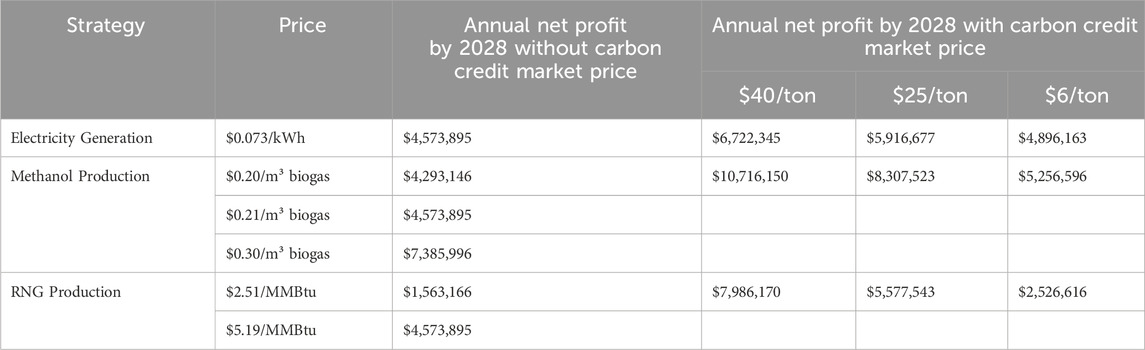
Table 3. Scenarios analysis of annual net profits by 2028 for each strategy.
In terms of carbon credit values as shown in Table 3, the carbon footprint reductions for RNG and methanol production strategies are 89%, while electricity generation strategy achieves an 72% reduction. We investigated carbon credit values set at $6, $25, and $40 respectively. The electricity generation strategy attains a net profit of $6,722,345 with carbon credit trading valued at $40/ton, given its 72% carbon footprint reduction by 2028, and the carbon credit value accounts for 32% of this net profit. For methanol and RNG production strategies, their profits increase from $10,716,150 and $7,986,170, respectively (at 89% reduction), with carbon credit trading at $40/ton by 2028; Carbon credit values account for 80% and 60% of their net profits, respectively. If the carbon credit values are $25/ton and $6/ton, the net profit of electricity generation strategy is $5,916,677 and $4,896,163, respectively, representing decreases of 23% and 6.6% compared to the net profit at $40/ton. The net profit of the methanol production strategy is $8,307,523 and $5,256,596, respectively, decreasing by 22.5% and 50.9% compared to the net profit at $40/ton. Similarly, the net profit of the RNG production strategy is $5,577,543 and $2,526,616, respectively, decreasing by 30.2% and 68.4% compared to the net profit at $40/ton. This indicates that methanol and RNG production strategies are more sensitive to carbon credit values compared to electricity generation.
Overall, the electricity generation strategy stands out as the most stable option, both in terms of energy prices and carbon credit values, making it the most robust choice under varying market conditions. Since the landfill in this study only 6.5 miles away from a methanol plant, the profitability of the methanol production strategy is slightly less than the electricity generation strategy. However, the profitability of the methanol production strategy is highly sensitive to fluctuations in biogas prices. Meanwhile, the RNG production strategy’s profitability is significantly influenced by both natural gas prices and carbon credit values.
4 Conclusion
The capital costs of LFG treatment strategies primarily arise from the procurement and installation of equipment and pipelines. Among these, direct flaring incurs the lowest capital costs, while electricity generation strategy is the most expensive. Over the initial 5-year period, an assumed increase in LFG collection efficiency helps mitigate these costs. In terms of carbon footprint reduction, RNG and methanol production strategies are more effective, achieving reductions of up to 89%. Although slightly lower, flaring and electricity generation strategies still contribute significantly with reductions of 72%. Financially, the strategies differ in profitability and dependence on external income sources like carbon credits. Electricity generation strategy proves stably profitable due to strong local demand and potential earnings from carbon credit trading. RNG production strategy, while beneficial, depends heavily on carbon credits for profitability due to high initial investment costs. Flaring strategy, though not generating sellable products, benefits from minimal initial investment. Methanol production strategy requires a moderate investment of $8,614,272, with 70% of the cost attributed to the construction of pipelines connecting the existing landfill to the existing methanol plant. The profit of the methanol production strategy is only slightly less than the electricity generation strategy due to the short distance between the landfill and the methanol plant. In the future, regional planning that facilitates co-locating landfills or other biogas resources with methanol plants could significantly enhance the attractiveness of methanol production strategy. Moving forward, it is recommended to enhance LFG collection efficiency and explore market opportunities for the biogas, including onsite electricity generation and methanol production strategies. Continual evaluation of carbon credit markets and energy price fluctuations will be very important for decision-making.
Data availability statement
The original contributions presented in the study are included in the article/supplementary material, further inquiries can be directed to the corresponding author.
Author contributions
JF: Data curation, Formal Analysis, Methodology, Software, Visualization, Writing–original draft, Writing–review and editing. HL: Conceptualization, Investigation, Methodology, Project administration, Supervision, Validation, Writing–review and editing. AK: Data curation, Resources, Software, Visualization, Writing–original draft, Writing–review and editing. DC: Project administration, Supervision, Writing–review and editing.
Funding
The author(s) declare that financial support was received for the research, authorship, and/or publication of this article. This research was supported by American Institute of Chemical Engineers (AIChE).
Conflict of interest
The authors declare that the research was conducted in the absence of any commercial or financial relationships that could be construed as a potential conflict of interest.
Publisher’s note
All claims expressed in this article are solely those of the authors and do not necessarily represent those of their affiliated organizations, or those of the publisher, the editors and the reviewers. Any product that may be evaluated in this article, or claim that may be made by its manufacturer, is not guaranteed or endorsed by the publisher.
References
Alexander, A., Burklin, C., and Singleton, A. (2005). Landfill gas emissions model. United States Environmental Protection Agency, Version 3.02 user’s guide. U.S. Environ. Prot. Agency Off. Res. Dev.,
Asset Managment (2024). How much should I budget for maintenance for my equipment? Available at: https://upkeep.com/learning/budget-for-equipment-maintenance/.
Ciampoli, P. (2024). Average wholesale power prices at most major trading hubs generally declined in 2023. Available at: https://www.publicpower.org/periodical/article/average-wholesale-power-prices-most-major-trading-hubs-generally-declined-2023.
Clean Air Markets Division Office of Atmospheric Programs (2024) The emissions and generation resource integrated database eGRID technical guide with year 2022 data. Washington, DC: U.S. Environmental Protection Agency.
Climate Data (2024). Data and graphs for weather and climate in beaumont. Available at: https://en.climate-data.org/north-america/united-states-of-america/texas/beaumont-1525/.
Dooley’s Natural Gas II, L. (2023) ROUTE PERMIT APPLICATION Dooley’s swift project. SW, Willmar, MN, United States: Dooley’s Natural Gas II.
European Biogas Association (2024). IRENA publication: biogas cost reductions to boost sustainable transport. Available at: https://chatgpt.com/g/g-B3hgivKK9-write-for-me/c/c97f14d5-6510-41f4-bf3a-e36daeaeb398.
Hofstrand, D. (2014) Natural gas and coal measurements and conversions. Available at: https://www.extension.iastate.edu/agdm/wholefarm/html/c6-89.html.
ICF Resources L.L.C (2022) Michigan renewable natural gas study final report. Reston, Virginia, United States: ICF Resources L.L.C.
Jacques, G. (2023). Post-IRA tax incentive regime for carbon capture. Available at: https://www.projectfinance.law/tax-equity-news/2023/july/post-ira-tax-incentive-regime-for-carbon-capture-renewable-natural-gas-and-clean-hydrogen/.
Jones, A. C., and Marples, D. J. (2023) The section 45Q tax credit for carbon sequestration. Washington, D.C., USA: Congressional Research Service.
Kelliher, J. T., Brownell, N. M., and Kelly, S. G. (2006). POLICY STATEMENT ON PROVISIONS GOVERNING NATURAL GAS QUALITY AND INTERCHANGEABILITY IN INTERSTATE NATURAL GAS PIPELINE COMPANY TARIFFS, UNITED STATES OF AMERICA FEDERAL ENERGY REGULATORY COMMISSION. Available at: https://www.ferc.gov/major-orders-regulations/policy-statements.
Lee, J., Kim, S., Kim, Y. T., Kwak, G., and Kim, J. (2020). Full carbon upcycling of landfill gas into methanol by integrating CO2 hydrogenation and methane reforming: process development and techno-economic analysis. Energy 199, 117437. doi:10.1016/j.energy.2020.117437
Lee, S., and Lim, H. (2020). Utilization of CO2 arising from methane steam reforming reaction: use of CO2 membrane and heterotic reactors. J. Ind. Eng. Chem. 91, 201–212. doi:10.1016/j.jiec.2020.08.001
MapQuest (2023). Republic services golden Triangle landfill. Available at: https://www.mapquest.com/us/texas/republic-services-golden-triangle-landfill-409893738.
Merkouri, L. P., Ahmet, H., Ramirez Reina, T., and Duyar, M. S. (2022). The direct synthesis of dimethyl ether (DME) from landfill gas: a techno-economic investigation. Fuel 319, 123741. doi:10.1016/j.fuel.2022.123741
Natgasoline (2024). Natgasoline introduction. Available at: https://www.natgasoline.com/.
National Weather Service (2024). Current climate graphs for beaumont/port Arthur. Available at: https://www.weather.gov/lch/bptclimategraphs.
Patnaik, S., and Kennedy, K. (2021). Why the US should establish a carbon price either through reconciliation or other legislation. Available at: https://www.brookings.edu/articles/why-the-us-should-establish-a-carbon-price-either-through-reconciliation-or-other-legislation/.
Pettus, A. (2009). Methane: TAPPING the untapped potential, clean air task force. Available at: https://www.catf.us/resource/methane-tapping-the-untapped-potential/.
Pipeline and Hazardous Materials Safety Administration (2024). Public viewer. Available at: https://pvnpms.phmsa.dot.gov/PublicViewer/.
Shin, H. C., Park, J. W., Kim, H. S., and Shin, E. S. (2005). Environmental and economic assessment of landfill gas electricity generation in Korea using LEAP model. Energy Policy 33, 1261–1270. doi:10.1016/j.enpol.2003.12.002
Smith, C. E. (2023). Land pipeline construction costs hit record $10.7 million/mile. Available at: https://www.ogj.com/pipelines-transportation/pipelines/article/14299952/land-pipeline-construction-costs-hit-record-107-million-mile.
TCEQ (2023). Types of municipal solid waste processing and disposal facilities, and wastes that may Be accepted. Available at: https://www.tceq.texas.gov/permitting/waste_permits/msw_permits/waste-types/msw_types.html.
Turton, R., Shaeiwitz, J. A., Bhattacharyya, D., and Whiting, W. B. (2018) “Analysis,” in Design and Synthesis of chemical processes. London, United Kingdom: PEARSON.
US EIA (2022). How much carbon dioxide is Prod. per kilowatthour U.S. Electr. generation? Available at: https://www.eia.gov/tools/faqs/faq.php?id=74&t=11/.
US EIA (2023). Natural gas price. Available at: https://www.eia.gov/.
US EIA (2024) Wholesale electricity and natural gas market data. Washington, D.C. United States: U.S. Energy Inf. Adm.
US EPA (2018a). Ox Mountain landfill gas electricity project. Available at: https://www.epa.gov/lmop/landfill-gas-energy-project-data#ox.
US EPA (2018b). Shreveport landfill renewable natural gas. Available at: https://www.epa.gov/lmop/landfill-gas-energy-project-data#shreveport.
US EPA (2023a). 2022 greenhouse gas emissions from large facilities. Available at: https://ghgdata.epa.gov/ghgp/main.do#/facility/?q=FindaFacilityorLocation&st=TX&bs=&et=&fid=&sf=11001100&lowE=-20000&highE=23000000&g1=1&g2=1&g3=1&g4=1&g5=1&g6=0&g7=1&g8=1&g9=1&g10=1&g11=1&g12=1&s1=1&s2=1&s3=1&s4=1&s5=1&s6=1&s7=1&s8=1&s9=1&s10=1&s201=.
US EPA (2023b). Basic information about landfill gas. Available at: https://www.epa.gov/lmop/basic-information-about-landfill-gas.
US EPA (2023c). About the landfill methane Outreach program. Available at: https://www.epa.gov/lmop/about-landfill-methane-outreach-program.
US EPA (2023d). Emissions estimation tools. Available at: https://www.epa.gov/air-emissions-factors-and-quantification/emissions-estimation-tools.
US EPA (2023e). Inventory of U.S. Greenhouse gas emissions and sinks. Available at: https://www.epa.gov/ghgemissions/inventory-us-greenhouse-gas-emissions-and-sinks.
US EPA (2023f). Landfill gas energy project data. Available at: https://www.epa.gov/lmop/landfill-gas-energy-project-data.
US EPA (2023g). Landfill technical data. Available at: https://www.epa.gov/lmop/landfill-technical-data.
US EPA (2023h). Map of eGRID subregions. Available at: https://www.epa.gov/system/files/images/2023-05/eGRID2021_subregion_map.png.
US EPA (2023i). Overview of the oil and. Nat. Gas. Ind., Available at: https://www.epa.gov/natural-gas-star-program/overview-oil-and-natural-gas-industry#:∼:text=GatheringandProcessing%3AStrippingout,95-98percentmethane).
Keywords: landfill gas, renewable energy, carbon footprint reduction, potential benefits, methanol production strategy
Citation: Fang J, Lou HH, Kolp A and Chen D (2024) Strategies for converting landfill gas to renewable energy and renewable feedstock: synergy with the hydrocarbon industry. Front. Energy Res. 12:1420713. doi: 10.3389/fenrg.2024.1420713
Received: 21 April 2024; Accepted: 29 May 2024;
Published: 19 June 2024.
Edited by:
Pierangela Cristiani, Ricerca Sul Sistema Energetico, ItalyReviewed by:
Mudasir A. Dar, Jiangsu University, ChinaJay Zarnikau, The University of Texas at Austin, United States
Copyright © 2024 Fang, Lou, Kolp and Chen. This is an open-access article distributed under the terms of the Creative Commons Attribution License (CC BY). The use, distribution or reproduction in other forums is permitted, provided the original author(s) and the copyright owner(s) are credited and that the original publication in this journal is cited, in accordance with accepted academic practice. No use, distribution or reproduction is permitted which does not comply with these terms.
*Correspondence: Helen H. Lou, SGVsZW4ubG91QGxhbWFyLmVkdQ==