 Xuan Yang1
 Hao Xu
- 1State Grid Hangzhou Power Supply Company, Hangzhou, China
- 2Zhejiang University of Technology, Hangzhou, China
In recent years, the ever-rising penetration of distributed photovoltaics (PV) power has presented substantial challenges in power system dispatch due to its inherent randomness and unpredictability. To bridge this gap, this paper proposes a two-stage robust optimization method for power system security dispatch considering traditional generators as well as flexible resources, such as load demand response and energy storage systems. Specifically, a price-based demand response model is established to optimize the system’s load curve during a day. On this basis, a two-stage optimization problem for day-ahead and intra-day power system dispatch model is proposed. The dispatch objective is to minimize the overall cost in worst-case scenarios through properly scheduling unit commitment (UC) as well as flexible resources in each dispatch interval. Column and constraint generation (C&CG) algorithm is adopted for problem solving. The effectiveness of the proposed method is validated by case studies based on a modified 6-node system and a 24-node system. Simulation results indicate that through appropriately scheduling the energy storage system and load demand response, the proposed dispatch method can significantly reduce the total operation cost of a PV rich power system, which in turn facilitates the integration of PV power.
1 Introduction
In recent years, distributed photovoltaic (PV) power generation has emerged as an effective solution to mitigate the carbon emission of the society. China has explicitly outlined its objective of achieving “carbon peak and carbon neutralization”, and the government has implemented various policies, such as electricity subsides, to support the further development of renewable energy resources including PV power (Xue et al., 2014; Wang et al., 2023; Yu et al., 2024). As a result, China achieved a noteworthy milestone in clean energy generation, reaching 2.54 trillion kilowatt-hours in 2023 (increased by 5.3% year-on-year), which accounts for 30.26% of the total electricity power generation across the country. However, the growing penetration of PV power may significantly challenge the dispatch and security operation of a power system due to the volatile nature of PV power (Gao et al., 2023; Ju et al., 2023; Yu et al., 2023).
To ensure the secure and reliable operation of the system and the effective utilization of renewable energy resources such as PV power, the most direct approach to addressing output fluctuations is installing energy storage devices on the generation side for power smoothing. The energy storage device is able to deal with bi-directional power flows and it thus has the capability of cross-time energy transfer (Chen et al., 2021; Ge et al., 2022). The introduction of energy storage device allows for the storage of excess electric energy during periods when PV power generation exceeds the load demand. Conversely, the energy storage device will release the electricity energy during demand peaks or when PV power generation is insufficient. This strategy safeguards the stability of the power system, mitigating the curtailment of solar resources. In Li et al. (2017), a case of power grid energy storage based on the Monte Carlo method was presented, demonstrating the effectiveness of energy storage technology in handling uncertain factors. In Hajipour et al. (2015), the author proposed a novel energy storage technology aimed at optimizing power grid operations; however, the associated management costs were high, and there was no reduction in the operational costs of the power grid. In Liu et al. (2023), the author explored the hierarchical optimal configuration of distributed energy storage in distribution networks with a high PV penetration. A multi-objective model was established and solved using an improved genetic algorithm, validating that a judicious configuration of distributed energy storage can achieve peak cutting and valley filling. Considering the necessary dispatch costs and the potential impact on environment, the demand response (DR) and energy storage systems should be properly coordinated to optimize the load curve, which will consequently enhance the operation flexibility and economic efficiency of a power system.
DR aims to guide or encourage users to adjust their power consumption patterns at specific times or under defined conditions in response to the power system’s load demand. DR can be categorized into two types: price-based and incentive-based. Price-Based Demand Response (PBDR) directs users to reduce electricity consumption during periods of high electricity prices, leveraging changes in electricity prices such as peak-valley differentials. Incentive-Based Demand Response motivates consumers to adopt specific power management measures through incentives or incentive mechanisms, playing a crucial role in balancing supply and demand, enhancing efficiency, reducing electricity tariffs, and promoting sustainable energy use in the electricity market. In Kang et al. (2023), the author proposed an optimal scheduling method for an integrated energy source system that incorporates demand response. With the dual objectives of minimizing economic costs and carbon emissions, the method was demonstrated to enhance the distribution of the system load. In the context of cooperative optimal scheduling discussed in Zhu et al. (2020), the rational allocation of DR resources leads to a 6% increase in PV power consumption rates. In Du and Wei (2020), the author addressed two types of demand responses and establishes a two-stage optimal scheduling model. The results highlight that the two-stage model enhances PV consumption capacity compared to solely considering the day-ahead phase.
The aforementioned studies had explored the impact of energy storage and demand response on the load in distributed energy systems, yet they had not addressed the uncertainty associated with renewable distributed energy generation (Han et al., 2020; Tian et al., 2021; Zhu et al., 2021). The output of PV generation is subject to volatility and unpredictability, influenced by weather and natural conditions. Fluctuations in PV necessitate additional flexibility resources in the power system to provide backup (Wang et al., 2012; Zhang et al., 2013; Zhang et al., 2019). However, as the permeability of renewable distributed energy increases, the availability of flexibility resources in the system decreases, resulting in reduced overall system flexibility (Cheng et al., 2019; Wang et al., 2021; Wen et al., 2024). This contradiction has emerged as a constraint on the development of renewable energy sources. In Alireza et al. (2017), the uncertainty of renewable energy is characterized using a probability distribution function, and a stochastic optimization method is applied to address the associated challenges. This approach facilitates probabilistic modelling of the variability of renewable energy resources. In Ji et al. (2015), the author established a robust optimization model to determine the optimal operating cost of the system under the worst-case scenario for wind power. In Wei et al. (2022), considering the uncertainty in the scene distribution probability of PV in the power grid, a two-stage robust distribution optimization model was proposed.
Building upon the preceding analysis, this paper introduces a methodology that incorporates demand response and energy storage to optimize the system load curve. The objective is to minimize the system’s operating cost in the worst-case scenario involving uncertain PV power output. A two-stage robust optimization model is devised, addressing both day-ahead and intraday stages. Initially, price-based demand response measures are implemented on the user side. Simultaneously, a power system dispatch model encompassing energy storage and load demand response is formulated. In the day-ahead stage, reserve capacity is strategically allocated to meet base load demand and address uncertainties. Subsequently, in the intra-day stage, the goal is to minimize real-time scheduling costs under the worst operating scenarios. This three-level robust optimization problem can be iteratively solved by the column and constraint generation (C&CG) algorithm. Simulation results indicate that the day-long load curve can be optimized through our proposed method, which helps the integration of renewable energy resources such as PV power into power systems, as well as the reduction of overall operation cost of a power system.
Despite extensive research on PV system operation with energy storage, power system operation with demand response, and uncertainty handling in renewable energy generation, this study introduces several key innovations and addresses specific gaps in the existing literature:
Integration of Multiple Flexible Resources: Previous studies have often examined the use of energy storage or demand response independently. This paper explores their combined effect in a robust optimization framework, which is crucial for enhancing system flexibility and reliability.
Two-Stage Robust Optimization Approach: Unlike conventional methods, this paper employs a two-stage robust optimization model that considers both day-ahead and intra-day uncertainties. This approach allows for dynamic adjustments and more resilient scheduling, ensuring the power system can effectively respond to real-time fluctuations in PV output.
Application of Column and Constraint Generation Algorithm: The use of the Column and Constraint Generation (C&CG) algorithm for solving the multilevel optimization problem is a novel aspect. This method improves the computational efficiency and feasibility of obtaining optimal solutions in complex scenarios.
By addressing these aspects, this study not only advances the theoretical understanding of robust optimization in PV-rich power systems but also provides practical insights and tools for improving system operation and integration of renewable energy sources. Therefore, the necessity of this study lies in its potential to enhance the reliability, economic efficiency, and sustainability of power systems facing increasing PV penetration.
2 Demand response model
This paper adopts the PBDR model to regulate the electricity consumption behavior of users through varied electricity prices across different periods. The model aims to diminish electricity consumption during peak periods, optimize the load curve, and enhance the flexibility of power grid operations. Distinct electricity price levels are established or different time intervals, with higher prices set during peak hours and lower prices during off-peak periods. The users’ responsiveness to electricity prices is quantified using the commonly employed elastic coefficient. Following the implementation of PBDR on the demand side, a relationship emerges between the change in load and the alterations in time-of-use prices. This relationship can be expressed as follows:
Equations. 1–3:
3 Power system model with PV power, energy storage and demand response
The distributed power supply in the power grid mainly includes generators, battery energy storage, PV, and so on.
3.1 Unit operation modeling
The power generation cost function of the generator set is mainly calculated by variable costs. In this paper, a quadratic function model related to power generation is established to represent the operation cost of the generator.
Equation. 4:
3.2 Unit output constraints
The output of the generator set is limited by the rated power, and its available reserve capacity does not exceed the maximum output power of the generator.
Equations 5, 6:
3.3 Constraints on the ramp rates
Considering the generator type, rated capacity, and load requirements, the following ramp up/down rate constraints are established:
Equations 7, 8:
3.4 Constraints on energy storage systems
Considering the factors affecting the life of the energy storage device, the constraints established in this paper mainly include the energy storage capacity and the upper and lower limits of charge and discharge power.
Equations 9–13:
3.5 Constrains on PV power generation
The output of PV is affected by many factors, and its output is predicted according to historical data and meteorological conditions.
Equation 14:
3.6 Constraints on the line power flow
The line flow constraints maintain the stability of voltage at various nodes and ensure the safe and stable operation of the power system under normal conditions and during faults.
Equations 15–17:
3.7 Constraints on the reserve capacity
The equipment that can provide reserve capacity in the system established in this paper is a generator and energy storage. Under the premise for the providing sufficient reserve capacity of power grid, the combination mode of unit and energy storage output should be set up reasonably.
Equations 18–21:
3.8 Constraint on the demand response
After PBDR implementation, each node’s load change stays within its limit, and the overall power consumption remains unchanged during the dispatch cycle.
Equations 22–25:
3.9 Constraints on the power balance
Maintain the balance of power production and power consumption within the system to ensure the stable operation of the power system. Power production includes generator output, PV output, and energy storage discharge power; power consumption includes line transmission power, energy storage charging power, and load electricity consumption.
Equation 26:
4 Two-stage robust optimization model
The increasing integration of distributed photovoltaic (PV) power generation into power systems presents significant challenges due to its variability and unpredictability. This paper addresses the problem of optimizing the dispatch of a PV-rich power system composed of traditional generators, energy storage systems, and demand response resources. The primary goal is to ensure secure and economical operation of the power system under varying scenarios, particularly focusing on worst-case conditions caused by PV output fluctuations. The system operates by balancing the generation from traditional units with the flexibility provided by energy storage and demand response measures, aiming to maintain reliability while minimizing operational costs. This problem is particularly relevant for power systems with high PV penetration where traditional methods struggle to cope with the variability of renewable energy sources.
A two-stage robust optimization method is established in this paper. The uncertainty associated with PV output is represented by an uncertain set. In the initial stage, utilizing historical data or weather forecasts, the uncertainty of PV output is estimated. This involves selecting a reference value or average value to formulate an initial plan, allocating reserve capacity to meet basic load demand, and addressing uncertainties. Subsequently, in the second stage, using real PV output data, the power system’s operation strategy is adjusted. This adjustment encompasses the allocation of generator output and reserve capacity to minimize costs under uncertainty or maximize the robustness and reliability of the power system. The objective function of the model is:
The two-stage robust optimization model offers the advantage of flexibly adjusting the power system’s operation strategy in response to various fluctuations in PV output. This adaptability ensures that the power grid can effectively manage the fluctuations in PV and maintain stable operation. The model contributes to reducing the uncertainty risks associated with the variability of PV, simultaneously enhancing the integration of distributed energy within the power system. This becomes crucial in promoting the utilization of renewable energy and decreasing reliance on traditional power generation.
4.1 Modeling uncertainty factors
The primary sources of uncertainty considered in this paper stem from the variability in PV power generation. Building on existing literature, an uncertain set U is defined to encapsulate the model’s uncertain factors. The focus of the study is to identify the worst-case scenario, prompting a specific consideration for the fluctuation of PV output. This approach better aligns with the criteria for determining the “worst scenario”. Consequently, the following uncertain sets can be established:
Equation. 28:
The magnitude of the uncertainty limit signifies the extent of uncertainty incorporated into the model. A larger limit enhances the robustness of the optimal scheduling result obtained by the model; however, it may lead to an overly conservative dispatching method, resulting in a significant increase in the operating cost of the power system. Therefore, in balancing robustness and economic considerations, the dispatcher should judiciously set the uncertainty limit to attain the optimal scheduling method.
4.2 Day-ahead dispatch model
The first stage involves day-ahead dispatching, comprising the following tasks: a) forecasting daily load demand using historical data; b) predicting PV output based on meteorological and historical data; c) assigning reserve capacity based on load forecasts to ensure stable power system operation in response to load variations.
4.2.1 Objective function
In the day-ahead stage, the objective is to minimize the dispatching cost of the power grid. The decision variables encompass generator output, reserve capacity, and the charge and discharge power of energy storage.
Equation 29:
4.2.2 Constraints
Equations 4–25 encompass the constraints adhered to by the power system operation model in the first stage. These constraints include equipment operation constraints, reserve capacity constraints, transmission constraints, PV output constraints, among others. They are integrated into the optimization process to guarantee that the scheduling strategy aligns with all essential requirements. Simultaneously, to uphold the reliability of the power grid amid uncertainty, the power balance constraints specified in Eq. 26 must be satisfied.
4.3 Intra-day dispatch model
The second stage involves real-time scheduling, wherein the actual PV outputs are known. Operators, during this phase, must adapt the operational strategies of the power system dynamically based on the actual conditions to ensure the reliability and stability of the grid. This process includes monitoring the actual PV outputs and comparing them with predicted values to identify any discrepancies. In response to real-time conditions, actions are taken, such as adjusting generator outputs, reconfiguring transmission lines, and allocating reserve capacity.
4.3.1 Objective function
The real-time scheduling phase introduces uncertainty factors, aiming to minimize the real-time scheduling cost under the system’s worst operating conditions. The decision variables encompass reserve capacity, PV outputs, and the amount of emergency load shedding.
Equation 30:
4.3.2 Constraints
To guarantee the stable operation of the system, power flow constraints are established as follows.
Equations 31–33:
Equations 34–36:
Equation 37:
Equation 38:
5 Solution methodologies based on C&CG algorithm
5.1 Model formulation
The scheduling model developed in this paper is a day-ahead-real-time-two-stage model with a three-tier structure, posing a challenge for direct solutions using general commercial solvers like CPLEX and GUROBI. Existing solving methods include the Benders decomposition method and the column and constraint generation algorithm (C&CG algorithm). Both methods decompose the multilevel optimization problem into a master problem and a bilevel subproblem. They transform the inner min structure into max structure and merged with the outer structure using strong duality theory or KKT conditions, then iterate the principal subproblem to find the optimal solution. The two-stage robust optimization problem established in this paper is a mixed-integer programming problem. The column and constraint generation (C&CG) algorithm is particularly efficient in solving such problems. Hence, the C&CG algorithm is employed to decompose the aforementioned multilevel optimization problem. The model can be expressed in the following form:
Equations 39–41:
According to the reference, the above model is decomposed and the following principal subproblems are obtained. The principal problem of the
Equation 42:
The subproblem is a
Equation 43: the variable
There is a bilinear term
Where M is a very large positive real number.
5.2 Implementation for the model
The C&CG algorithm is applied to optimize the dispatch of a PV-rich power system by integrating demand response and energy storage. In the day-ahead stage, the objective is to minimize the total dispatch cost, including generation, energy storage operation, and reserve costs. This involves constraints on generation limits, reserve requirements, demand response adjustments, energy storage operations, and overall power balance. The goal is to ensure that the total generation matches the load demand while efficiently managing the flexibility provided by energy storage and demand response.
In the intra-day stage, the objective shifts to minimizing real-time scheduling costs, considering reserve capacity adjustments, penalties for deviations in PV output, and emergency load shedding costs. The algorithm dynamically adjusts generation outputs and reserve allocations based on actual PV outputs and system conditions.
The iterative C&CG algorithm process involves solving a master problem to obtain first-stage decision variables and an auxiliary variable, followed by solving a subproblem to identify the worst-case scenario and corresponding second-stage decision variables. The objective function’s upper and lower bounds are updated iteratively, ensuring convergence when the bounds difference is minimal.
5.3 Algorithm description
Following the aforementioned discussion, the two-stage robust optimization model can be equivalently converted into a mixed-integer linear programming problem. The solution procedure of the C&CG algorithm in iteratively solving the main and sub-problems are demonstrated as follows:
Step 1: given the initial bad scene, set the number of iterations
Step 2: solve the main problem shown in Eq. 40, obtain the optimal solution
Step 3: replace the solution obtained from the main problem into the subproblem shown in Eq. 41 and determine the objective function value of the subproblem
Step 4: if
Let
6 Case studies
This paper conducts an analysis of the 6-node system and the IEEE 24-bus (Trtst, 1979) test system. Figure 1 illustrates the system wiring diagram. The model is solved using the Cplex solver in the Matlab environment to validate its effectiveness. Figure 2 showcases the predicted values of PV power and load demand during a day. The mutual elasticity coefficient and self-elasticity coefficient of PBDR are specified as 0.02 and −0.4, respectively. Table 1 provides the operational parameters for the equipment in the model.
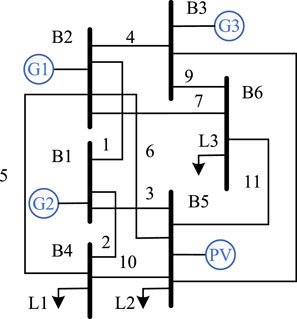
Figure 1. Diagram of 6-bus system.
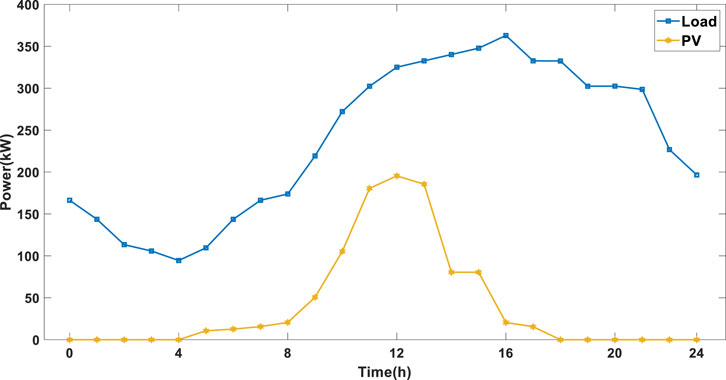
Figure 2. The forecast data of PV power and load.
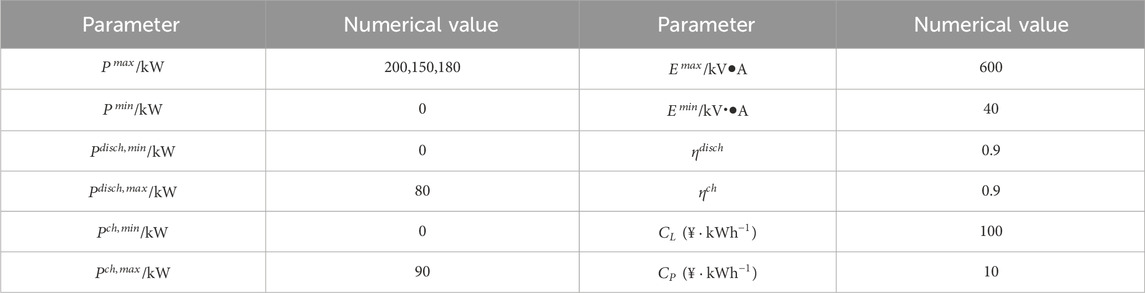
Table 1. Operational parameters of the equipment within the model.
6.1 Optimal scheduling results under the different scenarios
In order to further study the impact of uncertain factors on the scheduling results of the model, simulation results of two scenarios are demonstrated as below.
Scenario 1: the uncertainty of PV power generation is not considered. Scenario 2: the uncertainty of PV power generation is considered. The optimal results of the model in different scenarios are shown in Table 2.
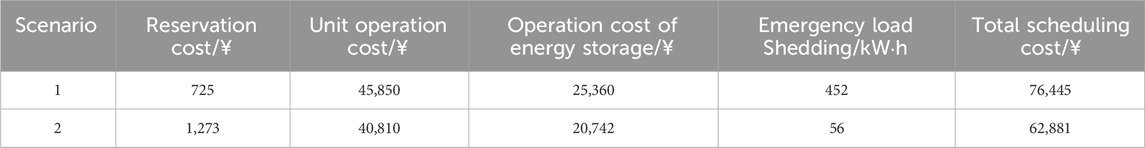
Table 2. Optimized scheduling results in different scenarios.
Scenario 1 does not consider the impact of uncertainties, representing the traditional deterministic dispatch method. Comparing Scenario 1 and Scenario 2, considering the uncertainty of photovoltaic and wind power output, the system’s emergency load shedding decreases by 396 kW·h under the most severe operating scenario, as shown in Table 2. It can be seen that the total scheduling cost in such scenarios is the highest, but it also indicates that the system’s ability to cope with adverse scenarios is stronger.
6.2 The influence of uncertainty limit on the scheduling results
To examine the influence of the uncertainty limit on the scheduling results of the model, in the 24-node system, the uncertainty limits
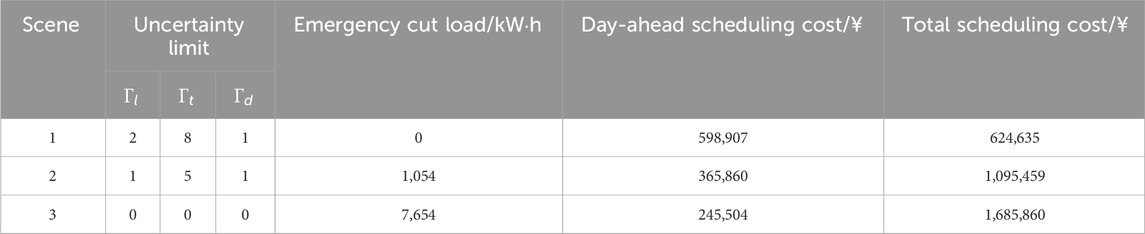
Table 3. Optimized scheduling results considering different uncertainty limits.
Analyzing the solution results reveals that an increase in the uncertainty limit corresponds to a rise in the day-ahead scheduling cost. This implies that the system requires a greater reserve capacity to fulfill the load demand. Concurrently, the emergency load cut and the total scheduling cost witnessed significant reductions. This highlights the significance of selecting an appropriate uncertainty limit to balance low operating costs while enhancing the safety and reliability of system operation.
6.3 The influence of demand response on system operation
By adjusting electricity prices, users can be guided to modify their consumption behavior, thereby optimizing the load curve and achieving peak shaving and valley filling in the power system.
Figures 3, 4 show the changes of load and electricity price before and after the implementation of price-based demand response.
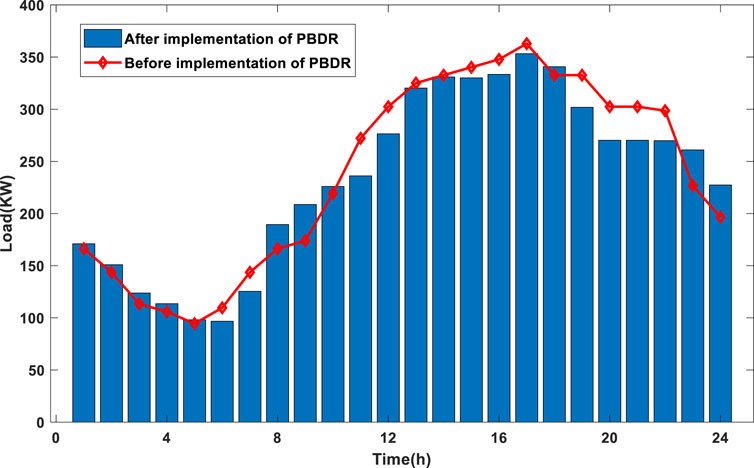
Figure 3. Load consumption before and after implementation of PBDR.
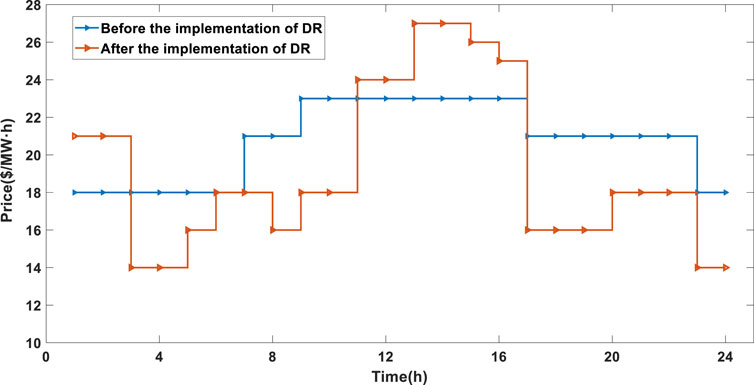
Figure 4. Electricity price changes before and after implementation of PBDR.
Figures 3, 4, it can be observed that after the implementation of PBDR, although there is no significant change in the total load of the system, the load of the system shifts over time with the change in electricity prices, achieving the effect of peak shaving and valley filling, thereby enhancing the flexibility of the system.
6.4 The impact of energy storage on system reserve capacity
Figure 5 illustrates the changes in reserve capacity before and after the addition of energy storage devices. Specifically, Figure (a) shows the reserve output of three units, while Figure (a) depicts the power provided or absorbed by the energy storage.
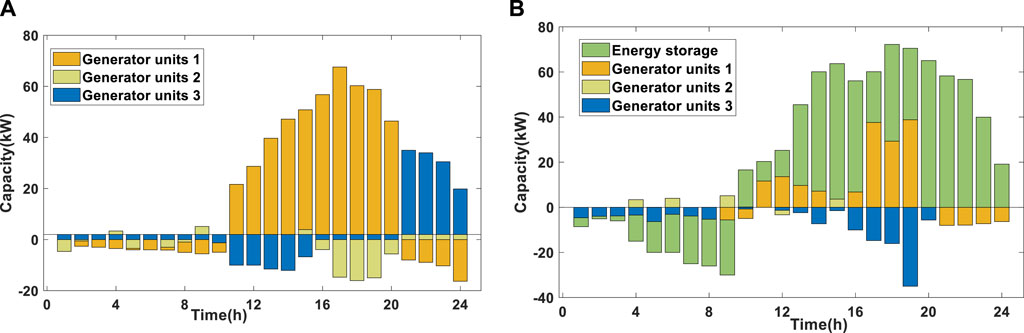
Figure 5. Change in spare capacity of the system before and after adding energy storage. (A) before access to energy storage; (B) after access to energy storage.
As can be seen from Figure 5B, after the energy storage is connected, the operating hours of the unit are reduced, and during the low load period, the energy storage is in the charging state and the excess energy is stored. At the same time, energy storage can provide the system with upward reserve capacity to cope with the risk caused by uncertain events.
7 Conclusion
In this study, we establish a power system model comprising distributed energy sources, generators, energy storage, and loads, accounting for the uncertainty of PV power generation. We propose a two-stage robust optimization method that leverages demand response resources and energy storage to optimize the system’s load curve.
Despite an increase of operation costs under the worst conditions when considering the uncertainty of PV power output, the system’s resilience to risks improves. Setting an appropriate uncertainty limit becomes crucial in balancing the robustness and economy of the system.
Furthermore, when compared to the independent operation of energy storage, optimizing the load curve through a combination of demand response and energy storage significantly reduces the cost of system’s reserve capacity allocation. Additionally, the incorporation of energy storage devices enhances the integration of renewable energy resources such as PV power.
Data availability statement
The raw data supporting the conclusion of this article will be made available by the authors, without undue reservation.
Author contributions
XY: Writing–original draft, Writing–review and editing, Conceptualization. JS: Writing–original draft, Writing–review and editing, Conceptualization. ZZ: Writing–original draft, Writing–review and editing, Data curation. GW: Data curation, Writing–original draft, Writing–review and editing. JZ: Methodology, Writing–original draft, Writing–review and editing. BD: Conceptualization, Writing–original draft, Writing–review and editing. HX: Software, Writing–original draft, Writing–review and editing, Supervision.
Funding
The author(s) declare that no financial support was received for the research, authorship, and/or publication of this article.
Conflict of interest
Authors XY, JS, ZZ, GW, and JZ were employed by State Grid Hangzhou Power Supply Company.
The remaining authors declare that the research was conducted in the absence of any commercial or financial relationships that could be construed as a potential conflict of interest.
Publisher’s note
All claims expressed in this article are solely those of the authors and do not necessarily represent those of their affiliated organizations, or those of the publisher, the editors and the reviewers. Any product that may be evaluated in this article, or claim that may be made by its manufacturer, is not guaranteed or endorsed by the publisher.
References
Alireza, S., Abbas, R., and Andrew, K. (2017). Stochastic real-time scheduling of wind-thermal generation units in an electric utility. IEEE Syst. J. 11, 1622–1631. doi:10.1109/jsyst.2014.2370372
Chen, X., Huang, L., Zhang, X., He, S., Sheng, Z., Wang, Z., et al. (2021). Robust optimal dispatching of wind fire energy storage system based on equilibrium optimization algorithm. Front. Energy Res. 9, 754908. doi:10.3389/fenrg.2021.754908
Cheng, Y., Zhang, N., and Wang, J. (2019). Comprehensive evaluation of transmission network planning for integration of high-penetration renewable energy. Automation Electr. Power Syst. 43 (03), 33–42+57. doi:10.7500/AEPS20180321012
Du, C., and Wei, Z. (2020). Two-stage optimal dispatching model of microgrid based on fuzzy incentive demand response. Electr. Power Constr. 41 (05), 37–44.
Gao, J., Yang, D., Wang, S., Wang, L., and Wang, K. (2023). State of health estimation of lithium-ion batteries based on Mixers-bidirectional temporal convolutional neural network. J. Energy Storage 73 (Part D), 109248. doi:10.1016/j.est.2023.109248
Ge, Y., Wang, C., Hao, Y., Han, G., and Lu, Y. (2022). Robust optimal dispatch of distribution system considering carbon capture and demand response. Front. Energy Res. 10, 995714. doi:10.3389/fenrg.2022.995714
Hajipour, E., Bozorg, M., and Fotuhi-Firuzabad, M. (2015). Stochastic capacity expansion planning of remote microgrids with wind farms and energy storage. IEEE Trans. Sustain. Energy 6 (2), 491–498. doi:10.1109/tste.2014.2376356
Han, J., Yuan, J., and Hu, S. (2020). Active distribution network planning considering probability correlation of multiple random factors. Smart Power 48 (09), 23–29. doi:10.13334/j.0258-8013.pcsee.2015.12.001
Ji, G., Wu, W., and Zhang, B. (2015). Robust optimization method of generator maintenance schedule considering wind power integration. Proc. CSEE 35 (12), 2919–2926. doi:10.13334/j.0258-8013.pcsee.2015.12.001
Ju, L., Zhou, Q., Pan, M., Wei, W., Wang, Y., Sun, J., et al. (2023). Robust optimal dispatching model and a benefit allocation strategy for rural novel virtual power plants incorporating biomass waste energy conversion and carbon cycle utilization. Front. Energy Res. 11, 1181310. doi:10.3389/fenrg.2023.1181310
Kang, J., Zhou, X., and Zhang, Z. (2023). Low carbon optimal dispatch of microgrid based on load side flexible resources. Electr. Drive 53 (08), 37–42. doi:10.19457/j.1001-2095.dqcd24278
Kirschen, D., Strbac, G., Cumperayot, P., and de Paiva Mendes, D. (2020). Factoring the elasticity of demand in electricity prices. IEEE Trans. Power Syst. 15 (2), 612–617. doi:10.1109/59.867149
Li, X., Wang, S., and Hui, D. (2017). A review and outlook of operation control and application methods for battery energy storage systems. Grid Technol. 41 (10), 3315–3325. doi:10.13335/j.1000-3673.pst.2017.1579
Liu, X., Ning, X., and Jin, Y. (2023). A hierarchical optimal allocation method for distributed energy storage in distribution networks. Zhejiang Electr. Power 42 (05), 95–104. doi:10.19585/j.zjdl.202305011
Tian, H., Wang, K., and Yu, B. (2021). Optimal planning for distribution network considering multi-type load and uncertainties in wind power and photovoltaic. Proc. CSU-EPSA 33 (09), 144–150. doi:10.19635/j.cnki.csu-epsa.000737
Trtst, F. (1979). IEEE committee report: IEEE reliability test system. IEEE Trans. Power Apparatus Syst. 98 (6), 2047–2054. doi:10.1109/TPAS.1979.31939854652
Wang, C., Shi, Z., and Liang, Z. (2021). Keytechnologies and prospects of demand-side resource utilization for power systems dominated by renewable energy. Automation Electr. Power Syst. 45 (16), 37–48. doi:10.7500/AEPS20210323004
Wang, D., Chen, Z., and Tu, M. (2012). Reserve capacity calculation considering large-scale wind power intergration. Automation Electr. Power Syst. 36 (21), 24–28. doi:10.3969/j.issn.1000-1026.2012.21.005
Wang, L., Wang, T., Huang, G., Wang, K., Yan, R., and Zhang, Y. (2023). Softly collaborated voltage control in PV rich distribution systems with heterogeneous devices. IEEE Trans. Power Syst. 2023, 1–12. doi:10.1109/tpwrs.2023.3347389
Wei, M., Wu, Y., and Li, Y. (2022). Day-ahead eco-nomic operation model of microgrid and its solving method based on distributed robust optimization. Proc. CSU-EPSA 34 (12), 81–90. doi:10.19635/j.cnki.csu-epsa.000954
Wen, Y., Yang, Y., and Xing, P. (2024). Review on the new energy accommodation capability evaluation methods considering muti-dimensional factors. Proc. CSEE 21 (11), 127–146. doi:10.13334/j.0258-8013.pcsee.223390
Xue, Y., Lei, X., and Xue, F. (2014). A review on impacts of wind power uncertainties on power systems. Proc. CSEE 34 (29), 5029–5040. doi:10.13334/j.0258-8013.pcsee.2014.29.004
Yu, X., Ai, T., and Wang, K. (2024). Application of nanogenerators in acoustics based on artificial intelligence and machine learning. Apl. Mater. 12 (2), 020602. doi:10.1063/5.0195399
Yu, X., Shang, Y., Zheng, L., and Wang, K. (2023). Application of nanogenerators in the field of acoustics. ACS Appl. Electron. Mater. 5 (9), 5240–5248. doi:10.1021/acsaelm.3c00996
Zhang, D., Xu, J., and Sun, Y. (2019). Day-a-head dynamic estimation and optimization of reserve in power systems with wind power. Power Syst. Technol. 43 (09), 3252–3260. doi:10.13335/j.1000-3673.pst.2018.2343
Zhang, F., Liu, J., and Gao, H. (2013). Reserve capacity model based on the uncertainty of wind power in the power system. Power Syst. Prot. Control 41 (13), 14–19.
Zhu, F., Xu, Z., and Xu, W. (2020). Wind-fire-load two-phase cooperative scheduling taking into account multiple types of demand response. Adv. Technol. Electr. Eng. Energy 39 (01), 12–21. doi:10.12067/ATEEE1811003
Keywords: photovoltaics (PV), energy storage system, demand response, robust optimization, column and constraint generation algorithm
Citation: Yang X, Shang J, Zhang Z, Wang G, Zhao J, Ding B and Xu H (2024) Robust optimization dispatch for PV rich power systems considering demand response and energy storage systems. Front. Energy Res. 12:1415874. doi: 10.3389/fenrg.2024.1415874
Received: 11 April 2024; Accepted: 10 June 2024;
Published: 09 July 2024.
Edited by:
Zijun Zhang, City University of Hong Kong, Hong Kong, SAR ChinaReviewed by:
Jueyou Li, Chongqing Normal University, ChinaBingying Zhang, SF Express Technology Company, China
Copyright © 2024 Yang, Shang, Zhang, Wang, Zhao, Ding and Xu. This is an open-access article distributed under the terms of the Creative Commons Attribution License (CC BY). The use, distribution or reproduction in other forums is permitted, provided the original author(s) and the copyright owner(s) are credited and that the original publication in this journal is cited, in accordance with accepted academic practice. No use, distribution or reproduction is permitted which does not comply with these terms.
*Correspondence: Hao Xu, ODc0NTI1NjA2QHFxLmNvbQ==