 Yajuan Cao1
 Chenchen Tao2*
- 1Department of Sociology and Culture, Jiangsu Administration Institute, Nanjing, China
- 2School of Electrical Engineering, Southeast University, Nanjing, China
A lot of infrastructure upgrade and algorithms have been developed for the information technology driven smart grids over the past twenty years, especially with increasing interest in their system design and real-world implementation. Meanwhile, the study of detecting and preventing intruders in ubiquitous smart grids environment is spurred significantly by the possibility of access points on various communication equipment. As a result, there are no comprehensive security protocols in place preventing from a malicious attacker’s accessing to smart grids components, which would enable the interaction of attackers and system operators through the power grid control system. Recently, dynamics of time-extended interactions are believed to be predicted and solved by reinforcement learning technology. As a descriptive advantage of the approach compared with other methods, it provides the opportunities of simultaneously modeling several human continuous interactions features for decision-making process, rather than specifying an individual agent’s decision dynamics and requiring others to follow specific kinematic and dynamic limitations. In this way, a machine-mediated human-human interaction’s result is determined by how control and physical systems are designed. Technically, it is possible to design dedicated human-in-the-loop societal control systems that are attack-resistant by using simulations that predict such results with preventive assessment and acceptable accuracy. It is important to have a reliable model of both the control and physical systems, as well as of human decision-making, to make reliable assumptions. This study presents such a method to develop these tools, which includes a model that simulates the attacks of a cyber-physical intruder on the system and the operator’s defense, demonstrating the overall performance benefit of such framework designs.
1 Introduction
Power systems are among the most highly complex and delicate systems of engineering around the globe. Power systems have become increasingly complex in recent years since modern equipment, including distributed generators (DGs), storage devices, and monitoring equipment, has been incorporated into them. Cyber-Physical Systems (CPS) are advanced engineered systems that include computing, communicating, and controlling functions (Zhang et al., 2022). A Cyber-Physical Power System consists of a power system combined with monitoring equipment, creating the Cyber-Physical Power System (CPPS). There are separate laws for information, communication, and power in a CPPS. Information technology boosts the economy and improves the reliability of power systems (Ponce-Jara et al., 2017). Providing accurate and trustworthy information improves the performance of electric utilities (Kirschen and Bouffard, 2008). A greater degree of precision in fault detection and isolation allows the CPPS to work more reliably (Butt et al., 2021).
Over the last years, many other works are studied on the security of CPSs (Wu et al., 2021; Liu et al., 2019), including some human-in-the-loop considerations with dynamic interaction over the societal control system. However, the comprehensive modeling of the CPS security features with power system monitoring physical information linked to human interaction decision-making process is still under study. In Wu et al. (2021), several operational objectives of the CPS are described in light of a range of security concerns. Chang et al. (2021) presents a mathematical model for analyzing and detecting different threats on a CPS. Liu et al. (2020) proposes a hierarchical structure for CPS security and develops a cross-layer method for preventing attacks. Zhang et al. (2021) focuses on robust denial-of-service control. Liu et al. (2019) examines cascading failures resulting from malicious intrusions and proposes defenses for CPS security. Rajasekaran et al. (2023) and Ghiasi et al. (2023) have both drawn significant attention to the issue of smart grid security. Rajasekaran et al. (2023) analyzes a variety of security methods to increase the viability of smart grids in the event of an attack. Similarly, Ghiasi et al. (2023) analyzes a variety of cyber-attacks against the smart grid and proposes measures to improve the system’s security. In spite of the fact that these studies all contribute to smart grid and cyber security, only a small number take into account attacker-defender interactions. Typically, attackers aim to cause harm to systems by selecting an attack method, whereas defenders aim to minimize damages. CPS attackers and defenders are interconnected, so studying interactions between them is crucial. As well, it was presumed that defenders and attackers in Liu et al. (2020) and Zhang et al. (2021) acted in an optimal and strategic manner as rational players. Stress, insufficient data, and limitations like time restrictions and complex situations can limit people’s rationality in security risks or insufficient data situations (De Neys, 2023). Decision nodes can be represented by a game-theoretic framework using two essential elements. First, utility functions or reward functions measure the related advantages of various decisions based on the individual’s aims expressed through a decision node. Secondly, solution concepts determine how humans make decisions. Human behavior can be precisely represented by a solution concept when it is chosen as a model. A mathematical model representing the human’s mental approximations is an integral component of the solution concept when the human’s decisions cannot be exhaustively explored.
The simplified model of the electric grid is retained in this study, however, a number of significant improvements are made. To begin with, the SCADA operator’s certainty is eliminated during an attack, forcing them to work efficiently regardless of whether they are under attack or not. Secondly, it is more helpful to use these predictions to design physical and control systems rather than just predicting the outcome of an attack. Thirdly, design extensions require numerical evaluations of a greater number of case studies, and computational algorithms are being developed to speed up simulations. Therefore, the designer develops solution concepts and reward functions that accurately resemble the decision making methods of cyber-physical attackers as well as SCADA operators. A SNFG contains game theoretic models within the decision nodes to illustrate how the physical state evolves and what data human and automation nodes can access. By using this model, various system designs outcomes can be predicted by designers. This allows him to enhance his own “designer’s reward function.” It is similar to mechanism design’s economic theory (Gao, 2022), in which an external policymaker designs an equilibrium game for a particular purpose. In contrast to mechanism design, this study assumes no equilibrium behavior, and it is therefore possible to employ the standard control methods mentioned earlier (Wolpert and Bono, 2013; Camerer et al., 2019). Additionally, this study contributes to research in the field of network security and game theory (Ezhei and Ladani, 2017). Assuming that the human operator detects attackers from SCADA state, the model is related to intrusion detection systems (Paul et al.; Wang et al., 2021). The human operator is also modelled in this study as a means of mitigating damage following the detection of an attack. In this way, the model makes a contribution to intrusion response research (Kiennert et al., 2018).
Following is a summary of the remainder of the study. A simplified electrical distribution circuit and the SCADA that controls it are described in Section 2. The third part discusses the reinforcement learning (RL) and game theory solution concept. The simulation outcomes are described in Section 4 and how they were used to evaluate design options. The conclusion is presented in Section 5.
2 Simplified electrical grid model
The study retains the simplified electric grid model from prior work to model adversarial interactions between defenders and attackers (Frost et al., 2022). Figure 1 shows a schematic of a radial distribution circuit consisting of three nodes.

Figure 1. The simplified power distribution network feeder line.
The suggested simplified game involves the SCADA operator (defender) maintaining voltages
It is possible for the attacker to manipulate
In which,
The defender, however, maintains
3 The basics
A basic building block of the suggested game theoretical model is presented below. RL and game theory are the building blocks. These pieces are explained below in a very limited manner, using semi-formal language for ease of comprehension, and with sufficient detail to enable comprehension of the essential information needed to comprehend the remainder of this parts.
3.1 Game theory
In game theory, strategic agents interact with each other. As they make their own decisions, strategic agents consider what other agents might do and how it might affect the game. Based on exact calculations, this theory predicts what will happen when these interactions take place.
A player is an entity that can influence a game by its moves (or actions, or decisions). Essentially, a player’s tactic is the way in which he or she determines what actions to take. It is possible to determine how a game unfolds using a solution approach, which is a well-known rule. In the same manner as a system dynamics equilibrium, a Nash equilibrium describes a situation in which different players are not motivated to depart from the action they have planned. Thus, Nash equilibrium consists of players choosing the most effective actions to counteract those of their opponents. The Prisoner’s Dilemma is a common game in which Nash equilibrium is visible. The game involves two prisoners, named A and B, who cannot speak to each other because they are placed in different rooms. Each of them receives the information: Prisoner A is freed when confessing the crime, but Prisoner B has to spend 10 years in prison for denying the crime. The same applies to Prisoner B’s release when he confesses, while Prisoner A will spend 10 years in prison for denying the crime. A 3-year sentence will be imposed on each of them if they refuse to confess. A 5-year prison sentence awaits them both for confessing. The game can be represented as a matrix in Table 1, in which players’ payoffs are inversely proportional to their prison sentences. The “Confess, Confess” option, even though it results in a poor payoff, is the sole Nash equilibrium because nobody is willing to alter their decision after reaching it. Several Nash equilibriums might exist for a given game, and Nash equilibrium differs from game to game.
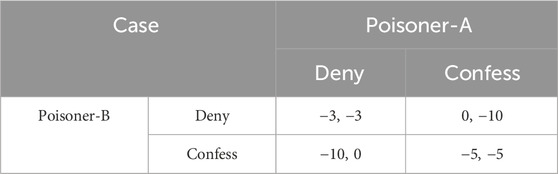
Table 1. Prisoner’s dilemma.
Quantal response equilibrium is another equilibrium concept in which rather than responding to other players in the optimal way, players are more likely to play actions with higher expected payoffs when they select a probability distribution over their action space.
Equilibrium cannot be predicted by every solution concept. Accordingly, for instance, level-k thinking identifies various levels of reasoning to the player in the context of a non-equilibrium game theory model of strategic interaction (Hough and Juvina, 2022). The model provides a minimum level of reasoning as level-0, representing non-strategic thinking, which basically implies the players with this reasoning ignore other players’ actions when setting their strategies. When faced with level-0 opponents, a level-1 player will take the most effective action. In a similar way, a level-k player will respond most effectively if he believes others have been reasoning at level-(k-1). Hence, iterated optimal responses are assumed in the model (Jin, 2021). The solution concept’s findings are corroborated with varied successes by experiments reported in Jiang et al. (2019).
A simple level-k reasoning scheme is illustrated by taking two people walking in a university corridor along a collision route, Diana and Ritchie. When Ritchie chooses to keep moving regardless of Diana’s potential actions, he is regarded as a non-strategic thinker at level-0. Diana can be modeled as a level-1 player if she accepts that Ritchie is a level-0 thinker and thus steps right. An example such as this illustrates the challenge of making level-k predictions despite research findings: players may be misinformed about other players. Moreover, level-0 algorithms affect various levels’ behavior patterns, regardless of whether players accurately predict the level of their opponents. Because of this, level-0 has been called the anchoring level. It is true that these “problems” exist, but in the context of modeling humans, they might in fact be seen as advantages. As explained earlier, in the case of CPHS involving several humans, adequate predictions require models that cannot necessarily predict the best behavior. It is also possible to view level-k thinking as representing intelligent agents’ interactions without any interaction history, because their presumptions on the strategies of the other agents cannot be completely accurate. As a result, human reactions that are not the best can be observed that provide the most effective responses to what they believe concerning the surrounding environment around them.
3.2 Reinforcement learning
In reinforcement learning (RL) models, rewards and punishments are used to represent learning. For the purpose of clarifying the explanation, and in order to better understand the RL algorithm applied to the CPHS model structure presented here, it is necessary to define the essential elements of RL and explain some terms that are common to most RL techniques. Agents in RL could alter the environments in which they operate by taking actions. In RL, the goal is to find the best set of action sequences for one agent for reaching a particular goal by interacting with the environment, as indicated by the state of that environment. It may be necessary to make a mobile robot (agent) move left, right, forward, and backward (actions), depending upon whether it is going to move left, right, forward, or backward (goal) in a 10 by 10 grid-world with obstacles. Here, the state is the grid position where the robot resides.
As the agent (or its designer) learns for achieving a specific goal, RL describes its preferences using a reward function. When the robot reaches the goal state of point B, the reward is 0, else a constant negative value. A policy consists of a probabilistic map between states and actions. When an agent is operating, the RL algorithm is responsible for finding a policy maximizing a cumulative discounted reward. The cumulative reward can be expressed in the following Eq (5):
In which,
In which,
RL aims at maximizing (optimizing) the value function by selecting the optimal policy
Based on the answer of the question “how to find the optimal value function,” RL algorithm type is determined. Sometimes, training is used to find the optimum policy. The training procedure for RL is illustrated in Figure 2. As shown, the agents observe the state and perform actions accordingly. As a result, the environment changes and new states are created. A reward signal has been generated when the reward function evaluates the new states. This signal is used by the agent for updating the policy as it is being trained, and the new action is taken in the next cycle. The paper introduces a fundamental RL algorithm, Q-learning, and later presents two other RL techniques used in the game-theoretic model structure.
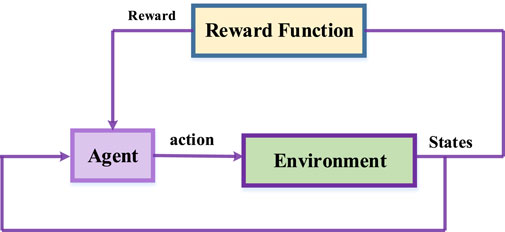
Figure 2. RL procedure.
3.2.1 Q-learning
Q-learning plays an important part in RL (Banik et al., 2021). By utilizing the update rule, Q-learning realizes incremental estimations of the optimum action-value function in the following Eq (9):
In which,
Algorithm 1.NFQ algorithm.
1) Set k equal to zero
2) Initialize the NN
3) While k < N do
4) Produce experience set
5)
6)
defines the weight expected maximum path reward for the next state
7) Compute the batch error as
8) Train the network in order to minimize the error of patch, applying resilient back-propagation and retrieved
9)
10) End while
3.2.2 Neural fitted Q-learning
Many RL approaches estimate Q values rather than maintaining a table of Q values. In large state spaces, the method can be particularly helpful. Due to their universal approximation property, neural networks (NN) offer the best tools for storing Q-values compactly. As opposed to the traditional Q-learning approach described earlier, a state-action value is not kept in a table, but rather calculated using a function derived from the NN framework: The approximate Q-value is calculated from the NN output by feeding a state-action pair as input to it. In order to train the NN, first define an error function representing the difference between the present and desired Q-values, and later minimize the function by backpropagation. In spite of the fact that the NN can be useful for determining the Q-values, failure is possible, either entirely or by involving impractical convergence times, as a result of global representation (Fisher et al., 2020): in the training procedure, NN weights update as every state-action pair is introduced, as well as affecting other pairs’ Q-values. Other training gains may be nullified as a result. In contrast, the global representation increases the generalization power of NNs because it assigns the same Q-value to similar state-action pairs, thereby removing the necessity of training NNs for all feasible pairs. It is consequently necessary to devise a strategy for exploiting and eliminating the property.
Fisher et al. (2020) proposes neural fitted Q-learning that combines the generalization power of NNs with its potential downside effects that store old experiences in the form of 3-tuples
3.2.3 Jaakkola RL
When training by RL, an agent utilizes data from the environment. The “state” of the environment is usually referred to as the data. The Markov property refers to a state containing all related data regarding how the agent and environment have interacted in the past and in the present (Szepesvári, 2022). Markov Decision Processes (MDPs) are learning tasks that involve interactions with Markov-property environments. In particular, by expressing the probability of moving from state “s” to state “
In which,
In which,
As long as condition (8) is not true, the average reward would increase until the local optimum is reached.
There are 2 hyper-parameters in the Jaakkola algorithm: the update rate and the discount factor. It is important to choose as a number between 0 and 1 at the beginning and to schedule it so that it would converge to one at the boundary in order to ensure that convergence is guaranteed. In contrast, must meet.
4 Simulation outcomes
In the following simulation and discussions, we assume a simplified power distribution network that support distributed generation installment with possible false data injection and cyber-attack changing variables that are described by a zero-sum attacker-defender game. As a result of space restrictions and interest in modeling different attacking issues, just level-1 defenders versus level-0 attackers were considered by using similar analogy and setup of Kiennert et al. (2018) in the cyber physical system of power distribution network. Frost et al. (2022) used the level-0 attacker policy. It is assumed that this level-0 attacker has knowledge regarding interacted smart grids systems and has an advanced attack method despite being level-0.
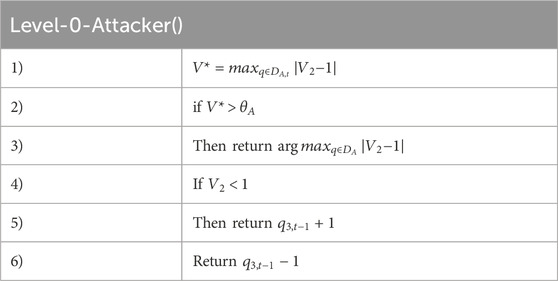
4.1 Level-0 attacker
The level-0 attacker moves 1 step time to higher
In which,
4.2 Level-1 defender—level-0 attacker dynamics
A simulation and modeling procedure are demonstrated in 2 scenarios. According to the 1st scenario, a level-1 defender would optimize his policy versus a level-0 attacker 50 percent of the time, i.e.,
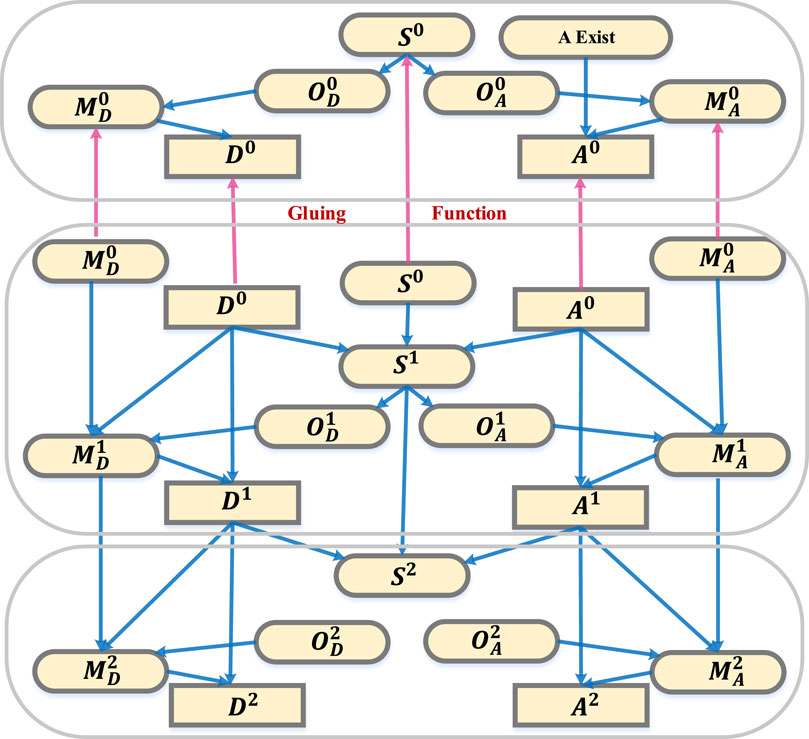
Figure 3. The repeated semi net-form game (SNFG) applied for modeling attackers and defenders/operators in a CPS.
4.3 Policy dependence on within defender training
The following section presents some initial research into the tradeoffs involved in attacker-defender game design. Despite the fact that policy optimization and policy assessment in reinforcement learning are closely connected, they are two separate methods. A constant set of parameters is used in training, including attacker presence probability p and the game parameters
There are seven possible values of
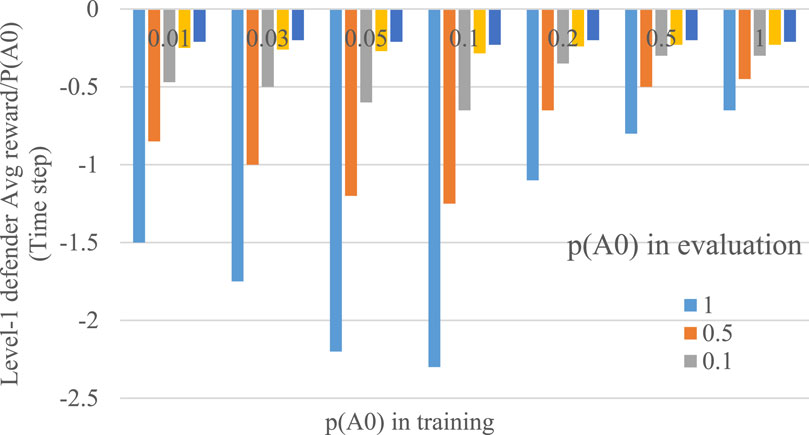
Figure 4. Level-1 defender reward at each time step of level-0 attacker presence in simulation
When a sufficient number of Monte Carlo examples is possible, and p is small in the policy optimization process (that is, training), the majority of system states
4.4 Design procedure and social welfare (SW)
When
In order to assess energy costs versus productivity loss, dollars are used as a measurement. Electricity’s SW is reasonably predicted since its value, despite being unpredictable both in time and place, is estimated with a fairly precise average value. A flat-rate customer cost approximates electric energy’s value. With highly regulated markets, energy prices are prone to distortion, and they may not accurately reflect the true power cost. Although cost provides an accurate estimate of monetary value in the model, market distortions due to cyber attacking might need to be adjusted for each case. This study involves virtually installing a generator at one single node of a distribution network and estimating its energy value in
4.4.1 Level-1 defender efficiency versus
By refreshing the attacker-defender game in Figure 3, it shows an iterated SNFG whose output node “A exist” would fix the likelihood of the attacker being present for the remainder of the N steps in the Q-learning process, making the outcomes of all episode simulations independent from one another. The average reward of the level-1 defender for being subjected to attack 100% of the time
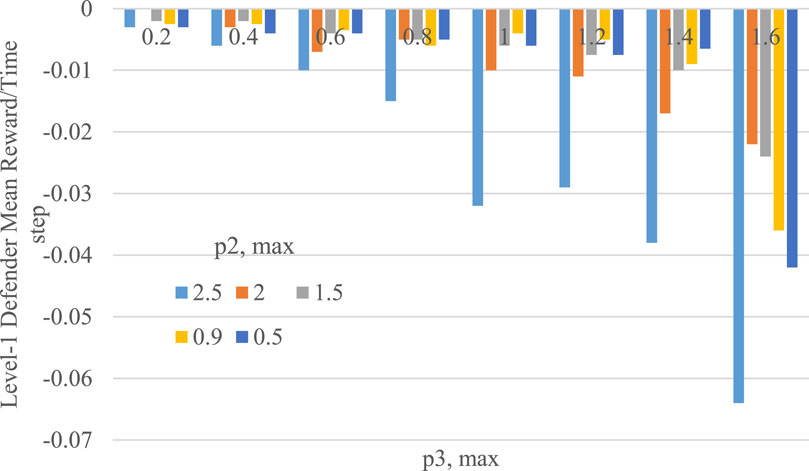
Figure 5. The level-1 defender’s mean reward entire simulation time steps as a function of
4.4.2 Level-1 defender
A SW surface plot can be generated from the power quality and energy price estimations in Figure 5. Nonetheless, the variety of variables can result in a multidimensional set of graphic plots that would make interpreting the outcomes challenging. As a result, reducing the dimensionality and generating results with a stronger sense of imagination would be the goal. In general, level-1 defenders’ rewards decrease linearly using
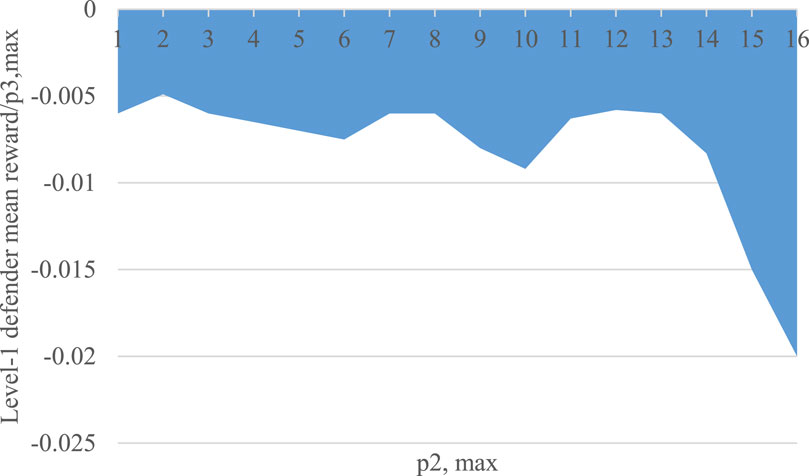
Figure 6. The slope of the datum in Figure 5 with
A more detailed analysis of Figure 6 requires relating defenders’ average rewards to power quality events, and later converting those costs into SW costs with
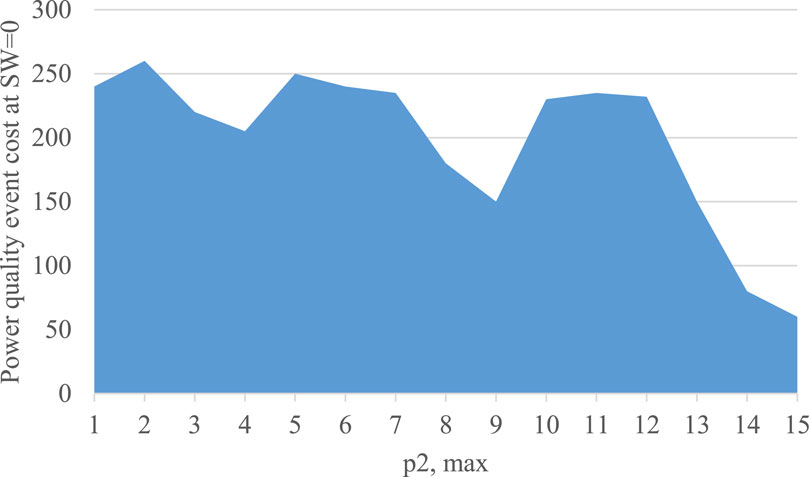
Figure 7. The price of a power quality event yielding a 0 SW contribution at one single node versus
5 Conclusion
This paper proposes a new game-theoretic framework of human-human cyber-attack interaction with reinforcement learning technology, which aims to prevent intruders from maliciously interacting with SCADA operators. Using the proposed model and method, an adversarial interaction’s result is estimated, and their social welfare gains is estimated accordingly. As a summary, there are numerous interesting features of modeled interactions that can be found in the studied framework. Firstly, there is an asymmetric interaction since the SCADA operator cannot be confident whether the attacker is available, and rather employs an easy statistical analysis of memory as a means of determining the presence of the attacker. Secondly, a considerable amount of automation mediated the interaction, and the outcomes of the suggested scheme or relevant schemes are used to design this automation in a way that maximizes the social welfare increasement caused by the reasonable protection of the smart grid environment. In the future work, it is possible to extend and improve the schemes presented here in a variety of manners. There are several benefits to expanding the scheme to include larger, more accurate grid models, including transmission grids and feeder-level distribution network, in which meshed systems have a greater complicated impact. In contrast to the setting up of this paper, complex power grid model will support several points for cyber intruders to conduct attacks, and defenders have more sophisticated reward functions and memories by using more advanced reinforcement learning solution methods.
Data availability statement
The original contributions presented in the study are included in the article/Supplementary Material, further inquiries can be directed to the corresponding author.
Author contributions
YC: Conceptualization, Data curation, Investigation, Software, Writing–original draft, Writing–review and editing. CT: Data curation, Formal Analysis, Methodology, Software, Validation, Writing–review and editing.
Funding
The authors declare that no financial support was received for the research, authorship, and/or publication of this article.
Conflict of interest
The authors declare that the research was conducted in the absence of any commercial or financial relationships that could be construed as a potential conflict of interest.
Publisher’s note
All claims expressed in this article are solely those of the authors and do not necessarily represent those of their affiliated organizations, or those of the publisher, the editors and the reviewers. Any product that may be evaluated in this article, or claim that may be made by its manufacturer, is not guaranteed or endorsed by the publisher.
References
Arulkumaran, K., Deisenroth, M. P., Brundage, M., and Bharath, A. A. (2017). Deep reinforcement learning: a brief survey. IEEE Signal Process. Mag. 34 (6), 26–38. doi:10.1109/msp.2017.2743240
Banik, S., Loeffler, T. D., Batra, R., Singh, H., Cherukara, M. J., and Sankaranarayanan, S. K. (2021). Learning with delayed rewards—a case study on inverse defect design in 2D materials. ACS Appl. Mater. Interfaces 13 (30), 36455–36464. doi:10.1021/acsami.1c07545
Butt, O. M., Zulqarnain, M., and Butt, T. M. (2021). Recent advancement in smart grid technology: future prospects in the electrical power network. Ain Shams Eng. J. 12 (1), 687–695. doi:10.1016/j.asej.2020.05.004
Camerer, C. F., Nave, G., and Smith, A. (2019). Dynamic unstructured bargaining with private information: theory, experiment, and outcome prediction via machine learning. Manag. Sci. 65 (4), 1867–1890. doi:10.1287/mnsc.2017.2965
Chang, Q., Ma, X., Chen, M., Gao, X., and Dehghani, M. (2021). A deep learning based secured energy management framework within a smart island. Sustain. Cities Soc. 70, 102938. doi:10.1016/j.scs.2021.102938
De Neys, W. (2023). Advancing theorizing about fast-and-slow thinking. Behav. Brain Sci. 46, e111. doi:10.1017/s0140525x2200142x
Ezhei, M., and Ladani, B. T. (2017). Information sharing vs. privacy: a game theoretic analysis. Expert Syst. Appl. 88, 327–337. doi:10.1016/j.eswa.2017.06.042
Fisher, A., Mago, V., and Latimer, E. (2020). Simulating the evolution of homeless populations in Canada using modified deep q-learning (mdql) and modified neural fitted q-iteration (mnfq) algorithms. IEEE Access 8, 92954–92968. doi:10.1109/access.2020.2994519
Frost, J., Watkins, O., Weiner, E., Abbeel, P., Darrell, T., Plummer, B., et al. (2022). Explaining reinforcement learning policies through counterfactual trajectories. arXiv Prepr. arXiv:2201.12462.
Gao, Y. (2022). A reflection on postwar neoclassical economics: the shift from general equilibrium theory to the new microeconomic theories. Mod. China 48 (1), 29–52. doi:10.1177/00977004211054844
Ghiasi, M., Wang, Z., Niknam, T., Dehghani, M., and Ansari, H. R. (2023) “Cyber-physical security in smart power systems from a resilience perspective: concepts and possible solutions,” in Cyber-physical security in smart power systems from a resilience perspective: concepts and possible solutions, 9. Cham: Springer International Publishing, 67–89. doi:10.1007/978-3-031-20360-2_3
Hough, A., and Juvina, I. (2022). Understanding and modeling coordination in the minimum effort game. InProceedings Annu. Meet. Cognitive Sci. Soc. 44 (44).
Jaakkola, T., Singh, S., and Jordan, M. (1994). Reinforcement learning algorithm for partially observable Markov decision problems. Adv. neural Inf. Process. Syst. 7.
Jiang, K., You, D., Merrill, R., and Li, Z. (2019). Implementation of a multi-agent environmental regulation strategy under Chinese fiscal decentralization: an evolutionary game theoretical approach. J. Clean. Prod. 214, 902–915. doi:10.1016/j.jclepro.2018.12.252
Jin, Y. (2021). Does level-k behavior imply level-k thinking? Exp. Econ. 24 (1), 330–353. doi:10.1007/s10683-020-09656-w
Kiennert, C., Ismail, Z., Debar, H., and Leneutre, J. (2018). A survey on game-theoretic approaches for intrusion detection and response optimization. ACM Comput. Surv. (CSUR) 51 (5), 1–31. doi:10.1145/3232848
Kirschen, D., and Bouffard, F. (2008). Keeping the lights on and the information flowing. IEEE Power Energy Mag. 7 (1), 50–60. doi:10.1109/mpe.2008.930656
Liu, J., Zhang, W., Ma, T., Tang, Z., Xie, Y., Gui, W., et al. (2020). Toward security monitoring of industrial cyber-physical systems via hierarchically distributed intrusion detection. Expert Syst. Appl. 158, 113578. doi:10.1016/j.eswa.2020.113578
Liu, W., Chen, Y., Wang, L., Liu, N., Xu, H., and Liu, Z. (2019). An integrated planning approach for distributed generation interconnection in cyber physical active distribution systems. IEEE Trans. Smart Grid 11 (1), 541–554. doi:10.1109/tsg.2019.2925254
Nelson, J. P., and Lankutis, J. D. (2016). Putting a price on power interruptions: how utilities and customers can share interruption costs. IEEE Ind. Appl. Mag. 22 (4), 30–40. doi:10.1109/mias.2015.2459107
Paul, S., Makkar, T., and Chandrasekaran, K. “Extended game theoretic dirichlet based collaborative intrusion detection systems. InComputational intelligence, cyber security and computational models,” in Proceedings of ICC3 2015 2016. Singapore: Springer, 335–348.
Ponce-Jara, M. A., Ruiz, E., Gil, R., Sancristóbal, E., Pérez-Molina, C., and Castro, M. (2017). Smart Grid: assessment of the past and present in developed and developing countries. Energy strategy Rev. 18, 38–52. doi:10.1016/j.esr.2017.09.011
Rajasekaran, A. S., Azees, M., and Al-Turjman, F. (2023). A comprehensive survey on security issues in vehicle-to-grid networks. J. Control Decis. 10 (2), 150–159. doi:10.1080/23307706.2021.2021113
Regula, M., Otcenasova, A., Roch, M., Bodnar, R., and Repak, M. (2016). “SCADA system with power quality monitoring in Smart Grid model,” in 2016 IEEE 16th international conference on environment and electrical engineering (EEEIC) (IEEE), 1–5.
Salkuti, S. R. (2021). Optimal location and sizing of shunt capacitors with distributed generation in distribution systems. ECTI Trans. Electr. Eng. Electron. Commun. 19 (1), 34–42. doi:10.37936/ecti-eec.2021191.222295
Wang, Z., Li, C., Jin, X., Ding, H., Cui, G., and Yu, L. (2021). Evolutionary dynamics of the interdependent security games on complex network. Appl. Math. Comput. 399, 126051. doi:10.1016/j.amc.2021.126051
Wolpert, D., and Bono, J. (2013). Distribution-valued solution concepts. Available at SSRN 1622463 April 2, 2013).
Wu, C., Yao, W., Pan, W., Sun, G., Liu, J., and Wu, L. (2021). Secure control for cyber-physical systems under malicious attacks. IEEE Trans. Control Netw. Syst. 9 (2), 775–788. doi:10.1109/tcns.2021.3094782
Zhang, C. L., Yang, G. H., and Lu, A. Y. (2021). Resilient observer-based control for cyber-physical systems under denial-of-service attacks. Inf. Sci. 545, 102–117. doi:10.1016/j.ins.2020.07.070
Keywords: cyber-physical security, SCADA system, societal control system, reinforcement learning, game theory
Citation: Cao Y and Tao C (2024) Reinforcement learning and game theory based cyber-physical security framework for the humans interacting over societal control systems. Front. Energy Res. 12:1413576. doi: 10.3389/fenrg.2024.1413576
Received: 07 April 2024; Accepted: 18 July 2024;
Published: 08 August 2024.
Edited by:
Chao Deng, Nanjing University of Posts and Telecommunications, ChinaReviewed by:
Yang Xia, Nanyang Technological University, SingaporeFatma Taher, Zayed University, United Arab Emirates
Copyright © 2024 Cao and Tao. This is an open-access article distributed under the terms of the Creative Commons Attribution License (CC BY). The use, distribution or reproduction in other forums is permitted, provided the original author(s) and the copyright owner(s) are credited and that the original publication in this journal is cited, in accordance with accepted academic practice. No use, distribution or reproduction is permitted which does not comply with these terms.
*Correspondence: Chenchen Tao, Mzk4NDA3NzQ5QHFxLmNvbQ==