 Xiaohua Zhang1Yuping Wu1
 Yu Wang2*Zhirui Lv1Bin Huang1Jingzhong Yuan3Jingyu Yang1Xinsheng Ma4Changyuan Li5Lianchao Zhang2
- 1State Grid Jibei Electric Power Company Limited, Beijing, China
- 2Beijing KeDong Electric Power Control System Co., Ltd., Beijing, China
- 3State Grid Jibei Electric Power Company Limited Economic Research Institute, Beijing, China
- 4State Grid Jibei Electric Power Research Institute, Beijing, China
- 5State Grid Qinhuangdao Power Supply Company, Qinhuangdao, China
In order to fully exploit the relationship between temporal features in photovoltaic power generation data and improve the prediction accuracy of photovoltaic power generation, a photovoltaic power generation forecasting method is proposed based on a hybrid model of the convolutional neural network (CNN) and extreme gradient boost (XGBoost). Taking the historical data of China’s photovoltaic power plants as a sample, the high-dimensional mapping relationship of photovoltaic power generation variables is extracted based on the convolutional layer and pooling layer of the CNN network to construct a high-dimensional time-series feature vector, which is an input for the XGBoost. A photovoltaic power generation prediction model is established based on CNN-XGBoost by training CNN and XGBoost parameters. Since it is difficult for a single model to achieve optimal prediction accuracy under different weather conditions, the k-means clustering algorithm is used to group the power datasets and train independent models to improve prediction accuracy. Through the actual data verification of photovoltaic power plants, the proposed photovoltaic power generation prediction model can accurately predict the power, which shows high prediction accuracy and generalization ability compared with other methods.
1 Introduction
Under the guidance of China’s national policy of “striving to reach the peak of carbon dioxide emissions by 2030 and striving to achieve carbon neutrality by 2060,” controlling of industrial carbon emissions is imminent, and developing new energy is an effective way. It is an important guarantee for realization of the “dual carbon” goal to increase the proportion of new electric energy in the terminal consumption in the power system, improve energy utilization efficiency, and greatly reduce energy consumption and CO2 emissions. Photovoltaic power generation is an important part of new energy power generation and bears irreplaceable power generation tasks (Zhao et al., 2019; Lv et al., 2019; Sun et al., 2022). However, photovoltaic power generation is affected by many factors, such as weather, light intensity, and ambient temperature, resulting in considerable volatility, instability, and randomness of its output power (Antonio and Ana, 2023; Wang et al., 2023). Blind grid connection will seriously threaten the safe and stable operation of power grids. Therefore, it is of great strategic significance to improve the prediction accuracy of photovoltaic power generation (Hamdi et al., 2020; Yang et al., 2022).
Photovoltaic power prediction mainly relies on data quality and algorithm modeling performance. With the rapid development of artificial intelligence, Big Data, computer storage, and other technologies, many researchers have established photovoltaic power generation prediction models based on traditional machine learning and deep learning (Almonacid et al., 2014; Wang et al., 2019; Honghai et al., 2021; Hui et al., 2022). A photovoltaic power generation prediction model is established by analyzing the characteristics of light intensity, panel temperature, and field temperature (Peng et al., 2019). The gray correlation method is used to select the day with high similarity to the forecast day’s meteorological characteristics; a short-term photovoltaic power generation output prediction method is proposed based on particle swarm optimization and deep belief network (Zhengming et al., 2020). By analyzing and mining data such as light intensity and temperature in the process of photovoltaic power generation, a slip algorithm for predicting DC side power output combined with lifting wavelet transform and BP neural network is proposed (Ding et al., 2017). Through analysis and mining of historical power generation data and meteorological information, a photovoltaic power generation prediction model is established based on support vector machines (SVMs) (Yu et al., 2016). The data on solar radiation intensity, temperature, and historical sequence information of photovoltaic output are extracted, and a photovoltaic power prediction model is established based on the adaptive neuro-fuzzy inference system (ANFIS). The prediction accuracy of the model was found to be relatively high through testing (Shi et al., 2019). In summary, the forecasting of photovoltaic power generation power is closely related to weather factors and historical sequence working conditions, and the existing literature fails to fully mine the variables. Therefore, this paper will study the algorithm with strong feature extraction ability and strong modeling ability for photovoltaic power generation to improve its prediction accuracy.
The convolutional neural network (CNN) is considered to be a relatively successful algorithm in the field of deep learning because of its excellent variable feature extraction ability, and it is widely used in image recognition, speech recognition, text recognition, power systems, and other fields (Yao et al., 2020; Zhang et al., 2020; Miao et al., 2023). The extreme gradient boosting (XGBoost) is a machine learning algorithm based on gradient boosting trees, which is widely used in classification, regression, prediction, and other fields due to its unique modeling performance (Chen and Tong, 2015; Liu et al., 2020). Similarly, it has been gradually applied in the field of power systems. A power system transient stability prediction model is established based on the XGBoost algorithm, which greatly improves the prediction accuracy (Chen M. et al., 2020; Singh and Shelly, 2022). The short-term power load forecasting model is established based on the combined model of long and short-term memory network (LSTM) and XGBoost, which has higher forecasting accuracy than other models (Chen Z. et al., 2020; Xue et al., 2022).
It is considered that the CNN has significant advantages in data feature extraction and dimensionality reduction, and XGBoost has a strong ability to predict sequence feature data. A photovoltaic power generation prediction method is proposed based on the CNN–XGBoost hybrid model, which fully considers the prior information of photovoltaic power generation data to build a model training sample set based on historical photovoltaic power plant data and meteorological data. The CNN is used to map the data variables to the high-dimensional space, and the feature relationships of the variables are extracted to construct the training sample feature vector, which is input into the XGBoost for parameter training, and the photovoltaic power generation hybrid prediction model is established.
2 Convolutional neural network
The CNN is widely used in the field of deep learning (Zhou et al., 2017). It has achieved remarkable application effects in the fields of image recognition, speech recognition, text classification, and so on. The CNN consists of an input layer, a convolutional layer, a pooling layer, a fully connected layer, and an output layer. The convolutional layer is usually used for feature extraction of the input data of the input layer, an abstraction of the implicit correlations in the original data by means of a convolutional kernel matrix. The role of the pooling layer is to filter the features in the sensory domain and extract the most representative features in the region, which can effectively reduce the output feature scale, and thus reduce the number of parameters required by the model. The fully connected layer is responsible for summarizing the features extracted from the CNN learning and mapping the multidimensional feature input to a two-dimensional feature output. In general, the convolution and pooling layers are used for feature engineering. The fully connected layer is used for feature weighting, which is equivalent to the “classifier” of the CNN. The CNN has the characteristics of “local link” and “weight sharing,” which simplifies the complexity of network links and improves the model’s ability to extract abstract features. To a certain extent, it alleviates the problems of slow training of the fully connected network and easy to fall into overfitting. The structure of the CNN is shown in Figure 1.
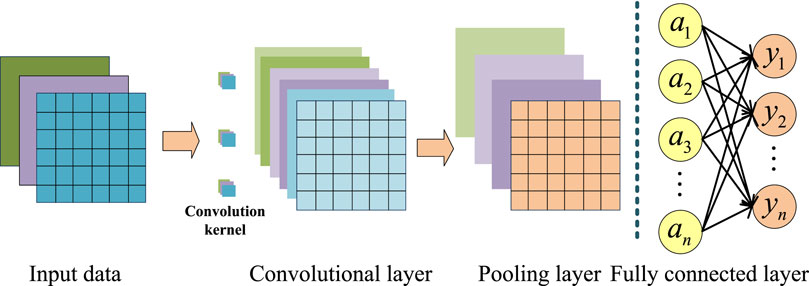
Figure 1. CNN structure.
The convolutional layer of the CNN is equivalent to “filtering” the input data, and the modeling features in the input data set are proposed through convolution network calculations. The relationship between the input data feature vectors is mined in a high-dimensional space. The pooling layer in the CNN is equivalent to a down-sampling operation. It reduces the spatial dimensions of the input data, thus reducing the number of parameters and computation in the network, while also helping make the learned features more invariant to small translations and distortions in the input.
The calculation formula of the convolutional layer is as follows:
Eq. 1 describes the convolution operation in the CNN, which generates a corresponding feature map by multiplying the convolution kernel with the input data element by element and summing the result of the product. Each element of the feature map represents a feature value at the corresponding position, where
Convolutional and pooling layers have some structural similarity, in that they both extract features in the sensory domain and obtain outputs of different dimensions according to the step size settings, but their intrinsic operations are fundamentally different. The convolutional layer is used to extract features, and the pooling layer is used to reduce the dimensionality of the data. The convolutional layer extracts features through filters, while the pooling layer reduces the size of the feature map through a maximum or average operation.
3 XGBoost
XGBoost is an extreme boosting tree that integrates multiple weak classifiers to form a strong classifier (Chen and Carlos, 2016). The basic principle is to add different trees to the model in turn to generate different forms of tree models by splitting features. Each addition of a tree is equivalent to learning a new function to fit the residual of the previous prediction. Therefore, the prediction accuracy is improved, and it is suitable for dealing with power load forecasting problems. XGBoost uses a basic regression tree model, and the expression is as follows:
where K represents the number of trees; fk represents a function of function space R;
The model is not affected in each iteration; that is, the original model remains unchanged and a new function is added to the model. A function corresponds to a tree, and the newly generated tree fits the residual of the last prediction. Assume that the predicted value at step t is
The objective function expression of XGBoost is as follows:
where
where
The regularization penalty function is used to prevent the model from overfitting during the training process. The expression is as follows:
where T represents the number of leaf nodes;
The final objective function is obtained as
where I is defined as the set of samples on each leaf,
From Eq. 7, the smaller the target value, the better the structure of the whole tree.
4 Photovoltaic power generation prediction based on CNN-XGBoost
4.1 CNN-XGBoost hybrid model structure
In order to better integrate the advantages of the CNN and XGBoost, the basic structure of the CNN-XGBoost hybrid model is proposed, as shown in the Figure 2. The CNN is used to extract the characteristics of the input variables of the photovoltaic power generation model and construct the temporal feature vector of the high-dimensional mapping space. The CNN-XGBoost hybrid model contains three convolutional layers, which are used to extract key local and global features from the data, such as short-term trends, periodic fluctuations, and anomalous patterns. The first convolutional layer captures local features, the second further extracts complex patterns, and the third extracts more abstract and advanced features. Finally, the results are fed into XGBoost training.
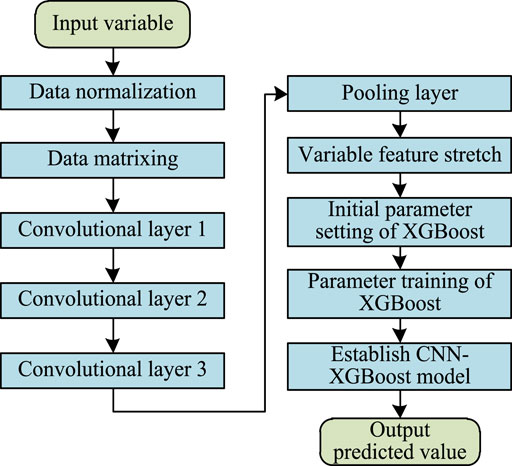
Figure 2. Hybrid model structure.
The nine-dimensional variables under each photovoltaic power generation condition are constructed as a 2 × 2 matrix vector and input to the CNN network. In the CNN, the number of convolutional layers and pooling layers is 3 and 1, respectively. In view of the low dimensionality of the input matrix, 3-layer convolution is calculated by the same method. The 3-layer convolution kernel is set to 2 × 2×1 × 4, 2 × 2×4 × 8, and 2 × 2×8 × 16, and the pooling core is set to 2 × 2. The moving steps of the convolutional layer and the pooling layer are both set to 1, and the activation function is the ReLU function. The pooling layer reduces dimensionality by taking the maximum value. According to the above convolution and pooling principles, the 16-channel 2 × 2 feature matrix is calculated through the CNN network, and a one-dimensional vector of 64 is generated by stretching. This vector is the input variable of the XGBoost.
The XGBoost in the proposed CNN-XGBoost hybrid model is used to predict photovoltaic power generation. In the XGBoost algorithm, the parameters that can be optimized include the depth of the tree, the number of iterations, and the learning rate. In the process of using the XGBoost algorithm to train the photovoltaic power generation prediction model, the depth of the tree is set to 5, and the learning rate range is set to 0.01–0.9; the iteration number range is set to 100–1000.
4.2 Prediction model clustering of photovoltaic power generation
Considering that different weather and irradiance lead to differences in sample characteristics in the training sample set of photovoltaic power; in order to improve the prediction effect of photovoltaic power, the k-means clustering method is used to cluster the training samples of photovoltaic power. The clustering algorithm in the k-value on the clustering effect has a greater impact; this paper combined the field staff experience and data analysis effect to determine the k-value. The meteorological factors are the main basis for determining the k-value, and by using the sample distance sum of squares as a measure of the clustering effect of the photovoltaic power clustering index, the sample distance sum of squares is calculated, as shown in Eq. 8:
where n is the total number of sample points; Ci is the training sample set; q is the center of mass of the training sample set; oi is the samples in the training set.
The k in the clustering algorithm is set to 5, and the corresponding photovoltaic power prediction model is trained using each of the clustered samples, and the photovoltaic power is predicted based on each of the clustered training models. In the prediction process, the test samples are input into the five established prediction models, and the prediction value with the smallest error among the five models is taken as the corresponding photovoltaic power generation prediction value of the test sample. The prediction effect is evaluated by the root mean square error.
5 Example analysis
5.1 Research objects
The 130 MW photovoltaic power station data and weather forecast data in a region of China are selected as the data set, and the historical operating data unit of 2018 is collected as the test sample. In addition, 1,500 sets of data of 30 days at 15-min intervals are collected as training samples, and 100 sets of data are collected at the same time interval as test samples. Using the feature selection algorithm, nine meteorological features that most affect photovoltaic power generation are selected as the input variables of the model, namely, total solar irradiance, direct irradiance, scattered irradiance, ambient temperature, photovoltaic panel temperature, ambient humidity, and season. Among them, four seasons are represented by numbers 1, 2, 3, and 4. The photovoltaic power generation is determined as an output variable. The fluctuation range of various related variables of photovoltaic power generation data is shown in Table 1.
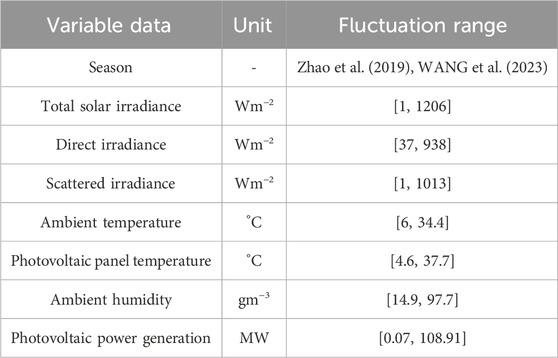
Table 1. Fluctuation range of each variable data.
5.2 Model evaluation index
This paper selects the mean absolute percentage error and root mean square error as the evaluation indicators of each model. The evaluation error expression is as follows:
where yt represents actual photovoltaic power generation;
5.3 Photovoltaic power generation modeling effect
In order to cluster the set of training samples for photovoltaic power generation, we use the k-means method to classify the training samples into five categories. k-means is a commonly used unsupervised learning algorithm for dividing a data set into k distinct clusters, where k is a predefined parameter, which is set to 5 in the experiment. The method is computed iteratively to assign data points to their nearest categories until convergence conditions are reached.
The photovoltaic power generation prediction model is trained based on the above five kinds of training samples, which predicts the data for 2 days. The daily photovoltaic power generation power is 50 sets of data, a total of 100 sets of data. The characteristics of the selected 2-day test data are different. The change of photovoltaic power generation on the first day is relatively mild, which is a typical process of sunlight from weak to strong to weak. The data on the second day generally are conformed to the characteristics of light from weak to strong to weak, but the intensity of light in it is affected by other factors and fluctuated drastically, which led to fluctuations in photovoltaic power generation. The 50 sets of test samples are divided as input into the five trained models on the first day, and the predicted value of the model with the smallest root mean square error is chosen as the predicted value of photovoltaic power generation. The forecasting effect of photovoltaic power generation on the first day is shown in Figure 3. It can be seen from Figure 3 that the prediction curve of the joint model is very consistent with the true value of photovoltaic power generation, and the trend is consistent. For the 50 sets of test samples on the first day, the mean absolute percentage error is 6.29% and the root mean square error is 3.12 MW, which has high prediction accuracy and strong generalization ability.
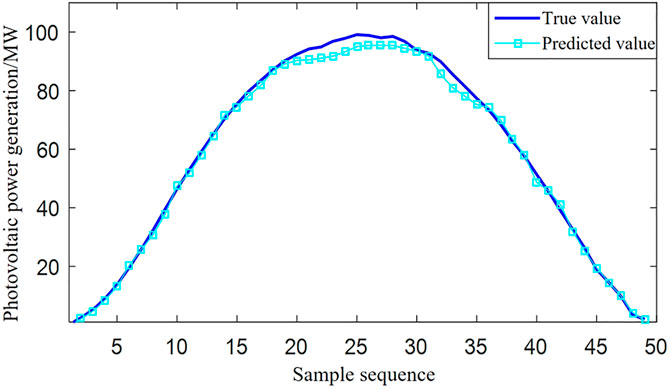
Figure 3. Forecast effect of photovoltaic power generation on the first day.
The 50 sets of test samples are divided as input into the five trained models on the second day, and the predicted value of the model with the smallest root mean square error is chosen as the predicted value of photovoltaic power generation. The forecast effect of photovoltaic power generation on the second day is shown in Figure 4. As shown in Figure 4, for the 50 sets of test samples on the second day, the mean absolute percentage error is 7.11% and the root mean square error is 4.66 MW, which also has high prediction accuracy, indicating that the proposed joint model still has high prediction accuracy under the condition of large load fluctuations and is suitable for engineering applications.
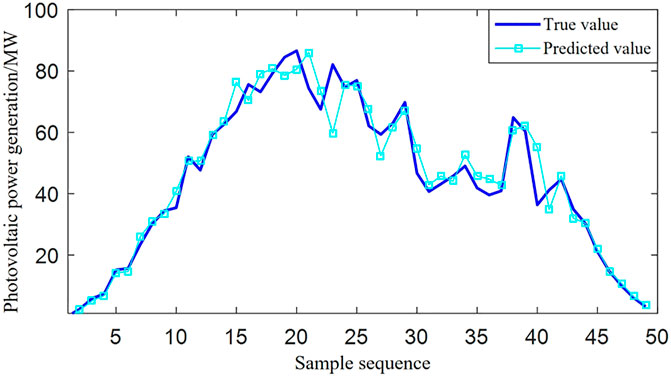
Figure 4. Forecast effect of photovoltaic power generation on the second day.
Based on the above analysis, the proposed CNN-XGBoost photovoltaic power generation prediction model predicts the photovoltaic power when the load changes smoothly and when the load changes drastically. The prediction results on the first day are almost the same as the real values, which are significantly better than those on the second day. Analyzing the reasons, it is concluded that the light intensity data on the second day fluctuate greatly, which directly leads to rapid changes in photovoltaic power generation. The proposed model has a certain predictive ability for such rapid changes in power generation, but the effect is slightly worse than the relative load changes.
To further verify the clustering effect of the photovoltaic power generation prediction model, the 2-day test sample set is input into five different types of training models, and the root mean square error of each prediction model is calculated to be 4.85 MW, 5.38 MW, 6.76 MW, 6.32 MW, and 5.29 MW, and the root mean square error of the photovoltaic power generation prediction clustering model is 4.27 MW. The comparison effect between the five models and the photovoltaic power generation prediction clustering model is shown in Figure 5.
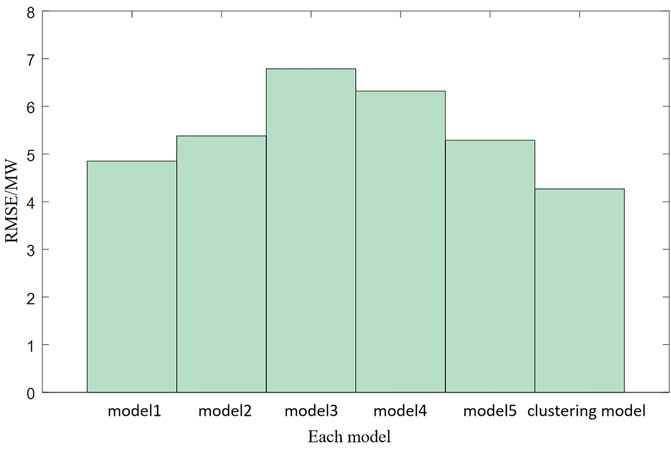
Figure 5. Comparison of the prediction effect of each model.
It can be clearly seen from Figure 5 that the prediction accuracy of the photovoltaic power generation prediction clustering model is significantly higher than that of other models, which indicates that the clustering model has integrated the best predicted points of the 100 predicted conditions. At the same time, it also shows that the photovoltaic power generation prediction clustering method is effective and can greatly improve the prediction accuracy and generalization ability of the photovoltaic power generation prediction model.
5.4 Model comparison
We further illustrate the prediction effect of the established CNN-XGBoost model, which is compared with that of other models trained by algorithms such as least square support vector machine (LSSVM), XGBoost, and partial least squares-XGBoost (PLS-XGBoost). Partial least squares is a linear regression method that has been widely used in various fields. In recent years, some studies have used it for variable feature selection, and the effect is remarkable (Zhang and Zhang, 2017; Yang et al., 2020). In this paper, PLS is used to extract the characteristics of photovoltaic power-related variables, and the effect is compared with that of the CNN network. The model modeling variables are extracted based on the PLS method including total solar irradiance, direct irradiance, scattered irradiance, and photovoltaic panel temperature. The results are shown in the following Table 2.
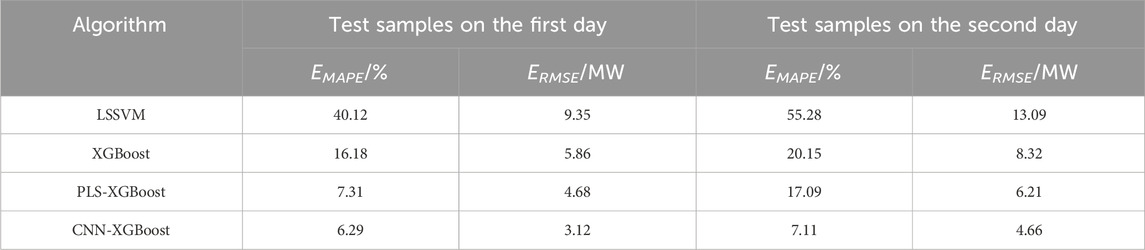
Table 2. Comparison of different models.
As can be seen from the data in Table 2, the prediction error of the CNN-XGBoost model on the test sample is significantly lower than that of other models. The prediction effect of the CNN-XGBoost hybrid model is better than that of LSSVM and XGBoost, which shows that the CNN can effectively extract the feature vector of the high-dimensional space of photovoltaic power-related variables. The prediction effect of the CNN-XGBoost hybrid model is better than that of the PLS-XGBoost, which shows that the variable feature extraction effect of the CNN is superior to the PLS method.
By calculating the absolute error of the 2-day test sample predicted by the above model, the distribution of the prediction error of each model is obtained. The absolute error distribution of the model prediction is shown in Figure 6.
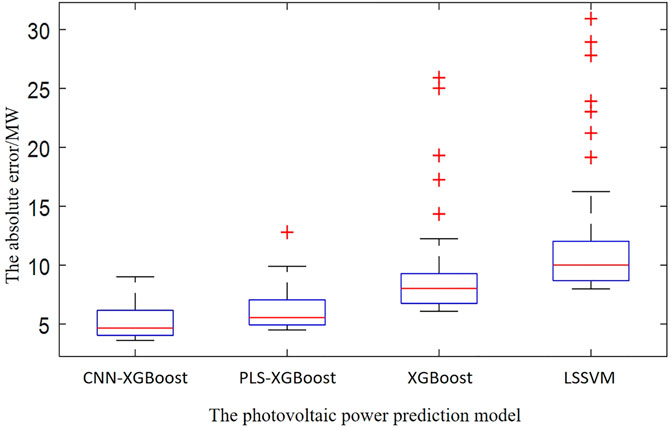
Figure 6. Comparison of model prediction effects.
From the description of the error box plot of the above model, it is obvious that the relative error value of the informer algorithm prediction result is closer to the zero error bar than other algorithms.
The prediction effect of each model on the 2-day test data is further compared, and the root mean square error of each model on the 2-day test sample is calculated. The four photovoltaic power generation power prediction models established based on LSSVM, XGBoost, PLS-XGBoost, and CNN-XGBoost have root mean square errors of 11.67 MW, 7.31 MW, 5.83 MW, and 4.27 MW, respectively. The comparison effect is shown in Figure 7.
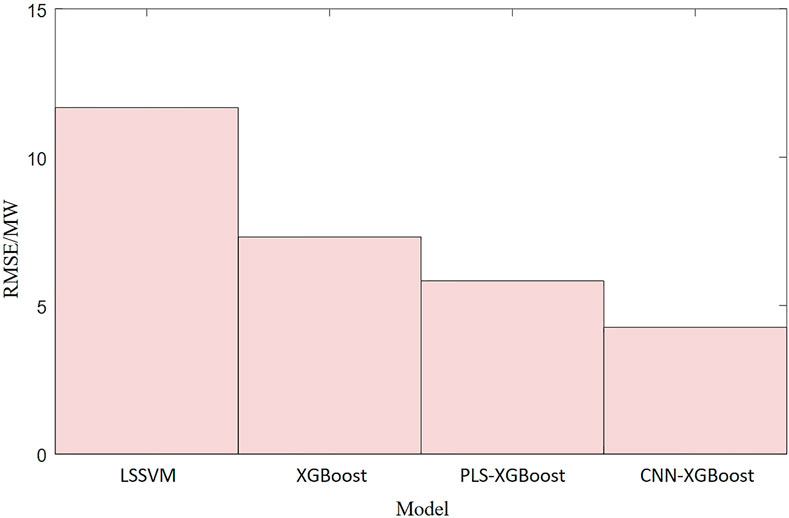
Figure 7. Error comparison of each model on the 2-day test sample.
6 Conclusion
In order to improve the accuracy of photovoltaic power generation prediction, a photovoltaic power generation prediction method based on the CNN-XGBoost hybrid model is proposed. The CNN is used to extract the feature vectors of the input variables related to photovoltaic power generation in the high-dimensional space, and the constructed time-series feature vectors are used as the input variables of the XGBoost to establish a photovoltaic power generation prediction model based on CNN-XGBoost. Through the verification of photovoltaic power generation data in a certain area, the established hybrid prediction model can integrate the advantages of CNN and XGBoost and more completely extract the feature relationship of modeling variables in high-dimensional space. Considering the images of photovoltaic power under different meteorological conditions, the k-means clustering method is used to cluster the photovoltaic power data and train the respective power prediction models. The experimental results show that clustering of photovoltaic power can substantially improve the accuracy of power prediction. Compared with LSSVM, XGBoost, PLS-XGBoost, and other algorithms, it has higher prediction accuracy and generalization ability.
Data availability statement
The data analyzed in this study is subject to the following licenses/restrictions: confidential data, not open to the public. Requests to access these datasets should be directed to: MTg4MDAxMDk3NTZAMTYzLmNvbQ==.
Author contributions
XZ: conceptualization, data curation, writing–original draft, and writing–review and editing. YWu: software, supervision, writing–original draft, and writing–review and editing. YWa: investigation, methodology, and writing–original draft. ZL: project administration, resources, and writing–review and editing. BH: methodology, supervision, and writing–review and editing. JYu: methodology, supervision, and writing–original draft. JYa: investigation, software, and writing–original draft. XM: methodology, project administration, and writing–review and editing. CL: conceptualization, supervision, and writing–review and editing. LZ: investigation, methodology, and writing–review and editing.
Funding
The author(s) declare that no financial support was received for the research, authorship, and/or publication of this article.
Conflict of interest
Authors XZ, YWu, ZL, BH, and JY were employed by State Grid Jibei Electric Power Company Limited. Author JY was employed by State Grid Jibei Electric Power Company Limited Economic Research Institute. Author ZL was employed by State Grid Qinhuangdao Power Supply Company. Authors YWa and LZ were employed by Beijing KeDong Electric Power Control System Co., Ltd.
Publisher’s note
All claims expressed in this article are solely those of the authors and do not necessarily represent those of their affiliated organizations, or those of the publisher, the editors, and the reviewers. Any product that may be evaluated in this article, or claim that may be made by its manufacturer, is not guaranteed or endorsed by the publisher.
References
Almonacid, F., Pérez -Higueras, P. J., Fernández, E. F., and Hontoria, L., A methodology based on dynamic artificial neural network for short-term forecasting of the power output of a PV generator . Energy Convers. Manag., 2014, 85: 389–398. doi:10.1016/j.enconman.2014.05.090
Antonio, COUTO, and Ana, ESTANQUEIRO. Wind power plants hybridised with solar power: a generation forecast perspective. J. Clean. Prod., 2023(Oct.15):423.
Chen, M., Liu, Q., Zhang, J., Chen, S., and Zhang, C. (2020). Transient stability prediction method of power system based on XGBoost. Power Grid Technol. 44 (03), 1026–1033.
Chen, T., and Carlos, GUESTRIN (2016). “XGBoost: a scalable tree boosting system,” in Proceedings of the 22nd ACM SIGKDD International Conference on Knowledge Discovery and Data Mining, San Francisco California USA, August, 2016.
Chen, T., and Tong, H. E. (2015). Higgs boson discovery with boosted trees. JMLR Workshop Conf. Proc. (42), 69–80.
Chen, Z., Liu, J., Li, C., Ji, X., Li, D., Huang, Y., et al. Ultra-Short term power load forecasting based on LSTM and XGBoost combined model . Power Grid Technol., 2020, 44(02): 614–620.
Ding, K., Ding, H., Wang, Y., Gao, L., and Liu, Z. Based on lifting wavelet-BP neural network of photovoltaic array short-term power prediction. J. Renew. Energy, 2017, 35(4): 566–571.
Hamdi, HICHEM, Ben Regaya, CHIHEB, and Zaafouri, ABDERRAHMEN. A sliding-neural network control of induction-motor-pump supplied by photovoltaic generator. Prot. Control Mod. Power Syst., 2020, 5(1): 1–17. doi:10.1186/s41601-019-0145-1
Honghai, KUANG, Qian, G. U. O., Shengqing, L. I., and Zhong, H. (2021). “Short-term power load forecasting method in rural areas based on CNN-LSTM,” in 2021 IEEE 4th International Electrical and Energy Conference (CIEEC), Wuhan, China, May, 2021.
Hui, L. I., Zhouyang, R. E. N., Miao, F. A. N., Li, W., Xu, Y., Jiang, Y., et al. A review of scenario analysis methods in planning and operation of modern power systems: methodologies, applications, and challenges. Electr. Power Syst. Res. 2022, 205:107722. doi:10.1016/j.epsr.2021.107722
Liu, B., Qin, C., and Ju, P. (2020). Short-term Bus Load Forecasting based on the fusion of XGBoost and Stacking models. Electr. Power Autom. Equip. 40 (03): 147–153.
Lv, X., Liu, T., Dong, X., Qi, Y., and Lu, Y. (2019). Forecast and prospect of photovoltaic and wind power industry in 2019. Journal of Beijing Institute of Technology (Social Sciences Edition) 21 (02), 25–29.
Miao, K., Hua, Q., and Huifeng, S. H. I. (2023). Short-term load forecasting based on CNN-BiLSTM with Bayesian optimization and attention mechanism. Concurrency Comput. Pract. Exp. 35. doi:10.1002/cpe.6676
Peng, S., Zheng, G., Huang, S., Li, B., and Hu, Z. (2019). Multi-feature short-term photovoltaic power generation prediction based on XGBoost algorithm. Electr. Meas. Instrum. 57 (24), 76–83.
Shi, M., Wang, Q., and Wang, T., Short-term distributed photovoltaic forecasting based on ANFIS-PSO and feature selection. Renew. Energy Resour., 2019, 37(7): 989–994.
Singh, U., and Shelly, VADHERA (2022). “Random forest and xgboost technique for short-term load forecasting,” in 2022 1st International Conference on Sustainable Technology for Power and Energy Systems (STPES), SRINAGAR, India, July, 2022, 1–6.
Sun, X., Hailong, Y. E., Yan, L. I., Huangfu, F., and Zhao, C., Optimal operation of distribution network with photovoltaic. J. Phys. Conf. Ser., 2022, 2186(1):012001. doi:10.1088/1742-6596/2186/1/012001
Wang, J., Wang, W., and Chen, H., Photovoltaic power generation forecasting based on regression-Markov chain. Electr. Meas. Instrum., 2019, 56(1): 76–81.
Wang, Z., Yuyin, L. I., Wang, A., Wu, Y., Han, T., and Ge, Y. (2023). “Photovoltaic power generation prediction based on in-depth learning for smart grid,” in 2023 32nd Wireless and Optical Communications Conference (WOCC), Newark, NJ, USA, 1–6.
Xue, J., Hu, X., Chen, H., and Zhou, G. (2022). “Research on LSTM-XGBoost integrated model of photovoltaic power forecasting system,” in 14th International Conference on Intelligent Human-Machine Systems and Cybernetics (IHMSC), 22–25.
Yang, G., Wang, Y., Xie, R., and Liu, K. (2020), Prediction of boiler flue gas NOx emission by deep confidence neural network based on variable selection. Therm. Power Gener., 49(04): 34–40.
Yang, S., Pan, F., He, H., and Zhang, T. (2022), Prediction of photovoltaic power by the informer model based on convolutional neural network. Sustainability, 14.13022. doi:10.3390/su142013022
Yao, C., Yang, P., and Liu, Z. (2020). Load forecasting method based on CNN-gru hybrid neural network. Power Syst. Technol. 44(09), 3416–3423.
Yu, Q., Xu, C., Li, S., Liu, H., Song, Y., and Liu, X. (2016). Short-term photovoltaic power prediction based on fuzzy clustering and support vector machine. J. Elec. Power Syst. and Automation 28 (12), 115–118+129.
Zhao, L., Liu, Y., Yu, L., and Liu, J. (2019). Belief network based on the depth of photovoltaic power station short-term output prediction. Power Syst. Prot. control 47 (18), 11–19.
Zhang, L., and Xu, L. I. U. (2020), Short-term load forecasting based on CNN-gru neural network. Electr. Power Sci. Eng., 36(11): 53–57.
Zhang, W., and Zhang, Y., (2017), Study on NOx emission of utility boilers based on partial least squares and ε-fuzzy tree method. J. Chin. Soc. Power Eng., 37(3): 186–191.
Zhengming, L. I., Caixia, LIANG, and Wang, M., (2020), Short-term power generation output prediction based on a PSO-DBN neural network. Power Syst. Prot. Control, 48(8): 149–154.
Keywords: prediction of photovoltaic power generation, convolutional neural network, variable feature extraction, extreme gradient boost, model clustering, hybrid model
Citation: Zhang X, Wu Y, Wang Y, Lv Z, Huang B, Yuan J, Yang J, Ma X, Li C and Zhang L (2024) Prediction of photovoltaic power generation based on a hybrid model. Front. Energy Res. 12:1411461. doi: 10.3389/fenrg.2024.1411461
Received: 03 April 2024; Accepted: 21 May 2024;
Published: 17 June 2024.
Edited by:
Zening Li, Taiyuan University of Technology, ChinaReviewed by:
Hui Li, University of Macau, ChinaZhang Wenguang, North China Electric Power University, China
Gerald Granderson, Miami University, United States
Copyright © 2024 Zhang, Wu, Wang, Lv, Huang, Yuan, Yang, Ma, Li and Zhang. This is an open-access article distributed under the terms of the Creative Commons Attribution License (CC BY). The use, distribution or reproduction in other forums is permitted, provided the original author(s) and the copyright owner(s) are credited and that the original publication in this journal is cited, in accordance with accepted academic practice. No use, distribution or reproduction is permitted which does not comply with these terms.
*Correspondence: Yu Wang, MTg4MDAxMDk3NTZAMTYzLmNvbQ==