 Anjiang Liu1
 Junyu Xie
94% of researchers rate our articles as excellent or good
Learn more about the work of our research integrity team to safeguard the quality of each article we publish.
Find out more
ORIGINAL RESEARCH article
Front. Energy Res. , 15 May 2024
Sec. Smart Grids
Volume 12 - 2024 | https://doi.org/10.3389/fenrg.2024.1410694
Large-scale distributed renewable energy connected to the rural distribution network has given birth to a new rural distribution system with a high proportion of new energy typical characteristics, and the optimal scheduling of the new rural distribution system has become an important issue to ensure the safe and stable operation of the power grid. This paper proposes a method of active-reactive power collaborative optimization scheduling for rural power distribution system with a high proportion of renewable energy. Firstly, the active support capability evaluation model is established, and the active power support capability and reactive power support capability of rural power distribution system are quantitatively evaluated, which provides data basis and boundary conditions for the scheduling part. Then, considering power-loss cost, distribution network operation cost, and penalty cost, a method of active-reactive power collaborative optimization scheduling for rural power distribution systems with a high proportion of renewable energy is proposed. Finally, the active support capability evaluation and regulation platform of the rural power distribution system is built to provide technical support services for the safe and stable operation of the rural power distribution system. Given the problems of overload and overvoltage faced by rural power distribution systems with a high proportion of renewable energy, this paper aims to solve the key technical challenges of optimization and regulation of new rural power distribution systems. The results show that the optimized control method proposed in this paper has better security and economy, and is conducive to promoting the construction and operation of the new rural power distribution system.
In 2021, the State Council issued the “2030 Carbon Peak Action Plan” and China’s power industry ushered in deepening reform (Ru et al., 2021). Traditional fossil energy is gradually replaced by clean and efficient renewable energy (Zhou et al., 2021). Rural renewable resources have great potential, which is convenient for local materials and local utilization. It is an important base for the development of new energy power generation such as rooftop photovoltaic, distributed wind power and biogas power generation (Wu et al., 2011). The “14th Five-Year Plan for Renewable Energy” proposes the action of thousands of households and thousands of villages to control the wind, coordinate the construction of distributed photovoltaics in rural areas, vigorously promote the construction of rural wind power, and promote the construction of a new rural energy system (Fu and Zhou, 2023).
In this context, rural decentralized wind power and distributed rooftop photovoltaics have developed rapidly in recent years, and the scale has shown exponential growth (Wang et al., 2023a). The access of large-scale distributed renewable energy to the rural distribution network has spawned a new type of rural power grid with high proportion of new energy and typical characteristics of bidirectional power flow (Han et al., 2022). On the one hand, it provides more clean energy for the power system, and on the other hand, it also brings great pressure to the safe and stable operation of the power system. Due to the relatively weak rural power grid (Chawda and Shaik, 2022), a large number of distributed energy access to the rural distribution network after the overload, overvoltage, harmonic overrun, power supply quality decline and other issues (Akinyemi et al., 2022; Xu et al., 2024). Therefore, it is a great challenge to build a low-carbon, efficient, safe and stable rural energy system and form a rural power system with new energy as the main body.
Nowadays, in addition to a variety of distributed resources, more power electronic devices are also involved in power flow optimization control. The power flow controller can effectively deal with the above problems. It is connected to the distribution network in series and parallel, which can compensate the active and reactive power of the line and provide active and reactive power support for the power system. The unified power flow controller (UPFC) is the most powerful and optimal line power flow control device at present (Osama abed el-Raouf et al., 2023). It has the ability of voltage regulation and series compensation. It can not only carry out power flow regulation but also carry out harmonic control, which can effectively improve the stability of power system operation and improve the consumption rate of renewable energy (Wu et al., 2022). For example, in Reference (Albatsh et al., 2017), a shunt and series controller based on a PI and FLC UPFC prototype was used to successfully control the power flow in the transmission line, and other power system parameters were also significantly improved.
Since voltage quality is one of the important indexes to evaluate the level of power system (Kharrazi et al., 2020), how to adjust voltage quickly and effectively is an important research hotspot. Aiming at the problem of voltage instability caused by high proportion of renewable energy access to distribution network, the current control methods are divided into reactive power compensation and active power reduction. In Reference (Hou et al., 2024), a dynamic reactive power/voltage control strategy of active distribution network considering voltage stability is proposed. By reasonably controlling the action time of reactive power regulating equipment, the optimal distribution of reactive power flow in active distribution network within 1 day is realized, and the safety and stability of system operation are improved. References (Zhang et al., 2024a) considered the influence of electric vehicle access on the power grid, and proposed to use the on-load voltage regulator and electric vehicle in the distribution network for coordinated voltage regulation. In (Almeida et al., 2021; Xiao et al., 2021), the reactive power and voltage control strategy of distribution network considering the reliability of photovoltaic power supply is proposed by using the reactive power support ability of photovoltaic power supply. In reference (Li et al., 2019), the local voltage control based on real-time measurement can quickly respond to the frequent fluctuations of distributed generation (DG). A local voltage control strategy of DG with reactive power optimization based on Kriging surrogate model is proposed. However, due to the high impedance ratio of the distribution network, there is a problem of strong coupling between active power and reactive power. Simple active or reactive power optimization scheduling is difficult to meet the safe operation and economic requirements of the distribution network, and the uncertainty of distributed power output will cause serious voltage fluctuations. Therefore, it is necessary to coordinate and optimize the active power and reactive power resources in the distribution network (Liu et al., 2022a; Jiang. et al., 2023a).
The current research on active-reactive power coordinated scheduling mainly focuses on improving the efficiency and stability of power systems, especially with the high integration of renewable energy sources. This field involves a variety of technologies and methods, including optimization algorithms, prediction models, and real-time scheduling strategies. Internationally, research on active-reactive power coordinated scheduling often emphasizes integrating advanced prediction technologies and optimization algorithms to manage the uncertainty and variability of renewable energy sources (Huang et al., 2022). In terms of prediction, machine learning models such as neural networks and support vector machines are used to predict energy output (Gao et al., 2017; Zhou et al., 2019; Babbar et al., 2021; Zhuang et al., 2023), or Transformer model and Informer model for ultra-short-term prediction of wind and light (Jiang et al., 2023b; Zhang et al., 2024b; Zhuang et al., 2024). In the aspect of optimal scheduling, intelligent algorithms such as genetic algorithm and particle swarm optimization are used to optimize the scheduling. Convex programming methods such as semi-definite programming (SDP) and second-order cone programming (SOCP) can also be used to solve the problem of active-reactive power collaborative optimization (Gao et al., 2018). In China, research on active-reactive power coordinated scheduling is also actively progressing, especially against the backdrop of the national grid’s intelligent upgrade. Domestic research often focuses more on the stability and security of the grid, with research teams developing customized models and algorithms that cater to the characteristics of the Chinese grid. For example, researchers explore scheduling models based on real-time monitoring and prediction, as well as optimization scheduling strategies considering the characteristics of grid loads. In general, it is of great practical significance to study the coordinated optimization of active and reactive power after the high proportion of renewable energy is connected to the grid, in order to reduce the abandonment of wind and light to improve the energy consumption capacity and improve the node voltage quality after the renewable energy is connected to the grid.
Considering the above research basis and challenges, this paper focuses on a new rural power distribution system with a high proportion of renewable energy. A method of active power and reactive power cooperative optimization control for rural power distribution system with high proportion of renewable energy is proposed in order to provide technical support services for the safe and stable operation of rural power distribution system and promote the safe, economic and stable operation of the distribution system. The specific innovations of this paper are as follows:
1. An active support capacity evaluation model is established, and multiple indices are proposed for both active power support capacity and reactive power support capacity, in order to systematically assess the overall active support capacity of rural power distribution systems with a high proportion of renewable energy. This provides the data basis and boundary conditions for the scheduling part.
2. Comprehensively considering the operation characteristics of multiple distributed resources and power flow controllers, a method of active-reactive power collaborative optimization scheduling for rural power distribution system with high proportion of renewable energy is proposed to minimize power-loss cost, distribution network operation cost, and penalty cost.
3. The active support capability evaluation and regulation platform of the rural power distribution system is built. By accessing the real-time operation data of distributed resources, the active support capability evaluation of distributed resources and the scheduling control function of the new rural power distribution system is realized, and technical support services are provided for the safe and stable operation of the rural power distribution system.
Active support capability evaluation is very important for the safe and stable operation of rural power distribution system, which can show the adjustment ability of distributed photovoltaic power generation equipment when the system voltage and power flow fluctuate. The evaluation part is divided into active power support capability evaluation and reactive power support capability evaluation. The active power/reactive power adjustable capability of photovoltaic is quantitatively evaluated, which is used as the data support and boundary conditions of the subsequent scheduling part.
The power load and photovoltaic output in rural distribution networks have obvious time series characteristics. The Informer model is introduced into the time series prediction problem to capture time series characteristics with its strong time series prediction ability. The Informer model is im-proved on the Transformer model by introducing the multi-head ProbSparse self-attention mechanism and the self-attention distillation mechanism, effectively reducing computational complexity. On this basis, by using a generative decoder, all prediction results can be generated at once, further improving computational efficiency. The Informer model consists of two parts: Encoder and Decoder, as depicted in Figure 1. The input time series information is encoded as a hidden state representation in the Encoder and decoded in the Decoder section to output predicted values. The specific principle is as follows:
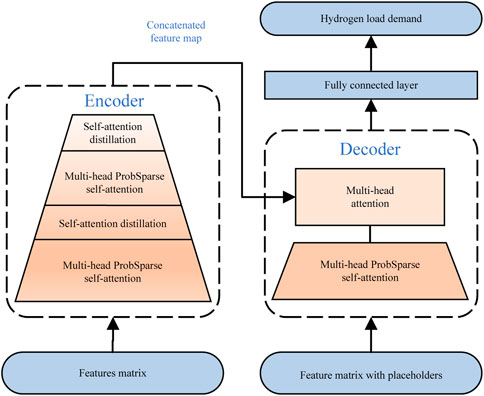
Figure 1. The structure of the informer model.
The Encoder consists of the multi-head ProbSparse self-attention mechanism and the self-attention distillation mechanism, which extracts data features from time series. By using the multi-head ProbSparse self-attention mechanism, the computational complexity is effectively reduced. The calculation formula can be expressed as Eq. 1,
Where Softmax is an activation function;
Then, the self-attention distillation mechanism is used to reduce network complexity and highlight features, greatly enhancing the processing ability for time series. The operating formula for distillation from the l layer to the l+1 layer is shown in the equation as Eq. 2,
Where
The Decoder consists of the multi-head ProbSparse self-attention mechanism, multi-head attention mechanism, and a fully connected layer, which can obtain all time series prediction results at once.
This article uses the maximum mutual information coefficient method to filter relevant meteorological data and historical sequence data as inputs to the Informer model, and then predict the active power
The active power support capacity of rural distribution systems is usually composed of electricity consumption level and power generation level. Therefore, this article proposes evaluation indicators for distributed resources and power load in rural distribution systems to measure the active power support capacity within the distribution area.
Based on the Informer model, interval and point predictions were made for the photovoltaic output and power load of rural distribution systems, obtaining data on upper and lower limits and prediction results for 96 continuous time nodes, respectively. Then, two indicators, maximum/minimum range and maximum fluctuation range are proposed as evaluation criteria for the active power support capability. Among them, the maximum/minimum range rep-resents the maximum/minimum difference between the upper and lower limits of the interval prediction results, which represents the maximum/minimum amplitude of data fluctuation within the specified time. The maximum fluctuation range is the value of the first-order derivative of the point prediction result, used to represent the stability of the data within the specified time.
All in all, this section presents an evaluation method of active power support capability, which includes prediction and evaluation. The part of prediction forecasts the active and reactive power of photovoltaics and load nodes based on the Informer model, and these data will be used in the scheduling part as input data, while the results of the active power support capability evaluation part will be used as the boundary conditions of active power related constraints.
Compared to regulating active power, reactive power regulation has a smaller impact on the user’s profits and lower regulation costs. Therefore, reactive power regulation is generally chosen as the voltage regulation method. This article takes the voltage support degree and reactive power regulation capacity as evaluation indicators to measure the reactive power support ability of nodes where distributed resources are located.
The voltage support degree represents the degree to which the voltage of the regional power grid is affected by changes in the reactive power of distributed resources. The approximate linear relationship between node power injection and voltage amplitude change can be represented by the definitions of active voltage sensitivity and reactive voltage sensitivity as Eqs 3, 4:
Where
The power flow sensitivity analysis method is used to linearize the current operating point of the power grid, and then approximate the voltage changes at each node during the voltage regulation process through active voltage sensitivity and reactive voltage sensitivity as shown in Eq. 5,
Where N and M represent the total number of nodes and the number of connected photovoltaics in the rural distribution network, respectively.
The reactive power regulation capability of photovoltaics is affected by the capacity of grid-connected inverters. When the active power of photovoltaics does not change, grid-connected inverters need to meet capacity constraints as Eq. 6,
Where
Due to the influence of node load, photovoltaic output, and photovoltaic grid-connected inverter capacity in the distribution network, the reactive power regulation ability of different node photovoltaics will undergo significant changes. Eqs 7, 8 can accurately represent the reactive power adjustable capacity of the photovoltaic without affecting the comparison of the reactive power adjustable capacity between nodes. The difference in the adjustable capacity only depends on the initial reactive power output of the photovoltaic. Therefore, the upper limit of reactive power adjustment of the photovoltaic can be selected as the indicator of reactive power adjustment capacity.
Consequently, a reactive power support capability evaluation method is proposed in this section, which quantifies the reactive power support capability of distributed resources to the rural power distribution system. By the way, the results of the voltage support degree part will be used as a reference for the reactive power adjustment of the scheduling part, and the results of the reactive power regulation capacity part will be used as the boundary conditions of reactive power related constraints.
This section utilizes the load and photovoltaic time series data predicted based on the Informer model in Section 2, as well as the evaluation results of active support capability, to carry out the active-reactive power collaborative optimization scheduling of rural distribution systems at the daily level.
With the development of rural distribution systems and the improvement of demand response awareness, demand-side resources are becoming increasingly diversified. The active-reactive power collaborative optimization scheduling of rural distribution systems can be expressed as a multi-objective optimization scheduling model that comprehensively considers power loss, operating costs, and system demand response in the distribution network. Specifically, the optimization objectives of rural power distribution systems take into account the minimization of power-loss cost
Where
Where
Where
This article uses the polar coordinate form of the Newton-Raphson method to represent the power flow equation in rural distribution systems, as shown in Eq. 15, while also satisfying the balance of active and reactive power of the line shown in Eq. 16 and the voltage amplitude constraint shown in Eq. 17.
Where
Distributed photovoltaics can regulate active and reactive power output, and their regulation capacity is affected by grid-connected inverters. Based on the reactive power support evaluation results in Section 2.2, the relevant constraints of distributed photovoltaics are as Eqs 18–22,
Where
The power flow controller is a flexible AC transmission device with superior characteristics, which can simultaneously and efficiently control the active and reactive power in the distribution network lines, and also reduce line power loss. Its constraints are as Eqs 23–25,
Where
Energy storage devices can balance the power flow of rural distribution systems through charging/discharging, and improve the reliability and stability of system operation. The constraints are as Eqs 26–30,
Where
The load of electric vehicles can participate in the demand side response of the distribution system under reasonable regulation strategies. Through its charging/discharging characteristics after connecting to the power grid, it can achieve bidirectional interaction with the power grid, achieve peak shaving and valley filling, and obtain certain economic compensation costs. The constraints are as Eqs 31–34.
Where
The power flow equation in the polar coordinate form shown in Eq. 15 and the power-loss cost
The power-loss cost
When solving mixed-integer second-order cone programming problems, the original problem has been transformed into a polyhedral approximation of the second-order cone. When solving, Eq. 38 is relaxed and transformed into a cone constraint as shown in Eqs 44–47. At this time, the original nonconvex feasible domain is relaxed into a convex second-order cone feasible domain, which can be solved quickly and efficiently using commercial solvers such as Gurobi.
As depicted in Figure 2, when considering all feasible solutions within the non-convex feasible domain are in the second-order cone plane, relaxation expands this feasible domain into convex cones. Consequently, the optimal solution to the original problem lies in the solution within the convex second-order cone and the original feasible domain.
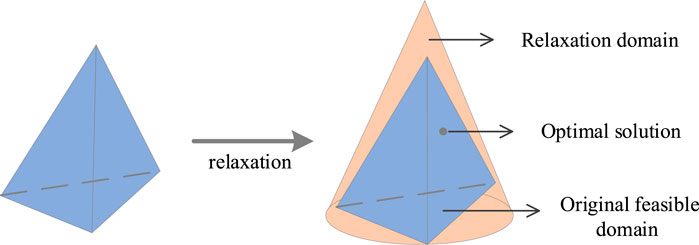
Figure 2. Second-order cone relaxation principle.
The active support capability evaluation and regulation platform for rural power distribution system is based on database management software and software support platform, which realizes the monitoring and regulation of the operation status of rural power distribution system, as depicted in Figure 3. By accessing real-time operation data of distributed resources such as photovoltaic, energy storage, and electric vehicle loads, it realizes the active support capability evaluation of distributed resources and the scheduling and control function of the new power distribution system, providing technical support services for the safe and stable operation of rural power distribution system.
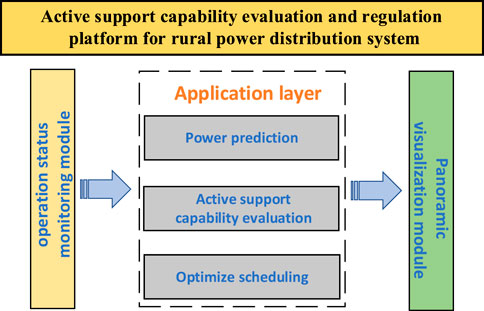
Figure 3. Architecture of the platform.
The operation status monitoring module mainly includes data collection and analysis processing, event and alarm processing, microgrid data access and control, and terminal data monitoring functions, providing data support and abnormal alarm services for the application layer. The processed data is transmitted to the application layer for simulation analysis and calculation.
The panoramic visualization module mainly involves real-time data display, including a list of display devices for the application layer’s three modules, and displays the corresponding measurement/calculation data types of the devices. According to the selection, the calculated predicted/scheduled photovoltaic data information, node load information, calculation evaluation indicators, and other data curves will be displayed in real-time.
The application layer consists of three modules: distributed resource power prediction, active support capability evaluation, and optimization scheduling control. Among them, the distributed resource power prediction module receives historical time series data information on distributed photovoltaic, adjustable load, and net load from the operation status monitoring module, effectively predicting future distributed photovoltaic output and user load demand.
The optimization scheduling control module involves the coordinated optimization and control of active-reactive power in rural distribution systems. It targets multiple types of distributed resources composed of distributed photovoltaics, energy storage, controllable loads, etc. (Wang et al., 2023b), and uses the output data of the distributed resource power prediction module as input to execute the active-reactive power collaborative optimization scheduling algorithm. It reasonably cooperates to optimize the active and reactive power of rural distribution systems, reduce the impact of renewable energy fluctuations and uncertainties on the operation of rural distribution networks under high penetration rates, improve power quality, and ensure the reliable and stable operation of the power grid.
The active support capability evaluation module is divided into the active power support capability evaluation model and the reactive power support capability evaluation model. The active power support capability evaluation model based on predicted data information, calculates the evaluation index formula according to the active power support capacity evaluation model proposed in Section 2.1 and then evaluates the active power support capacity of distributed resources within the region for the overall rural power distribution system. According to the reactive power support capability evaluation model proposed in Section 2.2, the reactive power support capability evaluation model is based on the capacity of grid-connected converters of distributed resources, the predicted active power of distributed resources and user load, evaluates the upper and lower limits of voltage adjustment capacity for each distributed resource under active-reactive power collaborative optimization scheduling algorithm, and then, based on the active voltage sensitivity and reactive voltage sensitivity matrices of the system, calculate and evaluate the voltage support degree of each distributed resource node for each node in the rural distribution system, and complete the evaluation of the overall reactive power support capacity of the distributed resources in the region for the rural distribution system.
The proposed active-reactive power collaborative optimization scheduling algorithm was tested in a rural distribution system located in Guizhou Province, China, which contains a high proportion of renewable resources. The equivalent 11-node power grid topology is shown in Figure 4. In Figure 4, node 6 and node 11 are equipped with 2.6 MW and 2.05 MW photovoltaic power stations, node 8 is equipped with 400 kW energy storage, nodes 1,3 and 5 are equipped with electric vehicle loads with a maximum capacity of 10% of the local load, and the power flow controller installed between nodes 9 and 11 has a capacity of 100 kW. The prediction part of the active support capability assessment model receives the historical series data from the rural power distribution system, including the output data of the photovoltaic power station, the node power load data, and the meteorological data required for prediction, with a period of March 2023 to September 2023 and a time granularity of 15 min.
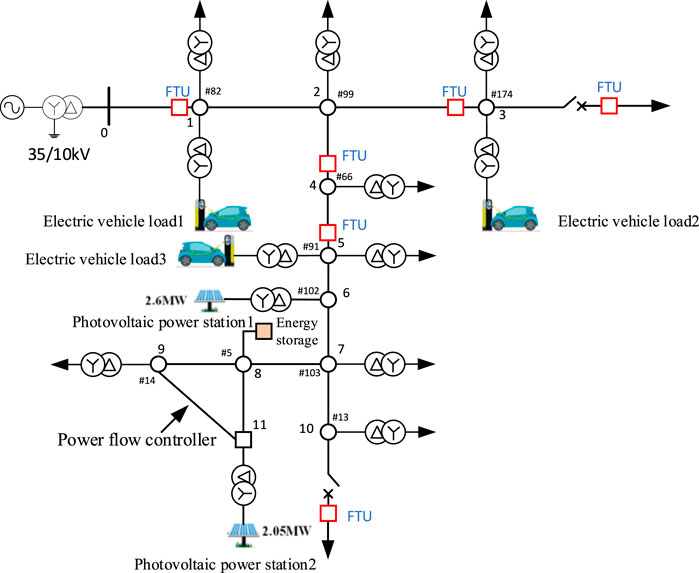
Figure 4. Topology of the 11-node distribution network.
Figure 5; Tables 1, 2 show the prediction results of the Informer model proposed in Section 2 for distributed photovoltaic and node power load in the region in the next 24 h and then quantitatively evaluate the active power support capacity of the rural power distribution system based on the prediction results. The predicted results in Figure 5 are obviously in line with the trend of photovoltaic output and power load change over time. The difference between the predicted point value and the actual value is small, and both are within the range of the interval prediction, achieving the expected effect. In the evaluation and calculation part, with maximum/minimum range and maximum fluctuation range as key indicators, 18 sets of data are calculated in Table 1 to measure the volatility and stability of power data. At the same time, root mean square error (RMSE) and absolute error (MAE) are introduced as evaluation indexes for the accuracy of point prediction results. Prediction interval coverage (PIPC) and normalized average width of prediction interval (PINAW) are selected as evaluation indexes for the accuracy of interval prediction results. The comparison results are shown in Table 2. Compared with Transformer (Tian et al., 2022), LSTM (Zhang et al., 2024c), and GRU (Liu et al., 2022b), the distributed photovoltaic and power load forecasting model based on informer has better prediction effects in all aspects and can better improve the prediction accuracy of time series.
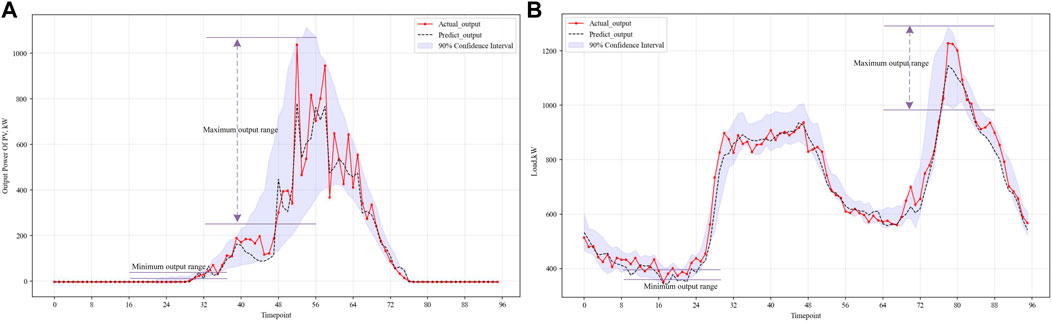
Figure 5. Prediction result presentation.
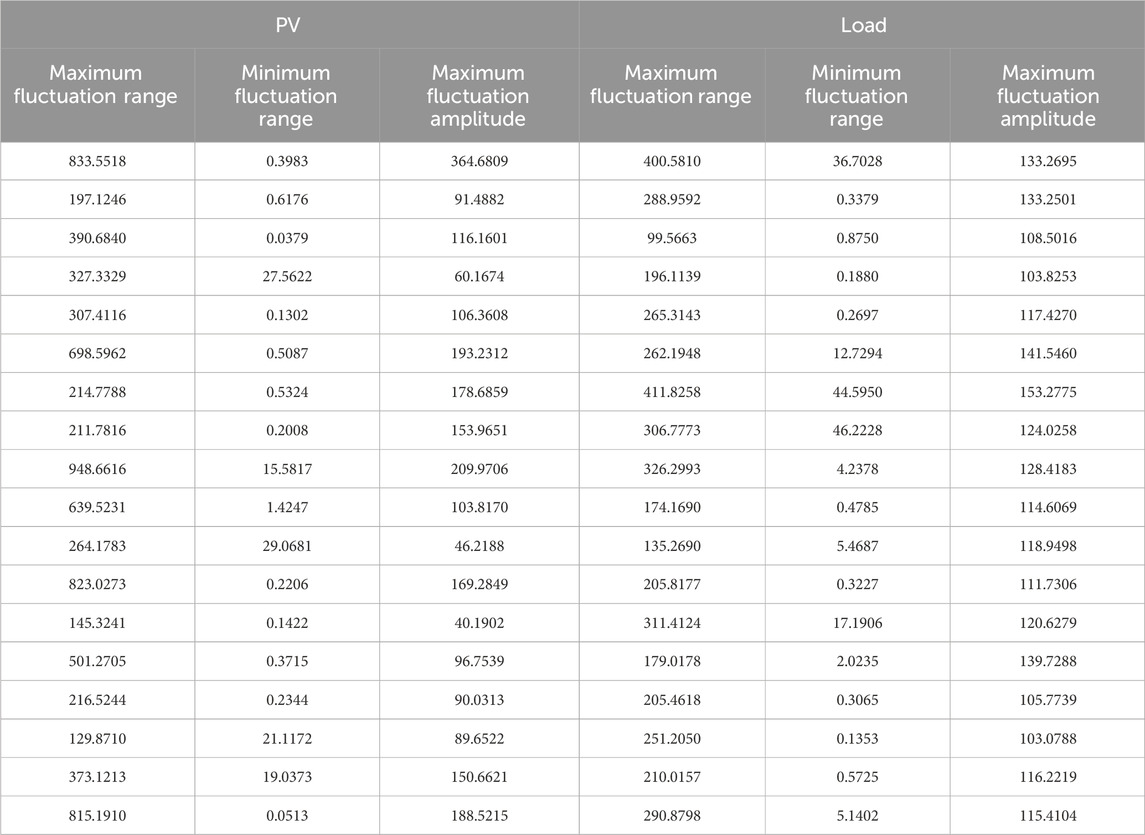
Table 1. Predicted fluctuation indicators.
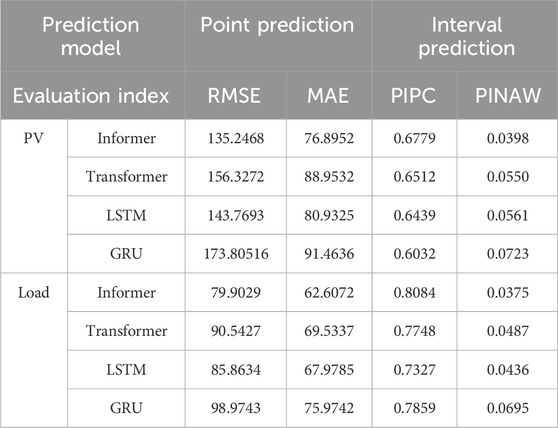
Table 2. Comparison of prediction accuracy.
Figure 6 shows the reactive voltage support of two photovoltaic power stations located at node 6 and node 11 for the overall rural power distribution system when the photovoltaic power output is large at noon. It can be seen that when the reactive power output of the photovoltaic power station increases (Wang et al., 2023c), the voltage of other nodes will be affected and will rise accordingly, and the node closer to the photovoltaic power station is more sensitive to the change of photovoltaic reactive power output, and the voltage rise is also higher.
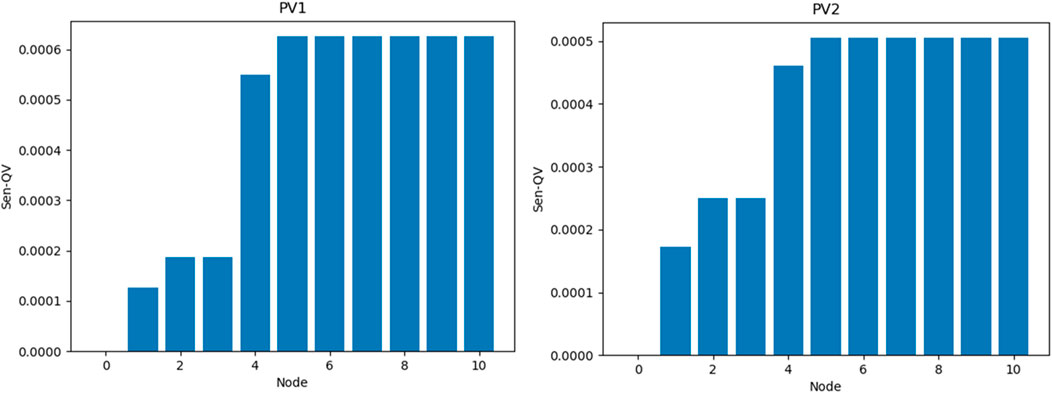
Figure 6. Sensitivity of reactive voltage.
The changes in the adjustable reactive power capacity of the two photovoltaic power stations at 12–14 are shown in Figure 7. It can be seen from the figure that the adjustable reactive power capacity of the photovoltaic power station will decrease with the increase of the active power output (Cao et al., 2024). When it is at night, the active power output of the photovoltaic power station is almost 0, and the adjustable reactive power capacity is close to the installed capacity of the photovoltaic power station.

Figure 7. Reactive capacity of photovoltaics.
Based on the forecast results of distributed photovoltaic output and node power load for a total of 96 points in the next 24 h based on the Informer model, the day-ahead optimal scheduling was carried out by comprehensively considering the photovoltaic, energy storage, power flow controller and electric vehicle loads in the distribution system. The output curve of distributed photovoltaic, the operation curve of energy storage, and the load control curve of electric vehicles are shown in Figure 8. It can be seen that photovoltaics have no active power output at night and before sunrise, and only reactive power participates in system scheduling. In addition, when photovoltaic is generated, energy storage absorbs redundant active power, SOC increases significantly, and stops charging when rated capacity is reached. The electric vehicle load also absorbs excess active power by increasing the load. As the sun goes down, the photovoltaic active power output is reduced. When the system has an energy gap, the energy storage and the electric vehicle load discharge to supplement the missing active power of the system.
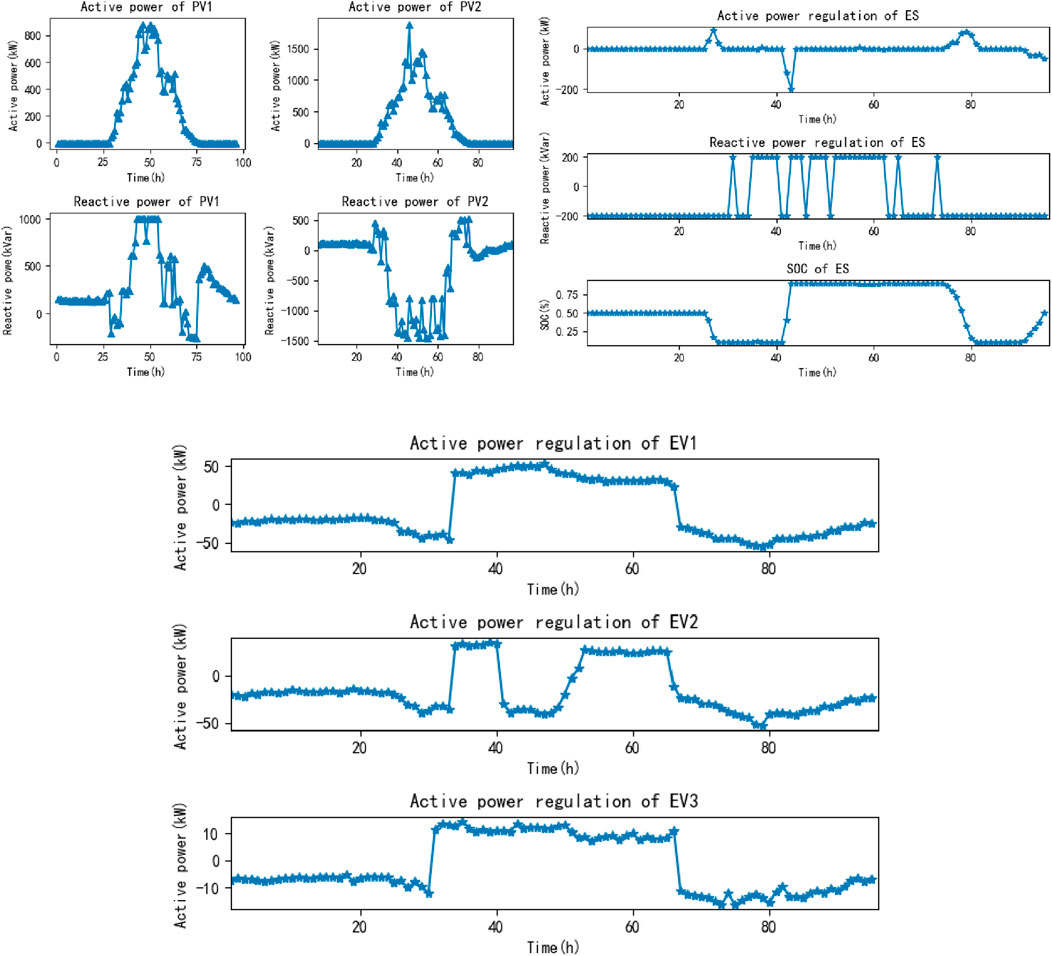
Figure 8. Distributed resource output.
Figure 9 shows the load distribution curve of the power distribution system as a whole and the change curve of the balance node (access point of the upper power grid). It can be observed that as time changes, the load of the two nodes where photovoltaics is located presents a trend of first increasing and then decreasing, when the photovoltaic output is insufficient, the system purchases electricity from the upper power grid through the balance node to meet the load demand, and when the photovoltaic output is too much, the redundant electricity is returned to the upper power grid, which is in line with the actual situation.
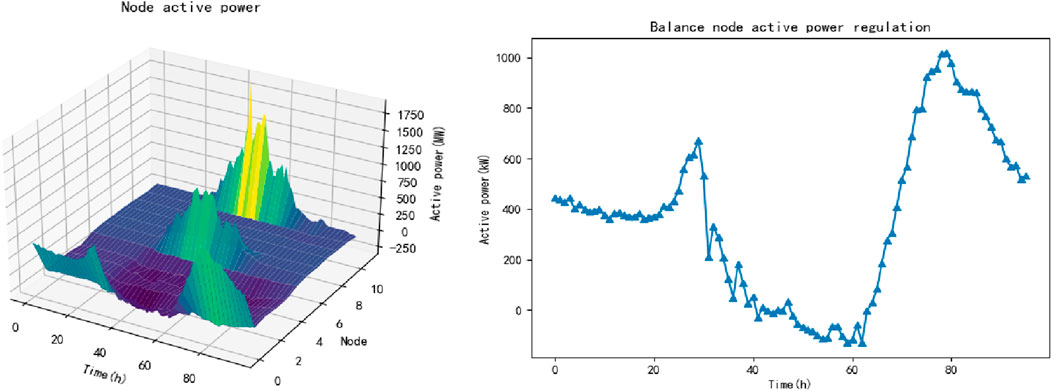
Figure 9. Node active power.
Figure 10 shows the adjustment amount of photovoltaic active/reactive power output and the change amount of electric vehicle load after the active-reactive power collaborative optimization scheduling. To ensure that the voltage of the nodes in the system does not exceed the limit when the photovoltaic power is generated, it is necessary to control the photovoltaic field station to reduce part of the active power output and guide the power flow controller to channel the line power flow. It can be found that with the changes in photovoltaic active power output and node load demand, the power flow controller can adjust the active and reactive power distribution of the line to ensure that the line voltage does not exceed the limit, and at the same time, it can reduce the amount of light discarded by photovoltaic, and effectively improve the absorption rate of renewable energy.
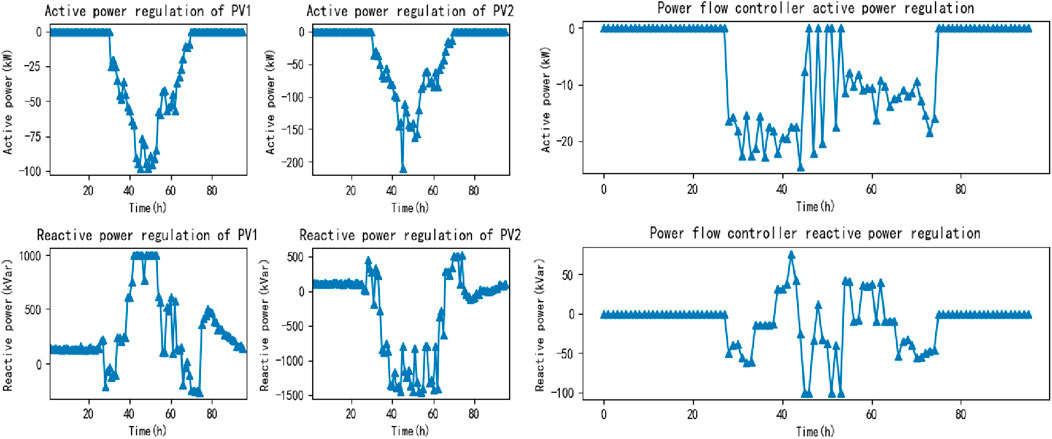
Figure 10. Power adjustment condition of PV and PFC.
Figure 11; Table 3 compare the overall voltage and comprehensive cost of the rural power distribution system before and after optimization and regulation. By comparison, it can be seen that before optimizing and regulating the rural power distribution system, when the photovoltaic output is excess, the overall voltage of the system will exceed the upper limit, and when the photovoltaic output is insufficient, the overall voltage of the system maybe exceed the lower limit, which will bring serious harm to the power grid, and after optimized control, the node voltage is limited to a reasonable range, and the voltage fluctuation amplitude is significantly reduced.
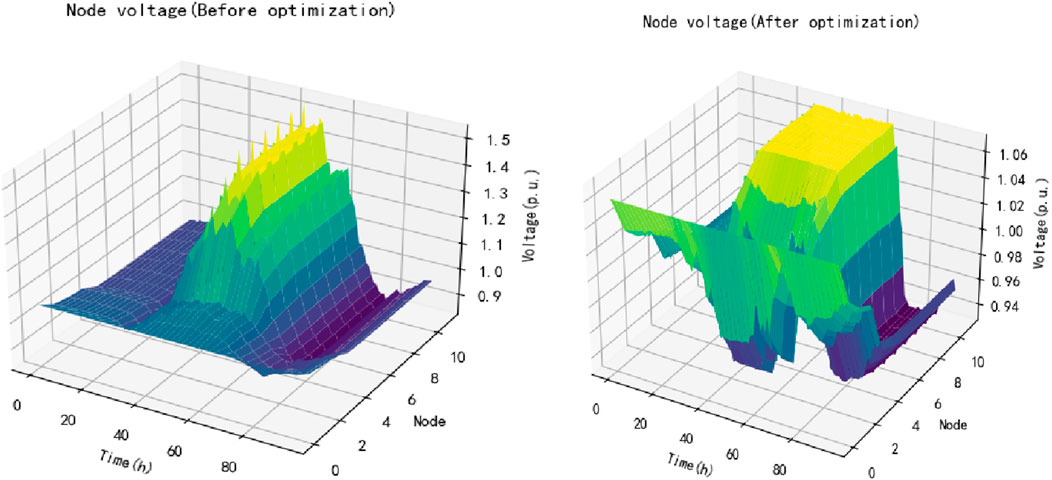
Figure 11. Node voltage comparison.
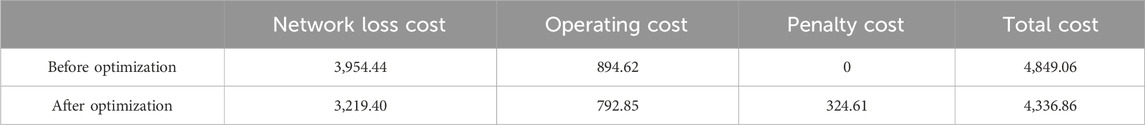
Table 3. Total cost comparison.
In summary, two schemes are performed for comparisons to demonstrate the effectiveness and superiority of the proposed active-reactive power collaborative optimization scheduling: Compared to before collaborative scheduling, after collaborative scheduling, the comprehensive cost, including power-loss cost
In order to solve the instability of rural power distribution systems with a high proportion of renewable energy, a method of active-reactive power collaborative optimization scheduling for rural power distribution systems is proposed. The key innovations proposed in this paper are as follows: 1) The quantitative evaluation indexes of active power support capability and reactive power support capability were put forward, and the evaluation model of active power support capability was established. The proposed evaluation model can more accurately evaluate and quantify the support capacity of distributed resources for rural power distribution systems. Moreover, the accuracy of active power prediction based on informant model is about 13.26% higher than that of other methods mentioned in this paper; 2) The active-reactive power collaborative optimization scheduling model for rural power distribution systems with a high proportion of renewable energy was established, which greatly improved the safety and economy of the distribution system compared with the non-optimization, the comprehensive cost could be reduced by about 11.81%, and the maximum voltage reduction of the rural distribution system is approximately 27.2%; 3) The active support capability evaluation and regulation platform of the rural power distribution system is built to realize the active support capability evaluation of distributed resources and the scheduling control function of the new power distribution system, providing technical support services for the safe and stable operation of the rural power distribution system. In general, these innovations help to promote the safe, economic and stable operation of rural power distribution systems with a high proportion of renewable energy, and promote the construction of new rural power distribution systems.
The datasets presented in this article are not readily available because the dataset is from the electric power research institute of guizhou electric power grid, which is confidential. Requests to access the datasets should be directed to eDE1ODIzNzY0NTI2QDE2Mw==.
AL: Writing–original draft. XL: Data curation, Formal Analysis, Writing–review and editing. YL: Conceptualization, Methodology, Writing–review and editing. SH: Formal Analysis, Funding acquisition, Writing–review and editing. YM: Software, Supervision, Writing–review and editing. YZ: Conceptualization, Software, Writing–review and editing. JX: Data curation, Methodology, Writing–review and editing. QY: Supervision, Writing–review and editing, Methodology.
The author(s) declare that financial support was received for the research, authorship, and/or publication of this article. This work was supported by the Science and Technology Project of Guizhou Power Grid under Grant GZKJXM20222149.
Authors AL, XL, YL, SH, YM, and YZ were employed by Electric Power Research Institute of Guizhou Electric Power Grid Co., Ltd.
The remaining authors declare that the research was conducted in the absence of any commercial or financial relationships that could be construed as a potential conflict of interest.
The authors declare that this study received funding from the Science and Technology Project of Guizhou Power Grid. The funders had the following involvement in the study: the funders played an active role in research design, data collection and analysis, and decision to publish the manuscript.
All claims expressed in this article are solely those of the authors and do not necessarily represent those of their affiliated organizations, or those of the publisher, the editors and the reviewers. Any product that may be evaluated in this article, or claim that may be made by its manufacturer, is not guaranteed or endorsed by the publisher.
Akinyemi, A. S., Musasa, K., and Davidson, I. E. (2022). Analysis of voltage rise phenomena in electrical power network with high concentration of renewable distributed generations. Sci. Rep. 12 (7815), 7815. doi:10.1038/s41598-022-11765-w
Albatsh, F. M., Mekhilef, S., Ahmad, S., and Mokhlis, H. (2017). Fuzzylogic-based UPFC and laboratory prototype validation for dynamic power flow control in transmission lines. IEEE Trans. Ind. Electron. 64 (12), 9538–9548. doi:10.1109/tie.2017.2711546
Almeida, D., Pasupuleti, J., Raveendran, S. K., and Basir Khan, M. R. (2021). Performance evaluation of solar PV inverter controls for overvoltage mitigation in MV distribution networks. Electronics 10 (12), 1456. doi:10.3390/electronics10121456
Babbar, S. M., Lau, C. Y., and Thang, K. F. (2021). Long term solar power generation prediction using adaboost as a hybrid of linear and non-linear machine learning model. Int. J. Adv. Comput. S. C. 12 (11), 546–545. doi:10.14569/ijacsa.2021.0121161
Cao, Y., Zhou, B., Chung, C. Y., Wu, T., Ling, Z., and Shuai, Z. (2024). A coordinated emergency response scheme for electricity and watershed networks considering spatio-temporal heterogeneity and volatility of rainstorm disasters. IEEE Trans. Smart. Grid., Feb, 1. doi:10.1109/TSG.2024.3362344
Chawda, G. S., and Shaik, A. G. (2022). Enhancement of wind energy penetration levels in rural grid using ADALINE-LMS controlled distribution static compensator. IEEE Trans. Sustain. Energy 13 (1), 135–145. doi:10.1109/tste.2021.3105423
Fu, X., and Zhou, Y. (2023). Collaborative optimization of PV greenhouses and clean energy systems in rural areas. IEEE Trans. Sustain. Energy 14 (1), 642–656. doi:10.1109/tste.2022.3223684
Gao, H. J., Liu, J. Y., and Wang, L. F. (2018). Robust coordinated optimization of active and reactive power in active distribution systems. IEEE Trans. Smart. Grid 9 (5), 4436–4447. doi:10.1109/tsg.2017.2657782
Gao, X. M., Yang, S. F., and Pan, S. B. (2017). Optimal parameter selection for support vector machine based on artificial bee colony algorithm: a case study of grid-connected pv system power prediction. Comput. Intell. Neurosci. 2017, 1–14. doi:10.1155/2017/7273017
Han, J. S., Zhang, L., and Yang, L. (2022). Spatiotemporal analysis of rural energy transition and upgrading in developing countries: the case of China. Appl. Energy. 307, 118225. doi:10.1016/j.apenergy.2021.118225
Hou, C. F., Zhang, C. X., Wang, P., and Liu, S. (2024). Renewable energy based low-voltage distribution network for dynamic voltage regulation. Results Eng. 21, 101701. doi:10.1016/j.rineng.2023.101701
Huang, Z. H., Zhang, Y. H., and Xie, S. W. (2022). Data-adaptive robust coordinated optimization of dynamic active and reactive power flow in active distribution networks. Renew. Energy 188, 164–183. doi:10.1016/j.renene.2022.02.027
Jiang, T., Dong, X., Zhang, R., Li, X., Chen, H., and Li, G. (2023a). Active-reactive power scheduling of integrated electricity-gas network with multi-microgrids. Front. Energy 17, 251–265. doi:10.1007/s11708-022-0857-1
Jiang, Y., Fu, K., Huang, W., Zhang, J., Li, X., and Liu, S. (2023b) “Ultra-short-term PV power prediction based on Informer with multi-head probability sparse self-attentiveness mechanism”, Front. Energy Res., vol. 11, pp. 1301828, doi:10.3389/fenrg.2023.1301828
Kharrazi, A., Sreeram, V., and Mishra, Y. (2020). Assessment techniques of the impact of grid-tied rooftop photovoltaic generation on the power quality of low voltage distribution network - a review. Renew. Sust. Energy Rev. 120, 109643. doi:10.1016/j.rser.2019.109643
Li, P., Zhang, C. C., Fu, X. P., Song, G., Wang, C., and Wu, J. (2019). Determination of local voltage control strategy of distributed generators in active distribution networks based on kriging metamodel. IEEE Access 7, 34438–34450. doi:10.1109/access.2019.2904144
Liu, F., Zhang, Z., and Zhou, R. (2022b). Automatic modulation recognition based on CNN and GRU. Tsinghua Sci. Technol. 27 (2), 422–431. doi:10.26599/tst.2020.9010057
Liu, X. J., Du, Z. B., Tan, Y. F., and Liu, Y. (2022a). Voltage optimization control strategy for islanded microgrid source-grid-load active-reactive power coordination based on collaborative Di-MPC. Front. Energy Res. 10, 880825. doi:10.3389/fenrg.2022.880825
Osama abed el-Raouf, M., Mageed, S. A. A., Salama, M. M., Mosaad, M. I., and AbdelHadi, H. A. (2023). Performance enhancement of grid-connected renewable energy systems using UPFC. Energies 16 (11), 4362. doi:10.3390/en16114362
Ru, N., Zhang, Z., and Zhang, H. (2021). “Carbon emission peak and carbon neutrality under the new target and vision,” in 2021 International Conference on Advanced Electrical Equipment and Reliable Operation (AEERO), Beijing, China, 15-17 Oct. 2021 (AEERO), 1–5.
Tian, Z., Yi, J., Tao, J., Zhang, S., and Wen, Z. (2022). Hybrid autoregressive and non-autoregressive transformer models for speech recognition. IEEE Signal Process 29, 762–766. doi:10.1109/lsp.2022.3152128
Wang, C. F., Wang, Y. L., Zhao, Y. J., Shuai, J., Shuai, C., and Cheng, X. (2023a). Cognition process and influencing factors of rural residents' adoption willingness for solar PV poverty alleviation projects: evidence from a mixed methodology in rural China. Energy 271, 127078. doi:10.1016/j.energy.2023.127078
Wang, J., Chen, L., Tan, Z., Du, E., Liu, N., Ma, J., et al. (2023b). Inherent spatiotemporal uncertainty of renewable power in China. Nat. Commun. 14, 5379. doi:10.1038/s41467-023-40670-7
Wang, J., Gao, F., Zhou, Y., Guo, Q., Tan, C. W., Song, J., et al. (2023c). Data sharing in energy systems. Adv. Appl. Energy 10, 100132. doi:10.1016/j.adapen.2023.100132
Wu, A., Ma, Z., Zeng, G., et al. (2011). Multi-layer cloud model for statistically analysis on renewable energy status in China's rural areas. Chin. J. Electron 20 (1), 101–104.
Wu, X., Wang, R., Wang, Y., and Wang, L. (2022). A novel UPFC model and its convexification for security-constrained economic dispatch. IEEE Trans. Power Syst. 37 (6), 4202–4213. doi:10.1109/tpwrs.2022.3148090
Xiao, C. L., Ding, M., Sun, L., and Chung, C. (2021). Network partition-based two-layer optimal scheduling for active distribution networks with multiple stakeholders. IEEE Trans. Ind. Inf. 17 (9), 5948–5960. doi:10.1109/tii.2020.3038668
Xu, X., Zhang, T., Qiu, Z. W., Gao, H., Yu, H., Ma, Z., et al. (2024). Multi-mode control of a hybrid transformer for the coordinated regulation of voltage and reverse power in active distribution network. Processes 12 (2), 265. doi:10.3390/pr12020265
Zhang, K., Luo, Y., Fu, Y., and Liu, N. (2024c). A hierarchical multi-timeframe multi-energy sharing framework for a self-sustained energy-transportation nexus. IEEE Trans. Ind. Appl. 60 (1), 1034–1047. doi:10.1109/tia.2023.3298870
Zhang, K., Zuo, P., Zou, Z., Feng, X., Huang, Y., Wang, S., et al. (2024b). Forecasting medium-term F10.7 using the deep-learning informer model. Sol. Phys. 299 (47), 47. doi:10.1007/s11207-024-02284-0
Zhang, K. Z., Xu, Y. L., and Sun, H. B. (2024a). Bilevel optimal coordination of active distribution network and charging stations considering EV drivers' willingness. Appl. Energy 360, 122790. doi:10.1016/j.apenergy.2024.122790
Zhou, C. N., Xiong, B., Xue, H. Q., Zheng, D., Ge, Z., Wang, Y., et al. (2021). The role of new energy in carbon neutral. Petroleum Explor. Dev. 48 (2), 480–491. doi:10.1016/s1876-3804(21)60039-3
Zhou, H. X., J Zhang, Y., Yang, L. F., Liu, Q., Yan, K., and Du, Y. (2019). Short-term photovoltaic power forecasting based on long short term memory neural network and attention mechanism. IEEE Access 7, 78063–78074. doi:10.1109/access.2019.2923006
Zhuang, W., Fan, J. L., Xia, M., and Zhu, K. (2023). A multi-scale spatial-temporal graph neural network-based method of multienergy load forecasting in integrated energy system. IEEE Trans. Smart Grid 15, 2652–2666. doi:10.1109/tsg.2023.3315750
Keywords: informer model, active support capability, power forecasting, distributed resources, optimal power flow
Citation: Liu A, Li X, Li Y, Hao S, Miao Y, Zheng Y, Xie J and Yao Q (2024) Collaborative scheduling method of active-reactive power for rural distribution systems with a high proportion of renewable energy. Front. Energy Res. 12:1410694. doi: 10.3389/fenrg.2024.1410694
Received: 01 April 2024; Accepted: 26 April 2024;
Published: 15 May 2024.
Edited by:
Chaojie Li, University of New South Wales, AustraliaReviewed by:
Cao Yingping, Hong Kong Polytechnic University, Hong Kong SAR, ChinaCopyright © 2024 Liu, Li, Li, Hao, Miao, Zheng, Xie and Yao. This is an open-access article distributed under the terms of the Creative Commons Attribution License (CC BY). The use, distribution or reproduction in other forums is permitted, provided the original author(s) and the copyright owner(s) are credited and that the original publication in this journal is cited, in accordance with accepted academic practice. No use, distribution or reproduction is permitted which does not comply with these terms.
*Correspondence: Junyu Xie, eDE1ODIzNzY0NTI2QDE2My5jb20=
Disclaimer: All claims expressed in this article are solely those of the authors and do not necessarily represent those of their affiliated organizations, or those of the publisher, the editors and the reviewers. Any product that may be evaluated in this article or claim that may be made by its manufacturer is not guaranteed or endorsed by the publisher.
Research integrity at Frontiers
Learn more about the work of our research integrity team to safeguard the quality of each article we publish.