 Ziqiang Wang1
 Ying Song
94% of researchers rate our articles as excellent or good
Learn more about the work of our research integrity team to safeguard the quality of each article we publish.
Find out more
ORIGINAL RESEARCH article
Front. Energy Res. , 20 June 2024
Sec. Process and Energy Systems Engineering
Volume 12 - 2024 | https://doi.org/10.3389/fenrg.2024.1410679
This article is part of the Research Topic Optimal Design and Efficiency Improvement of Fluid Machinery and Systems: Volume III View all 7 articles
The structure of the guide vane centrifugal pump as turbine is complex, and the internal flow characteristics directly affect the energy loss distribution. The numerical method and entropy generation theory are used to analyze the energy loss distribution of each flow component of the guide vane centrifugal pump as turbine at different flow conditions. And the transient fluctuation law of hydraulic loss of passage component is also studied. The results show that the loss in the impeller accounts for 54%–58% under small flow conditions, and the loss in the guide vane accounts for 50%–61% under large flow conditions. The hydraulic loss of the impeller and guide vane is affected by the interaction between the impeller and guide vane, volute. And there are five obvious peaks and troughs in the 1/6 period. The primary and secondary frequencies of impeller hydraulic loss change with the flow rate. At the 0.57QBEP condition, the primary and secondary frequency of the impeller loss is blade frequency and 5 times blade frequency respectively, while the frequencies under the condition of 1.43QBEP are opposite. The primary and secondary frequencies of guide vane hydraulic loss are different under different flow conditions. The hydraulic loss of volute is mainly affected by the interference between the impeller and volute under various flow conditions, and the primary frequency is blade frequency.
In the petrochemical industry, seawater desalination, iron and steel metallurgy, and other industrial processes will produce a large number of high-pressure fluids that are directly discharged (Orchard and Klos, 2009; Puleo et al., 2014; De Marchis et al., 2016). With the establishment of the “double-carbon” target, more and more attention has been paid to the recycling of high-pressure fluid energy. The centrifugal pump can convert the pressure energy of the high-pressure fluid into mechanical energy and then into the shaft power output energy (Wang et al., 2013; Wang et al., 2014). At the same time, it is widely used in residual pressure recovery (Miao et al., 2018) in the industrial process because of its advantages of reliable operation, low cost, and simple structure. The geometry of a centrifugal pump as a turbine is relatively complex, and its internal flow is prone to complex turbulence phenomena such as jet and eddy current, which leads to various hydraulic losses caused by flow phenomena and reduces the energy recovery efficiency of high-pressure fluid.
At present, domestic and foreign scholars have conducted some studies on the energy loss characteristics of centrifugal pump as turbine. In order to improve the efficiency of centrifugal pump as turbine, Yang Sunsheng et al. (Yang et al., 2016) designed two types of impeller, front and back bend. The results show that the power loss of the impeller is mainly due to the unsteady flow inside the impeller. Wang Tao et al. (Wang et al., 2015) used numerical method to study the influence of different blade placement Angle on the performance of centrifugal pump as turbine, indicating that different blade placement Angle obviously affects the internal flow field of the impeller, and the maximum loss area appeared in the tail edge of the impeller. Yang Junhu et al. (Yang et al., 2010) used numerical method to deeply explore the turbine outlet slip coefficient and energy loss characteristics of the centrifugal pump at different specific rotation numbers, indicating that the change of impeller geometric parameters has little influence on the slip coefficient, and the appropriate blade outlet diameter and placement Angle can effectively improve the power of the impeller shaft. Shi Guangtai et al. (Shi and Peng, 2019) used experimental and numerical methods to study the energy loss mechanism of the part of the liquid centrifugal pump as turbine. The results showed that the energy loss of liquid turbine increases with the increase of gas content, and the gas content has a more obvious impact on the energy loss of the volute. LI et al. (Li, 2015), Abazariyan et al. (Abazariyan et al., 2018) used test and numerical simulation methods to study the influence of centrifugal pumpas turbine under different fluid viscosity. The results show that the energy loss of each overcurrent component increases with the increase of viscosity. Shi et al. (Shi et al., 2013) used a numerical method to investigate the relationship between hydraulic turbine efficiency and rotation speed, and found that with the increase of impeller rotation speed, the change trend of energy loss is to increase first and then decrease. Lintong et al. (Lin et al., 2021) deeply analyzed the energy conversion and influx characteristics under the turbine condition of centrifugal pump, and found that the impeller loss in the small flow condition was mainly caused by the import impact, and the unstable flow of the rotating channel in the large flow condition.
Centrifugal pump turbine loss can be calculated using a variety of techniques, including entropy production (Herwig and Kock, 2007), total pressure loss (Li et al., 2017), and (Liu et al., 2019), which rely on both theoretical and empirical calculations, and energy dissipation, which uses the energy transfer equation. Due to its versatility and ease of use, the entropy production calculation method is gradually becoming more and more popular for calculating the loss of pumps as turbine overflow components. In order to calculate turbulent heat transfer, either directly or indirectly, Kock et al. (Kock and Herwig, 2004) proposed the entropy production method of computational hydrodynamics. They also divided the method into four parts based on the reasons for entropy increase, provided an indirect solution for turbulent entropy production, and established the relationship between local entropy generation rate and energy loss. By applying the entropy production calculation to the mixed-flow turbine loss, Gong et al. (2013) showed that the entropy production approach is capable of analyzing the energy loss value in each component in addition to locating high energy loss locations. The energy loss mechanism of each flow component under various flow conditions is examined in this paper using the entropy production theory. The loss area of each flow component and the factors influencing it are also discussed. The theoretical underpinnings and references for the optimization design of the guide vane centrifugal pump as a turbine are also provided. Energy dissipation in the main stream region is the main reason for the variation of hydraulic performance. The energy loss distribution in the volute and guide vane is less affected by the flow rate, and has a greater correlation with the circumference of the guide vane. The loss in volute under different flow conditions is mainly affected by the impeller-volute dynamic and static interference.
The analytical object in this work is a guide vane centrifugal pump as turbine with a particular speed of ns = 55. The geometric design parameters of each overcurrent component are displayed in Table 1. The model pump’s basic design parameters are flow Q of 40 m3/h, head H of 55 m, and speed n of 2,900 rpm. As seen in Figure 1, geometric design parameters of components, including the impeller, guide vane, and volute, are carried out using the 3D program Proe and the meshing software ICEM.
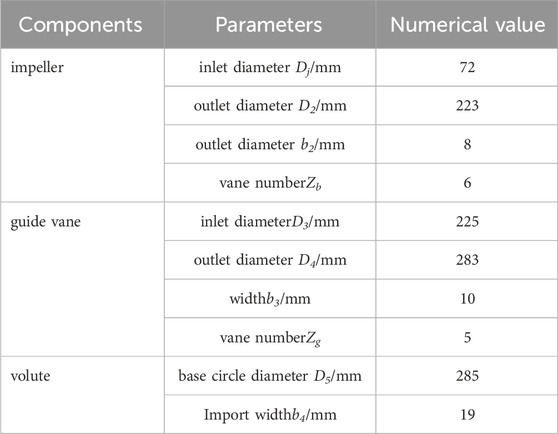
Table 1. Geometric design parameters of components.
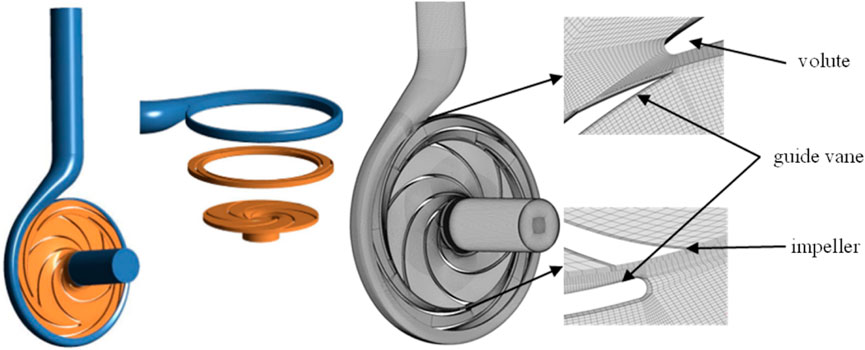
Figure 1. Models and grids.
In order to verify the numerical simulation results and select a suitable turbulence model, the external characteristics of the hydraulic turbine model were tested, as shown in Figure 3. Both the impeller and volute are made of plexiglass. The experimental model is shown in Figure 3. The flow is measured by Yokogawa AE215 electromagnetic flowmeter with an error of ±0.5%. The JN338 torque sensor is used to measure the torque with an error of ±0.2%, and the EJA510A pressure sensor is used to measure the pressure at the inlet and outlet with an error of ±0.1%. The measured flow rate, torque, and inlet and outlet pressure are used to obtain the water head and efficiency.
The guide vane centrifugal pump as turbine is analyzed using CFX numerical software. The primary boundary conditions encompass the total pressure inlet boundary condition, the mass flow outlet, and the no-sliding wall. The constant value result is initially set to the unconstant value. The time step is 5.747 × 10⁻⁵s, which corresponds to impeller rotation 1°. There are a total of six cycles, and the latest phase is chosen for flow field analysis. To guarantee the precision of calculating the energy loss due to entropy creation along the wall, the wall of each overflow section is encrypted locally to ensure that its y + value is less than 100 (Yang et al., 2021) (as depicted in Figure 2). The turbine in Figure 2B, which has a flow rate of Q = 56 m3/h, demonstrates that when the total grid number exceeds 6.57 million, the rate of change for head and efficiency is minimal, with a difference of less than 3%. This corrects the numerical calculation error due to the grid number. Therefore, when considering the cost of numerical calculation, each component of the overflow component is calculated as follows: 2.14 million for the impeller, 1.54 million for the guide vane, 2.11 million for the volute, and 570,000 for import and export.
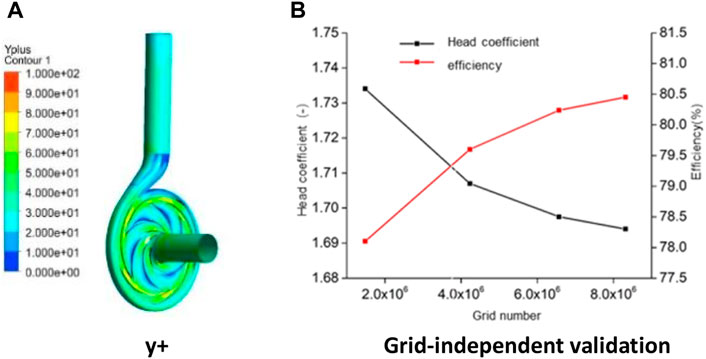
Figure 2. Grid independence research. (A) y+ and (B) Grid-independent validation.
To ensure the accuracy of numerical simulations, four turbulence models, namely, k-ε, RNG k-ε, k-ω, and SST k-ω, were employed for analysis and experimental validation, as shown in Figure 3. It can be observed from the figure that the head and efficiency errors of each turbulence model are both below 4.61% and 9.26%, respectively. From the flow-head curve, it is evident that the k-ω and SST k-ω turbulence models exhibit small calculation errors, with errors of 0.8% and 2.06% at a flow rate of 72 m3/h, while the k-ε and RNG k-ε turbulence models show larger calculation errors of 4.61% and 4.44%, respectively. Regarding the flow-efficiency curve, the maximum efficiency errors for the k-ε, k-ω, and SST k-ω turbulence models are 3.50%, 1.24%, and 3.91%, respectively, whereas the RNG k-ε turbulence model has an error of 9.26%. Considering the accuracy of turbulence model numerical calculations, the SST k-ω turbulence model was selected for the numerical analysis in this study.
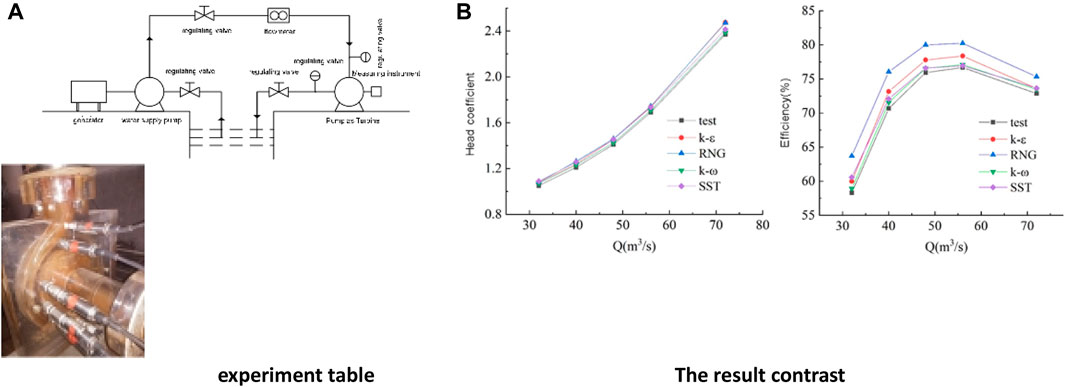
Figure 3. Comparison of the experimental data and numerical results. (A) experiment table and (B) The result contrast.
According to the second law of thermodynamics, the theory of entropy production of an incompressible single-phase fluid is (Hongyu et al., 2021):
It is known from Formula 1 that the entropy production S is related to temperature and pressure. In this paper, the Renault’s time-equalization method is used to analyze the turbine inversion of the guide vane centrifugal pump, so the time-equalization entropy production is as follows:
In the above equation, it is the entropy production of turbulent flow dissipation and the entropy production due to turbulence and heat transfer. In the process of numerical analysis, the temperature change is ignored, so we only need to directly solve the turbulent dissipation entropy production, where the turbulent dissipation is mainly composed of turbulent kinetic energy dissipation and viscosity dissipation (Yang et al., 2019):
In the above equation, the viscosity dissipative entropy production (W/m3), mainly generated by the time-average velocity per unit time, is the turbulent dissipation entropy production (W/m3), mainly generated by the pulsation velocity per unit time. The turbulent dissipation entropy production and the viscosity dissipation entropy production are the Eqs 4, 5 respectively:
In the above equation: μ is the dynamic viscosity (Pa.s), u, v, w is the velocity component (m/s).
The pulse velocity is difficult to obtain in the Reynolds’ time average numerical method, so solving the turbulent dissipation rate ε for the turbulent dissipation entropy production (Hou et al., 2019):
The entropy production generated by the wall loss occupies a part of the total entropy production. Therefore, the calculation of the wall entropy production adopts the wall friction loss representation (Li et al., 2017):
In the above formula: wall shear stress (Pa); wall velocity (m/s).
Total entropy production per unit time, or energy dissipation, is:
In the above formula, LEP is the total entropy production (W), LEP1 is the viscous dissipative entropy production (W), LEP2 is the turbulent dissipative entropy production (W), LEP, W is the entropy production (W) in the wall area, and LEP, A is the entropy production (W) in the mainstream area.
In order to verify the applicability and accuracy of the above entropy production theory, the differential difference method is used to verify the feasibility of total entropy production.
In the upper formula, Pin and Pout are the inlet and outlet total pressure (Pa) of each overflow component;
Figure 4 depicts the relationship between total turbine entropy production, pressure loss, error, and correlation at different flow conditions. It can be observed from the figure that the loss calculated from entropy production follows a similar trend to that calculated by the pressure method; as the flow rate increases, the losses calculated by both methods gradually increase, indicating the feasibility of using entropy production for loss calculation. Moreover, the errors in losses calculated by both methods initially decrease and then increase with increasing flow rate. The maximum error occurs at a flow rate of Q = 24 m3/s, reaching 20.2%, while the minimum error, at 9.0%, is observed at Q = 64 m3/s. This variation is mainly attributed to significant velocity gradients in certain regions caused by phenomena such as wake flow and vortices at low flow rates. To further validate the feasibility of the entropy production calculation method, a correlation analysis was conducted, showing a clear linear relationship between the losses calculated by the two methods. The Pearson correlation coefficient and R2 were both above 0.99, indirectly indicating a high level of credibility in using the entropy production method for turbine energy loss analysis in reverse pump-turbines.
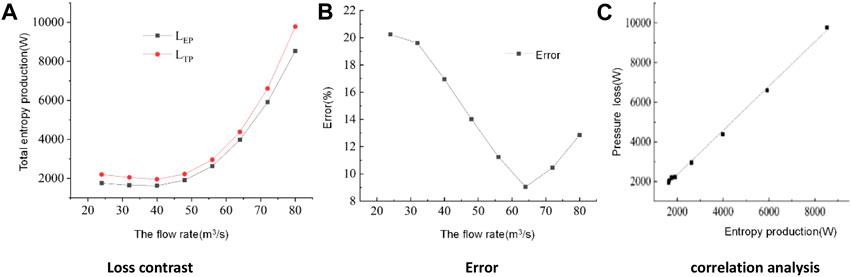
Figure 4. Comparison of entropy production and pressure loss. (A) Loss contrast, (B) Error and (C) Correlation analysis.
Figure 5 shows the distribution of entropy production energy loss in each overflow component under different flow conditions. As can be seen from the figure, with the increase of flow, the entropy energy loss of each excessive current component gradually increases, in which the entropy energy loss of the import and export pipe section is the minimum, accounting for less than 6% of the total loss. In the flow condition below 0.8 QBEP, the entropy loss in the impeller is the largest, followed by the guide vanes and the volute; in the flow condition greater than 0.8 QBEP, the entropy loss in the volute. Under various flow conditions, it is seen that the impeller and guide vanes demonstrate the greatest amount of loss in overall entropy production. The impeller’s internal entropy production loss ranges from 54% to 68% at low flow conditions, whereas the guide vanes’ internal loss ranges from 24% to 35%. In contrast, in conditions of high flow, the roles of entropy production losses in the impeller and guide vanes are inverted. Specifically, the entropy production loss in the impeller ranges from 20% to 33%, while the entropy production loss in the guide vanes ranges from 50% to 61%. This observation suggests that as the flow rate is increased, there is a steady drop in the proportion of entropy production loss assigned to the impeller, while the proportion attributable to the guide vanes grows. The entropy production loss of the volute casing remains below 17% under all flow circumstances, especially in low flow conditions where it contributes only 2%–5%.

Figure 5. The change in entropy production of each component. (A) Change in the loss value and (B) Proportion of the loss.
Figure 6 displays the dissipation of energy and the dispersion of the flow field in the volute and guide vane under different flow conditions. Based on the diagram, the entropy generation in the volute and guide vane rises in proportion to the increase in flow. The region of greatest entropy production in the guide vane is primarily limited to the leading edge, tail edge, and suction surface of the guide leaf and blade, respectively. The guide vane blade (GV1), which is positioned in close proximity to the diaphragm of the volute, exhibits the highest level of loss. As the flow rate increases, the loss area gradually facilitates the expansion of the leaf flow channel. The primary source of entropy loss in the volute is mostly concentrated in the vicinity of the diaphragm and the wall. The primary cause of the aforementioned phenomenon in the worm tongue is the significant reflux and flow turbulence caused by the downstream fluid blade. This results in the separation of the leading leaf blade, GV1, leading to the highest local entropy loss. On the other hand, the leading edge and tail edge structure of the other guide leaf blade leads to substantial local entropy production in the front flow and tail flow separation.

Figure 6. Local velocity field and vortex core distribution of the volute and guide vane. (A) Energy dissipation distribution in the volute and guide vane, (B) Velocity distribution and (C) Distribution of the vortex nuclei.
The energy dissipation and streamline distribution of various impeller blades, specifically those located near the rear cover, span, and near the front cover (Span0.1, Span0.5, and Span0.9), are depicted in Figure 7. From the figure, it is evident that under the 0.57 QBEP flow condition, the impeller experiences the most loss of entropy production along its front and tail edges. Furthermore, the entropy production loss at the impeller intake is considerably greater than that at the outlet. The primary cause of this phenomenon can be attributed to the presence of a substantial stall vortex in close proximity to the impeller pressure surface. The obstruction of this vortex serves to enhance the energy exchange within the inlet region. The entropy production loss exhibits an upward trend as one moves downstream along the leaf height. At a flow condition of 1.0 QBEP, the blade inlet’s flow angle closely matches the placement angle of the intended inlet, resulting in a smooth, streamline distribution and a significant improvement in the eddy current phenomenon at the impeller inlet. The loss is small, particularly in the impeller inlet area, as compared to the flow conditions of 0.57 QBEP and 1.43 QBEP. The presence of wake flow causes noticeable flow separation in the posterior part of the leaves, resulting in a loss of entropy generation in that area. The way energy loss is spread out in entropy production is similar to how it is spread out in 1.0 QBEP when 1.43 QBEP is flowing, but the reasons for this loss are different. The primary factor contributing to the loss of import entropy production is the presence of a vortex on the pressure surface of the blade. However, in the flow condition of 1.43 QBEP, the vortex also affects the inlet suction surface, resulting in significant flow separation downstream. This separation further exacerbates the turbulent kinetic energy in the mainstream region.
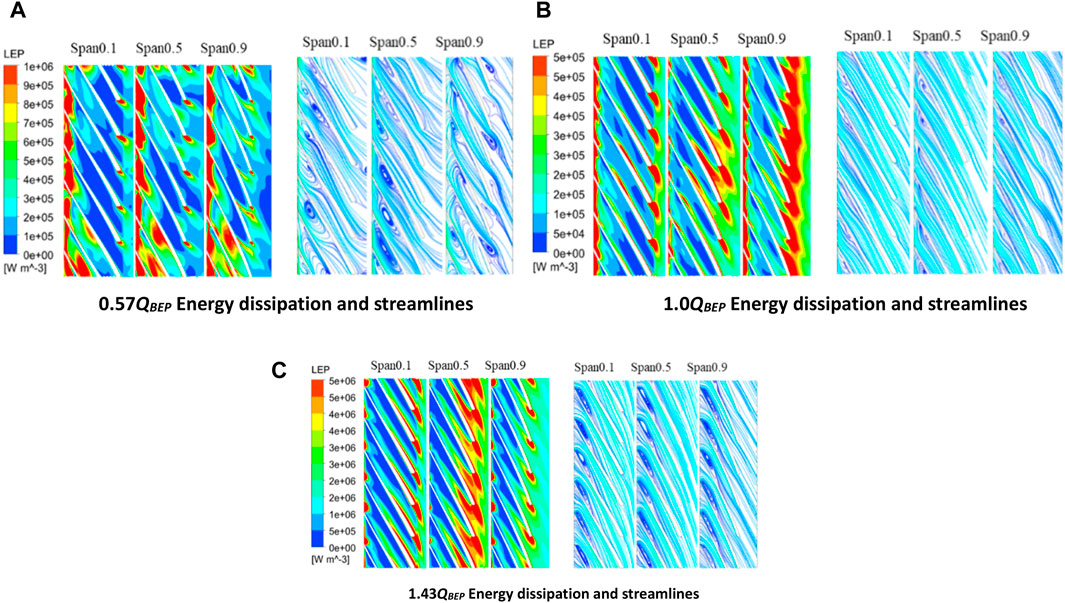
Figure 7. Energy dissipation and streamline of impeller. (A) 0.57QBEP Energy dissipation and streamlines, (B) 1.0QBEP Energy dissipation and streamlines and (C) 1.43QBEP Energy dissipation and streamlines.
The transient distribution of hydraulic turbine head, efficiency, and shaft power of the guide vane centrifugal pump is depicted in Figure 8. Based on the figure, it can be observed that the interference, transient head, efficiency, and axial power exhibit periodic fluctuations. As the flow increases, the fluctuation becomes increasingly noticeable. For instance, in the 0.57 QBEP flow condition, the transient head, efficiency, and axial power demonstrate poor periodicity. This phenomenon can be attributed to the violent internal turbulence in each flow part under small flow conditions. The efficiency and fluctuation of axial power in each flow condition exhibit superior performance compared to the water head. Specifically, the frequency of violent five peaks or troughs (equivalent to the number of guide blades) in 1/6 cycles is significantly higher. This suggests that the interference of the impeller and the guide vane has a more pronounced impact on the efficiency and axial power fluctuations. The phenomena of violent five wave peaks or troughs gradually becomes more pronounced in the 1/6 cycle as the instantaneous efficiency fluctuation grows with the flow rate. To examine the factors behind the occurrence of five peaks and trough phenomena in 1/6 cycles, we evaluate the temporary variation in axis power in 1/6 cycles (as depicted in Figure 9). The peak and trough times, denoted as tHi and tLi (i = 1,2, … , 5), are considered. Based on the provided figure, it can be observed that the impeller experiences a peak or trough every rotation of 6°as a result of the impact exerted by the impeller wake flow and jet. At time tH1, the axial power reaches its maximum position, and the wake flow has a lesser impact on the tail edge of the impeller and the leading edge. During time tL1, the axial power is observed to be at its lowest point. The rotation of the impeller results in the elongation of the entire wake region, so expanding the range of impact exerted by the wake. This expansion leads to an increase in momentum exchange and a drop in hydraulic performance.
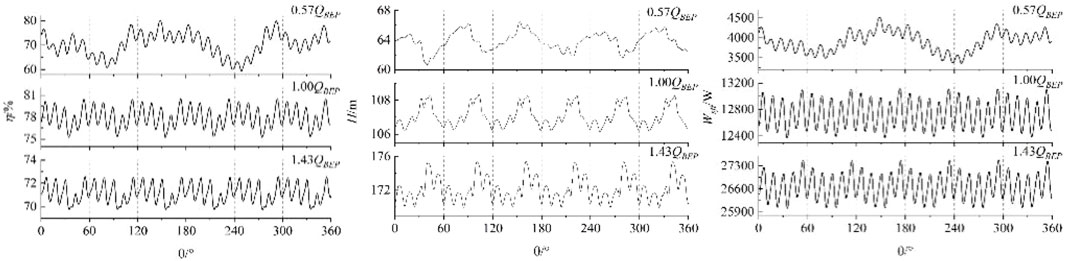
Figure 8. Transient change of external characteristics of PAT.
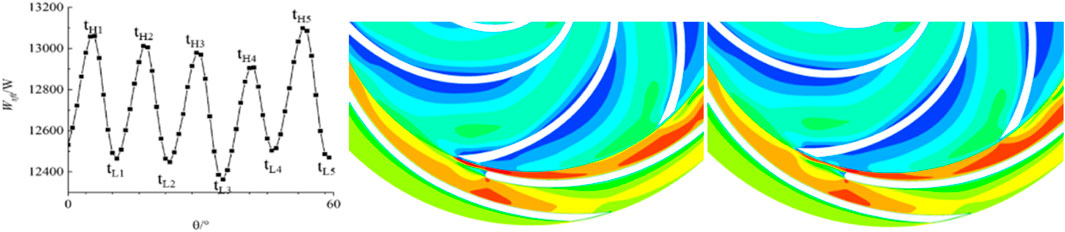
Figure 9. The change of shaft power in 1/6 period under design flow rate.
Figure 10 displays the distribution of hydraulic loss in the impeller, guide vane, and volute in both the time domain and frequency domain for each flow condition. The figure illustrates the impact of interference from the impeller-vane and impeller-volute on the hydraulic loss of the impeller and vane. It reveals six periodic fluctuations, with five peaks or valleys observed in each small cycle. The hydraulic loss of the volute is clearly influenced by the interference between the impeller and the volute, resulting in noticeable fluctuations every six cycles. On the other hand, the impact of the interference between the impeller and the guide leaf is minimal, and the intensity of the fluctuations in each small period is considerably lower compared to the loss caused by the impeller and the guide leaf. Under the 1.0 QBEP flow condition, the impeller exhibits the highest loss fluctuation amplitude, measuring 400W, followed by the guide vane with an amplitude of 300W, and the volute has the lowest fluctuation amplitude, measuring 220W. Based on the analysis of the loss distribution in the frequency domain, it can be observed that under flow conditions of 1.0 QBEP and 1.43 QBEP, the main frequency of volute loss is blade frequency, there is no amplitude at 5 times blade frequency, the impeller main frequency is 5 times blade frequency, the second frequency is blade frequency. This shows that the volute loss is mainly affected by the impeller-volute interference, while the impeller loss is affected by both the impeller-guide interference and the impeller-volute interference, but the influence of the impeller-guide interference is significantly stronger than that of the impeller-volute interference. With the increase of flow, the main frequency of guide vane loss is changing. In the 1.0 QBEP flow condition, the frequency at which the guide vane experiences loss is five times more than the main frequency, with an amplitude of 78.94 W. The secondary frequency corresponds to the blade frequency. At 1.43 QBEP, the guide vane main frequency is the blade frequency with an amplitude of 206.18W. In the flow condition of 0.57 QBEP, the main frequency of each overcurrent component is low frequency, its amplitude gradually increases from 55.91W to 289.20W along the volute to the impeller, the second frequency is 5 times the blade frequency, and the second frequency amplitude is much higher than that of the volute and guide vane. The main reason for the above phenomenon is the large scale vortex in the blade rotation channel, and the large number of vortex attached to the pressure surface of the impeller rotates with the whole channel inlet. At the same time, due to the influence of the trail, the vortex near the tail edge of the vane produces large turbulent kinetic energy. For example, compared with θ = 60°, at θ = 150°, there is less eddy current near the rotation channel and the inlet, and the hydraulic loss is small (as shown in Figure 11).

Figure 10. Frequency and time domain analysis of hydraulic loss in each flow passage component.
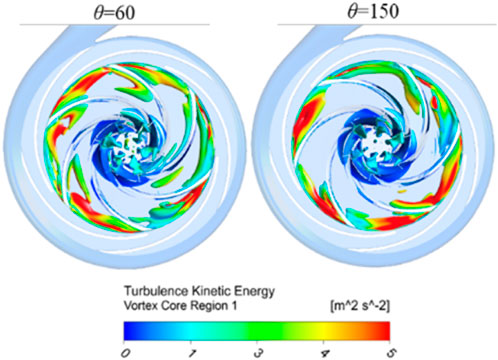
Figure 11. At 0.57 QBEP flow rate, the vortex distribution in the impeller at different times.
This paper uses the entropy production theory to study the energy loss distribution of the guide vane centrifugal pump as turbine under different flow conditions, and the fluctuation law and influencing factors of transient performance are analyzed. The main conclusions are as follows:
(1) The energy loss in the impeller is dominant in the low flow condition, while the energy loss in the guide vane plays a major role in the high flow condition.
(2) The energy loss distribution in volute and guide vane is less affected by the flow rate, which is the main factor affecting the loss in impeller. Under the condition of low flow, the transient performance is affected by more intense turbulence and is destroyed periodically.
(3) The periodic changes in the wake region of the guide vane cause the transient performance to fluctuate in 1/6 period. The main and secondary frequencies of the loss in the impeller under low flow condition are blade frequency and 5 times blade frequency respectively, and the opposite is true under other conditions.
(4) The inner loss of guide vane is affected by the dynamic and static interference of impeller-guide vane and impeller-volute, and the frequency of loss changes under different flow conditions under the influence of internal flow field.
The original contributions presented in the study are included in the article/Supplementary material, further inquiries can be directed to the corresponding author.
ZW: Conceptualization, Visualization, Writing–original draft, Formal Analysis, Methodology, Writing–review and editing. WW: Writing–review and editing, Data curation, Formal Analysis. DW: Writing–review and editing, Investigation, Software. YS: Conceptualization, Validation, Writing–review and editing.
The author(s) declare that no financial support was received for the research, authorship, and/or publication of this article.
Author WW was employed by Eaton (China) Investment Co.,Ltd.
The remaining authors declare that the research was conducted in the absence of any commercial or financial relationships that could be construed as a potential conflict of interest.
All claims expressed in this article are solely those of the authors and do not necessarily represent those of their affiliated organizations, or those of the publisher, the editors and the reviewers. Any product that may be evaluated in this article, or claim that may be made by its manufacturer, is not guaranteed or endorsed by the publisher.
Abazariyan, S., Rafee, R., and Derakhshan, S. (2018). Experimental study of viscosity effects on a pump as turbine performance. Renew. Energy 127, 539–547. doi:10.1016/j.renene.2018.04.084
De Marchis, M., Milici, B., Volpe, R., and Messineo, A. (2016). Energy saving in water distribution network through pump as turbine generators: economic and environmental analysis. Energies 9, 877. doi:10.3390/en9110877
Gong, R., Wang, H., Chen, L., Zhang, H., and Wei, X. (2013). Application of entropy production theory to hydro-turbine hydraulic analysis. Sci. China Technol. Sci. 56, 1636–1643. doi:10.1007/s11431-013-5229-y
Herwig, H., and Kock, F. (2007). Direct and indirect methods of calculating entropy generation rates in turbulent convective heat transfer problems. Heat Mass Transfer/Waerme- und Stoffuebertragung 43, 207–215. doi:10.1007/s00231-006-0086-x
Hongyu, G., Wei, J., Yuchuan, W., Hui, T., Ting, L., and Diyi, C. (2021). Numerical simulation and experimental investigation on the influence of the clocking effect on the hydraulic performance of the centrifugal pump as turbine. Renew. Energy 168, 21–30. doi:10.1016/j.renene.2020.12.030
Hou, H., Zhang, Y., Xin, Z., et al. (2019). Optimal hydraulic design of an ultra-low specific speed centrifugal pump based on the local entropy production theory. Proc. Institution Mech. Eng. Part A J. Power Energy 233, 206083628. doi:10.1177/0957650918825408
Kock, F., and Herwig, H. (2004). Local entropy production in turbulent shear flows: a high-Reynolds number model with wall functions. Int. J. Heat Mass Transf. - INT J HEAT MASS Transf. 47, 2205–2215. doi:10.1016/j.ijheatmasstransfer.2003.11.025
Li, D., Wang, H., Qin, Y., Han, L., Wei, X., and Qin, D. (2017). Entropy production analysis of hysteresis characteristic of a pump-turbine model. Energy Convers. Manag. 149, 175–191. doi:10.1016/j.enconman.2017.07.024
Li, W. (2015). Effects of viscosity on turbine mode performance and flow of a low specific speed centrifugal pump. Appl. Math. Model. 40, 904–926. doi:10.1016/j.apm.2015.06.015
Lin, T., Xie, J., and Xie, R. (2021). Centrifugal pump uses turbine inflow and energy conversion characteristics under multiple working conditions. J. Drainage Irrigation Mech. Eng. 39 (10), 994–1000. doi:10.3969/j.issn.1674-8530.20.0097
Liu, M., Tan, L., and Cao, S. (2019). Theoretical model of energy performance prediction and BEP determination for centrifugal pump as turbine. Energy 172, 712–732. doi:10.1016/j.energy.2019.01.162
Miao, S., Yang, J., Shi, F., and Wang, X. (2018). Research on energy conversion characteristic of pump as turbine. Adv. Mech. Eng. 10, 168781401877083. doi:10.1177/1687814018770836
Orchard, B., and Klos, S. (2009). Pumps as turbines for water industry. World Pumps 2009, 22–23. doi:10.1016/s0262-1762(09)70283-4
Puleo, V., Fontanazza, C., Notaro, V., De Marchis, M., Freni, G., and La Loggia, G. (2014). Pumps as turbines (PATs) in water distribution networks affected by intermittent service. J. Hydroinformatics 16, 259–271. doi:10.2166/hydro.2013.200
Shi, F., Yang, J., and Wang, X. (2013). Effect of rotating speed on hydraulic energy recovery turbines performance. Appl. Mech. Mater. 444-445, 1033–1037. doi:10.4028/www.scientific.net/amm.444-445.1033
Shi, G., and Peng, J. (2019). Analysis of hydraulic loss under gas-liquid two-phase conditions. Water Pump. Technol. (01), 29–33.
Wang, T., Kong, F., He, Y., et al. (2013). Current research status of centrifugal pump for turbine making. J. Drainage Irrigation Mech. Eng. 31 (08), 674–680. doi:10.3969/j.issn.1674-8530.2013.08.006
Wang, T., Kong, F., Yang, S., et al. (2015). Effect of blade placement angle change on hydraulic turbine performance. J. Agric. Mach. 46 (10), 75–80.
Wang, X., Yang, J., and Shi, F. (2014). Research status and prospect of energy recovery. J. Mech. Eng. Irrigation Drainage 32 (09), 742–747.
Yang, B., Li, B., Chen, H., and Liu, Z. (2019). Entropy production analysis for the clocking effect between inducer and impeller in a high-speed centrifugal pump. Proc. Institution Mech. Eng. Part C J. Mech. Eng. Sci. 233 (15), 5302–5315. doi:10.1177/0954406219843946
Yang, G., Zhao, X., Zhang, D., Geng, L., Yang, X., and Gao, X. (2021). Hydraulic components’ matching optimization design and entropy production analysis in a large vertical centrifugal pump. J. Mech. Sci. Technol. 35, 5033–5048. doi:10.1007/s12206-021-1021-2
Yang, J., Yuan, Y., Jiang, Y., et al. (2010). Centrifuge pump reversal as a performance prediction of the energy recovery turbine. J. Lanzhou Univ. Technol. 36 (01), 54–56. doi:10.3969/j.issn.1674-8530.14.0115
Keywords: pump as turbine, energy loss, entropy generation, numerical analysis, hydraulic loss
Citation: Wang Z, Wang W, Wang D and Song Y (2024) Numerical analysis of energy loss characteristics of guide vane centrifugal pump as turbine. Front. Energy Res. 12:1410679. doi: 10.3389/fenrg.2024.1410679
Received: 01 April 2024; Accepted: 30 May 2024;
Published: 20 June 2024.
Edited by:
Yang Yang, Yangzhou University, ChinaReviewed by:
Xiangyuan Zhu, Shandong Jianzhu University, ChinaCopyright © 2024 Wang, Wang, Wang and Song. This is an open-access article distributed under the terms of the Creative Commons Attribution License (CC BY). The use, distribution or reproduction in other forums is permitted, provided the original author(s) and the copyright owner(s) are credited and that the original publication in this journal is cited, in accordance with accepted academic practice. No use, distribution or reproduction is permitted which does not comply with these terms.
*Correspondence: Ying Song, eXNvbmcwMzIxQG53YWZ1LmVkdS5jbg==
Disclaimer: All claims expressed in this article are solely those of the authors and do not necessarily represent those of their affiliated organizations, or those of the publisher, the editors and the reviewers. Any product that may be evaluated in this article or claim that may be made by its manufacturer is not guaranteed or endorsed by the publisher.
Research integrity at Frontiers
Learn more about the work of our research integrity team to safeguard the quality of each article we publish.