 Kun Cui
 Kai Fan
 Yong Zhao
- School of Artificial Intelligence and Automation, Huazhong University of Science and Technology, Wuhan, China
“Sharing economy” refers to a transformative socio-economic phenomenon where individuals or institution with idle resources transfer the right to use resources for economic compensation. With the widespread adoption of distributed photovoltaic generation and energy storage (ES) device in residential communities, there is a growing interest in establishing a suitable platform for residential users to share their ES capacity with community shared equipment controllers (CSECs). This paper proposes a local ES capacity sharing market, and presents the market trading process, pricing and allocation rules using an iterative uniform-price bidding mechanism Acknowledging the selfish-interest of both RUs and CSECs, we introduce the resource management organization (RMO) as a regulated third-party organization responsible for administering the market. To evaluate the proposed scheme, we conduct case studies based on real-life data from Pecan Street. The numerical experiment results demonstrate the effectiveness and applicability of our approach.
1 Introduction
1.1 Background and motivation
Among individuals and organizations, “sharing economy” refers to a collaborative consumption model where resources, services, or products are shared among participants instead of being them outright, which can increase the utilization of idle resources and optimize resource allocation (Kalathil et al., 2017; Mi and Coffman, 2019). The fundamental concept behind the sharing economy is to optimize resource allocation by increasing the utilization of idle resources in society. Prominent example of sharing economy platforms include Airbnb for room rental, Uber for ridesharing and car rental, and WeWork for office space sharing. These sharing economic behaviors can offer benefits such as cost savings, reduced environmental impact, and enhanced access to goods and services (Palliyaarachchi and Kariyawasam, 2021). Moreover, sharing economy also promotes a sense of community and collaboration among individuals, as it encourages people to connect and share experiences with one another (Rojanakit et al., 2022).
In response to the intensifying environmental challenges, conventional power structures are undergoing a transition towards low-carbon alternatives, characterized by a significant integration of renewable energy sources (Liu et al., 2024). For example, with the development of photovoltaic (PV) technology, PV panels have become increasingly popular for residential applications, often installed on rooftops. However, the integration of a large number of distributed PV systems into the grid pose technical challenges due to the intermittency and volatility of PV generation, impacting the safe operation of the grid (Wang et al., 2020).
Energy storage (ES), particularly battery storage, presents opportunities to address temporary power surpluses and shortages by decoupling energy generation from consumption (Walker and Kwon, 2021). Increasingly, households are incorporating ES devices to optimize renewable energy utilization, and reduce daily electricity costs. Nevertheless, the value of ES is often underestimated due to a narrow focus on price arbitrage between off-peak and on-peak hours (Liu et al., 2019). Within a certain geographical area, combining different forms of renewable energy sources, such as PV, wind power generation and ES, et al., can create a regional integrated energy system. Scholars have conducted research on this topic from multiple perspectives, such as economic dispatch in a distributed fashion (Huang et al., 2019), bilateral integrated demand response (Li et al., 2022), and load forecasting based on data-driven techniques (Zhu et al., 2022).
Given the rapid development of the increasing installation of distributed PV generation and ES device, combined with “sharing economy” concept, it becomes essential to explore effective methods for sharing ES capacity within the community. Existing research on ES capacity sharing, exemplified by (Xiao et al., 2022; Gul et al., 2022; Zhao et al., 2019), centers around the construction of public large-scale ES devices that enable users within a specific area to share. In contrast, This paper focuses on sharing idle ES capacity between residential users (RUs) and community shared equipment controllers (CSECs), aligning with the trend towards smaller capacity and decentralized layout of ES devices. The scheme discussed in this paper distinguishes itself from existing approaches in terms of the considered system model (Barbour et al., 2018), chosen methodology (Chakraborty et al., 2018; Huang et al., 2021), and analysis (Rahbar et al., 2016).
1.2 Literature review
Many studies have focused on optimizing the operation of ES devices. For instance, Ref (Roberts et al., 2019). presented and validated the self-sufficiency of PV generation combined with battery storage in five Australian apartment buildings. Ref (Khani et al., 2016). explored the cooperation between ES and consumers to achieve energy arbitrage in the electricity market. Similar research can be found in Ref. (Zheng et al., 2014). Moreover, Ref (Aazami et al., 2022). demonstrated that coupling distributed energy generation sources like wind power plants couple with ES devices can mitigate the active power volatility of wind turbine. However, these studies primarily focus on the economic value of ES devices or the enhancement of system performance from an independent perspective, without considering shared ES.
Ref (Xiao et al., 2022). proposed an ES sharing framework that considers both storage capacity and power capacity to enhance energy efficiency and reduce electricity costs. Ref (Rahbar et al., 2016). introduced a central controller to coordinate energy trades between users and shared ES, along with an algorithm for continuous iteration. In Ref. (Wang et al., 2018), the concept of a “charging envelop” was introduced to dynamically allocate ES capacity between customers and the distribution network operator. Ref (Chang et al., 2022). proposed a multi-agent resource allocation algorithm to generate distributed strategies for sharing ES resources. While, the aforementioned studies configure shared ES capacity from an optimization or allocation perspective, they neglect the market mechanisms associated with shared ES.
Ref (Zhang et al., 2022). established a P2P market model for shared ES units and proposed a method for service pricing and load dispatching. Ref (He et al., 2011). conducted auctions for the right to utilize ES unit, ensuring non-conflicting usage by actors in different auctions. Ref (Taylor, 2014; Thomas et al., 2020). proposed mechanisms for financial ES rights and physical ES rights to promote the marketization of shared ES. In Ref. (Zaidi et al., 2018), a combinatorial auction mechanism was introduced, and a winner determination solution was proposed for ES capacity sharing.
These studies, among others, analyze ES capacity sharing from various perspectives, including optimal operation (Roberts et al., 2019; Aazami et al., 2022; Sechilariu et al., 2012), ES capacity allocation (Xiao et al., 2022; Wang et al., 2018; Chang et al., 2022), market mechanism (Zhang et al., 2022; Zaidi et al., 2018; Mediwaththe et al., 2019). However, they all assume that all RUs share a public large capacity ES unit, which can be funded by a third party like the social capital (Zhu et al., 2021) or co-funded by users in need (Chakraborty et al., 2018). Implementing a public shared ES unit jointly funded by users poses specific challenges. 1) When new users join or old users leave, how should the investment funds be settled? 2) User demand for ES is random and difficult to predict. How can the construction and maintenance cost be allocated fairly and reasonably? To our knowledge, no research has addressed these aspects. In addition, more and more users are choose to install individual small-capacity ES unit to meet their specific needs. Therefore, considering distributed individual ES units, we can develop new ideas to avoid the challenges mentioned above.
1.3 Contributions and paper organization
In this paper, we present a centralized sharing platform to facilitate individual ES capacity sharing between RUs and CSECs within residential community. We establish a local ES capacity sharing market, with the Resource Management Organization (RMO) acting as market administrator or auctioneer. Considering that market participants are inclined to maximize their own profits by leveraging their private information, we propose a specific market bidding process. In this process, competitive sellers (buyers) can iteratively adjust their bids using market information provided by the RMO until no further changes are made. The RMO determines the market price and ES capacity allocation using the proposed iterative uniform-price bidding mechanism (IUPBM). In the end, we conduct a case study that includes simulations. The results indicate that sharing ES capacity through the proposed mechanism is not only feasible but also beneficial for all market participants as a whole. In comparison to existing literature, this paper offers the following contributions:
1) We develop a model for an auction-based local ES capacity sharing market within residential communitys, which provides financial benefits for all market participants. To address supply and demand uncertainties and ensure information privacy, we design a specific market bidding process, efficient allocation rules, and a uniform pricing mechanism. These elements guarantee the fairness of ES capacity sharing transactions and facilitate the function of price discovery.
2) We establish a capacity sharing framework based on distributed individual ES. Compared to centralized large-scale public ES sharing, the proposed framework does not need to consider difficult issues such as construction cost allocation and operation and maintenance of the ES, which is easier to enforce.
3) We introduce a novel iterative uniform-price bidding mechanism (IUPBM) formulated as a noncooperative game. To efficiently solve this game, we devise the market-based adaptive iterative algorithm (MAIA) to implement the IUPBM and find a stable Nash equilibrium.
The remainder of this paper is organized as follows: In Section 2, we formulate the system model and categorize the market types. Section 3 discusses the limitations of conventional uniform-price auctions and presents our proposed bidding mechanism. Section 4 introduces noncooperative competition among market participants and outlines the solution algorithm. Section 5 presents the case study and analyzes the results. Finally, Section 6 concludes the paper, discussing future work and implications.
2 System model formulation
2.1 Composition of market members
Community shared equipment controllers (CSECs), such as elevators, water pumps, and corridor lights, are significant energy consumers that require a relatively large ES capacity for their operations (Tushar et al., 2014). However, limited space available in public area, along with concerns regarding maintenance, large investment costs, heat generation, and noise issues, restrict the use of ES devices. In this paper, we propose a solution where CSECs can share a fraction of the ES capacity owned by RUs through a third party, such as the RMO, in a local ES capacity sharing market, as shown in Figure 1. Each RU is assumed to have an energy management system (EMS) installed to record relevant energy data and optimize energy consumption. By sharing idle ES capacity, RUs can collectively share the investment cost, mitigate risks, and exploit economies of scale. Additionally, CSECs can benefit from reduced energy purchase costs through the shared ES capacity. This arrangement creates a mutually beneficial solution for both RUs and CSECs.
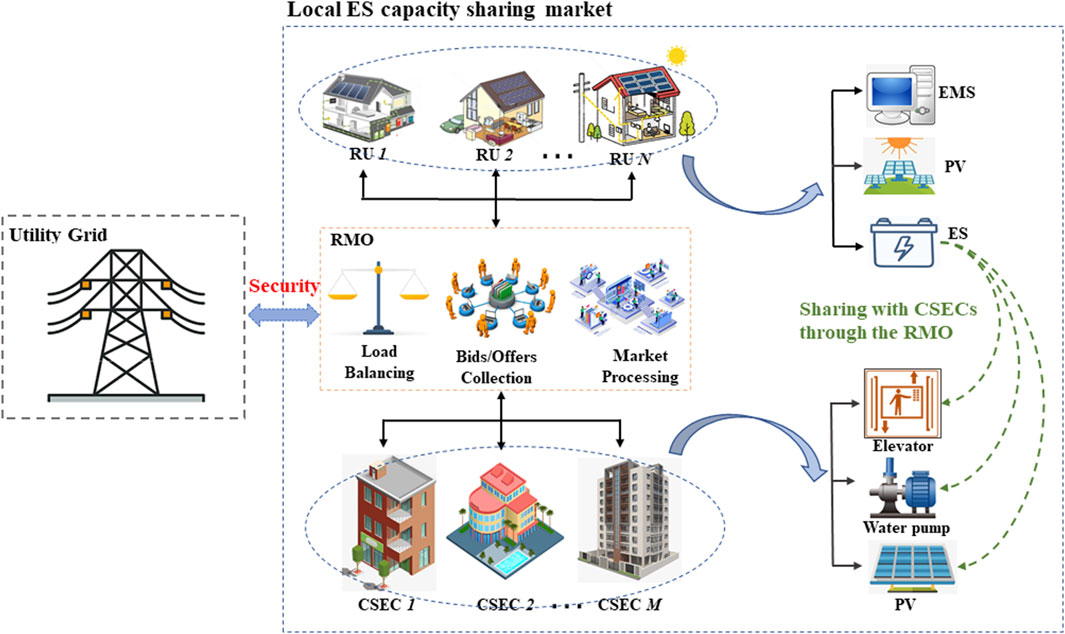
Figure 1. A local ES capacity sharing market.
Each RU in the community is considered as an individual entity with their own ES device. We assume that there are N RUs, where N is cardinality of the set
where γ represents the levelized cost of energy (LCOE) of the ES,
where
In addition, there are M CSECs, where M is the cardinality of the set
The RMO acts as an administrator for the residential community, functioning as an auctioneer. Both CSECs and RUs submit their bids/offers to the RMO. Once all the necessary information is collected, the RMO performs the market clearing process based on specified market rules, as depicted in Figure 2.
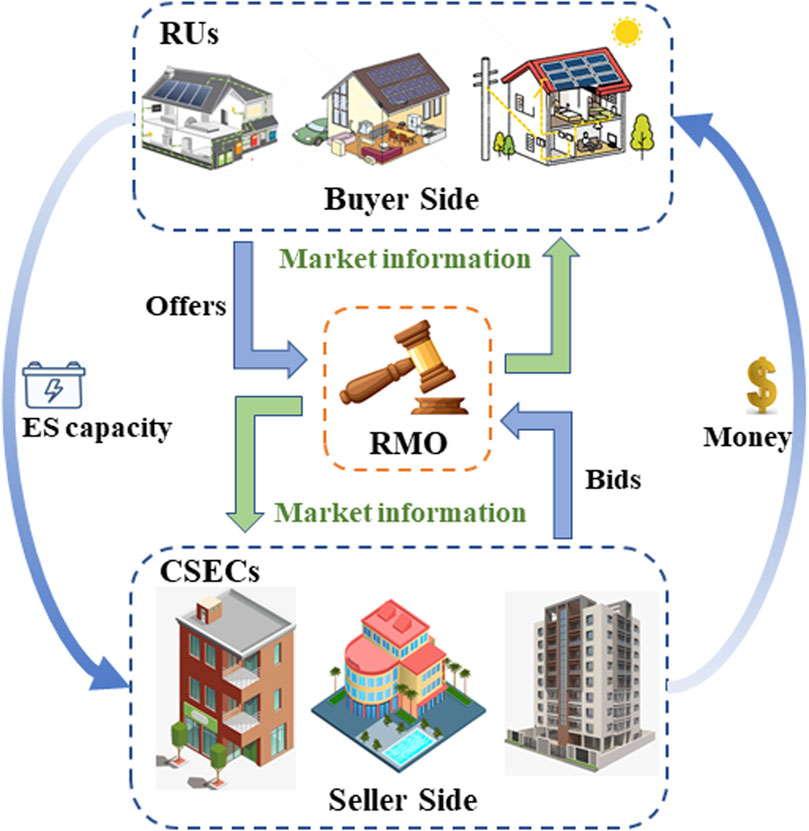
Figure 2. The basic structure of the ES capacity sharing market.
Both RUs and CSECs have PV generation capabilities. The PV generation output for RU i at time slot t can be denoted as
2.2 Market category
In the residential community, the total ES sharing capacity quantity of RUs at time slot t can be represented as
(1) When the total supply exceeds demand
(2) When the total demand is greater than supply
(3) It is rare for the
3 Iterative uniform-price bidding mechanism
3.1 Deficiencies of traditional uniform-price bidding mechanism
Generally, in the uniform-price bidding mechanism (UPBM), bidders typically make only one bid. It is widely acknowledged that the UPBM can achieve social welfare optimality only if RUs provide their true offer information, and the market operates under perfect competition, where market participants act as price-takers and cannot anticipate the impact of their submitted information (Newbery, 1995; Kirschen and Strbac, 2018). However, achieving perfect competition in reality is extremely challenging. As a result, the seller’s side does not experience perfect competition. Moreover, all RUs are selfish and inclined to exploit their private information to maximize their profits. If RUs perceive an opportunity to make additional profit through strategic behavior, they are likely to pursue it without engaging in negotiations. This behavior often involves tactics such as withholding production, providing false offer prices, or a combination of both (Zhao et al., 2010). Each RU believes they have the potential to influence the market price and, therefore, may bid higher than their true offer price to secure extra profit. In other words, the existing UPBM lacks incentive compatibility. To illustrate this, we refer to a simple example of a two-bus network discussed in Ref (Tang and Jain, 2013). that highlights the strategic behavior of the winning seller with the highest offer price.
RU 1, RU2 and demand side are in line 1, RU three and RU4 are in line 2. The transmission capacity between lines one and two is denoted as Q, and the total demand is equals to 2Q. For simplicity, it is assumed that all RUs have constant marginal costs. The cost functions are represented as follows: C1 (x1) = 1.5αx1, C2 (x2) = 2αx2, C3 (x3) = αx3, C4 (x4) = αx4, where α > 0 is a parameter that can vary. If all sellers submit their true cost information, the economic dispatch is determined as
Indeed, in situations where demand is inelastic and competition primarily occurs on the seller’s side, the market price can be artificially influenced and driven higher. This can potentially lead to tacit collusion among the sellers without any direct payment transfers between them. Theoretically, if the RUs engage in cooperative behavior, they can collectively increase their offer prices by the any same amount, represented as p → p + Δ, where Δ > 0. By raising the market price through this behavior, all RUs can benefit from the increased offer price, while maintaining the relative interest structure among themselves.
3.2 Iterative uniform-price bidding mechanism for ES capacity sharing
In this paper, we propose an iterative uniform-price bidding mechanism (IUPBM) for short-term (hour-ahead) ES capacity sharing, aiming to provide economic benefits to both RUs and CSECs.
To ensure the successful and reasonable implementation of the proposed mechanism, we outline several important requirements as follows:
(1) The offers/bids submitted by sellers and buyers, as well as the market price determined by the mechanism, should fall within the range of pmin and pmax. If the market price is lower than pmin, sellers (RUs) are reluctant to share their ES capacities as the limited revenue may be lower than the cost of their ES usage. Conversely, if the market price exceeds pmax, it may be more cost-effective to directly purchase energy from the electricity market.
(2) Sellers (RUs) and buyers (CSECs) are considered self-interested entities seeking to maximize their economic benefits. Each RU has private information about their ES cost function
(3) Since the amount of energy transmitted in the residential community is relatively small, this paper does not account for transmission loss and transmission cost. We assume that energy generated by renewable sources cannot be traded among market participants. This restriction is imposed to prevent potential market manipulation by participants with high PV generation and ES capacity, which could disrupt the market’s daily operation. This assumption aligns with the context of our residential community setting.
(4) Collusion and communication between RUs and CSECs are strictly prohibited in the market. RUs and CSECs submit their offers (bids) to the RMO without any knowledge of the information held by other participants.
The trading process of the IUPBM is depicted in Figure 3 and comprises three main stages: market judgment, market bidding, and market settlement. During the market judgment phase, the RMO assesses whether the market operates in a buyer’s market or a seller’s market based on the supply and demand conditions. Subsequently, the proposed IUPBM is implemented accordingly. In the settlement phase, the physical delivery of ES sharing capacity and the market price are determined based on the market clearing results. The buyer pays the corresponding fee to the RMO, who then compensates the seller accordingly.

Figure 3. The trading process of the proposed IUPBM.
Taking all the aforementioned requirements into consideration, we present a comprehensive outline of the trading process for the proposed IUPBM mechanism within a single cycle:
(1) RUs and CSECs, intending to share or acquire ES capacities submit their respective ES sharing capacities and demand quantities to the RMO.
(2) The RMO calculates the
(3) In the buyer’s market, each RU (indexed as i) reevaluates their offer, which includes the ES sharing capacity qi,t and the offer price vi,t. Armed with the updated offers from RUs, the RMO conducts market clearing and disseminates various market details, such as the market clearing price, the allocated ES sharing capacity for each RU, and partial offer price information (please note that the disclosed offer price information is randomly selected).
(4) After receiving the market information from the RMO, each RU assesses the effectiveness of their respective offers and has the opportunity to modify their current offer accordingly. Following the modifications, the RUs resubmit their revised offers to the RMO.
(5) The RMO performs another round of market clearing based on the revised offers received from RUs and issues the same updated market information to the participants. This iterative process continues until no further modifications are made by any of the RUs. The final market price and allocation of ES capacity are determined at this point.
3.3 Market clearing rule of IUPBM
The market clearing rule in the IUPBM comprises two key components: the ES capacity pricing rule and the allocation rule. The IUPBM ensures the optimal allocation of limited market demand and idle ES capacity resources to the winning participants, considering their willingness-to-share or willingness-to-pay. The mathematical representations of the market clearing process in both market types are presented below:
3.3.1 Buyer’s market
In the buyer’s market, the total ES sharing capacity of RUs exceeds the total demand quantity of CSECs. Assuming that all buyers (CSECs) form a coalition that delegates the purchasing decision to the RMO, the RMO organizes the sellers (RUs) who compete to offer their idle ES capacity. The occurrence of a buyer’s market at time slot t is defined by the condition:
The ES sharing capacity and price submitted by RUs are denoted by
where additional benefit σi,t represents the desired gain that RU i aims to achieve at time slot t, with σi,t ≥ 0. Essentially, σi,t provides each RU with an arbitrage opportunity. RUs would not submit an offer price lower than their costs because doing so would result in a loss if they set the market price, and lowering the offer price would not increase their profit. Hence, this assumption is justified.
The RMO arranges the offers from RUs in ascending order of price, i, e.,
It is evident that
and
The market price is determined by either the last accepted offer or the first rejected offer, depending on whether the submitted ES sharing capacity of the last winner can be fully allocated. Furthermore, the total ES capacity demand quantity is allocated to the RU with the lowest offer price first. If this RU cannot fulfill the demand quantity, the ES sharing capacity of the RU with the second-lowest offer price is utilized, and this process continues until the total ES capacity demand is satisfied.
3.3.2 Seller’s market
In the seller’s market, the total ES capacity demand quantity exceeds the total ES sharing capacity quantity. The RMO acts as a representative for all the sellers participating in the market and organizes the buyers to submit their bids. The seller’s market occurs at time slot t when the following condition is met:
CSECs submit their bids, including the ES capacity demand quantity dj,t and bid price rj,t, denotes as
and
Similarly, the total ES sharing capacity quantity is allocated to the CSEC with the highest bid price. If the sharing capacity still available, the CSEC with the second-highest bid price is employed. This process continues until the total ES sharing capacity is satisfied.
4 Non-cooperative game formulation of market participants
In this paper, RUs/CSECs participating in the market have the same trading idea, which is to maximize their own utilities. To model this scenario, a non-cooperative game-theoretic based market clearing game is introduced.
The utility function of an RU/CSEC as his economic benefits they obtain from ES capacity sharing market. The mathematical definition of the utility function is as follows:
Definition 1. If a buyer’s market is formed at time slot t, then the utility function of RU i is given by:
Otherwise, if it is a seller’s market, the utility function of CSEC j can be expressed as:
where
From (15), the utility function of an RU can be divided into three components. The first component represents the profit obtained from participating in the ES capacity sharing market. The second component capture the price arbitrage gained through the use of ES, and the third component represents the revenue from selling energy to the grid. Similarly, the utility function of a CSEC, as defined in (16), includes the cost savings derived from utilizing shared idle ES capacity owned by RUs, as well as the profit or purchase cost of energy under different circumstances.
The parameter δi signifies the impact of shared ES capacity on RU i. In this paper, we assume that it is randomly selected between 0 and 0.1. The selection of δi is based on two main considerations. Firstly, sharing ES capacity may lead to frequent charging and discharging of the device, which can potentially result in a shorter lifespan (Wu et al., 2020). Secondly, if RU i decides to share qi,t amount of ES capacity, they can only utilize a maximum of
When the RMO announces the market clearing outcome and the offers (bids) from the losers of the current iteration, all participants can observe this information. In the case of the buyer’s market, RUs have the opportunity to increase their utility by adjusting their offers in the current offer profile. If a RU identifies that they can achieve a higher utility by modifying their offer, they unilaterally adjust their offer to the utility-maximizing point in the next iteration. However, if there is no potential for utility improvement through offer adjustment, RUs keep their offers unchanged. This trading strategy can be mathematically described as follows:
and
where
The proposed IUPBM is formulated as a non-cooperative game, where RUs or CSECs act as players in the game. Their strategies in the game involve submitting offers or bids in each iteration. Convergence is a crucial aspect of market operation as it indicates the existence of a Nash Equilibrium. The Nash equilibrium represents a profile of bids or offers that achieve consensus among competitive market participants. In the proposed IMPBM, a Nash equilibrium is defined as follows:
Definition 2. In the buyer’s market, an offer profile
In the seller’s market, a bid profile
Definition two states that in the buyer’s market, an offer profile constitutes a Nash equilibrium when no RU can unilaterally adjusting their offer to increase their utility, considering the unchanged offers of other RUs. Similarly, in the seller’s market, an equilibrium bid profile can be defined. Here, we propose an Market-Based Adaptive Iterative Algorithm (MAIA) that implements the IUPBM and facilitates the attainment of a Nash equilibrium through multiple iterations. The MAIA algorithm is outlined in Algorithm A1 (shown in Appendices).
Next, we prove that the proposed IUPBM returns a unique Nash equilibrium.
Theorem 1. The proposed MAIA algorithm can return a unique Nash equilibrium of the IUPBM.
Proof. To prove this theorem, we need to demonstrate that the offer/bid profile generated by the MAIA algorithm satisfies (19) and (20) for the buyer’s/seller’s market. Without loss of generality, we will prove the conclusion for the buyer’s market, and a similar proof can be conducted for the seller’s market.
In the buyer’s market, let
We will now demonstrate that no RU is willing to unilaterally change their offer in
In conclusion, the MAIA algorithm for the buyer’s market starts with the profile of reservation prices, and in each iteration, every RU simultaneously maximizes their own utility. Therefore, the proposed MAIA algorithm returns a unique Nash equilibrium of the IUPBM.
From Theorem 1, we can deduce that the IUPBM mechanism, as a multiple-player noncooperative game, always has a Nash equilibrium. Moreover, the equilibrium found by the MAIA algorithm is unique. Hence, the proposed algorithm is capable of implementing the IUPBM mechanism.
5 Case study
In this section, we will design numerical experiments to evaluate the practical effectiveness of the proposed method for sharing RUs’ idle ES capacities in a residential community.
5.1 Simulation setting
We choose the publicly available Pecan Street data set from Austin, Texas, United States (Pecan Street), for the reason that this region has a high potential for PV production, and each house has a PV generation system and a smart meter that provides high time granularity data. We select data from 12 out of 25 residential users in 18 May 2018, for the numerical case analysis. Specifically, we use eight groups of data for RUs and four groups for CSECs. The PV generation profiles are shown in Figure 4.
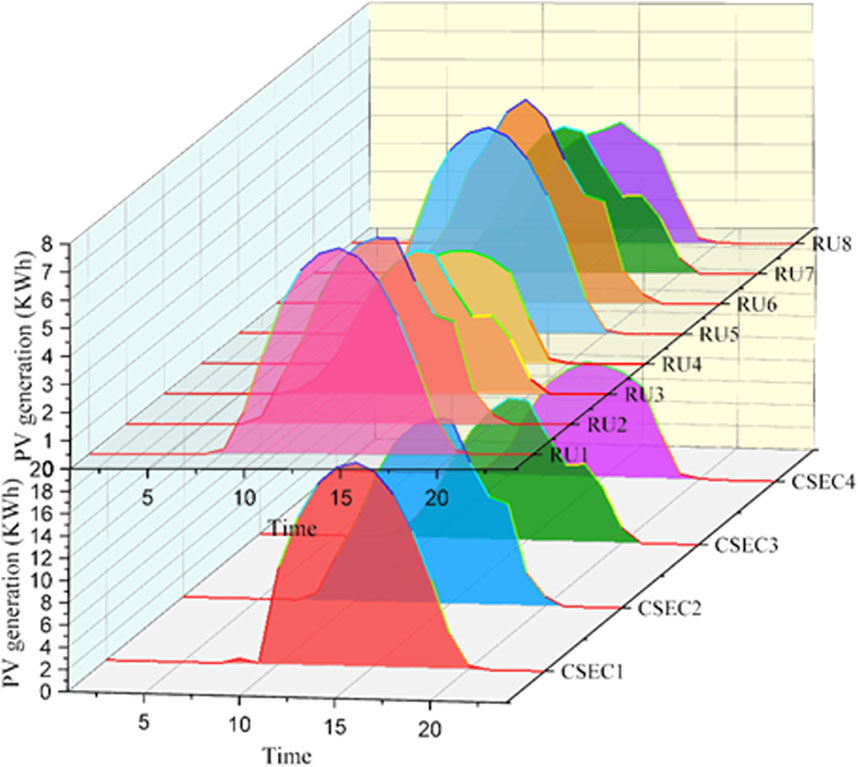
Figure 4. The PV generation of RUs and CSECs.
Given the historical dataset, we assume that RUs are equipped with an ES unit. The installed ES capacity for each RU is randomly determined and listed in Table 1. The maximum charging and discharging rates for ES units are set proportional to the installed capacity as

Table 1. RU’s installed ES capacity.
Unless otherwise specified, the default settings mentioned above will be used for the numerical experiments. We will compare two different trading mechanisms: (i) the IUPBM mechanism in this paper and (ii) the traditional uniform price bidding mechanism (UPBM). The performance measures for the experiments include, but are not limited to: (i) ES capacity sharing price, (ii) utilities of RUs and CSECs, and (iii) RUs’ ES capacity usage. All the numerical experiments will be implemented using MATLAB R2023a with Gurobi Slover.
5.2 Simulation results and analysis
5.2.1 ES capacity sharing with proposed IUPBM
The 1-day ES capacity sharing price and the corresponding spot market electricity price are shown in Figure 5.

Figure 5. ES capacity sharing price with IUPBM and spot market electricity price in 24 h.
From Figure 5, we can observer that the trading period for ES capacity sharing occurs from 9:00 to 18:00, and the ES sharing price ranges from 22.9 ∼ 31.1 cent/KWh. In other periods (1:00–8:00 and 19:00–24:00), there is no ES capacity sharing between RUs and CSECs due to low PV generation output, resulting in a price of 0.
In each trading period, the final price formation requires several iterations. The price convergence process reflects the rationality of the proposed IUPBM mechanism to some extent. Figure 6 shows the ES capacity sharing price formation in time slot 14. We can observe that after approximately 53 iterations, the ES capacity clearing price stabilizes and decreases from 56.8 cent/KWh to 27.64 cent/KWh, representing a drop of 51.34%. Clearly, the ES capacity sharing price can be significantly reduced through iteration. The corresponding utilities changes of RUs and CSECs are shown in Figure 7.
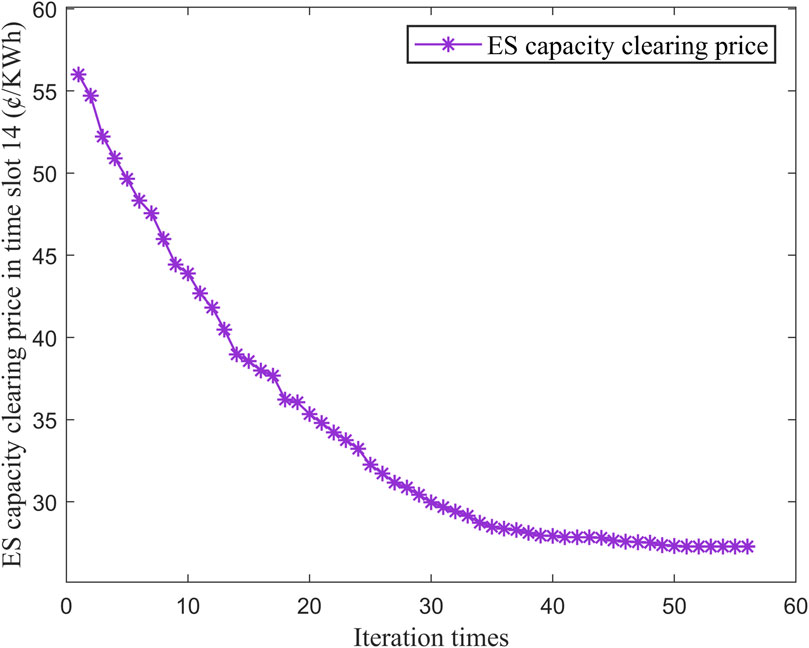
Figure 6. ES capacity clearing price with IUPBM in time slot 14.
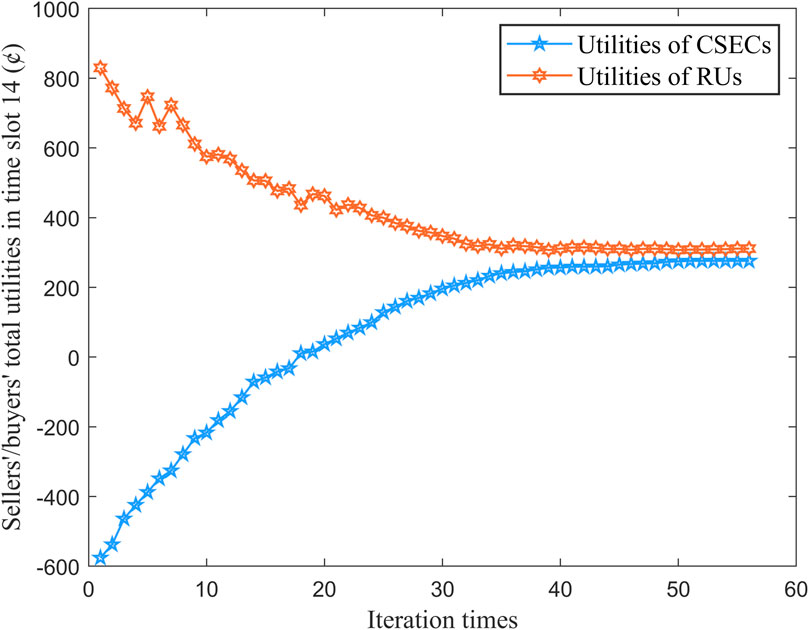
Figure 7. The utilities changes of RUs and CSECs in time slot 14.
From Figure 7, we can see that as the ES capacity clearing price decreases, the utility trend of RUs and CSECs are opposite. The total utilities of RUs decrease from 836.3 cents to 313.7 cents, while the total utilities of CSECs increase from −578.6 cents to 265.3 cents. In cases where there is a conflict of goals between RUs and CSECs, the proposed IUPBM mechanism effectively prevents sellers from pursuing high prices in one-side bidding, thus protecting the interests of buyers.
For CSECs, their load profiles differ. In order to meet their load demand, energy can come their own PV generation, the main grid, or previously stored energy in RU’s ES units, or a combination of these sources. The load balance for CSECs over 24 h is presented in Figure 8.
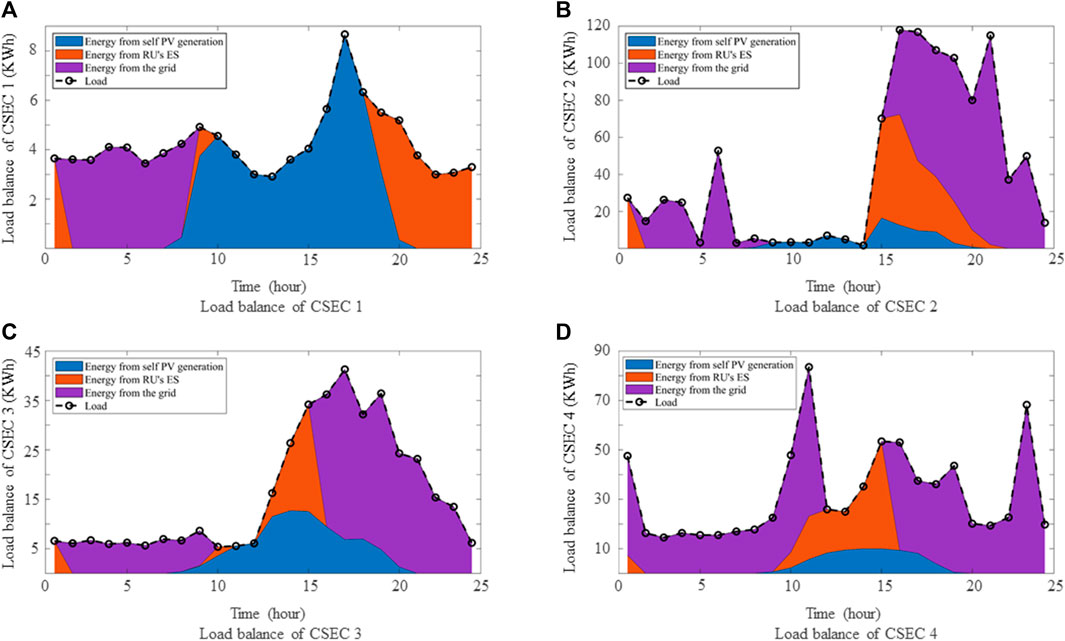
Figure 8. The situation of CSEC’s load balancing in 24 h.
From Figure 8, we can clearly see that the load profiles of the four CSECs are distinct. Among them, CSEC 1 has the lowest overall load, and the load balancing can be roughly divided into three parts: the left part (1:00 8:00), the middle part (9:00 18:00) and the right part (19:00 24:00). During 1:00 8:00, when PV generation is low, the load is mainly met through purchasing energy from the grid. In the middle part, CSEC 1’s PV generation is sufficient to meet its load, and any excess energy is stored in RUs’ ES units for later use. In the evening and night, the stored energy is utilized to balance load. For CSEC 2 and 3, their load peaks occur after 14:00, during peak energy consumption hours, with energy being sourced from PV generation, the main grid, and RU’s ES units.
To highlight the economic advantages of ES capacity sharing, we consider the energy costs for CSECs under two scenarios: with or without ES capacity sharing. This is shown in Figure 9. The blue and orange part represent the sharing case, while the yellow part represents the scenario without ES capacity sharing. We can observe that ES capacity sharing can reduce the energy cost for CSECs to some extent. For CSEC 1, the economic benefits are significant because the proportion of energy from the grid is relatively low, and the load at night is entirely satisfied by previously stored energy. For CSEC 2, 3, and 4, as the load increases, the overall energy cost savings in 24 h reach 17.64%, 30.82%, and 14.57%, respectively.
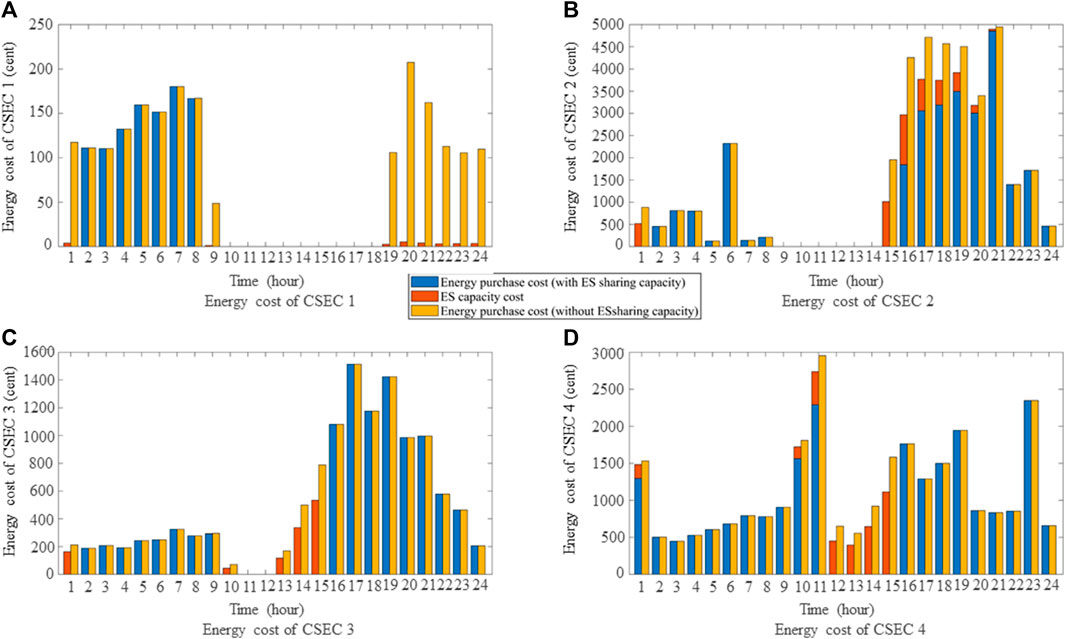
Figure 9. Energy costs of CSECs under different situations (with or without ES sharing capacity).
Figure 10 illustrates the usage of ES capacity by different RU. The blue part represents their own consumption, while the orange part represents sharing. From the figure, we can observe that each RU shares a portion of their ES capacity based on their individual situation. RU 1, 4, 7, eight share a relatively large proportion of their ES capacity since their installed ES capacity exceeds 40 KWh. Throughout the day, only RU 4’s ES unit reaches close to its upper limit at time slot 15. This indicates that there is ample sharing space in the ES capacity market, and the system can function normally even with increased demand. The charging and discharging capacity of RUs’ ES units are listed in Figure 11.
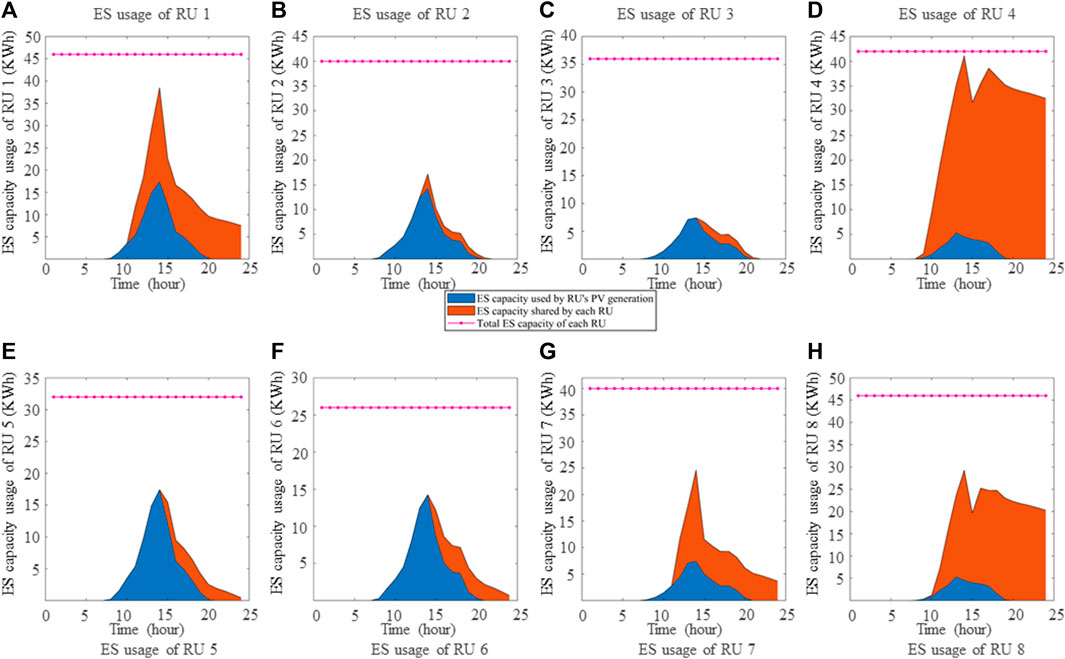
Figure 10. The situation of different RU’s ES capacity usage in 24 h.
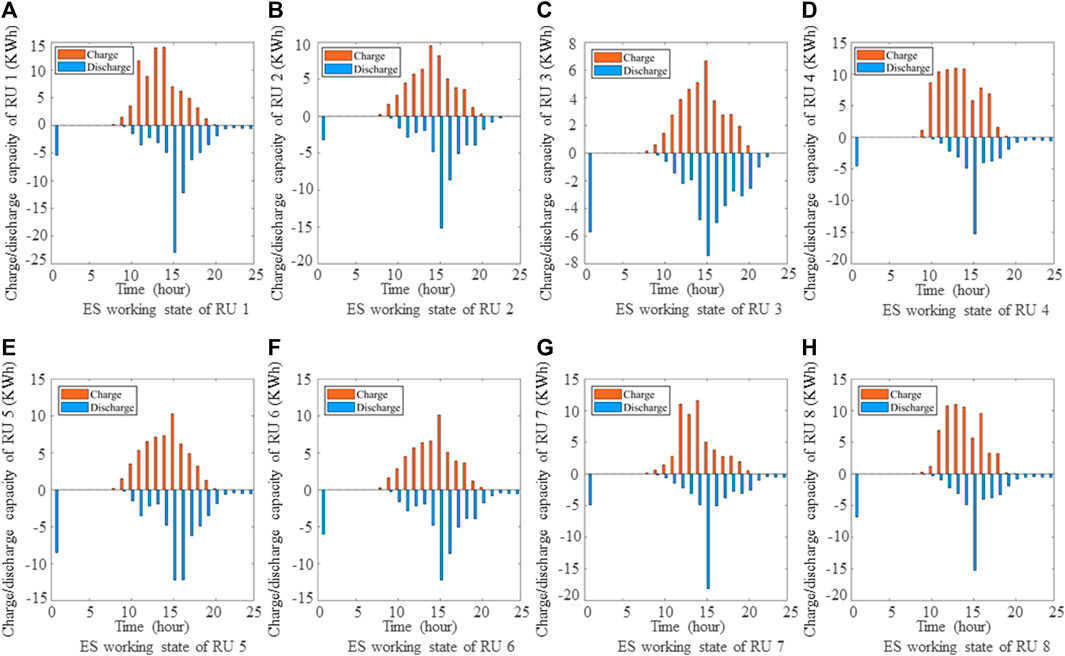
Figure 11. The situation of RU’s ES charge/discharge capacity in 24 h.
5.2.2 ES capacity sharing with UPBM
In this subsection, we analyze the ES capacity sharing market using the traditional uniform price bidding mechanism (UPBM), and compare it with the proposed IUPBM mechanism. The ES capacity sharing price with UPBM are shown in Figure 12.
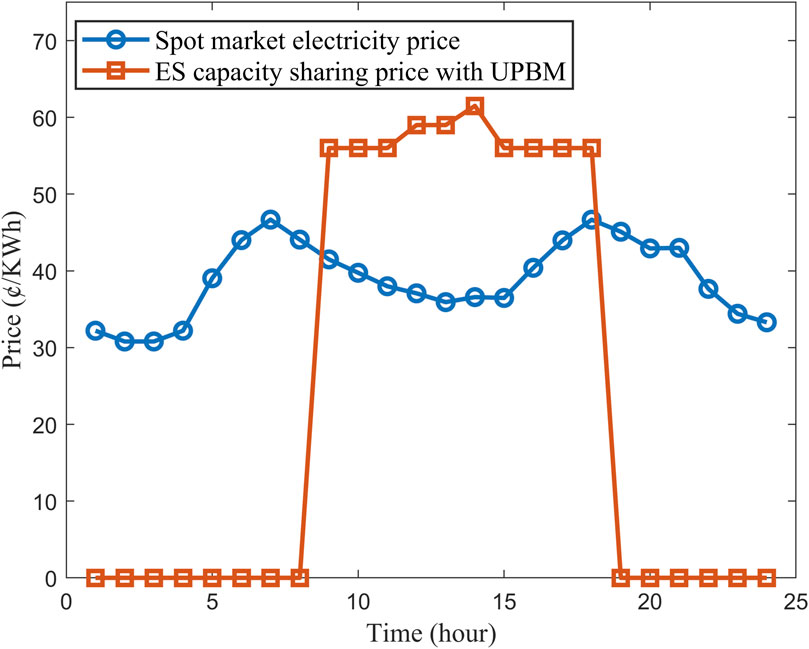
Figure 12. ES capacity sharing price with UPBM and spot market electricity price in 24 h.
Compared Figure 12 with Figure 5, we can clearly see that the ES capacity sharing price are much higher when RUs only bid once using UPBM. During the trading period from 9:00–18:00, all the sharing prices are higher than the spot market electricity price in the same period. This price is unreasonable because for CSECs, the cost of purchasing energy directly from the spot market is lower than the expense of using RU’s idle ES capacity. The difference in ES capacity sharing price between IUPBM and UPBM is presented in Table 2. We can see that with the implementation of the proposed IUPBM mechanism, the ES capacity sharing price have been significantly reduced, with an average reduction of 56.9%.

Table 2. The difference of ES capacity sharing price with IUPBM and UPBM (cent/KWh).
Based on the traditional UPBM, the situation of RU’s ES capacity usage is depicted in Figure 13. Comparing it with the effect of implementation the proposed IUPBM mechanism in Figure 10, we can observe that the traditional UPBM mechanism leads to the a decrease in the number of winning RUs and an increase in their allocated ES sharing capacity. In other words, the market becomes monopolized by a few RUs (possibly due to their capacity advantage, cost advantage, or other reasons). Uneven distribution of resources and high market prices are not conductive to promoting distributed individual ES capacity sharing in the residential community. Therefore, the proposed IUPBM mechanism in this study ensures the fairness of ES capacity sharing transaction and facilitates price discovery to a certain extent.
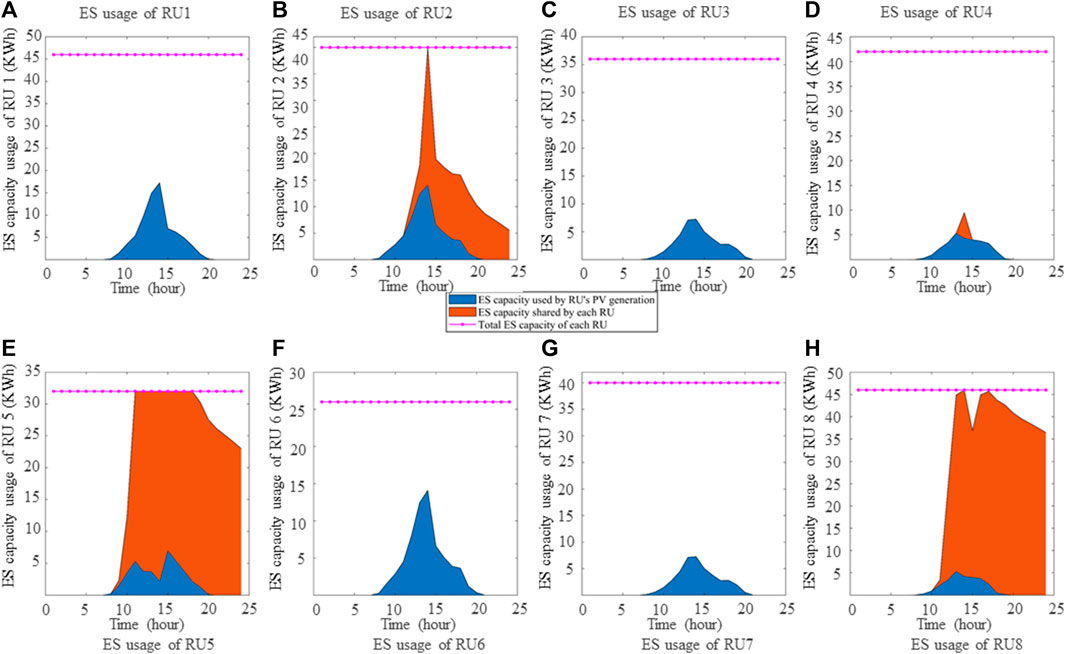
Figure 13. The situation of different RU’s ES capacity usage with the traditional UPBM.
6 Conclusion
This paper has explored the benefits and opportunities of ES capacity sharing among RUs and CSECs in a residential community. An ES capacity sharing market was constructed, and an IUPBM was proposed to improve market efficiency. The market operation process, pricing, and capacity allocation rule were discussed. A case study using real-life data was conducted, and the numerical experiment results have shown that compared to the traditional UPBM mechanism, the IUPBM mechanism proposed in this paper has distributed demand resources more rational and obtained more reasonable market price through iteration. Both buyers and sellers have benefited from participating in the ES capacity sharing market. Furthermore, compared to centralized shared ES scheme, the ES sharing framework established in this paper can better utilize the distributed individual ES capacity within a certain geographical scope, which is more in line with the concept of sharing and has effectively improve the utilization rate of existing ES resources.
Although the current research has made certain progress in promoting the energy sharing economy, there are still some limitations and assumptions. For instance, the model in this paper assumes that participants have complete information and act rationally. The study primarily focuses on a local residential community without considering larger-scale markets. Moreover, the research in this paper mainly concentrates on short-term energy capacity sharing, and the long-term impact on market stability and sustainability has not been deeply explored. For future research, behavioral economic theories could be introduced to simulate and analyze the impact of irrational behavior on the market, while also exploring mechanism design to mitigate issues caused by information asymmetry. Different types and capacities of ES devices could be considered to study how to optimize the integration and coordination of these devices, thereby enhancing the efficiency and reliability of the overall energy system. In addition, long-term simulations and case studies can be conducted to assess the stability and sustainability of the proposed mechanism in long-term operation.
Data availability statement
The original contributions presented in the study are included in the article/supplementary material, further inquiries can be directed to the corresponding author.
Author contributions
KC: Investigation, Writing–original draft. KF: Software, Validation, Writing–review and editing. YZ: Writing–review and editing. MC: Funding acquisition, Resources, Writing–review and editing.
Funding
The author(s) declare that financial support was received for the research, authorship, and/or publication of this article. This work is supported by the National Natural Science Foundation of China under grant number 62222205, 61972170, 61973133, 62373162. The Natural Science Foundation of Hubei Province of China under grant number 2021CFB343. The Natural Science Foundation of Hubei Province of China for Distinguished Young Scholars under grant number 2022CFA052.
Conflict of interest
The authors declare that the research was conducted in the absence of any commercial or financial relationships that could be construed as a potential conflict of interest.
Publisher’s note
All claims expressed in this article are solely those of the authors and do not necessarily represent those of their affiliated organizations, or those of the publisher, the editors and the reviewers. Any product that may be evaluated in this article, or claim that may be made by its manufacturer, is not guaranteed or endorsed by the publisher.
References
Aazami, R., Heydari, O., Tavoosi, J., Shirkhani, M., Mohammadzadeh, A., and Mosavi, A. (2022). Optimal control of an energy-storage system in a microgrid for reducing wind-power fluctuations. Sustainability 14 (10), 6183. doi:10.3390/su14106183
Barbour, E., Parra, D., Awwad, Z., and González, M. C. (2018). Community energy storage: a smart choice for the smart grid? Appl. energy 212, 489–497. doi:10.1016/j.apenergy.2017.12.056
Chakraborty, P., Baeyens, E., Poolla, K., Khargonekar, P. P., and Varaiya, P. (2018). Sharing storage in a smart grid: a coalitional game approach. IEEE Trans. Smart Grid 10 (4), 4379–4390. doi:10.1109/tsg.2018.2858206
Chang, H. C., Ghaddar, B., and Nathwani, J. (2022). Shared community energy storage allocation and optimization. Appl. Energy 318, 119160. doi:10.1016/j.apenergy.2022.119160
Gul, E., Baldinelli, G., Bartocci, P., Bianchi, F., Piergiovanni, D., Cotana, F., et al. (2022). A techno-economic analysis of a solar PV and DC battery storage system for a community energy sharing. Energy 244, 123191. doi:10.1016/j.energy.2022.123191
He, X., Delarue, E., D’haeseleer, W., and Glachant, J. M. (2011). A novel business model for aggregating the values of electricity storage. Energy Policy 39 (3), 1575–1585. doi:10.1016/j.enpol.2010.12.033
Huang, B., Li, Y., Zhan, F., Sun, Q., and Zhang, H. (2021). A distributed robust economic dispatch strategy for integrated energy system considering cyber-attacks. IEEE Trans. Industrial Inf. 18 (2), 880–890. doi:10.1109/tii.2021.3077509
Huang, B., Liu, L., Zhang, H., Li, Y., and Sun, Q. (2019). Distributed optimal economic dispatch for microgrids considering communication delays. IEEE Trans. Syst. Man, Cybern. Syst. 49 (8), 1634–1642. doi:10.1109/tsmc.2019.2900722
Kalathil, D., Wu, C., Poolla, K., and Varaiya, P. (2017). The sharing economy for the electricity storage. IEEE Trans. Smart Grid 10 (1), 556–567. doi:10.1109/tsg.2017.2748519
Khani, H., Varma, R. K., Zadeh, M. R. D., and Hajimiragha, A. H. (2016). A real-time multistep optimization-based model for scheduling of storage-based large-scale electricity consumers in a wholesale market. IEEE Trans. Sustain. Energy 8 (2), 836–845. doi:10.1109/tste.2016.2622003
Li, S., Zhang, L., Nie, L., and Wang, J. (2022). Trading strategy and benefit optimization of load aggregators in integrated energy systems considering integrated demand response: a hierarchical Stackelberg game. Energy 249, 123678. doi:10.1016/j.energy.2022.123678
Liu, Z., Huang, B., Li, Y., Sun, Q., Pedersen, T. B., and Gao, D. W. (2024). Pricing game and blockchain for electricity data trading in low-carbon smart energy systems. IEEE Trans. Industrial Inf. 20 (4), 6446–6456. doi:10.1109/tii.2023.3345450
Liu, Z., Yang, J., Song, W., Xue, N., Li, S., and Fang, M. (2019). Research on cloud energy storage service in residential microgrids. IET Renew. power Gener. 13 (16), 3097–3105. doi:10.1049/iet-rpg.2019.0464
Mediwaththe, C. P., Shaw, M., Halgamuge, S., Smith, D. B., and Scott, P. (2019). An incentive-compatible energy trading framework for neighborhood area networks with shared energy storage. IEEE Trans. Sustain. Energy 11 (1), 467–476. doi:10.1109/tste.2019.2895387
Mi, Z., and Coffman, D. M. (2019). The sharing economy promotes sustainable societies. Nat. Commun. 10 (1), 1214. doi:10.1038/s41467-019-09260-4
Newbery, D. M. (1995). Power markets and market power. energy J. 16 (3), 39–66. doi:10.5547/issn0195-6574-ej-vol16-no3-2
Palliyaarachchi, R., and Kariyawasam, K. (2021) The rise of Uber and Airbnb: the future of consumer protection and the sharing economy. Chatswood, N.S.W.: LexisNexis Butterworths, 1–25.
Pecan Street Pecan Street. Available at: https://https://www.pecanstreet.org/ (Accessed December 25, 2023).
Rahbar, K., Moghadam, M. R. V., Panda, S. K., and Reindl, T. (2016). “Energy management for demand responsive users with shared energy storage system,” in 2016 IEEE international conference on smart grid communications (SmartGridComm) (IEEE), 290–295.
Roberts, M. B., Bruce, A., and MacGill, I. (2019). Impact of shared battery energy storage systems on photovoltaic self-consumption and electricity bills in apartment buildings. Appl. energy 245, 78–95. doi:10.1016/j.apenergy.2019.04.001
Rojanakit, P., de Oliveira, R. T., and Dulleck, U. (2022). The sharing economy: a critical review and research agenda. J. Bus. Res. 139, 1317–1334. doi:10.1016/j.jbusres.2021.10.045
Sechilariu, M., Wang, B., and Locment, F. (2012). Building integrated photovoltaic system with energy storage and smart grid communication. IEEE Trans. Industrial Electron. 60 (4), 1607–1618. doi:10.1109/tie.2012.2222852
Tang, W., and Jain, R. (2013) A Nash equilibrium need not exist in the locational marginal pricing mechanism. arXiv preprint arXiv:1310.4282.
Taylor, J. A. (2014). Financial storage rights. IEEE Trans. Power Syst. 30 (2), 997–1005. doi:10.1109/tpwrs.2014.2339016
Tesla powerwall technical specs (2023). Tesla powerwall technical specs’, Available at: https://www.pecanstreet.org/d-ataport/, Accessed 27 December 2023
Thomas, D., Kazempour, J., Papakonstantinou, A., Pinson, P., Deblecker, O., and Ioakimidis, C. S. (2020). A local market mechanism for physical storage rights. IEEE Trans. Power Syst. 35 (4), 3087–3099. doi:10.1109/tpwrs.2020.2967998
Tushar, W., Chai, B., Yuen, C., Smith, D. B., Wood, K. L., Yang, Z., et al. (2014). Three-party energy management with distributed energy resources in smart grid. IEEE Trans. Industrial Electron. 62 (4), 2487–2498. doi:10.1109/tie.2014.2341556
Walker, A., and Kwon, S. (2021). Analysis on impact of shared energy storage in residential community: individual versus shared energy storage. Appl. Energy 282, 116172. doi:10.1016/j.apenergy.2020.116172
Wang, Z., Ge, L., Ding, J., and Gu, W. (2020). Distributed Newton-based voltage control method for high-penetration PV generation cluster in active distribution networks. IET Renew. Power Gener. 14 (11), 1904–1911. doi:10.1049/iet-rpg.2020.0163
Wang, Z., Gu, C., and Li, F. (2018). Flexible operation of shared energy storage at households to facilitate PV penetration. Renew. energy 116, 438–446. doi:10.1016/j.renene.2017.10.005
Wu, F., Yang, J., Zhan, X., Liao, S., and Xu, J. (2020). The online charging and discharging scheduling potential of electric vehicles considering the uncertain responses of users. IEEE Trans. Power Syst. 36 (3), 1794–1806. doi:10.1109/tpwrs.2020.3029836
Xiao, J. W., Yang, Y. B., Cui, S., and Liu, X. K. (2022). A new energy storage sharing framework with regard to both storage capacity and power capacity. Appl. Energy 307, 118171. doi:10.1016/j.apenergy.2021.118171
Zaidi, B. H., Bhatti, D. M. S., and Ullah, I. (2018). Combinatorial auctions for energy storage sharing amongst the households. J. Energy Storage 19, 291–301. doi:10.1016/j.est.2018.08.010
Zhang, W., Zheng, B., Wei, W., Chen, L., and Mei, S. (2022). Peer-to-peer transactive mechanism for residential shared energy storage. Energy 246, 123204. doi:10.1016/j.energy.2022.123204
Zhao, D., Wang, H., Huang, J., and Lin, X. (2019). Virtual energy storage sharing and capacity allocation. IEEE Trans. smart grid 11 (2), 1112–1123. doi:10.1109/tsg.2019.2932057
Zhao, J., Brereton, B., and Montalvo, M. (2010). Gaming-based reserve constraint penalty factor analysis. IEEE Trans. Power Syst. 26 (2), 616–626. doi:10.1109/tpwrs.2010.2052290
Zheng, M., Meinrenken, C. J., and Lackner, K. S. (2014). Agent-based model for electricity consumption and storage to evaluate economic viability of tariff arbitrage for residential sector demand response. Appl. Energy 126, 297–306. doi:10.1016/j.apenergy.2014.04.022
Zhu, J., Dong, H., Zheng, W., Li, S., Huang, Y., and Xi, L. (2022). Review and prospect of data-driven techniques for load forecasting in integrated energy systems. Appl. Energy 321, 119269. doi:10.1016/j.apenergy.2022.119269
Zhu, J., Xia, Y., Mo, X., Guo, Y., and Chen, J. (2021). A bilevel bidding and clearing model incorporated with a pricing strategy for the trading of energy storage use rights. Energy 235, 121338. doi:10.1016/j.energy.2021.121338
Appendix A
.
1: foreach time
2: Each RU i∈ Ntsubmits his idle ES capacity qi,tto the RMO.
3: Each CSEC j∈ Mtsubmits his demand quantity dj,tto the RMO.
4: if
5: Algorithm for the buyer’s marketterminates (line 11).
6: else if
7: Algorithm for the buyer’s marketterminates (line 28).
8: else
9: Randomly terminating between Algorithm for the seller’s market and buyer’s market.
10: Termination criteria ξ.
11: Algorithm for the buyer’s market
12: Each RU i∈ Ntsubmits their offer price vi,tto the RMO.
13: Initialize γ= 0and
14: do γ= γ+ 1;
15: The allocation rule
16: foreach
17: if
18:
19: else
20: vi,t (γ+ 1) = vi,t(γ)
21: end if
22: end for
23: foreach
24: vi,t (γ+ 1) = ri,t(γ)
25: end for
26: while
27: Output
28: Algorithm for the seller’s market
29: Each CSEC j∈ Mtsubmits his reservation price rj,tto the RMO.
30: Initialize j= 0and
31: do j= j+ 1;
32: The allocation rule
33: foreach
34: if
35:
36: else
37: rj,t (γ+ 1) = rj,t(γ)
38: end if
39: end for
Algorithm 1.The MAIA algorithm for the implement of IUPBM.
40: foreach
41: rj,t (γ+ 1) = rj,t(γ)
42: end for
43: while
44: Output
45: end if
46: end for
Keywords: residential community, decentralized micro-energy storage, energy storage capacity sharing, uniform-price bidding mechanism, non-cooperative game
Citation: Cui K, Fan K, Zhao Y and Chi M (2024) Decentralized micro-energy storage capacity sharing within the residential community: an enhanced uniform price-based bidding framework. Front. Energy Res. 12:1409444. doi: 10.3389/fenrg.2024.1409444
Received: 30 March 2024; Accepted: 26 April 2024;
Published: 28 May 2024.
Edited by:
Chao Deng, Nanjing University of Posts and Telecommunications, ChinaReviewed by:
Bonan Huang, Northeastern University, ChinaChen Liu, RMIT University, Australia
Xiaolong Wu, Nanchang University, China
Copyright © 2024 Cui, Fan, Zhao and Chi. This is an open-access article distributed under the terms of the Creative Commons Attribution License (CC BY). The use, distribution or reproduction in other forums is permitted, provided the original author(s) and the copyright owner(s) are credited and that the original publication in this journal is cited, in accordance with accepted academic practice. No use, distribution or reproduction is permitted which does not comply with these terms.
*Correspondence: Ming Chi, Y2hpbWluZ0BodXN0LmVkdS5jbg==