 Zhigang Sun
 Tianfang Yang1
- 1School of Arts and Science, China University of Petroleum-Beijing at Karamay, Karamay, China
- 2School of Science, China University of Petroleum, Qingdao, China
- 3School of Physics and Astronomy, Shanghai Jiao Tong University, Shanghai, China
In order to estimate the effective storage capacity of carbon dioxide in geological storage, it makes great significance to understand the seepage mechanism of flowing carbon dioxide fluid and its influence on the occurrence state in micropore. In this paper, the molecular simulation method was used to obtain the optimal configuration of kaolinite micropore and carbon dioxide molecules. The molecular dynamics method was used to simulate the flow characteristics of carbon dioxide fluid in kaolinite pores in differential depth of burial under constant pressure drop. The results show that the adsorption capacity of carbon dioxide fluid on the wall of kaolinite decreases with the increase of burial depth, the fluid density in the center of the micropore increases with the increase of burial depth, the diffusion capacity of the fluid changes significantly when the burial depth is greater than 2 km; when a constant differential pressure is applied, the flow of carbon dioxide fluid in the pore conforms to the classical poiseulle flow, the diffusion ability of the fluid increases with the increase of burial depth, nearly doubling, and the slip length also increases with the increase of burial depth; the flow behavior significantly reduces the total amount of carbon dioxide in kaolinite micropore, where the density of the first adsorption layer near the wall decreases by at least 20%, and its effect on fluid is greater than that caused by the increase of burial depth. Therefore, when estimating the effective storage capacity of carbon dioxide in geological storage, the influence of pressure drop and burial depth on the total reduction of geological sequestration should be considered at the same time. The purpose is to provide more detailed theoretical basis for carbon dioxide geological sequestration.
1 Introduction
In recent years, the greenhouse effect caused by the use of fossil fuels and industrial emissions of carbon dioxide has become more and more serious (Pearce et al., 1996; Jiang et al., 2023; Jiang et al., 2022). According to the latest report of EDGAR in 2020, although the global COVID-19 has slowed the growth of global carbon dioxide emissions in 2020, it still shows an upward trend (Crippa et al., 2021). The greenhouse effect caused by carbon dioxide has led to the rise of global sea level and the increase of ocean storms, The resulting climate disasters remain an important and urgent issue to be addressed. To address climate change resulting from carbon dioxide emissions and achieve carbon neutrality, carbon sequestration has become a global consensus. The Chinese government has implemented a series of robust carbon reduction measures, exemplified by the “Four Revolutions and One Collaboration” energy security strategy. The focus is on developing a clean, low-carbon, secure, and efficient energy system (Zhang et al., 2023). The goal is to peak carbon emissions by 2030 and achieve carbon neutrality by 2060. In response to this national initiative, the Karamay government has initiated a series of Carbon Capture, Utilization, and Storage (CCUS) actions. Notably, the Duanhua Petroleum Company’s CCUS project, with a capture and storage capacity of 100,000 tonnes, is currently operational (Zhang, 2021). As illustrated in Figure 1.
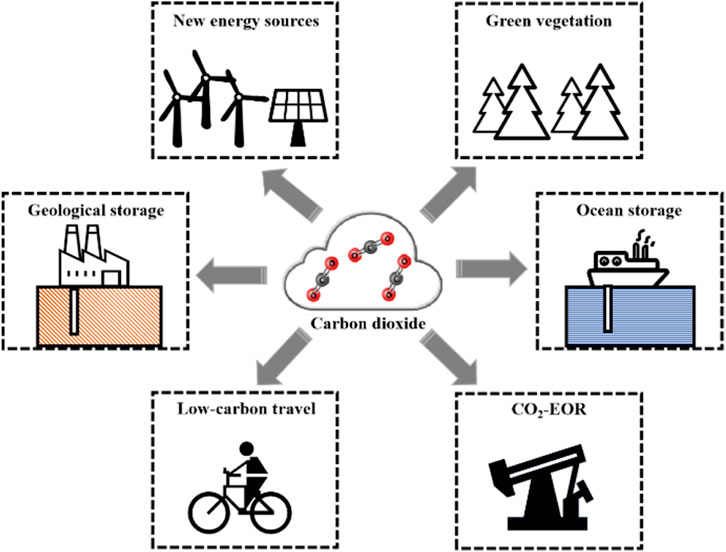
Figure 1. Common main measures to reduce CO2 emissions.
The common main measures to reduce carbon dioxide emissions are as follows: 1) Geological storage of carbon dioxide; 2) Carbon dioxide ocean storage; 3) Replacing traditional fossil fuels with new energy sources (Joelsson and Gustavsson, 2012); 4) Utilizing green vegetation to absorb carbon dioxide; 5) Advocate for low-carbon travel; 6) Carbon dioxide flooding increases the recovery rate of refueling gas. Among the above methods, geological sequestration of carbon dioxide is considered to be the most promising way to solve the problem of carbon dioxide emissions on a large scale. Geological sequestration not only utilizes reservoirs to process large-scale greenhouse gases, but also minimizes the impact on the environment (Tarkowski et al., 2021). Generally, there are four main types of reservoirs for geological carbon dioxide storage: natural oil and gas reservoirs, deep aquifers, clay minerals, and natural gas hydrates (Gwpc-IOGCC, 2017; Metz et al., 2005; Iwai et al., 2012). In these reservoirs, carbon dioxide is predominantly stored in an adsorbed state, ensuring the long-term permanence and safety of carbon dioxide storage. Among the three major types of reservoirs mentioned above, the distribution of subsurface clay minerals is the most extensive globally. To effectively carry out geological carbon dioxide storage tailored to local conditions, a thorough understanding of the flow and occurrence of carbon dioxide in clay minerals, as well as the transport processes, is essential. This knowledge is crucial for the quantitative and qualitative assessment of the potential carbon dioxide storage capacity in different regions.
In recent years, numerous scholars both domestically and internationally have conducted experiments on the adsorption of carbon dioxide by clay minerals. In 2003, Krooss et al., 2003, approaching from the perspective of carbon dioxide diffusion coefficients, established a new experimental apparatus based on the experience of measuring diffusion coefficients for nitrogen and methane. Through experiments, they discovered substantial adsorbed carbon dioxide in shale associated with clay minerals. In 2009, Busch et al., 2009, through experimentation, found that the adsorption behavior of carbon dioxide in shale clay minerals is primarily physical adsorption, and different clay minerals exhibit varying capacities for carbon dioxide adsorption. Due to the considerable specific surface area and well-developed intercrystalline pores of clay minerals, they possess notable potential for carbon dioxide storage. In 2014, Heller et al. (Heller and Zoback, 2014) conducted competitive adsorption experiments of carbon dioxide and methane in different shales, revealing that the adsorption capacity of carbon dioxide on clay minerals is greater than that of methane. Consequently, clay minerals exhibit strong adsorption capabilities for carbon dioxide, ensuring its stability in geological storage and laying the groundwork for future research on carbon dioxide geological storage.
Although experimental studies provide insights into the macroscopic phenomena of carbon dioxide adsorption on clay minerals, elucidating its microscopic flow nature remains challenging. The flow behavior of microscopic particles in nanoscale pores is a complex process. Generally, flow behavior at the macroscopic scale is dominated by interactions between carbon dioxide molecules, neglecting interactions between molecules and pore surfaces. As the pore scale decreases, the interaction between carbon dioxide molecules and pore surfaces gradually strengthens, becoming predominant. This leads to a fundamentally different microscopic flow behavior of carbon dioxide. Considering that clay minerals have a relatively high proportion of nanoscale pores in unconventional reservoirs and are one of the primary carbon dioxide storage zones (Sondergeld et al., 2010; Adesida et al., 2011; Zou et al., 2012; Felipe and Deepak, 2019), optical resolution in experimental methods currently falls short of nanoscale capabilities (Etminan et al., 2014; Sun et al., 2015). Therefore, describing flow characteristics within nanometer-sized pores is challenging. In addition to the experimental approach to research, one can also utilize the simulation approach. Due to the multi-scale nature of the reservoir, the simulation is divided into four length/time-scales: molecular, pore, sedimentary material/bulk phase, and reservoir (Ma and Ranjith, 2019). Common computational fluid methods, such as the Lattice Boltzmann Method (LBM) (Varloteaux et al., 2013; Tian and Wang, 2017; Tian and Wang, 2018), and the Pore Network Model (PNM) (Jing et al., 2020; Gray et al., 2021; Feng et al., 2024), are applicable to the simulation of mesoscopic pores but are unable to compute the microscopic properties of fluids in nanopores. Molecular simulation methods, relying on their advantages in simulating reasonable molecular structures and behaviors based on experimental foundations, are widely applied to study the molecular-level behaviors of clay minerals adsorbing carbon dioxide (Botan et al., 2013; Firouzi et al., 2014; Song et al., 2018; Wang et al., 2018; Li et al., 2019; Liao et al., 2019). In 2016, Sui Hongguang et al. (Hongguang and Yao, 2016), utilizing Grand Canonical Monte Carlo (GCMC) and Molecular Dynamics (MD), respectively established molecular structure models of carbon dioxide and methane in micro/nano pores. They investigated the adsorption behavior of carbon dioxide and methane in montmorillonite clay minerals with different pore widths. In 2018, Chong and Myshakin (2018), employing the GCMC method, studied the competitive adsorption behavior of carbon dioxide and methane on dry illite. In 2019, Zhou et al., 2019, using GCMC and MD methods, respectively investigated the effects of temperature and pressure on the adsorption and diffusion behaviors of carbon dioxide and methane. Molecular simulation methods are not only widely employed for investigating micro-scale adsorption behaviors but are also instrumental in studying the flow dynamics of carbon dioxide within nanoscale pores. The flow behavior of microscopic particles within nanoscale pores is a complex process, where the macroscopic flow dynamics at larger scales are typically dominated by intermolecular interactions between carbon dioxide molecules, often overlooking interactions between molecules and the pore surface. As the pore size diminishes, the interaction between carbon dioxide molecules and the pore surface gradually intensifies, assuming a dominant role, resulting in distinctly different micro-scale flow characteristics of carbon dioxide. In 2016, Kadoura et al. (Kadoura et al., 2016) utilized molecular dynamics (MD) methods to investigate the structural and transport properties of carbon dioxide, methane, and their mixtures in Na-montmorillonite clay under the presence of water at 298.15K. In the same year, Wang et al., 2016 employed non-equilibrium molecular dynamics (NEMD) methods to study the static and pressure-driven characteristics of supercritical carbon dioxide within slit-like organic nanochannels. In 2018, Liu et al., 2018 utilized NEMD methods to separately explore the transport behavior of pressure-driven scCO2 through silicon dioxide nanochannels of different external forces and pore sizes. Despite the proven reliability and high accuracy of molecular simulation methods in studying the micro-scale behavior of carbon dioxide, the majority of research has primarily focused on methane or alkane mixtures, with limited exploration into the micro-scale flow behavior of carbon dioxide within micro/nano pores. Through the in-depth analysis of the aforementioned studies, it is evident that different types of clay mineral pores, varying pore widths, and burial depths are the primary factors influencing the strength of carbon dioxide and pore surface interactions. This paper will explore the microscopic flow behavior of carbon dioxide in geological storage based on these factors.
Based on the aforementioned studies, it is evident that most scholars tend to select montmorillonite or illite as the focus of their research on clay minerals. However, in the Karamay region where the author is located, according to X-ray diffraction and scanning electron microscopy analyses, the predominant clay mineral component in underground reservoirs is worm-like kaolinite, accounting for a high percentage of 52.5% (Zhenlong et al., 2021). Montmorillonite and illite follow in abundance. Kaolinite, being a common clay mineral, has received relatively less attention in previous research. Therefore, this paper selects kaolinite as the simulated research object. It is noteworthy that the existing research primarily focuses on the adsorption behavior of carbon dioxide on the surfaces of clay minerals, examining factors such as temperature, pressure, and moisture content and their effects on carbon dioxide adsorption quantity and adsorption energy. However, there is a limited amount of research dedicated to the flow characteristics of carbon dioxide within clay minerals. Considering the practical application of carbon dioxide geological storage, where pressure differentials are applied to inject carbon dioxide into geological reservoirs, the flow behavior of fluids will impact their existence in micro/nano pores. Thus, employing molecular simulation methods to study the flow and existence characteristics of carbon dioxide in micro/nano pores under a constant pressure drop can provide a more comprehensive description of the transport process of underground carbon dioxide storage. It can also help assess the impact of flow processes on the total carbon dioxide storage and provide theoretical support for convenient implementation of carbon dioxide geological storage globally.
In this study, Materials Studio software was utilized to construct the corresponding kaolinite pore structure model and carbon dioxide molecular configuration (Sharma et al., 2015; Xiong et al., 2017). Subsequently, all relevant force field parameters were introduced, and molecular dynamics methods were employed to simulate the flow and existence characteristics of carbon dioxide within kaolinite pores at different burial depths under varying pressure differentials. The simulation process involved equilibrium molecular dynamics (EMD) to calculate the carbon dioxide fluid’s existence state within kaolinite pores, followed by non-equilibrium molecular dynamics (NEMD) to calculate the flow behavior of carbon dioxide fluid within kaolinite pores induced by pressure drops. This characterization included density distribution, velocity distribution, diffusion coefficients, and slip lengths of the fluid within the pores. The study concludes by comparing and analyzing the influence of flow behavior on the existence state of carbon dioxide within micro/nano pores.
2 Simulation model and methods
2.1 Model construction
The pore model data for kaolinite used in this study were obtained from experiments (Bish and Dreele, 1989). The initial crystal cell belongs to the P1 space group, indicating a monoclinic crystal system. The molecular formula is Al4Si4O108, comprising a total of 34 atoms. The structure is classified as a layer-type mineral with TO-type octahedral layers. There is only one unit layer in the middle, and it does not contain any water ions or sodium ions. The lattice parameters are as follows: a = 0.514 nm, b = 0.893 nm, c = 0.737 nm, α = 91.8°, β = 104.5°, γ = 90.0°. The initial crystal cell used in the simulation is from the kaolinite crystal cell in the Materials Studio software database. After structural optimization, the relative errors between the crystal cell and experimental data are shown in Table 1. All relative errors are less than 0.5%. Therefore, it is evident that the chosen kaolinite pore structure model for simulation is reasonably accurate. The calculation of relative error is shown by Formula 1:
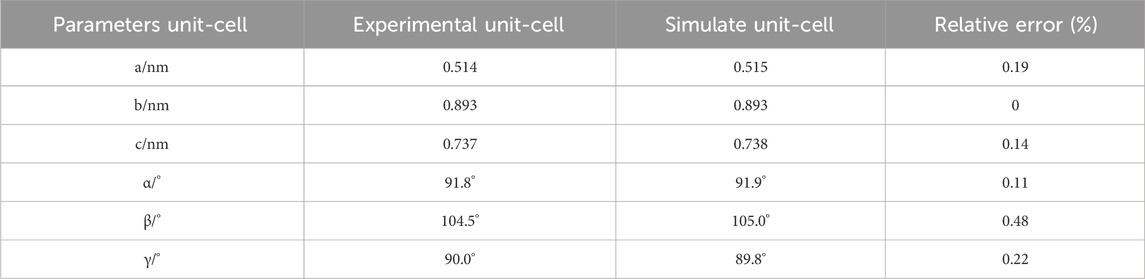
Table 1. The relative errors of kaolinite cell parameters used in simulation and experimental.
Where,
The pore structure of kaolinite used in this study was constructed by expanding and combining crystal cells from the Materials Studio database. There are two types of pore surfaces, one is the (0 0 1) surface with hydrogen atoms at the end of the crystal cell, the other is the (0 0–1) surface without hydrogen atoms. The surface was extended using a supercell to create a surface with dimensions of 5 a × 4 b × 2 c, where the size of the XOY plane is 2.574 nm × 3.574 nm. This expansion aimed to increase the interaction positions between carbon dioxide and the kaolinite pore. Subsequently, layer-like pores were constructed to simulate micro/nano pores, There are three types of configurations for the inner surface of layered narrow pores, hydrogen containing and hydrogen containing surfaces, hydrogen free and hydrogen free surfaces, hydrogen containing and hydrogen free surfaces. In this article, the most common (0 0 1) hydrogen-containing surface is selected as the inner surface of the layered structure of kaolinite (Bin et al., 2018), two kaolinite layers were placed face-to-face parallel to the XOY plane, and different pore widths were achieved by adjusting the thickness of the vacuum layer, as illustrated in Figure 2.
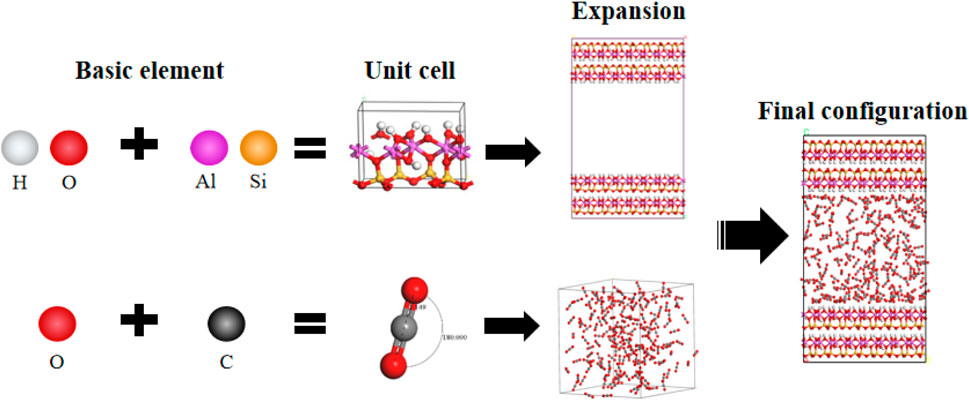
Figure 2. Configuration process for modeling kaolinite pores and carbon dioxide molecules; Red: O; Yellow: Si; Purple: Al; White: H; Gray: C.
The carbon dioxide model used in the simulation adopted the linear EPM2-type CO2 model (Harris and Yung, 1995), widely applied in micro-scale simulations of carbon dioxide adsorption (Liao et al., 2022). The bond length of carbon dioxide is 0.149 nm, and the bond angle is 180°, representing a double-bond structure between carbon and oxygen.
2.2 Potential energy parameters of the model
The kaolinite pore model employs the Clayff force field, which has been demonstrated to be widely applicable for describing the interactions of clay minerals (Cygan et al., 2004; Cygan et al., 2009). The potential energy parameters for carbon dioxide adopt the EPM2 model parameters (Harris and Yung, 1995; Qin et al., 2008). The charges and Lennard-Jones potential energy parameters for kaolinite and carbon dioxide are presented in Table 2. The intra-molecular bond energy, bond angle energy, and dihedral angle energy are all described using harmonic functions. The non-bonded potential energy between molecules is described by the following Formula 2:
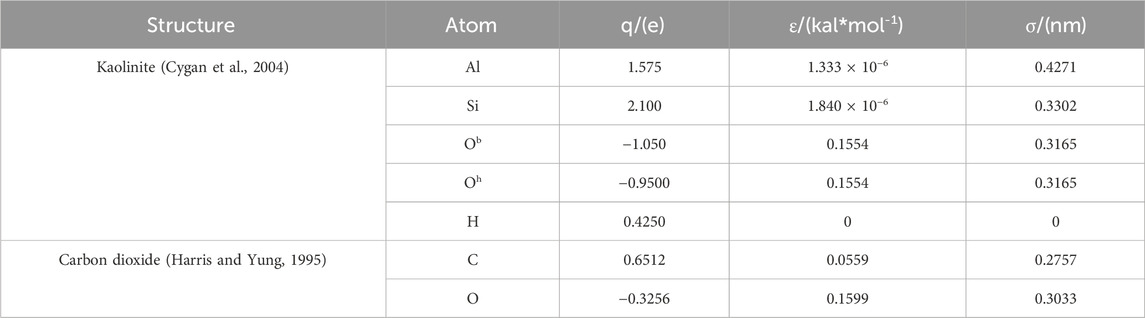
Table 2. The kaolinite and carbon dioxide charges and Lennard-Jones potential parameters.
Where
2.3 Simulation computational methods
All molecular dynamics simulations in this study were conducted using the Large-scale Atomic/Molecular Massively Parallel Simulator (LAMMPS) software (Plimpton, 1995; Zhou et al., 2020; Liao et al., 2021; Meng et al., 2021). The simulations employed three-dimensional periodic boundary conditions, the long-range Coulomb interaction were treated using the PPPM summation (Brown et al., 2012), the calculated relative error is 10–4, utilizing the NVT ensemble, and the temperature control was achieved through the Nosé-Hoover algorithm (Evans et al., 1985). The intermolecular cutoff radius was set to 1.0 nm based on the findings by Liao et al., 2022, indicating that this cutoff radius is sufficient for calculating the non-bonded interactions of carbon dioxide molecules. Throughout the simulation process, the kaolinite pore was kept fixed to maintain stability, treated as a rigid body where the positions of reservoir pores do not update with increasing time steps. Consequently, the shape and size of the pore remain constant during the simulation.
After obtaining models of kaolinite pores with different widths and an ideal carbon dioxide molecule, the microscopic flow behavior of carbon dioxide in the nanoscale pores was constrained using the relevant force field parameters. Initially, carbon dioxide molecules of equal volume density were inserted into the vacuum region of the constructed pore, as illustrated in Figure 2. As the pressure of the carbon dioxide fluid is a function of pore width, the number of molecules, and temperature, varying the temperature results in different pressures for different numbers of carbon dioxide molecules in pores of different widths. Subsequently, a 6 ns equilibrium molecular dynamics (EMD) molecular dynamics simulation was performed on the entire constructed model, with a time step of 1 fs. This process achieves thermodynamic equilibrium of the system and allows carbon dioxide molecules in the micro/nano pores to converge to equilibrium pressure values. The number of inserted carbon dioxide molecules and the corresponding equilibrium pressure values after the system stabilizes are presented in Table 3. The last 1.5 ns of the 6 ns EMD simulation were selected for thermodynamic data collection of the pore fluid. Using the EMD method, the state and distribution characteristics of carbon dioxide within the pore can be obtained.
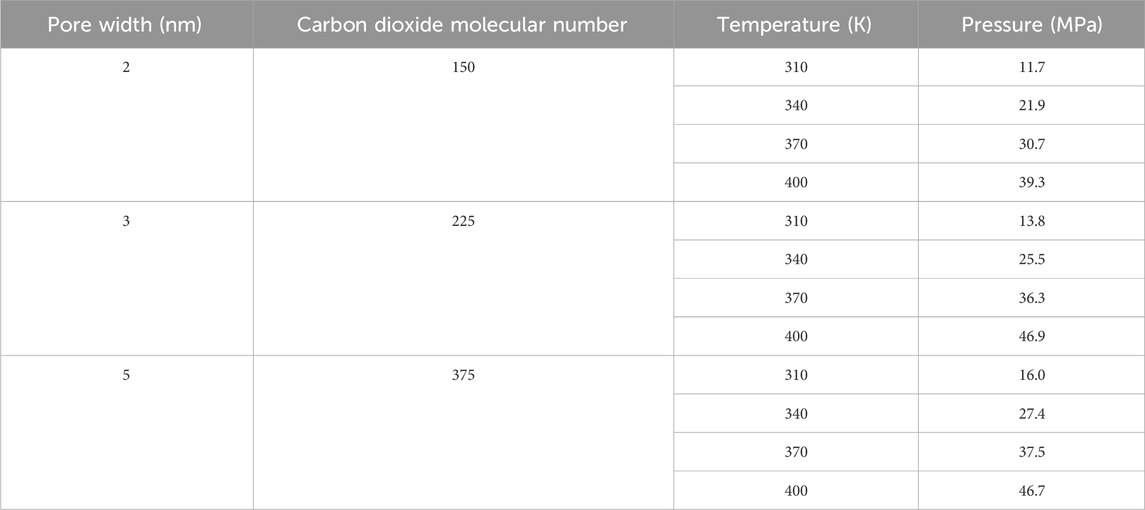
Table 3. The basic parameters for the simulation of the microscopic flow of carbon dioxide molecules.
Upon achieving thermodynamic equilibrium using the EMD method, an acceleration parallel to the XOY surface of the pore was applied to each atom of the carbon dioxide fluid within the pore. To ensure that the molecular velocity overcomes thermal velocity in the specified direction, the simulation time for non-equilibrium molecular dynamics (NEMD) must be significantly longer than that for EMD. Therefore, a total of 12 ns of NEMD molecular dynamics simulation was conducted, with a time step of 1 fs. After the system reached dynamic equilibrium, data were collected every 100 steps, and the last 2 ns of the NEMD simulation were chosen for thermodynamic data collection and subsequent analysis of statistical results and trajectory files.
This study employs non-equilibrium molecular dynamics (NEMD) simulations to investigate the flow behavior of carbon dioxide in kaolinite pores under the application of a pressure gradient. Acceleration is applied to each atom of the carbon dioxide fluid to simulate the flow of carbon dioxide within the kaolinite pores induced by the pressure difference (Abbasi and Karimian, 2016). The acceleration applied by all carbon dioxide molecules in the simulation is 0.02 nm/ps2, which means the pressure difference is 42.7 MPa, The relationship between acceleration (a) and pressure difference (ΔP) is described by Formula 5:
Here,
Due to the well-developed interlayer pores in clay minerals, the surfaces of these micro/nano pores serve as the primary locations for fluid adsorption. According to the International Union of Pure and Applied Chemistry (IUPAC) definition (Sing et al., 1985), micro/nano pores are generally classified into three categories: micropores (less than 2 nm), mesopores (2 nm–50 nm), and macropores (greater than 50 nm). Among these, mesopores are most widely distributed in kaolinite. Therefore, this study focuses on mesoporous pores as the main research subject. Considering that with increasing mesopore width, the influence of the pore wall on the fluid inside the pore gradually weakens, and carbon dioxide within the pores is primarily in the free state, pore widths of 2 nm, 3 nm, and 5 nm are selected as the study objects. Assuming surface temperature is 6.85°C, surface pressure is 0.101 MPa, average geothermal gradient is 25°C/km, and hydrostatic pressure gradient is 0.0098 MPa/m (Zhang et al., 2015), different temperature and pressure conditions corresponding to burial depths of 1200 m, 2,400 m, 3,600 m, and 4,800 m were selected. These depths correspond to temperatures and pressures as follows: 1200 m: 310 K, 11.9 MPa; 2,400 m: 340 K, 23.6 MPa; 3,600 m: 370 K, 35.4 MPa; 4,800 m: 400 K, 47.1 MPa. Comparing the pressure-temperature distribution curve in Figure 3 with the assumed ideal conditions at different burial depths, a strong agreement in basic trends and patterns is observed, indicating the reliability of the simulation results. Therefore, this study aims to investigate the state of carbon dioxide within kaolinite pores and the impact of flow behavior induced by pressure gradients on the carbon dioxide fluid’s state at burial depths ranging from 1,200 m to 4,800 m.
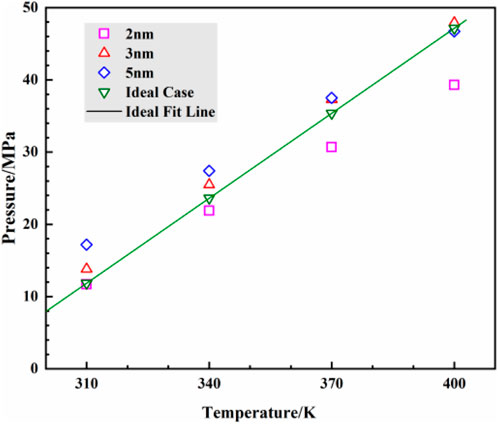
Figure 3. Temperature and pressure of carbon dioxide in the pores of kaolinite at different burial depths from simulation and ideal case.
3 CO2 distribution analysis in kaolinite pores
3.1 Density distribution
This study employs the Equilibrium Molecular Dynamics (EMD) method to investigate the distribution of carbon dioxide (CO2) fluid within pores of 2 nm, 3 nm, and 5 nm diameters. The density distribution at a burial depth of 2.4 km is calculated. Figure 4A illustrates the schematic distribution of CO2 within the pores, while Figure 4B presents a density distribution contour map for a 3 nm pore width. Both axes are in Å, and the color scale is in g/cm3, representing different density distributions within the pores.
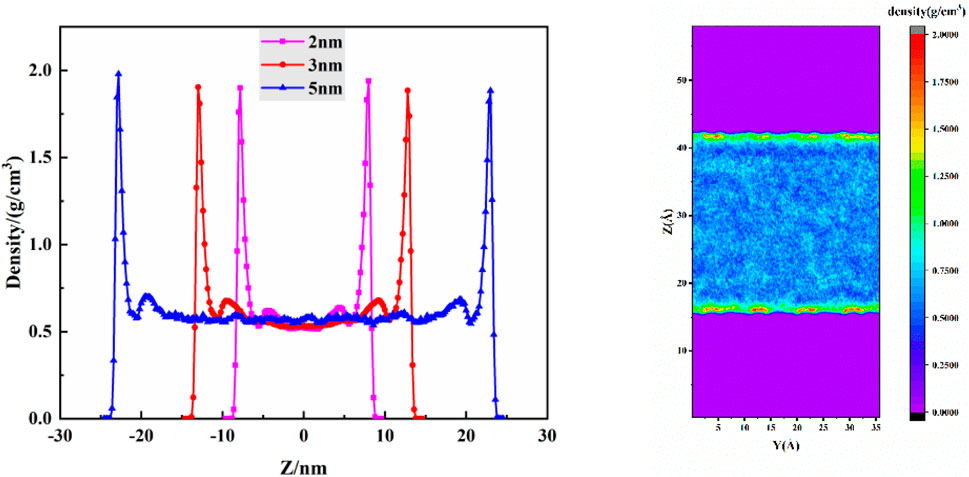
Figure 4. The density distribution when the buried depth is 2.4 km, (A) density distribution of different pore widths, (B) density distribution cloud diagram.
From Figure 3A, it is observed that the density distribution of CO2 is similar for various pore widths. Within the kaolinite pores, a symmetrical distribution is evident, with two distinct adsorption peaks near the surface. This pattern aligns with previous studies by Zhang et al. (Zhang and Jin, 2022) on CO2 adsorption on kaolinite surfaces. The first adsorption peak is attributed to van der Waals forces and hydrogen bonding between CO2 molecules and hydroxyl groups on the kaolinite pore surface. The second peak primarily arises from van der Waals forces between CO2 molecules, as a stable adsorption layer has already formed at the surface. Due to structural reasons, the van der Waals forces between nonpolar CO2 molecules are significantly weaker than those between CO2 and the pore surface, explaining the weaker intensity of the second adsorption peak compared to the first. The central region of the pore exhibits a relatively uniform density distribution, with CO2 molecules mainly in a free state. Comparing the thickness of adsorption layers, the first layer’s thickness remains consistent, while the second layer’s thickness follows the order: 5 nm = 3 nm > 2 nm. This trend is attributed to the increased influence of the pore’s upper and lower surfaces on CO2 molecules as the pore width decreases, making the formation of a saturated second adsorption layer more challenging.
Figure 3B illustrates that near the kaolinite surface, colors are predominantly red, yellow, and green, indicating higher CO2 density compared to the central region. This is due to the weak polarity of CO2 molecules, leading to van der Waals forces with polar hydroxyl groups on the kaolinite surface, and hydrogen bonding between oxygen atoms in CO2 and hydrogen atoms in hydroxyl groups. In contrast, regions farther from the kaolinite surface appear in shades of blue, indicating lower overall CO2 density. This is attributed to the diminishing influence of the kaolinite surface on CO2 as distance increases, allowing more CO2 molecules to diffuse freely in the central region.
To further investigate the density distribution of CO2 at different burial depths, simulations were conducted for varying depths within kaolinite pores. Figure 5 compares the density distribution of CO2 at different depths, revealing a decreasing trend in both adsorption peaks with increasing burial depth. The first adsorption peak experiences a more significant reduction, decreasing from 1.904 g/cm3 to 1.445 g/cm3, decrease of up to 24.1 percent. As burial depth increases, temperature rises, intensifying the thermal motion of CO2 molecules. This results in more CO2 molecules desorbing from the adsorption layer and diffusing towards the central region. The second adsorption layer and free-state CO2 molecules, experiencing weaker confinement, frequently collide with the stable first adsorption layer, leading to a greater reduction in its density. The desorbed CO2 molecules contribute to an increasing density trend in the central fluid of the pore, that’s an increase of almost 9 percent.
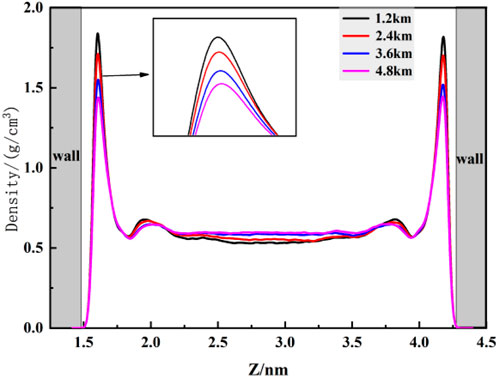
Figure 5. Distribution of CO2 density in different buried depths.
3.2 Diffusion coefficient
To further understand the factors influencing the carbon dioxide (CO2) storage state with varying burial depths, this study employs the strength of fluid diffusion within pores to characterize the impact of burial depth on storage. The diffusion coefficient is a key physical quantity commonly used to describe the diffusivity of substances. Accordingly, the diffusion coefficients of CO2 within kaolinite pores at different burial depths were calculated using Formula 6 (Aljama and Wilcox, 2017):
Here,
From Figure 5, it is observed that with increasing burial depth, the mean square displacement of CO2 gradually increases. Deriving the diffusion coefficients by fitting the curves, Table 4 shows that the diffusion coefficients also increase with burial depth, indicating enhanced diffusion of CO2 within the pore. This implies more vigorous fluid movement, indirectly suggesting that the increased burial depth leads to frequent collisions between fluid molecules, resulting in desorption phenomena in the previously stable adsorption layers at the surface, consistent with the conclusions reflected in Figure 6. Moreover, Table 4 reveals that the most significant increase in diffusion coefficient (16.7%) occurs when the burial depth increases from 1.2 km to 2.4 km, indicating a substantial improvement in CO2 diffusion within the pore when the burial depth exceeds 2.4 km.
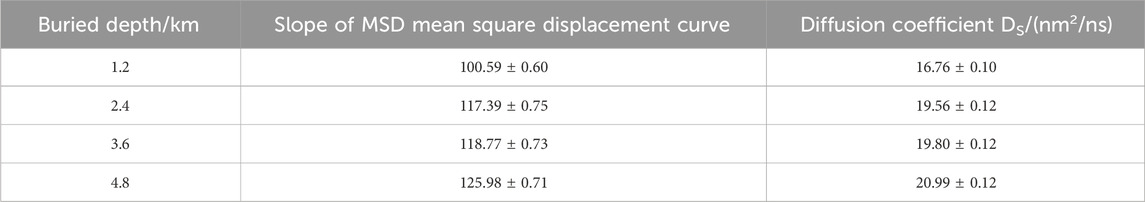
Table 4. The diffusivity of carbon dioxide at different buried depths.
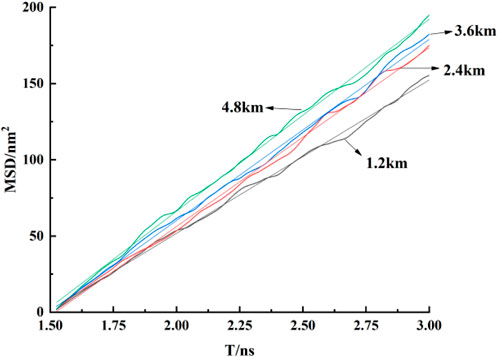
Figure 6. The MSD curves of CO2 fluid at different burial depths.
4 CO2 flow behavior in kaolinite pores
4.1 Density distribution
To investigate the flow behavior of CO2 fluid within pores, non-equilibrium molecular dynamics (NEMD) was employed to simulate the experimental pressure drop conditions by applying a fixed acceleration to the horizontal direction of the carbon atoms in each CO2 molecule. This study explores the influence of different burial depths on the distribution and flow behavior of CO2 fluid within kaolinite pores.
Firstly, the density distribution of CO2 at different burial depths within kaolinite pores under a constant pressure drop was explored. Figure 6 reveals that, as CO2 fluid flows near the surface, stable double adsorption peaks are still formed. With increasing burial depth, the first adsorption peak of CO2 fluid experiences a slight reduction, decreasing from 1.294 g/cm3 to 1.167 g/cm3, while the density of the second adsorption peak and the bulk phase remains largely unchanged. Applying a constant pressure drop intensifies the motion of each CO2 molecule, increasing the fluid velocity within the channel, enhancing molecular collisions, and promoting contact between adsorbed and bulk phase molecules. Although the fluid movement within the pore is relatively active, it is insufficient to disrupt the van der Waals forces within the adsorption layers. Consequently, only a small number of CO2 molecules desorb from the adsorption layers. Figure 7 further indicates that the impact of burial depth on the flowing fluid is minimal, as the adsorption layer density near the surface experiences a slight decrease but stabilizes overall. This suggests that the “effective” storage volume of flowing fluid at different burial depths remains essentially constant, contributing to improved accuracy in estimating the total geological storage capacity of CO2.
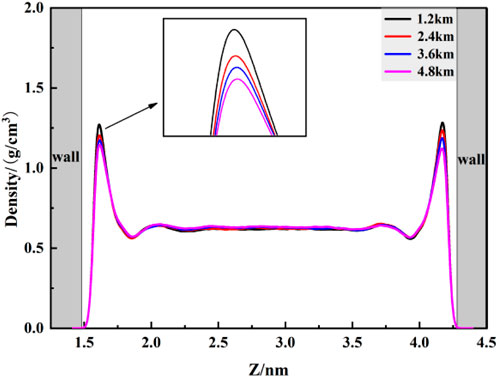
Figure 7. The CO2 density distribution under constant pressure difference.
4.1.1 2Diffusion coefficient
To further study the flow behavior of fluid within pores under a constant pressure drop, the diffusion coefficients of flowing fluid at different burial depths within kaolinite pores were calculated. From the MSD curves in Figure 8, it is observed that the mean square displacement of fluid shows a generally linear correlation with time. Within the initial 1 ns of data collection, minimal differences in mean square displacement are observed at various burial depths. However, as time progresses, significant differences in mean square displacement emerge, and by linearly fitting the curves, Table 5 indicates that the diffusion coefficients of fluid increase with burial depth, this is also similar to the research results of Etesse et al., 1992. By comparing the diffusion coefficients of fluid without a pressure drop, it is evident that the diffusion coefficients of CO2 increase by approximately 111%, 81%, 91%, and 99%, nearly doubling. This is attributed to the intensified overall movement of CO2 fluid under a pressure drop, resulting in a sudden increase in the diffusion coefficient within the pore. This finding validates the conclusion of lower overall density in the adsorbed phase for flowing fluid. According to the Stokes-Einstein law, which establishes an inverse relationship between the diffusion coefficient and viscosity, it can be inferred that with increasing burial depth, the viscosity of CO2 fluid within kaolinite pores decreases.
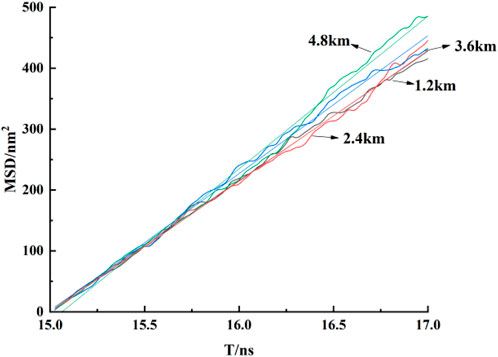
Figure 8. The MSD curves of CO2 diffusion at constant pressure difference.
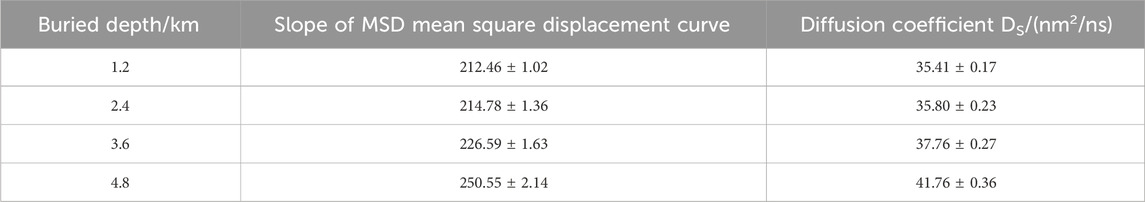
Table 5. The diffusivity of carbon dioxide at constant pressure difference.
4.2 Velocity distribution
To better elucidate the flow behavior of fluid molecules within pores, this section investigates the velocity distribution of carbon dioxide (CO2) molecules at different burial depths after applying a constant pressure drop. As shown in Figure 9, the overall velocity profile exhibits a “parabolic” shape, in accordance with the fundamental principles of classical Poiseuille flow, consistent with findings by Wang et al. (Wang and Farzam, 2016). When CO2 fluid passes the kaolinite surface, the restraining effect exerted by the surface diminishes with increasing distance from the surface. Consequently, the fluid velocity gradually increases, reaching a maximum in the central region of the pore. The fitted curve of the distribution graph exhibits a “parabolic” characteristic. Additionally, the velocity of the fluid near the kaolinite surface is greater than zero, indicating a significant slip phenomenon. Despite the strong van der Waals forces between CO2 and the kaolinite surface, the applied driving acceleration overcomes this binding effect, resulting in fluid slip at the surface. Figure 8 also reveals that with increasing burial depth, the overall fluid velocity increases, showing a subtle upward trend in the velocity curve. At a burial depth of 4.8 km, the maximum velocity is only 9.9% higher than that at a depth of 1.2 km. This suggests that while burial depth promotes fluid velocity, the fluid transport speed primarily depends on the initial pressure drop conditions, consistent with the density distribution patterns observed in Figure 6.
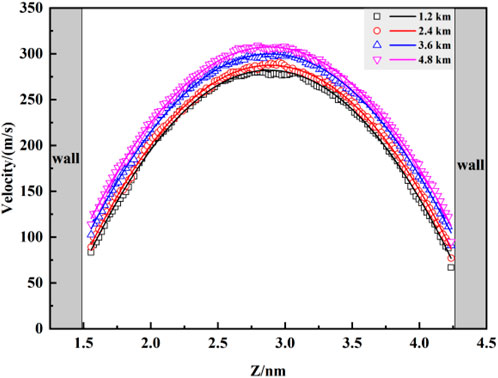
Figure 9. The velocity profile of CO2 at constant differential pressure.
4.3 Velocity distribution
To better elucidate the flow behavior of fluid molecules within pores, this section investigates the velocity distribution of carbon dioxide (CO2) molecules at different burial depths after applying a constant pressure drop. As shown in Figure 8, the overall velocity profile exhibits a “parabolic” shape, in accordance with the fundamental principles of classical Poiseuille flow, consistent with findings by Wang et al. (Wang and Farzam, 2016). When CO2 fluid passes the kaolinite surface, the restraining effect exerted by the surface diminishes with increasing distance from the surface. Consequently, the fluid velocity gradually increases, reaching a maximum in the central region of the pore. The fitted curve of the distribution graph exhibits a “parabolic” characteristic. Additionally, the velocity of the fluid near the kaolinite surface is greater than zero, indicating a significant slip phenomenon. Despite the strong van der Waals forces between CO2 and the kaolinite surface, the applied driving acceleration overcomes this binding effect, resulting in fluid slip at the surface. Figure 8 also reveals that with increasing burial depth, the overall fluid velocity increases, showing a subtle upward trend in the velocity curve. At a burial depth of 4.8 km, the maximum velocity is only 9.9% higher than that at a depth of 1.2 km. This suggests that while burial depth promotes fluid velocity, the fluid transport speed primarily depends on the initial pressure drop conditions, consistent with the density distribution patterns observed in Figure 7.
4.4 Slip length
To accurately describe the slip phenomenon in fluid flow with varying burial depth, this study utilizes the slip length (Ls) to characterize the strength of slip at the wall. Its definition (Liao et al., 2019) is given by Formula 7:
Where,
As shown in Figure 10, after applying a constant pressure drop, slip phenomena occur at the pore walls for all fluid locations, indicating that despite the strong van der Waals forces between CO2 and the kaolinite surface, the applied driving acceleration is sufficient to overcome this binding effect, resulting in slip at the wall. With increasing burial depth, the overall fluid velocity in space increases, and the CO2 velocity near the wall also expands, leading to a noticeable increase in slip length. Especially at burial depths of 3.6 km and 4.8 km, the slip length significantly increases, aligning with the conclusion of higher diffusion coefficients at greater burial depths as presented in Table 5.
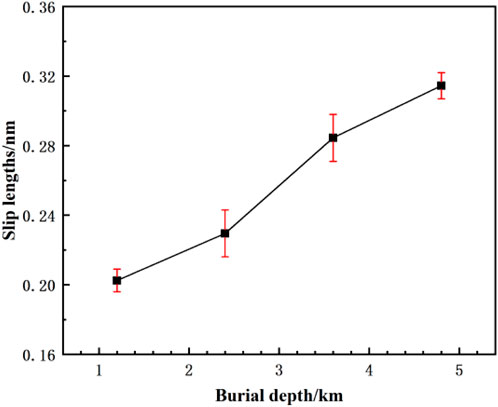
Figure 10. The slip length distribution of CO2 with different buried depths at constant differential pressure.
5 Impact analysis of CO2 flow behavior on storage state
To accurately reconstruct the molecular dynamics processes of subsurface CO2 sequestration and obtain the “effective” storage capacity of micro-nano pores in underground reservoirs, this section explores the impact of CO2 flow behavior on storage state. The storage states of flowing fluid at burial depths of 1.2 km and 4.8 km under pressure drop conditions are compared with those under no pressure drop conditions.
As illustrated in Figure 11, applying pressure drop significantly reduces the density of the first adsorption layer of CO2 near the wall. The density peak at a burial depth of 1.2 km decreases from 1.904 g/cm3 to 1.294 g/cm3, representing a 32% reduction. Similarly, at a burial depth of 4.8 km, the density peak decreases from 1.454 g/cm3 to 1.167 g/cm3, with a nearly 20% reduction. This indicates a substantial reduction in the storage amount of CO2 within kaolinite pores due to flow behavior. By comparing the amplitude reduction of the adsorption layer induced by burial depth with that induced by flow, it is evident that the effect of flow behavior on fluid is greater than the effect caused by increased burial depth, consistent with the density distribution patterns observed in Figure 6. Additionally, Figure 10 shows that after applying pressure drop, an increase in fluid velocity results in more molecules desorbing from the wall, flowing into the central pore region, leading to an increase in bulk density and enhanced fluid mobility. This implies that the driving acceleration directly influences the transport behavior of fluid within the pore. However, it is also observed that the velocity and density near the wall are not zero after applying pressure drop, indicating that residual CO2 molecules in the first adsorption layer undergo surface diffusion along the kaolinite wall. In summary, when estimating the “effective” storage capacity of subsurface CO2 sequestration reservoirs, it is essential to consider the combined effects of pressure drop conditions and burial depth on the total storage of CO2. The selection of the most cost-effective burial path should be determined by integrating different burial depths.

Figure 11. The density-velocity distribution of CO2 at different buried depths.
6 Conclusion
This study, in conjunction with the reservoir characteristics of the Karamay region, establishes a numerical model that conforms to actual geological conditions. Utilizing molecular dynamics simulations, the flow behavior and storage states of CO2 fluid within kaolinite micro-nano pores are investigated, and microscopic phenomena on the clay mineral surface are characterized and analyzed. The following conclusions are drawn from a molecular perspective:
(1) At the same burial depth, the density distribution pattern of carbon dioxide is essentially similar for different pore widths. When the pore width is < 3 nm, the second adsorption layer remains unsaturated. Conversely, when the pore width is ≥ 3 nm, the pore interior forms stable and uniformly thick dual adsorption layers.
(2) The adsorption of CO2 fluid near the kaolinite surface decreases with increasing burial depth, with a reduction of up to 24.1 percent. While the density in the central pore region increases with burial depth, showing an almost 9 percent increase. With significant changes in fluid diffusion capacity when the burial depth exceeds 2.4 km.
(3) Upon the application of a constant pressure difference, the velocity distribution of carbon dioxide molecules within the pores exhibits a classical Poiseuille flow trend at different burial depths. Moreover, with increasing burial depth, the overall fluid velocity increases, and the velocity curve shows a subtle upward trend, and the maximum speed increased by only 9.9 percent.
(4) With increased pressure drop conditions, the diffusion coefficient of CO2 fluid undergoes a substantial increase, nearly doubling. The diffusion capacity of fluid within the pore intensifies with increasing burial depth, and slip phenomena become apparent near the wall. The slip length increases significantly, especially at burial depths of 3.6 km and 4.8 km, consistent with the conclusion of higher diffusion coefficients at greater burial depths presented in Table 5.
(5) Flow behavior induced by pressure drop has a significant impact on the total storage of CO2. The density of the first adsorption layer near the wall decreases by at least 20%.
From the above conclusions, it is evident that the geological storage total estimated by previous static models is significantly affected by transport process factors. Therefore, when estimating the total geological storage capacity of clay mineral sequestration, adjustments must be made to obtain the true “effective” storage capacity. This provides assistance for a more accurate assessment of carbon sequestration potential in various locations.
However, our study still has limitations. The layer slit pores cannot completely replace kaolinite micro-nano pores, and circular pores and irregular pores also account for a high proportion. In addition, there are challenges in applying nanoscale simulation results to kilometer-scale field applications. Therefore, it is worth further researching the influence of irregular pores on the microscale behavior of carbon dioxide and exploring methods to upgrade microscopic-scale results to macroscopic-scale applications in the future.
Data availability statement
The original contributions presented in the study are included in the article, further inquiries can be directed to the corresponding author.
Author contributions
ZS: Conceptualization, Data curation, Investigation, Methodology, Software, Supervision, Writing–original draft, Writing–review and editing, Formal Analysis, Validation, Visualization. TY: Writing–review and editing. WJ: Writing–review and editing.
Funding
The author(s) declare that financial support was received for the research, authorship, and/or publication of this article. The research was funded by Karamay City—Innovative Talents Project, grant number XQZX20220064.
Conflict of interest
The authors declare that the research was conducted in the absence of any commercial or financial relationships that could be construed as a potential conflict of interest.
Publisher’s note
All claims expressed in this article are solely those of the authors and do not necessarily represent those of their affiliated organizations, or those of the publisher, the editors and the reviewers. Any product that may be evaluated in this article, or claim that may be made by its manufacturer, is not guaranteed or endorsed by the publisher.
References
Abbasi, H. R., and Karimian, S. M. H. (2016). Water mass flow rate in a finite SWCNT under electric charge: a molecular dynamic simulation. J. Mol. Liq. 224, 165–170. doi:10.1016/j.molliq.2016.09.083
Adesida, A., Akkutlu, I. Y., Resasco, D. E., et al. (2011). “Characterization of barnett shale kerogen pore size distribution using DFT analysis and Grand canonical Monte Carlo simulations,” in Paper SPE 147397 presented during the SPE Annual Tech Conf. Exhibition held in Denver, Colorado, 30 October-2 November (IEEE).
Aljama, H., and Wilcox, J. (2017). Microscopic diffusion of CO2 in clay nanopores. Chem. Phys. Lett. 677, 162–166. doi:10.1016/j.cplett.2017.04.012
Bin, Z., Kang, J., and Kang, T. (2018). Effect of water on methane adsorption on the kaolinite (0 0 1) surface based on molecular simulations. Appl. Surf. Sci. 439, 792–800. doi:10.1016/j.apsusc.2017.12.239
Bish, D. L., and Dreele, R. B. V. (1989). Rietveld refinement of non-hydrogen atomic positions in kaolinite. Clays Clay Minerals 37 (4), 289–296. doi:10.1346/ccmn.1989.0370401
Botan, A., Vermorel, R., Ulm, F. J., and Pellenq, R. J. M. (2013). Molecular simulations of supercritical fluid permeation through disordered microporous carbons. Langmuir 29 (32), 9985–9990. doi:10.1021/la402087r
Brown, W. M., Kohlmeyer, A., Plimpton, S. J., and Tharrington, A. N. (2012). Implementing molecular dynamics on hybrid high performance computers - particle-particle particle-mesh. Comput. Phys. Commun. 183, 449–459. doi:10.1016/j.cpc.2011.10.012
Busch, A., Alles, S., Krooss, B. M., Stanjek, H., and Dewhurst, D. (2009). Effects of physical sorption and chemical reactions of CO2 in shaly caprocks. Energy Procedia 1 (1), 3229–3235. doi:10.1016/j.egypro.2009.02.107
Chong, L., and Myshakin, E. M. (2018). Molecular simulations of competitive adsorption of carbon dioxide – methane mixture on illitic clay surfaces. Fluid Ph. Equilib. 472, 185–195. doi:10.1016/j.fluid.2018.05.019
Crippa, M., Guizzardi, D., Solazzo, E., Muntean, M., Schaaf, E., Monforti-Ferrario, F., et al. (2021). GHG emissions of all world countries - 2021 Report, EUR 30831 EN. Luxembourg: Publications Office of the European Union. doi:10.2760/173513,JRC126363
Cygan, R. T., Greathouse, J. A., Heinz, H., and Kalinichev, A. G. (2009). Molecular models and simulations of layered materials. J. Mater. Chem. 19, 2470. doi:10.1039/b819076c
Cygan, R. T., Liang, J. J., and Kalinichev, A. G. (2004). Molecular models of hydroxide, oxyhydroxide, and clay phases and the development of a general force field. J. Phys. Chem. B 108 (4), 1255–1266. doi:10.1021/jp0363287
Etesse, P., Zega, J. A., and Kobayashi, R. (1992). High pressure nuclear magnetic resonance measurement of spin–lattice relaxation and self-diffusion in carbon dioxide. J. Chem. Phys. 97 (3), 2022–2029. doi:10.1063/1.463139
Etminan, S. R., Javadpour, F., Maini, B. B., and Chen, Z. (2014). Measurement of gas storage processes in shale and of the molecular diffusion coefficient in kerogen. Int. J. Coal Geol. 123 (Complete), 10–19. doi:10.1016/j.coal.2013.10.007
Evans, D. J., and Holian, B. L. (1985). The Nose-Hoover thermostat. J. Chem. Phys. 83, 4069–4074. doi:10.1063/1.449071
Felipe, P., and Deepak, D. (2019). Spatial distribution of reservoir fluids in mature kerogen using molecular simulations. Fuel 235, 448–459. doi:10.1016/j.fuel.2018.08.024
Feng, Q., Xing, X., Wang, S., Liu, G., Qin, Y., and Zhang, J. (2024). CO2 diffusion in shale oil based on molecular simulation and pore network model. Fuel 359, 130332. doi:10.1016/j.fuel.2023.130332
Firouzi, M., Alnoaimi, K., Kovscek, A., and Wilcox, J. (2014). Klinkenberg effect on predicting and measuring helium permeability in gas shales. Int. J. Coal Geol. 123, 62–68. doi:10.1016/j.coal.2013.09.006
Gray, F., Anabaraonye, B. U., Crawshaw, J. P., and Boek, E. (2021). Pore-scale dissolution mechanisms in calcite-co2-brine systems: the impact of non-linear reaction kinetics and coupled ion transport. Geochimica Cosmochimica Acta 305, 323–338. doi:10.1016/j.gca.2021.04.002
Gwpc-IOGCC (2017). Underground gas storage regulatoryConsiderations: a guide for state and federal regulatory agencies.
Harris, J. G., and Yung, K. H. (1995). Carbon dioxide's liquid-vapor coexistence curve and critical properties as predicted by a simple molecular model. J. Phys. Chem. 99 (31), 12021–12024. doi:10.1021/j100031a034
Heller, R., and Zoback, M. (2014). Adsorption of methane and carbon dioxide on gas shale and pure mineral samples. J. Unconv. Oil Gas Resour. 8, 14–24. doi:10.1016/j.juogr.2014.06.001
Hongguang, S., and Yao, J. (2016). Molecular simulation of CH4/CO2 adsorption inclay minerals. J. Northeast Petroleum Univ. 40 (2), 90–98. doi:10.3969/j.issn.2095-4107.2016.02.012
Iwai, Y., Nakamura, H., and Hirata, M. (2012). Molecular dynamics simulation of replacement of methane hydrate with carbon dioxide. Mol. Simul. 38 (6), 481–490. doi:10.1080/08927022.2011.647817
Jiang, W., et al. (2023). Promoting developments of hydrogen production from renewable energy and hydrogen energy vehicles in China analyzing a public-private partnership cooperation scheme based on evolutionary game theory Energy.
Jiang, W., Zhao, S., and Yang, T. (2022). Economic and technical analysis of power to gas factory taking Karamay as an example. Sustainability 14 (10), 5929. doi:10.3390/su14105929
Jing, Y., Rabbani, A., Armstrong, R. T., Wang, J., and Mostaghimi, P. (2020). A hybrid fracture-micropore network model for multiphysics gas flow in coal. Fuel 281, 118687. doi:10.1016/j.fuel.2020.118687
Joelsson, J., and Gustavsson, L. (2012). Swedish biomass strategies to reduce CO2 emission and oil use in an EU context. Energy 43 (1), 448–468. doi:10.1016/j.energy.2012.03.050
Kadoura, A., Narayanan Nair, A. K., and Sun, S. (2016). Molecular dynamics simulations of carbon dioxide, methane, and their mixture in montmorillonite clay hydrates. J. Phys. Chem. C 120 (23), 12517–12529. doi:10.1021/acs.jpcc.6b02748
Krooss, B. M., Busch, A., Alles, S., et al. (2003). “Experimental investigation of molecular diffusion of CO2 in coals and shales,” in International Conference on Gas-Water-Rock Interactions Induced by Reservoir Exploitation, CO2 Sequestration, and other Geological Storage, China, March 2005 (IEEE).
Li, Z., Yao, J., and Kou, J. (2019). Mixture composition effect on hydrocarbon-water transport in shale organic nanochannels. J. Phys. Chem. Lett. 10, 4291–4296. doi:10.1021/acs.jpclett.9b01576
Liao, Bo, Qiu, Li, Wang, D., Bao, W., Wei, Y., and Wang, Y. (2019). The behaviour of water on the surface of kaolinite with an oscillating electric field. RSC Adv. 9, 21793–21803. doi:10.1039/c9ra04269e
Liao, B., Zhang, Z., Wang, D., Xu, Y., Wei, Y., Bao, W., et al. (2021). External electric field enhances CO2 geological storage: a molecular dynamics simulation. Appl. Surf. Sci. 572, 151312. doi:10.1016/j.apsusc.2021.151312
Liao, Bo, Zhang, Z., Wang, D., Xu, Y., Wei, Y., Bao, W., et al. (2022). External electric field enhances CO2 geological Storage: a molecular dynamics simulation. Appl. Surf. Sci. 572, 151312. doi:10.1016/j.apsusc.2021.151312
Liu, B., Li, X., Qi, C., Mai, T., Zhan, K., Zhao, L., et al. (2018). Pressure-driven supercritical CO 2 transport through a silica nanochannel. RSC Adv. 8 (3), 1461–1468. doi:10.1039/c7ra11746a
Ma, Z., and Ranjith, P. G. (2019). Review of application of molecular dynamics simulations in geological sequestration of carbon dioxide. Fuel 255, 115644. doi:10.1016/j.fuel.2019.115644
Meng, Q., Qu, Y., Liu, W., Pan, Z., Fang, W., Wang, Y., et al. (2021). Mechanical properties of a structure I CO2-CH4 heteroclathrate hydrate: insight from molecular dynamics simulations. Energy and Fuels (20), 35. doi:10.1021/acs.energyfuels.1c02525
Metz, B., Davidson, O., Coninck, H. D., et al. (2005) IPCC special report on carbon dioxide capture and storage. economics and politics of climate change.
Pearce, J. M., Holloway, S., Wacker, H., Nelis, M., Rochelle, C., and Bateman, K. (1996). Natural occurrences as analogues for the geological disposal of carbon dioxide. Energy Convers. Manag. 37 (6/8), 1123–1128. doi:10.1016/0196-8904(95)00309-6
Plimpton, S. (1995). Fast parallel algorithms for short-range molecular dynamics. J. Comput. Phys. 117 (1), 1–19. doi:10.1006/jcph.1995.1039
Qin, Y., Yang, X., Zhu, Y., and Ping, J. (2008). Molecular dynamics simulation of interaction between supercritical CO2 fluid and modified silica surfaces. J. Phys. Chem. C 112 (33), 12815–12824. doi:10.1021/jp711964e
Sharma, A., Namsani, S., and Singh, J. K. (2015). Molecular simulation of shale gas adsorption and diffusion in inorganic nanopores. Mol. Simul. 41, 414–422. doi:10.1080/08927022.2014.968850
Sing, K. S. W., Everett, D. H., Haul, R. A. W., Moscou, L., Pierotti, R. A., Rouquerol, J., et al. (1985). Reporting physisorption data for gas/solid systems with special reference to the determination of surface area and porosity (Recommendations 1984). Pure Appl. Chem. 57 (4), 603–619. doi:10.1351/pac198557040603
Sondergeld, C. H., Newsahm, K. E., Comisky, J. T., Rice, M. C., and Rai, C. S. (2010). “Petropysical considerations in evaluating and producing shale gas reservoirs,” in Paper SPE 131768 presented at the SPE Unconventional Gas Conference, Pittsburgh, Pennsylvania, 23-25 February-2010 (IEEE).
Song, W., Yao, B., Yao, J., Li, Y., Sun, H., Yang, Y., et al. (2018). Methane surface diffusion capacity in carbon-based capillary with application to organic-rich shale gas re-servoir. Chem. Eng. J. 352, 644–654. doi:10.1016/j.cej.2018.07.050
Sun, J., Melnikov, V. A., Khan, J. I., and Mohammed, O. F. (2015). Real-space imaging of carrier dynamics of materials surfaces by second-generation four-dimensional scanning ultrafast electron microscopy. J. Phys. Chem. Lett. 6 (19), 3884–3890. doi:10.1021/acs.jpclett.5b01867
Tarkowski, R., Uliasz-Misiak, B., and Tarkowski, P. (2021). Storage of hydrogen, natural gas, and carbon dioxide – geological and legal conditions. Int. J. Hydrogen Energy 46 (1), 20010–20022. doi:10.1016/j.ijhydene.2021.03.131
Tian, Z., and Wang, J. (2017). Lattice Boltzmann simulation of CO2 reactive transport in network fractured media. Water Resour. Res. 53 (8), 7366–7381. doi:10.1002/2017wr021063
Tian, Z., and Wang, J. (2018). Lattice Boltzmann simulation of dissolution-induced changes in permeability and porosity in 3D CO2 reactive transport. J. hydrology 557, 276–290. doi:10.1016/j.jhydrol.2017.12.037
Varloteaux, C., Békri, S., and Adler, P. M. (2013). Pore network modelling to determine the transport properties in presence of a reactive fluid: from pore to reservoir scale. Adv. Water Resour. 53, 87–100. doi:10.1016/j.advwatres.2012.10.004
Wang, S., and Farzam, J. (2016). Molecular dynamics simulations of oil transport through inorganic nanopores in shale. Fuel 171, 74–86. doi:10.1016/j.fuel.2015.12.071
Wang, S., Javadpour, F., and Feng, Q. (2016). Fast mass transport of oil and supercritical carbon dioxide through organic nanopores in shale. Fuel 181, 741–758. doi:10.1016/j.fuel.2016.05.057
Wang, Y., Liao, B., Kong, Z., Sun, Z., Qiu, L., and Wang, D. (2018). Oscillating electric field effects on adsorption of the methane–water system on kaolinite surface. Energy and Fuels 32, 11440–11451. doi:10.1021/acs.energyfuels.8b02961
Xiong, J., Liu, X., Liang, L., and Zeng, Q. (2017). Adsorption of methane in organic-rich shale nanopores: an experimental and molecular simulation study. Fuel 200 (JUL.15), 299–315. doi:10.1016/j.fuel.2017.03.083
Zhang, H. (2021). Regulations for carbon capture, utilization and storage: comparative analysis of development in Europe, China and the Middle East. Resour. Conservation Recycl. 173, 105722. doi:10.1016/j.resconrec.2021.105722
Zhang, J., Liu, K., Clennell, M. B., Dewhurst, D., and Pervukhina, M. (2015). Molecular simulation of CO2–CH4 competitive adsorption and induced coal swelling. Fuel 160 (nov.15), 309–317. doi:10.1016/j.fuel.2015.07.092
Zhang, M., and Jin, Z. (2022). Molecular simulation on CO2 adsorption in partially water-saturated kaolinite nanopores in relation to carbon geological sequestration. Chem. Eng. J. 450, 138002. doi:10.1016/j.cej.2022.138002
Zhang, Q., Liu, J. F., Gao, Z. H., Chen, S. Y., and Liu, B. Y. (2023). Review on the challenges and strategies in oil and gas industry's transition towards carbon neutrality in China. Petroleum Sci. 20, 3931–3944. doi:10.1016/j.petsci.2023.06.004
Zhenlong, D., Xudong, F., Honghai, B., et al. (2021). Reservoir characteristics of Karamay Formation in Heiyoushan oil sand outcrop area, northwest margin of the Junggar Basin. West-China Explor. Eng. 33 (7), 5. doi:10.3969/j.issn.1004-5716.2021.07.041
Zhou, J., Jin, Z., and Luo, K. (2020). Insights into recovery of multi-component shale gasby CO2 injection: a molecular perspective. Fuel 267. doi:10.1016/j.fuel.2020.117247
Zhou, W., Wang, H., Zhang, Z., Chen, H., and Liu, X. (2019). Molecular simulation of CO2/CH4/H2O competitive adsorption and diffusion in brown coal. RSC Adv. 9 (6), 3004–3011. doi:10.1039/c8ra10243k
Keywords: carbon dioxide, geological storage, molecular simulation, flow, adsorption
Citation: Sun Z, Yang T and Jiang W (2024) Molecular dynamics simulation of carbon dioxide flow in kaolinite pores. Front. Energy Res. 12:1402924. doi: 10.3389/fenrg.2024.1402924
Received: 18 March 2024; Accepted: 24 May 2024;
Published: 17 June 2024.
Edited by:
Marwan Fahs, National School for Water and Environmental Engineering, FranceReviewed by:
Junye Wang, Athabasca University, CanadaArun Kumar Narayanan Nair, King Abdullah University of Science and Technology, Saudi Arabia
Copyright © 2024 Sun, Yang and Jiang. This is an open-access article distributed under the terms of the Creative Commons Attribution License (CC BY). The use, distribution or reproduction in other forums is permitted, provided the original author(s) and the copyright owner(s) are credited and that the original publication in this journal is cited, in accordance with accepted academic practice. No use, distribution or reproduction is permitted which does not comply with these terms.
*Correspondence: Wenyin Jiang, jiangwenyin@sjtu.edu.cn